Zip Codes with the Highest Percentage of Population Employed in Computer & Mathematics in Las Vegas, NV

RELATED REPORTS & OPTIONS

Computer & Mathematics
Population
Families and Households
Female Fertility
Female Fertility (Unmarried)
Race (Community Size)
Race (Percentage)
Ancestry (Community Size)
AfghanAfricanAlaska NativeAlbanianAleutAmericanApacheArabArapahoArgentineanArmenianAssyrian / Chaldean / SyriacAustralianAustrianBangladeshiBarbadianBasqueBelgianBelizeanBhutaneseBlackfeetBolivianBrazilianBritishBritish West IndianBulgarianBurmeseCajunCambodianCanadianCape VerdeanCelticCentral AmericanCentral American IndianCherokeeCheyenneChickasawChileanChineseChippewaChoctawColombianComancheCosta RicanCreeCreekCroatianCubanCzechCzechoslovakianDanishDelawareDominicanDutchDutch West IndianEastern EuropeanEcuadorianEgyptianEnglishEstonianEthiopianEuropeanFijianFilipinoFinnishFrenchFrench American IndianFrench CanadianGermanGerman RussianGhanaianGreekGuamanian / ChamorroGuatemalanGuyaneseHaitianHonduranHopiHungarianIcelanderIndian (Asian)IndonesianInupiatIranianIraqiIrishIroquoisIsraeliItalianJamaicanJapaneseJordanianKenyanKoreanLaotianLatvianLebaneseLiberianLithuanianLuxembourgerMacedonianMalaysianMalteseMenomineeMexicanMexican American IndianMongolianMoroccanNative HawaiianNavajoNew ZealanderNicaraguanNigerianNorthern EuropeanNorwegianOkinawanOsagePaiutePakistaniPalestinianPanamanianParaguayanPennsylvania GermanPeruvianPimaPolishPortuguesePotawatomiPuebloPuerto RicanPuget Sound SalishRomanianRussianSalvadoranSamoanScandinavianScotch-IrishScottishSeminoleSenegaleseSerbianShoshoneSierra LeoneanSiouxSlavicSlovakSloveneSomaliSouth AfricanSouth AmericanSouth American IndianSoviet UnionSpaniardSpanishSpanish AmericanSpanish American IndianSri LankanSubsaharan AfricanSudaneseSwedishSwissSyrianThaiTlingit-HaidaTohono O'OdhamTonganTrinidadian and TobagonianTurkishU.S. Virgin IslanderUgandanUkrainianUruguayanUteVenezuelanVietnameseWelshWest IndianYaquiYugoslavianYumanYup'ikZimbabwean
Ancestry (Percentage)
AfghanAfricanAlaska NativeAlbanianAleutAmericanApacheArabArapahoArgentineanArmenianAssyrian / Chaldean / SyriacAustralianAustrianBangladeshiBarbadianBasqueBelgianBelizeanBhutaneseBlackfeetBolivianBrazilianBritishBritish West IndianBulgarianBurmeseCajunCambodianCanadianCape VerdeanCelticCentral AmericanCentral American IndianCherokeeCheyenneChickasawChileanChineseChippewaChoctawColombianComancheCosta RicanCreeCreekCroatianCubanCzechCzechoslovakianDanishDelawareDominicanDutchDutch West IndianEastern EuropeanEcuadorianEgyptianEnglishEstonianEthiopianEuropeanFijianFilipinoFinnishFrenchFrench American IndianFrench CanadianGermanGerman RussianGhanaianGreekGuamanian / ChamorroGuatemalanGuyaneseHaitianHonduranHopiHungarianIcelanderIndian (Asian)IndonesianInupiatIranianIraqiIrishIroquoisIsraeliItalianJamaicanJapaneseJordanianKenyanKoreanLaotianLatvianLebaneseLiberianLithuanianLuxembourgerMacedonianMalaysianMalteseMenomineeMexicanMexican American IndianMongolianMoroccanNative HawaiianNavajoNew ZealanderNicaraguanNigerianNorthern EuropeanNorwegianOkinawanOsagePaiutePakistaniPalestinianPanamanianParaguayanPennsylvania GermanPeruvianPimaPolishPortuguesePotawatomiPuebloPuerto RicanPuget Sound SalishRomanianRussianSalvadoranSamoanScandinavianScotch-IrishScottishSeminoleSenegaleseSerbianShoshoneSierra LeoneanSiouxSlavicSlovakSloveneSomaliSouth AfricanSouth AmericanSouth American IndianSoviet UnionSpaniardSpanishSpanish AmericanSpanish American IndianSri LankanSubsaharan AfricanSudaneseSwedishSwissSyrianThaiTlingit-HaidaTohono O'OdhamTonganTrinidadian and TobagonianTurkishU.S. Virgin IslanderUgandanUkrainianUruguayanUteVenezuelanVietnameseWelshWest IndianYaquiYugoslavianYumanYup'ikZimbabwean
Immigrant Origin (Total)
AfghanistanAfricaAlbaniaArgentinaArmeniaAsiaAustraliaAustriaBahamasBangladeshBarbadosBelarusBelgiumBelizeBoliviaBosnia and HerzegovinaBrazilBulgariaBurma / MyanmarCambodiaCameroonCanadaCaribbeanCentral AmericaChileChinaColombiaCosta RicaCroatiaCubaCzechoslovakiaDenmarkDominican RepublicEastern AfricaEastern AsiaEastern EuropeEcuadorEgyptEl SalvadorEnglandEritreaEthiopiaEuropeFijiFranceGermanyGhanaGreeceGuatemalaGuyanaHaitiHondurasHong KongHungaryIndiaIndonesiaIranIraqIrelandIsraelItalyJamaicaJapanJordanKazakhstanKenyaKoreaLaosLatin AmericaLatviaLebanonLiberiaLithuaniaMalaysiaMexicoMicronesiaMiddle AfricaMoldovaMoroccoNepalNetherlandsNicaraguaNigeriaNorth MacedoniaNorthern AfricaNorthern EuropeNorwayOceaniaPakistanPanamaPeruPhilippinesPolandPortugalRomaniaRussiaSaudi ArabiaScotlandSenegalSerbiaSierra LeoneSingaporeSomaliaSouth AfricaSouth AmericaSouth Central AsiaSouth Eastern AsiaSouthern EuropeSpainSri LankaSudanSwedenSwitzerlandSyriaTaiwanThailandTrinidad and TobagoTurkeyUgandaUkraineUruguayUzbekistanVenezuelaVietnamWest IndiesWestern AfricaWestern AsiaWestern EuropeYemenZaireZimbabwe
Immigrant Origin (Percentage)
AfghanistanAfricaAlbaniaArgentinaArmeniaAsiaAustraliaAustriaBahamasBangladeshBarbadosBelarusBelgiumBelizeBoliviaBosnia and HerzegovinaBrazilBulgariaBurma / MyanmarCambodiaCameroonCanadaCaribbeanCentral AmericaChileChinaColombiaCosta RicaCroatiaCubaCzechoslovakiaDenmarkDominican RepublicEastern AfricaEastern AsiaEastern EuropeEcuadorEgyptEl SalvadorEnglandEritreaEthiopiaEuropeFijiFranceGermanyGhanaGreeceGuatemalaGuyanaHaitiHondurasHong KongHungaryIndiaIndonesiaIranIraqIrelandIsraelItalyJamaicaJapanJordanKazakhstanKenyaKoreaLaosLatin AmericaLatviaLebanonLiberiaLithuaniaMalaysiaMexicoMicronesiaMiddle AfricaMoldovaMoroccoNepalNetherlandsNicaraguaNigeriaNorth MacedoniaNorthern AfricaNorthern EuropeNorwayOceaniaPakistanPanamaPeruPhilippinesPolandPortugalRomaniaRussiaSaudi ArabiaScotlandSenegalSerbiaSierra LeoneSingaporeSomaliaSouth AfricaSouth AmericaSouth Central AsiaSouth Eastern AsiaSouthern EuropeSpainSri LankaSudanSwedenSwitzerlandSyriaTaiwanThailandTrinidad and TobagoTurkeyUgandaUkraineUruguayUzbekistanVenezuelaVietnamWest IndiesWestern AfricaWestern AsiaWestern EuropeYemenZaireZimbabwe
Income
Income (Families)
Income (Households)
Poverty
Poverty (Families)
Unemployment
Employment Occupations
Employment Industries
Employer Class
Commute Time
Commute Means
School Enrollment
Education by Degree Field
Occupancy
Finances
Physical Characteristics
Las Vegas
Compare Zip Codes
Comparison Subject

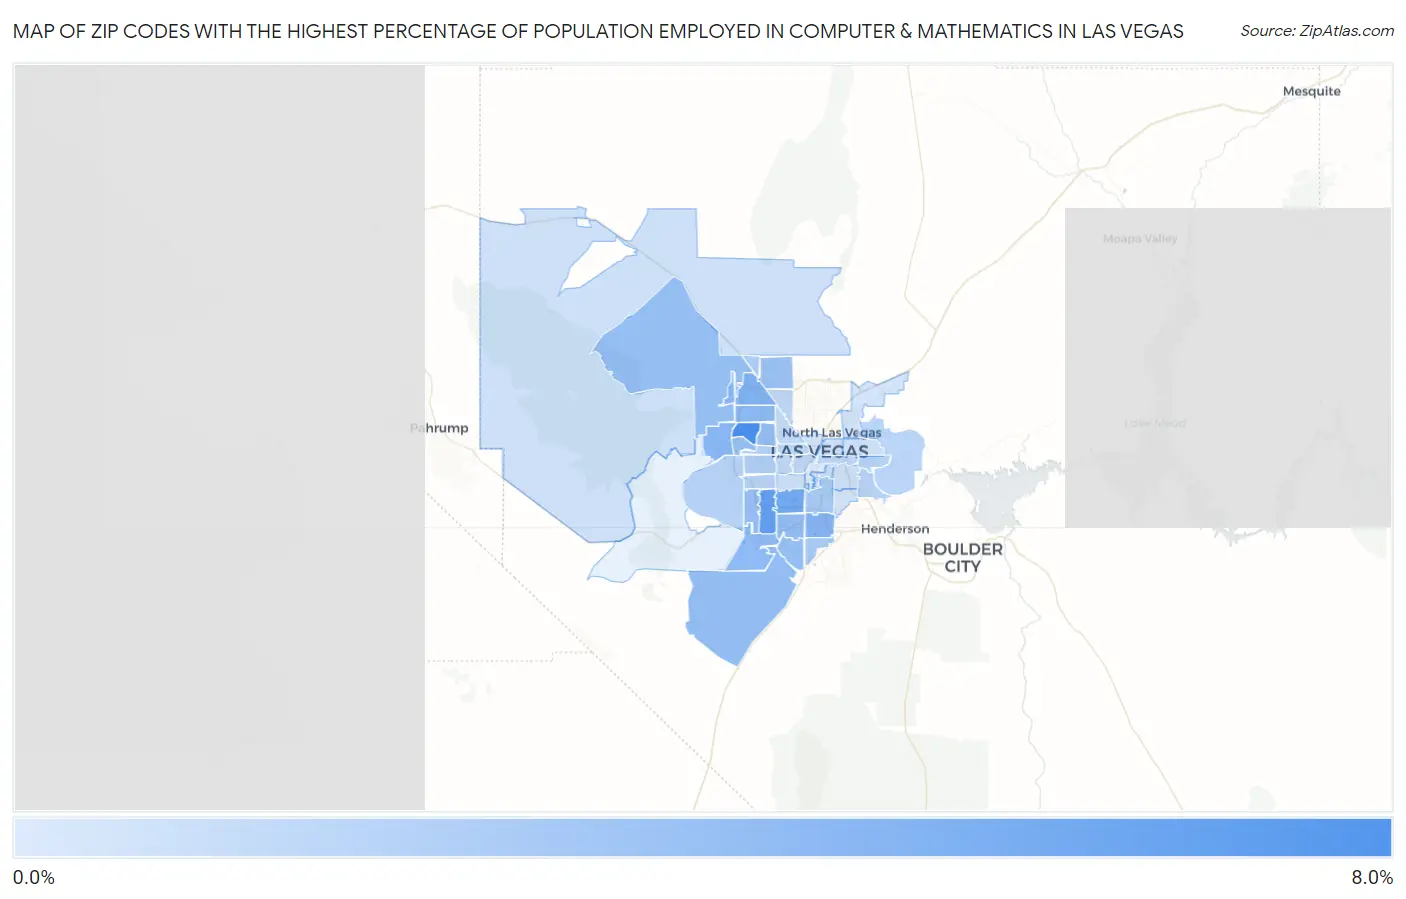
Map of Zip Codes with the Highest Percentage of Population Employed in Computer & Mathematics in Las Vegas

0.0%
8.0%
Zip Codes with the Highest Percentage of Population Employed in Computer & Mathematics in Las Vegas Map

Zip Codes with the Highest Percentage of Population Employed in Computer & Mathematics in Las Vegas, NV

Zip Code % Employed vs State vs National
1.891346.2%2.3%(+3.92)#33.5%(+2.72)#2,116
2.891135.2%2.3%(+2.88)#53.5%(+1.69)#3,112
3.891184.5%2.3%(+2.20)#73.5%(+1.00)#4,042
4.891494.0%2.3%(+1.65)#113.5%(+0.456)#5,089
5.891233.8%2.3%(+1.50)#143.5%(+0.305)#5,405
6.891383.7%2.3%(+1.39)#153.5%(+0.198)#5,664
7.891783.5%2.3%(+1.17)#183.5%(-0.023)#6,203
8.891293.5%2.3%(+1.14)#193.5%(-0.057)#6,290
9.891393.3%2.3%(+0.984)#243.5%(-0.211)#6,736
10.891793.3%2.3%(+0.967)#263.5%(-0.228)#6,793
11.891283.2%2.3%(+0.919)#273.5%(-0.277)#6,948
12.891413.2%2.3%(+0.907)#283.5%(-0.288)#6,989
13.891443.2%2.3%(+0.888)#293.5%(-0.308)#7,048
14.891483.2%2.3%(+0.886)#303.5%(-0.309)#7,051
15.891663.2%2.3%(+0.844)#323.5%(-0.351)#7,182
16.891313.0%2.3%(+0.679)#343.5%(-0.516)#7,713
17.891832.5%2.3%(+0.184)#443.5%(-1.01)#9,591
18.891192.5%2.3%(+0.164)#453.5%(-1.03)#9,671
19.891172.3%2.3%(-0.067)#543.5%(-1.26)#10,637
20.891432.2%2.3%(-0.091)#553.5%(-1.29)#10,726
21.891452.0%2.3%(-0.286)#613.5%(-1.48)#11,594
22.891422.0%2.3%(-0.349)#623.5%(-1.54)#11,893
23.891352.0%2.3%(-0.378)#643.5%(-1.57)#12,031
24.891221.9%2.3%(-0.431)#653.5%(-1.63)#12,309
25.891471.9%2.3%(-0.462)#673.5%(-1.66)#12,448
26.891561.8%2.3%(-0.552)#683.5%(-1.75)#12,851
27.891301.6%2.3%(-0.687)#713.5%(-1.88)#13,562
28.891461.6%2.3%(-0.718)#743.5%(-1.91)#13,744
29.891041.5%2.3%(-0.817)#763.5%(-2.01)#14,291
30.891021.5%2.3%(-0.818)#773.5%(-2.01)#14,305
31.891081.4%2.3%(-0.922)#783.5%(-2.12)#14,902
32.891071.4%2.3%(-0.930)#793.5%(-2.13)#14,960
33.891581.4%2.3%(-0.964)#803.5%(-2.16)#15,150
34.891691.2%2.3%(-1.10)#833.5%(-2.29)#15,936
35.891211.1%2.3%(-1.22)#873.5%(-2.41)#16,668
36.891031.1%2.3%(-1.27)#893.5%(-2.46)#17,000
37.891240.99%2.3%(-1.34)#913.5%(-2.54)#17,466
38.891100.93%2.3%(-1.40)#943.5%(-2.59)#17,820
39.891010.93%2.3%(-1.40)#953.5%(-2.60)#17,856
40.891150.85%2.3%(-1.48)#983.5%(-2.68)#18,365
41.891200.85%2.3%(-1.48)#993.5%(-2.68)#18,367
42.891060.80%2.3%(-1.53)#1013.5%(-2.73)#18,656
43.891090.49%2.3%(-1.84)#1083.5%(-3.04)#20,570

Common Questions

What are the Top 10 Zip Codes with the Highest Percentage of Population Employed in Computer & Mathematics in Las Vegas, NV?
Top 10 Zip Codes with the Highest Percentage of Population Employed in Computer & Mathematics in Las Vegas, NV are:
#1
6.2%
#2
5.2%
#3
4.5%
#4
4.0%
#5
3.8%
#6
3.7%
#7
3.5%
#8
3.5%
#9
3.3%
#10
3.3%
What zip code has the Highest Percentage of Population Employed in Computer & Mathematics in Las Vegas, NV?
89134 has the Highest Percentage of Population Employed in Computer & Mathematics in Las Vegas, NV with 6.2%.
What is the Percentage of Population Employed in Computer & Mathematics in Las Vegas, NV?
Percentage of Population Employed in Computer & Mathematics in Las Vegas is 2.4%.
What is the Percentage of Population Employed in Computer & Mathematics in Nevada?
Percentage of Population Employed in Computer & Mathematics in Nevada is 2.3%.
What is the Percentage of Population Employed in Computer & Mathematics in the United States?
Percentage of Population Employed in Computer & Mathematics in the United States is 3.5%.