Zip Codes with the Highest Percentage of Households with Income Above $200,000 in North Las Vegas, NV

RELATED REPORTS & OPTIONS

Household Income | $200k+
Population
Families and Households
Female Fertility
Female Fertility (Unmarried)
Race (Community Size)
Race (Percentage)
Ancestry (Community Size)
AfghanAfricanAlaska NativeAmericanApacheArabArgentineanArmenianAssyrian / Chaldean / SyriacAustralianAustrianBarbadianBasqueBelgianBelizeanBhutaneseBlackfeetBolivianBrazilianBritishBurmeseCanadianCape VerdeanCentral AmericanCentral American IndianCherokeeChickasawChileanChippewaChoctawColombianCosta RicanCroatianCubanCzechCzechoslovakianDanishDominicanDutchEastern EuropeanEcuadorianEgyptianEnglishEuropeanFilipinoFinnishFrenchFrench CanadianGermanGreekGuamanian / ChamorroGuatemalanHaitianHonduranHungarianIndian (Asian)IrishIroquoisIsraeliItalianJamaicanKenyanKoreanLebaneseLithuanianMalaysianMexicanMexican American IndianNative HawaiianNavajoNicaraguanNigerianNorthern EuropeanNorwegianOsagePaiutePakistaniPanamanianPennsylvania GermanPeruvianPolishPortuguesePuebloPuerto RicanRomanianRussianSalvadoranSamoanScandinavianScotch-IrishScottishSeminoleSerbianSiouxSlavicSlovakSloveneSouth AfricanSouth AmericanSouth American IndianSpaniardSpanishSri LankanSubsaharan AfricanSwedishSwissThaiTonganTrinidadian and TobagonianTurkishUkrainianVenezuelanWelshWest Indian
Ancestry (Percentage)
AfghanAfricanAlaska NativeAmericanApacheArabArgentineanArmenianAssyrian / Chaldean / SyriacAustralianAustrianBarbadianBasqueBelgianBelizeanBhutaneseBlackfeetBolivianBrazilianBritishBurmeseCanadianCape VerdeanCentral AmericanCentral American IndianCherokeeChickasawChileanChippewaChoctawColombianCosta RicanCroatianCubanCzechCzechoslovakianDanishDominicanDutchEastern EuropeanEcuadorianEgyptianEnglishEuropeanFilipinoFinnishFrenchFrench CanadianGermanGreekGuamanian / ChamorroGuatemalanHaitianHonduranHungarianIndian (Asian)IrishIroquoisIsraeliItalianJamaicanKenyanKoreanLebaneseLithuanianMalaysianMexicanMexican American IndianNative HawaiianNavajoNicaraguanNigerianNorthern EuropeanNorwegianOsagePaiutePakistaniPanamanianPennsylvania GermanPeruvianPolishPortuguesePuebloPuerto RicanRomanianRussianSalvadoranSamoanScandinavianScotch-IrishScottishSeminoleSerbianSiouxSlavicSlovakSloveneSouth AfricanSouth AmericanSouth American IndianSpaniardSpanishSri LankanSubsaharan AfricanSwedishSwissThaiTonganTrinidadian and TobagonianTurkishUkrainianVenezuelanWelshWest Indian
Immigrant Origin (Total)
Immigrant Origin (Percentage)
Income
Income (Families)
Income (Households)
Poverty
Poverty (Families)
Unemployment
Employment Occupations
Employment Industries
Employer Class
Commute Time
Commute Means
School Enrollment
Education by Degree Field
Occupancy
Finances
Physical Characteristics
North Las Vegas
Compare Zip Codes
Comparison Subject

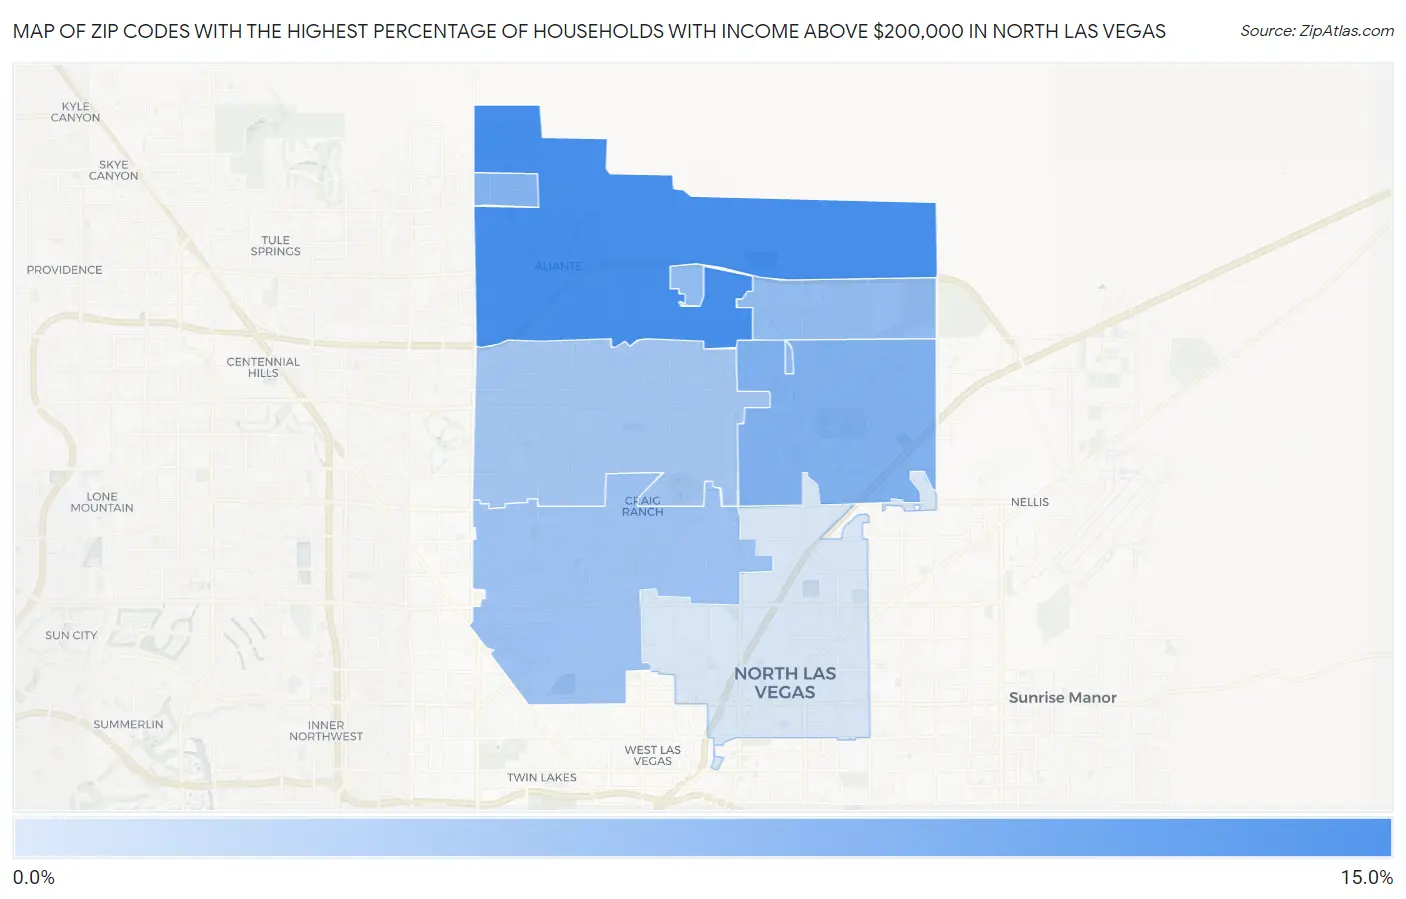
Map of Zip Codes with the Highest Percentage of Households with Income Above $200,000 in North Las Vegas

0.0%
15.0%
Zip Codes with the Highest Percentage of Households with Income Above $200,000 in North Las Vegas Map

Zip Codes with the Highest Percentage of Households with Income Above $200,000 in North Las Vegas, NV

Zip Code Households with Income > $200k vs State vs National
1.8908410.4%8.7%(+1.70)#4511.4%(-1.000)#7,868
2.890816.8%8.7%(-1.90)#7111.4%(-4.60)#12,058
3.890856.5%8.7%(-2.20)#7711.4%(-4.90)#12,619
4.890865.7%8.7%(-3.00)#8611.4%(-5.70)#14,132
5.890325.1%8.7%(-3.60)#9011.4%(-6.30)#15,295
6.890314.8%8.7%(-3.90)#9311.4%(-6.60)#16,023
7.890301.7%8.7%(-7.00)#13211.4%(-9.70)#24,535

Common Questions

What are the Top 5 Zip Codes with the Highest Percentage of Households with Income Above $200,000 in North Las Vegas, NV?
Top 5 Zip Codes with the Highest Percentage of Households with Income Above $200,000 in North Las Vegas, NV are:
#1
10.4%
#2
6.8%
#3
6.5%
#4
5.7%
#5
5.1%
What zip code has the Highest Percentage of Households with Income Above $200,000 in North Las Vegas, NV?
89084 has the Highest Percentage of Households with Income Above $200,000 in North Las Vegas, NV with 10.4%.
What is the Percentage of Households with Income Above $200,000 in North Las Vegas, NV?
Percentage of Households with Income Above $200,000 in North Las Vegas is 5.3%.
What is the Percentage of Households with Income Above $200,000 in Nevada?
Percentage of Households with Income Above $200,000 in Nevada is 8.7%.
What is the Percentage of Households with Income Above $200,000 in the United States?
Percentage of Households with Income Above $200,000 in the United States is 11.4%.