Zip Codes with the Highest Percentage of Population Employed in Architecture & Engineering in Las Vegas, NV
RELATED REPORTS & OPTIONS
Architecture & Engineering
Las Vegas
Compare Zip Codes
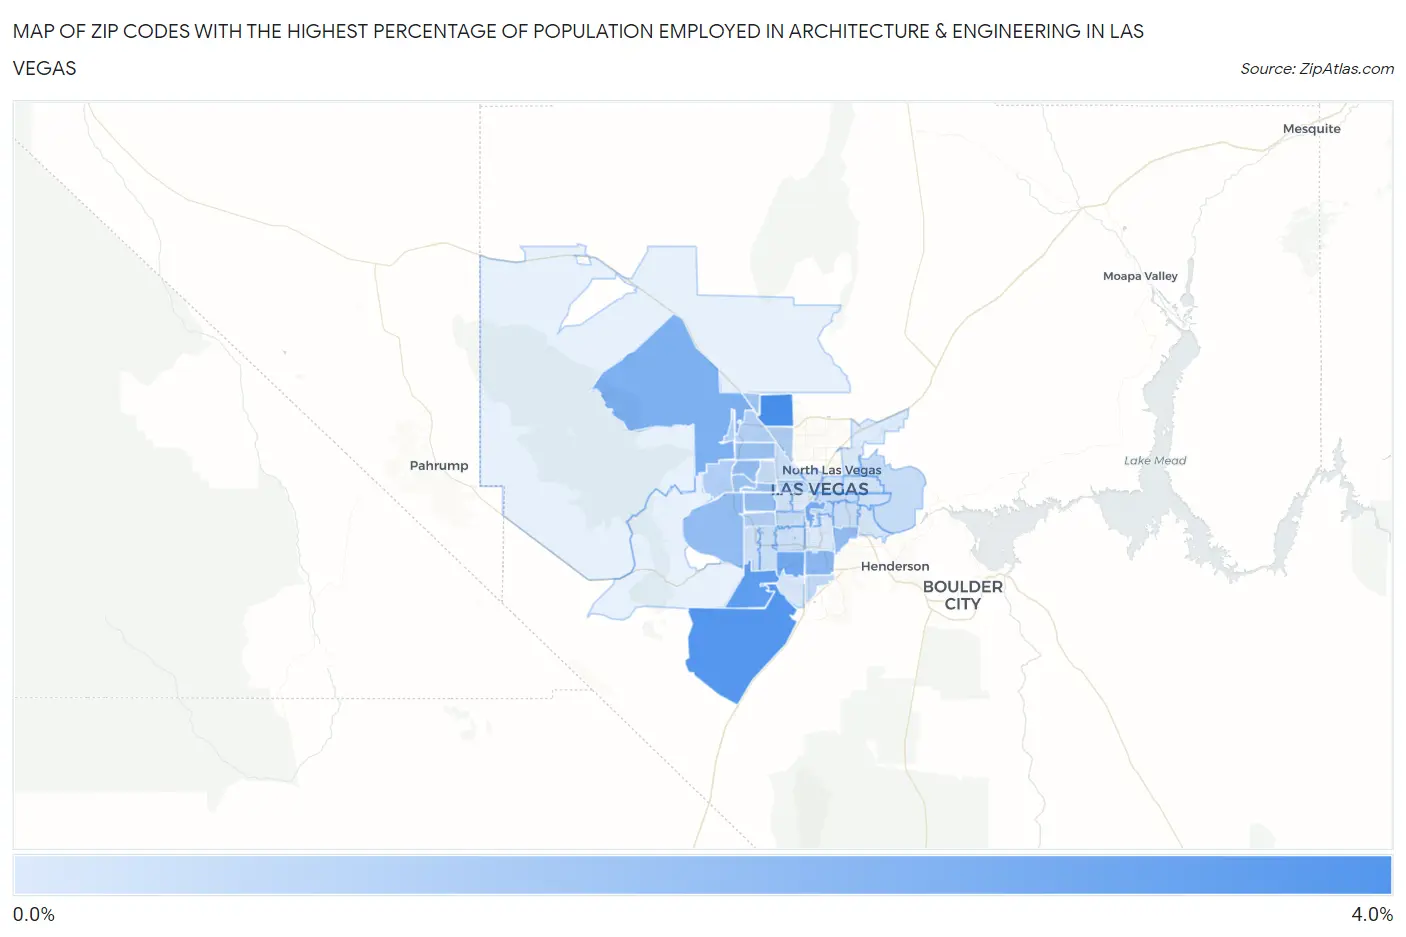
Map of Zip Codes with the Highest Percentage of Population Employed in Architecture & Engineering in Las Vegas
0.33%
3.1%
Zip Codes with the Highest Percentage of Population Employed in Architecture & Engineering in Las Vegas, NV
| Zip Code | % Employed | vs State | vs National | |
| 1. | 89131 | 3.1% | 1.5%(+1.64)#21 | 2.1%(+0.974)#4,685 |
| 2. | 89179 | 2.9% | 1.5%(+1.39)#23 | 2.1%(+0.726)#5,511 |
| 3. | 89178 | 2.6% | 1.5%(+1.14)#26 | 2.1%(+0.479)#6,454 |
| 4. | 89139 | 2.3% | 1.5%(+0.814)#32 | 2.1%(+0.149)#7,950 |
| 5. | 89109 | 2.2% | 1.5%(+0.764)#33 | 2.1%(+0.100)#8,208 |
| 6. | 89166 | 2.1% | 1.5%(+0.645)#36 | 2.1%(-0.020)#8,873 |
| 7. | 89123 | 1.8% | 1.5%(+0.320)#42 | 2.1%(-0.345)#10,798 |
| 8. | 89134 | 1.7% | 1.5%(+0.228)#45 | 2.1%(-0.436)#11,401 |
| 9. | 89120 | 1.7% | 1.5%(+0.198)#46 | 2.1%(-0.467)#11,614 |
| 10. | 89135 | 1.7% | 1.5%(+0.191)#48 | 2.1%(-0.473)#11,658 |
| 11. | 89117 | 1.6% | 1.5%(+0.131)#50 | 2.1%(-0.533)#12,076 |
| 12. | 89129 | 1.6% | 1.5%(+0.091)#52 | 2.1%(-0.573)#12,330 |
| 13. | 89144 | 1.5% | 1.5%(+0.056)#54 | 2.1%(-0.608)#12,557 |
| 14. | 89145 | 1.5% | 1.5%(+0.040)#55 | 2.1%(-0.625)#12,690 |
| 15. | 89143 | 1.5% | 1.5%(+0.018)#57 | 2.1%(-0.646)#12,859 |
| 16. | 89130 | 1.2% | 1.5%(-0.290)#64 | 2.1%(-0.954)#15,120 |
| 17. | 89138 | 1.2% | 1.5%(-0.326)#66 | 2.1%(-0.990)#15,406 |
| 18. | 89147 | 1.1% | 1.5%(-0.369)#69 | 2.1%(-1.03)#15,727 |
| 19. | 89149 | 1.1% | 1.5%(-0.395)#70 | 2.1%(-1.06)#15,937 |
| 20. | 89107 | 0.86% | 1.5%(-0.624)#78 | 2.1%(-1.29)#17,671 |
| 21. | 89183 | 0.83% | 1.5%(-0.654)#80 | 2.1%(-1.32)#17,903 |
| 22. | 89128 | 0.82% | 1.5%(-0.666)#82 | 2.1%(-1.33)#17,997 |
| 23. | 89103 | 0.77% | 1.5%(-0.716)#83 | 2.1%(-1.38)#18,368 |
| 24. | 89156 | 0.77% | 1.5%(-0.716)#84 | 2.1%(-1.38)#18,371 |
| 25. | 89104 | 0.72% | 1.5%(-0.768)#85 | 2.1%(-1.43)#18,781 |
| 26. | 89113 | 0.71% | 1.5%(-0.776)#89 | 2.1%(-1.44)#18,828 |
| 27. | 89121 | 0.65% | 1.5%(-0.833)#92 | 2.1%(-1.50)#19,231 |
| 28. | 89148 | 0.64% | 1.5%(-0.840)#93 | 2.1%(-1.50)#19,285 |
| 29. | 89108 | 0.62% | 1.5%(-0.862)#94 | 2.1%(-1.53)#19,454 |
| 30. | 89169 | 0.62% | 1.5%(-0.863)#95 | 2.1%(-1.53)#19,465 |
| 31. | 89118 | 0.62% | 1.5%(-0.863)#96 | 2.1%(-1.53)#19,467 |
| 32. | 89146 | 0.56% | 1.5%(-0.923)#101 | 2.1%(-1.59)#19,898 |
| 33. | 89142 | 0.55% | 1.5%(-0.938)#102 | 2.1%(-1.60)#19,987 |
| 34. | 89110 | 0.52% | 1.5%(-0.963)#104 | 2.1%(-1.63)#20,128 |
| 35. | 89106 | 0.45% | 1.5%(-1.04)#108 | 2.1%(-1.70)#20,606 |
| 36. | 89122 | 0.44% | 1.5%(-1.04)#109 | 2.1%(-1.70)#20,628 |
| 37. | 89101 | 0.44% | 1.5%(-1.04)#110 | 2.1%(-1.71)#20,642 |
| 38. | 89141 | 0.43% | 1.5%(-1.05)#111 | 2.1%(-1.72)#20,730 |
| 39. | 89119 | 0.38% | 1.5%(-1.11)#112 | 2.1%(-1.77)#21,111 |
| 40. | 89102 | 0.35% | 1.5%(-1.14)#113 | 2.1%(-1.80)#21,311 |
| 41. | 89115 | 0.33% | 1.5%(-1.15)#114 | 2.1%(-1.82)#21,374 |
1
Common Questions
What are the Top 10 Zip Codes with the Highest Percentage of Population Employed in Architecture & Engineering in Las Vegas, NV?
Top 10 Zip Codes with the Highest Percentage of Population Employed in Architecture & Engineering in Las Vegas, NV are:
What zip code has the Highest Percentage of Population Employed in Architecture & Engineering in Las Vegas, NV?
89131 has the Highest Percentage of Population Employed in Architecture & Engineering in Las Vegas, NV with 3.1%.
What is the Percentage of Population Employed in Architecture & Engineering in Las Vegas, NV?
Percentage of Population Employed in Architecture & Engineering in Las Vegas is 1.1%.
What is the Percentage of Population Employed in Architecture & Engineering in Nevada?
Percentage of Population Employed in Architecture & Engineering in Nevada is 1.5%.
What is the Percentage of Population Employed in Architecture & Engineering in the United States?
Percentage of Population Employed in Architecture & Engineering in the United States is 2.1%.