Zip Codes with the Highest Percentage of Population Employed in Office & Administration in Las Vegas, NV
RELATED REPORTS & OPTIONS
Office & Administration
Las Vegas
Compare Zip Codes
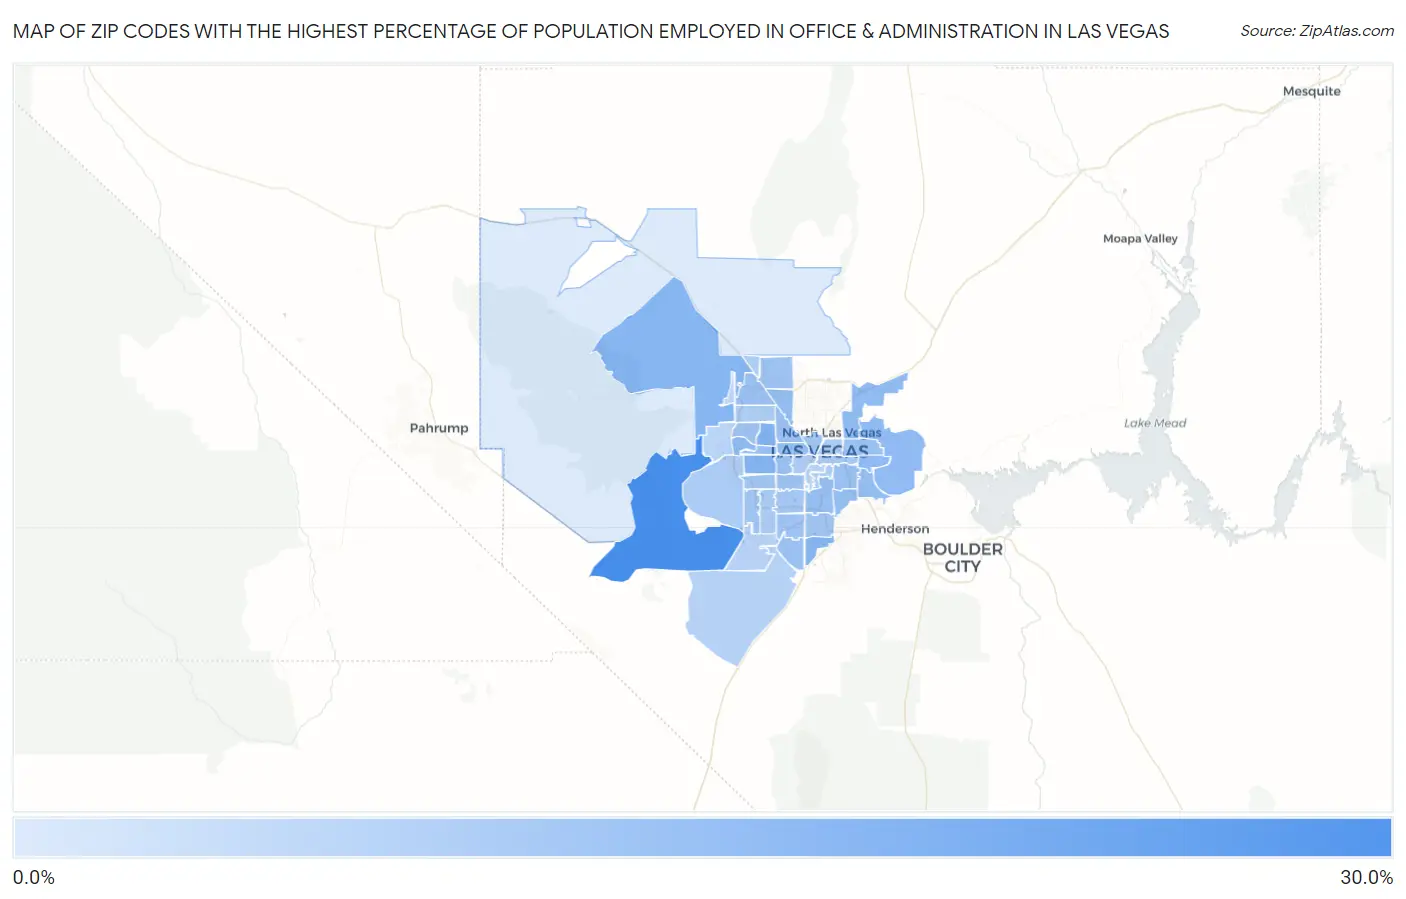
Map of Zip Codes with the Highest Percentage of Population Employed in Office & Administration in Las Vegas
2.0%
26.1%
Zip Codes with the Highest Percentage of Population Employed in Office & Administration in Las Vegas, NV
| Zip Code | % Employed | vs State | vs National | |
| 1. | 89161 | 26.1% | 11.8%(+14.3)#2 | 10.9%(+15.3)#823 |
| 2. | 89128 | 16.0% | 11.8%(+4.17)#11 | 10.9%(+5.14)#3,543 |
| 3. | 89117 | 15.3% | 11.8%(+3.48)#13 | 10.9%(+4.45)#4,193 |
| 4. | 89166 | 15.2% | 11.8%(+3.32)#16 | 10.9%(+4.30)#4,376 |
| 5. | 89183 | 15.0% | 11.8%(+3.17)#18 | 10.9%(+4.14)#4,556 |
| 6. | 89144 | 14.0% | 11.8%(+2.15)#26 | 10.9%(+3.13)#6,043 |
| 7. | 89156 | 13.8% | 11.8%(+1.94)#29 | 10.9%(+2.92)#6,419 |
| 8. | 89115 | 13.6% | 11.8%(+1.72)#32 | 10.9%(+2.70)#6,809 |
| 9. | 89142 | 13.4% | 11.8%(+1.61)#33 | 10.9%(+2.58)#7,052 |
| 10. | 89130 | 13.0% | 11.8%(+1.12)#44 | 10.9%(+2.09)#8,181 |
| 11. | 89122 | 12.8% | 11.8%(+0.979)#45 | 10.9%(+1.96)#8,517 |
| 12. | 89120 | 12.7% | 11.8%(+0.860)#47 | 10.9%(+1.84)#8,806 |
| 13. | 89119 | 12.5% | 11.8%(+0.623)#49 | 10.9%(+1.60)#9,418 |
| 14. | 89107 | 12.4% | 11.8%(+0.601)#50 | 10.9%(+1.58)#9,482 |
| 15. | 89108 | 12.2% | 11.8%(+0.367)#56 | 10.9%(+1.34)#10,139 |
| 16. | 89121 | 12.0% | 11.8%(+0.153)#63 | 10.9%(+1.13)#10,788 |
| 17. | 89149 | 11.9% | 11.8%(+0.024)#65 | 10.9%(+1.00)#11,174 |
| 18. | 89145 | 11.7% | 11.8%(-0.108)#69 | 10.9%(+0.869)#11,561 |
| 19. | 89141 | 11.7% | 11.8%(-0.137)#70 | 10.9%(+0.839)#11,633 |
| 20. | 89146 | 11.7% | 11.8%(-0.159)#72 | 10.9%(+0.817)#11,707 |
| 21. | 89103 | 11.5% | 11.8%(-0.375)#74 | 10.9%(+0.602)#12,364 |
| 22. | 89110 | 11.3% | 11.8%(-0.563)#77 | 10.9%(+0.414)#12,980 |
| 23. | 89134 | 11.2% | 11.8%(-0.619)#79 | 10.9%(+0.357)#13,167 |
| 24. | 89131 | 11.2% | 11.8%(-0.655)#80 | 10.9%(+0.321)#13,284 |
| 25. | 89139 | 10.9% | 11.8%(-0.936)#87 | 10.9%(+0.041)#14,195 |
| 26. | 89106 | 10.7% | 11.8%(-1.11)#91 | 10.9%(-0.138)#14,749 |
| 27. | 89123 | 10.7% | 11.8%(-1.14)#95 | 10.9%(-0.162)#14,831 |
| 28. | 89147 | 10.7% | 11.8%(-1.14)#96 | 10.9%(-0.162)#14,832 |
| 29. | 89148 | 10.6% | 11.8%(-1.22)#97 | 10.9%(-0.240)#15,068 |
| 30. | 89118 | 10.1% | 11.8%(-1.71)#100 | 10.9%(-0.730)#16,708 |
| 31. | 89104 | 9.7% | 11.8%(-2.12)#106 | 10.9%(-1.14)#18,030 |
| 32. | 89113 | 9.7% | 11.8%(-2.16)#107 | 10.9%(-1.19)#18,185 |
| 33. | 89135 | 9.3% | 11.8%(-2.57)#109 | 10.9%(-1.60)#19,501 |
| 34. | 89102 | 9.0% | 11.8%(-2.81)#111 | 10.9%(-1.83)#20,197 |
| 35. | 89101 | 9.0% | 11.8%(-2.82)#112 | 10.9%(-1.84)#20,223 |
| 36. | 89129 | 8.9% | 11.8%(-2.95)#114 | 10.9%(-1.97)#20,578 |
| 37. | 89143 | 8.4% | 11.8%(-3.41)#115 | 10.9%(-2.43)#21,903 |
| 38. | 89169 | 8.4% | 11.8%(-3.42)#116 | 10.9%(-2.44)#21,911 |
| 39. | 89179 | 7.8% | 11.8%(-4.01)#120 | 10.9%(-3.03)#23,423 |
| 40. | 89178 | 7.4% | 11.8%(-4.48)#122 | 10.9%(-3.50)#24,501 |
| 41. | 89138 | 7.1% | 11.8%(-4.73)#124 | 10.9%(-3.76)#25,027 |
| 42. | 89109 | 7.0% | 11.8%(-4.82)#126 | 10.9%(-3.85)#25,192 |
| 43. | 89158 | 5.8% | 11.8%(-6.03)#133 | 10.9%(-5.05)#27,134 |
| 44. | 89124 | 2.0% | 11.8%(-9.86)#143 | 10.9%(-8.88)#30,109 |
1
Common Questions
What are the Top 10 Zip Codes with the Highest Percentage of Population Employed in Office & Administration in Las Vegas, NV?
Top 10 Zip Codes with the Highest Percentage of Population Employed in Office & Administration in Las Vegas, NV are:
What zip code has the Highest Percentage of Population Employed in Office & Administration in Las Vegas, NV?
89161 has the Highest Percentage of Population Employed in Office & Administration in Las Vegas, NV with 26.1%.
What is the Percentage of Population Employed in Office & Administration in Las Vegas, NV?
Percentage of Population Employed in Office & Administration in Las Vegas is 11.7%.
What is the Percentage of Population Employed in Office & Administration in Nevada?
Percentage of Population Employed in Office & Administration in Nevada is 11.8%.
What is the Percentage of Population Employed in Office & Administration in the United States?
Percentage of Population Employed in Office & Administration in the United States is 10.9%.