Zip Codes with the Highest Percentage of Population Employed in Community & Social Service in Las Vegas, NV

RELATED REPORTS & OPTIONS

Community & Social Service
Population
Families and Households
Female Fertility
Female Fertility (Unmarried)
Race (Community Size)
Race (Percentage)
Ancestry (Community Size)
AfghanAfricanAlaska NativeAlbanianAleutAmericanApacheArabArapahoArgentineanArmenianAssyrian / Chaldean / SyriacAustralianAustrianBangladeshiBarbadianBasqueBelgianBelizeanBhutaneseBlackfeetBolivianBrazilianBritishBritish West IndianBulgarianBurmeseCajunCambodianCanadianCape VerdeanCelticCentral AmericanCentral American IndianCherokeeCheyenneChickasawChileanChineseChippewaChoctawColombianComancheCosta RicanCreeCreekCroatianCubanCzechCzechoslovakianDanishDelawareDominicanDutchDutch West IndianEastern EuropeanEcuadorianEgyptianEnglishEstonianEthiopianEuropeanFijianFilipinoFinnishFrenchFrench American IndianFrench CanadianGermanGerman RussianGhanaianGreekGuamanian / ChamorroGuatemalanGuyaneseHaitianHonduranHopiHungarianIcelanderIndian (Asian)IndonesianInupiatIranianIraqiIrishIroquoisIsraeliItalianJamaicanJapaneseJordanianKenyanKoreanLaotianLatvianLebaneseLiberianLithuanianLuxembourgerMacedonianMalaysianMalteseMenomineeMexicanMexican American IndianMongolianMoroccanNative HawaiianNavajoNew ZealanderNicaraguanNigerianNorthern EuropeanNorwegianOkinawanOsagePaiutePakistaniPalestinianPanamanianParaguayanPennsylvania GermanPeruvianPimaPolishPortuguesePotawatomiPuebloPuerto RicanPuget Sound SalishRomanianRussianSalvadoranSamoanScandinavianScotch-IrishScottishSeminoleSenegaleseSerbianShoshoneSierra LeoneanSiouxSlavicSlovakSloveneSomaliSouth AfricanSouth AmericanSouth American IndianSoviet UnionSpaniardSpanishSpanish AmericanSpanish American IndianSri LankanSubsaharan AfricanSudaneseSwedishSwissSyrianThaiTlingit-HaidaTohono O'OdhamTonganTrinidadian and TobagonianTurkishU.S. Virgin IslanderUgandanUkrainianUruguayanUteVenezuelanVietnameseWelshWest IndianYaquiYugoslavianYumanYup'ikZimbabwean
Ancestry (Percentage)
AfghanAfricanAlaska NativeAlbanianAleutAmericanApacheArabArapahoArgentineanArmenianAssyrian / Chaldean / SyriacAustralianAustrianBangladeshiBarbadianBasqueBelgianBelizeanBhutaneseBlackfeetBolivianBrazilianBritishBritish West IndianBulgarianBurmeseCajunCambodianCanadianCape VerdeanCelticCentral AmericanCentral American IndianCherokeeCheyenneChickasawChileanChineseChippewaChoctawColombianComancheCosta RicanCreeCreekCroatianCubanCzechCzechoslovakianDanishDelawareDominicanDutchDutch West IndianEastern EuropeanEcuadorianEgyptianEnglishEstonianEthiopianEuropeanFijianFilipinoFinnishFrenchFrench American IndianFrench CanadianGermanGerman RussianGhanaianGreekGuamanian / ChamorroGuatemalanGuyaneseHaitianHonduranHopiHungarianIcelanderIndian (Asian)IndonesianInupiatIranianIraqiIrishIroquoisIsraeliItalianJamaicanJapaneseJordanianKenyanKoreanLaotianLatvianLebaneseLiberianLithuanianLuxembourgerMacedonianMalaysianMalteseMenomineeMexicanMexican American IndianMongolianMoroccanNative HawaiianNavajoNew ZealanderNicaraguanNigerianNorthern EuropeanNorwegianOkinawanOsagePaiutePakistaniPalestinianPanamanianParaguayanPennsylvania GermanPeruvianPimaPolishPortuguesePotawatomiPuebloPuerto RicanPuget Sound SalishRomanianRussianSalvadoranSamoanScandinavianScotch-IrishScottishSeminoleSenegaleseSerbianShoshoneSierra LeoneanSiouxSlavicSlovakSloveneSomaliSouth AfricanSouth AmericanSouth American IndianSoviet UnionSpaniardSpanishSpanish AmericanSpanish American IndianSri LankanSubsaharan AfricanSudaneseSwedishSwissSyrianThaiTlingit-HaidaTohono O'OdhamTonganTrinidadian and TobagonianTurkishU.S. Virgin IslanderUgandanUkrainianUruguayanUteVenezuelanVietnameseWelshWest IndianYaquiYugoslavianYumanYup'ikZimbabwean
Immigrant Origin (Total)
AfghanistanAfricaAlbaniaArgentinaArmeniaAsiaAustraliaAustriaBahamasBangladeshBarbadosBelarusBelgiumBelizeBoliviaBosnia and HerzegovinaBrazilBulgariaBurma / MyanmarCambodiaCameroonCanadaCaribbeanCentral AmericaChileChinaColombiaCosta RicaCroatiaCubaCzechoslovakiaDenmarkDominican RepublicEastern AfricaEastern AsiaEastern EuropeEcuadorEgyptEl SalvadorEnglandEritreaEthiopiaEuropeFijiFranceGermanyGhanaGreeceGuatemalaGuyanaHaitiHondurasHong KongHungaryIndiaIndonesiaIranIraqIrelandIsraelItalyJamaicaJapanJordanKazakhstanKenyaKoreaLaosLatin AmericaLatviaLebanonLiberiaLithuaniaMalaysiaMexicoMicronesiaMiddle AfricaMoldovaMoroccoNepalNetherlandsNicaraguaNigeriaNorth MacedoniaNorthern AfricaNorthern EuropeNorwayOceaniaPakistanPanamaPeruPhilippinesPolandPortugalRomaniaRussiaSaudi ArabiaScotlandSenegalSerbiaSierra LeoneSingaporeSomaliaSouth AfricaSouth AmericaSouth Central AsiaSouth Eastern AsiaSouthern EuropeSpainSri LankaSudanSwedenSwitzerlandSyriaTaiwanThailandTrinidad and TobagoTurkeyUgandaUkraineUruguayUzbekistanVenezuelaVietnamWest IndiesWestern AfricaWestern AsiaWestern EuropeYemenZaireZimbabwe
Immigrant Origin (Percentage)
AfghanistanAfricaAlbaniaArgentinaArmeniaAsiaAustraliaAustriaBahamasBangladeshBarbadosBelarusBelgiumBelizeBoliviaBosnia and HerzegovinaBrazilBulgariaBurma / MyanmarCambodiaCameroonCanadaCaribbeanCentral AmericaChileChinaColombiaCosta RicaCroatiaCubaCzechoslovakiaDenmarkDominican RepublicEastern AfricaEastern AsiaEastern EuropeEcuadorEgyptEl SalvadorEnglandEritreaEthiopiaEuropeFijiFranceGermanyGhanaGreeceGuatemalaGuyanaHaitiHondurasHong KongHungaryIndiaIndonesiaIranIraqIrelandIsraelItalyJamaicaJapanJordanKazakhstanKenyaKoreaLaosLatin AmericaLatviaLebanonLiberiaLithuaniaMalaysiaMexicoMicronesiaMiddle AfricaMoldovaMoroccoNepalNetherlandsNicaraguaNigeriaNorth MacedoniaNorthern AfricaNorthern EuropeNorwayOceaniaPakistanPanamaPeruPhilippinesPolandPortugalRomaniaRussiaSaudi ArabiaScotlandSenegalSerbiaSierra LeoneSingaporeSomaliaSouth AfricaSouth AmericaSouth Central AsiaSouth Eastern AsiaSouthern EuropeSpainSri LankaSudanSwedenSwitzerlandSyriaTaiwanThailandTrinidad and TobagoTurkeyUgandaUkraineUruguayUzbekistanVenezuelaVietnamWest IndiesWestern AfricaWestern AsiaWestern EuropeYemenZaireZimbabwe
Income
Income (Families)
Income (Households)
Poverty
Poverty (Families)
Unemployment
Employment Occupations
Employment Industries
Employer Class
Commute Time
Commute Means
School Enrollment
Education by Degree Field
Occupancy
Finances
Physical Characteristics
Las Vegas
Compare Zip Codes
Comparison Subject

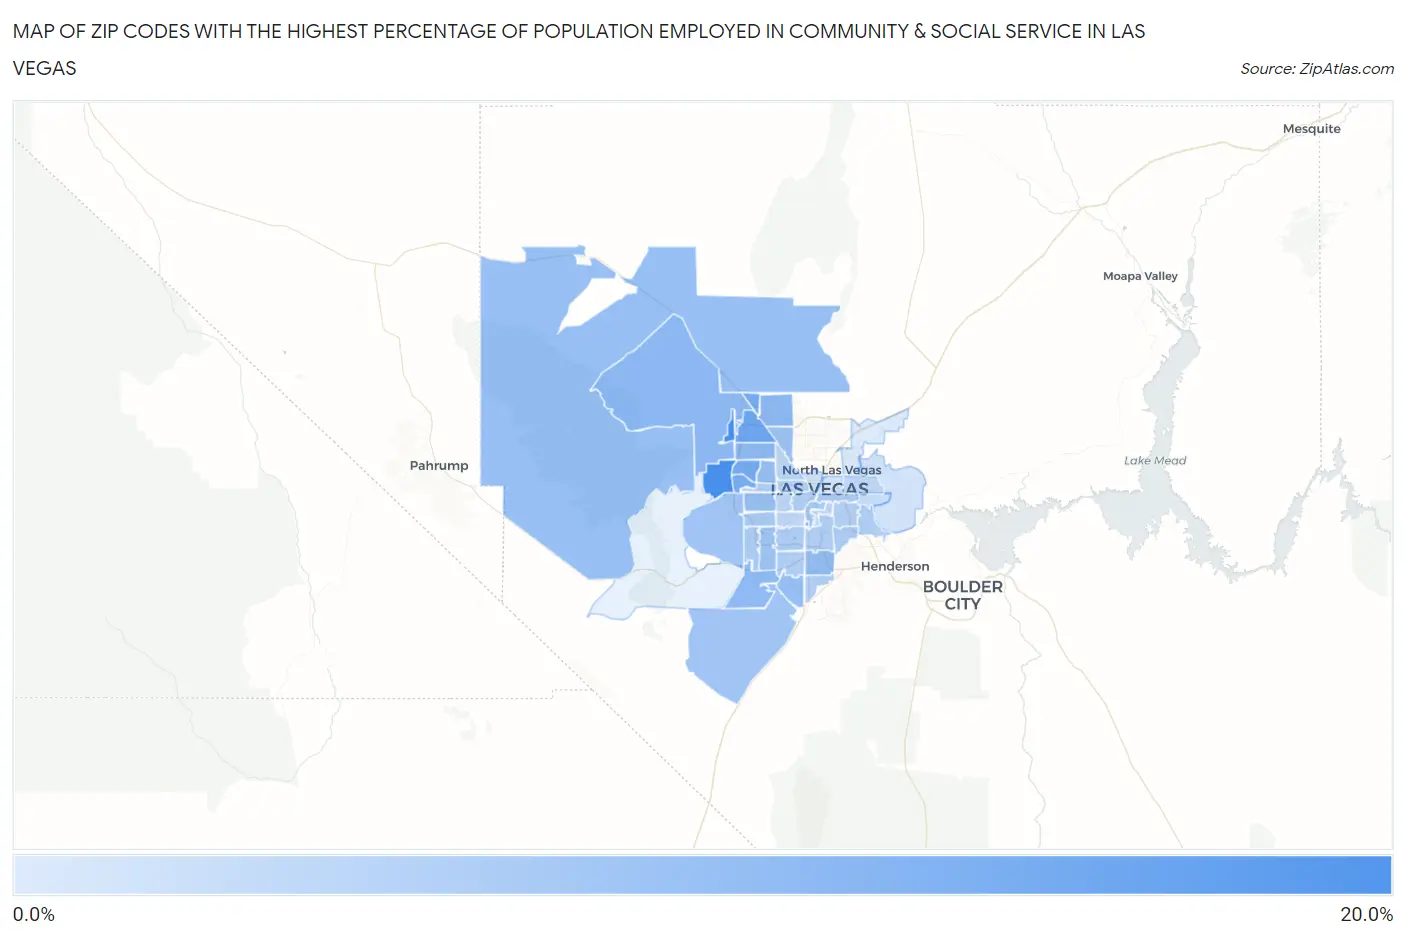
Map of Zip Codes with the Highest Percentage of Population Employed in Community & Social Service in Las Vegas

0.0%
20.0%
Zip Codes with the Highest Percentage of Population Employed in Community & Social Service  in Las Vegas Map

Zip Codes with the Highest Percentage of Population Employed in Community & Social Service in Las Vegas, NV

Zip Code % Employed vs State vs National
1.8913818.6%9.1%(+9.53)#1311.2%(+7.40)#2,550
2.8914914.4%9.1%(+5.31)#2411.2%(+3.17)#5,601
3.8913413.7%9.1%(+4.63)#2611.2%(+2.49)#6,466
4.8914313.6%9.1%(+4.52)#2711.2%(+2.38)#6,618
5.8914413.5%9.1%(+4.42)#2811.2%(+2.28)#6,750
6.8915813.3%9.1%(+4.23)#3011.2%(+2.10)#7,058
7.8913111.4%9.1%(+2.30)#4111.2%(+0.164)#10,725
8.8916611.3%9.1%(+2.21)#4211.2%(+0.071)#10,925
9.8912911.2%9.1%(+2.17)#4311.2%(+0.033)#11,018
10.8917811.0%9.1%(+1.97)#4611.2%(-0.168)#11,519
11.8912310.6%9.1%(+1.53)#5111.2%(-0.611)#12,623
12.8912810.5%9.1%(+1.40)#5211.2%(-0.735)#12,918
13.8912410.2%9.1%(+1.12)#5611.2%(-1.02)#13,615
14.8911710.2%9.1%(+1.08)#5811.2%(-1.06)#13,722
15.8914110.2%9.1%(+1.07)#5911.2%(-1.06)#13,736
16.891139.8%9.1%(+0.725)#6111.2%(-1.41)#14,638
17.891309.7%9.1%(+0.637)#6211.2%(-1.50)#14,829
18.891799.3%9.1%(+0.256)#6811.2%(-1.88)#15,879
19.891359.2%9.1%(+0.089)#7011.2%(-2.05)#16,358
20.891099.0%9.1%(-0.119)#7411.2%(-2.26)#16,939
21.891048.3%9.1%(-0.743)#7811.2%(-2.88)#18,639
22.891478.3%9.1%(-0.805)#8111.2%(-2.94)#18,838
23.891188.2%9.1%(-0.890)#8211.2%(-3.03)#19,056
24.891488.1%9.1%(-0.967)#8311.2%(-3.10)#19,256
25.891208.0%9.1%(-1.05)#8411.2%(-3.19)#19,490
26.891197.8%9.1%(-1.29)#9011.2%(-3.43)#20,181
27.891457.8%9.1%(-1.32)#9111.2%(-3.46)#20,249
28.891027.7%9.1%(-1.36)#9211.2%(-3.50)#20,335
29.891397.7%9.1%(-1.36)#9311.2%(-3.50)#20,337
30.891227.7%9.1%(-1.39)#9511.2%(-3.53)#20,420
31.891837.6%9.1%(-1.52)#10011.2%(-3.65)#20,727
32.891217.5%9.1%(-1.62)#10211.2%(-3.76)#20,996
33.891077.1%9.1%(-1.99)#10511.2%(-4.13)#21,926
34.891086.6%9.1%(-2.48)#11111.2%(-4.62)#23,037
35.891466.5%9.1%(-2.61)#11311.2%(-4.75)#23,351
36.891696.3%9.1%(-2.76)#11611.2%(-4.89)#23,659
37.891036.2%9.1%(-2.87)#11811.2%(-5.01)#23,937
38.891106.1%9.1%(-2.96)#12211.2%(-5.10)#24,136
39.891425.4%9.1%(-3.68)#12511.2%(-5.82)#25,543
40.891064.7%9.1%(-4.37)#13211.2%(-6.51)#26,641
41.891564.5%9.1%(-4.58)#13411.2%(-6.72)#26,946
42.891013.9%9.1%(-5.20)#13511.2%(-7.34)#27,697
43.891153.4%9.1%(-5.65)#14011.2%(-7.79)#28,167

Common Questions

What are the Top 10 Zip Codes with the Highest Percentage of Population Employed in Community & Social Service in Las Vegas, NV?
Top 10 Zip Codes with the Highest Percentage of Population Employed in Community & Social Service in Las Vegas, NV are:
#1
18.6%
#2
14.4%
#3
13.7%
#4
13.6%
#5
13.5%
#6
13.3%
#7
11.4%
#8
11.3%
#9
11.2%
#10
11.0%
What zip code has the Highest Percentage of Population Employed in Community & Social Service in Las Vegas, NV?
89138 has the Highest Percentage of Population Employed in Community & Social Service in Las Vegas, NV with 18.6%.
What is the Percentage of Population Employed in Community & Social Service in Las Vegas, NV?
Percentage of Population Employed in Community & Social Service in Las Vegas is 9.7%.
What is the Percentage of Population Employed in Community & Social Service in Nevada?
Percentage of Population Employed in Community & Social Service in Nevada is 9.1%.
What is the Percentage of Population Employed in Community & Social Service in the United States?
Percentage of Population Employed in Community & Social Service in the United States is 11.2%.