Zip Codes with the Highest Percentage of Population Employed in Security & Protection in Carson City, NV
RELATED REPORTS & OPTIONS
Security & Protection
Carson City
Compare Zip Codes
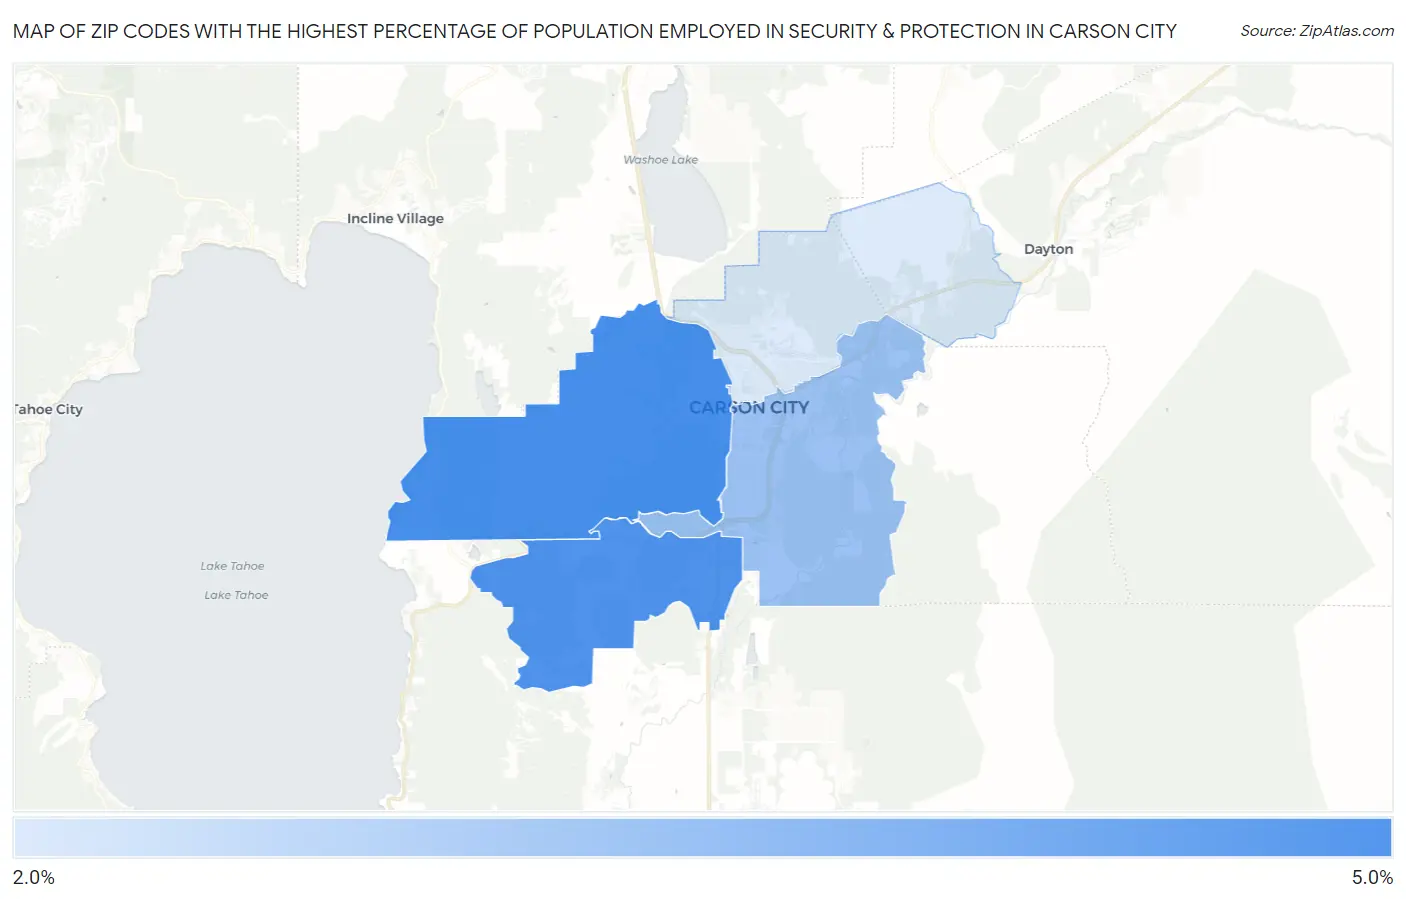
Map of Zip Codes with the Highest Percentage of Population Employed in Security & Protection in Carson City
2.2%
4.1%
Zip Codes with the Highest Percentage of Population Employed in Security & Protection in Carson City, NV
| Zip Code | % Employed | vs State | vs National | |
| 1. | 89703 | 4.1% | 3.0%(+1.04)#38 | 2.1%(+1.93)#4,352 |
| 2. | 89705 | 4.0% | 3.0%(+0.963)#40 | 2.1%(+1.85)#4,510 |
| 3. | 89701 | 3.0% | 3.0%(-0.021)#68 | 2.1%(+0.861)#7,195 |
| 4. | 89706 | 2.2% | 3.0%(-0.874)#97 | 2.1%(+0.009)#11,523 |
1
Common Questions
What are the Top 3 Zip Codes with the Highest Percentage of Population Employed in Security & Protection in Carson City, NV?
Top 3 Zip Codes with the Highest Percentage of Population Employed in Security & Protection in Carson City, NV are:
What zip code has the Highest Percentage of Population Employed in Security & Protection in Carson City, NV?
89703 has the Highest Percentage of Population Employed in Security & Protection in Carson City, NV with 4.1%.
What is the Percentage of Population Employed in Security & Protection in Nevada?
Percentage of Population Employed in Security & Protection in Nevada is 3.0%.
What is the Percentage of Population Employed in Security & Protection in the United States?
Percentage of Population Employed in Security & Protection in the United States is 2.1%.