Zip Codes with the Highest Percentage of Population Employed in Office & Administration in Carson City, NV
RELATED REPORTS & OPTIONS
Office & Administration
Carson City
Compare Zip Codes
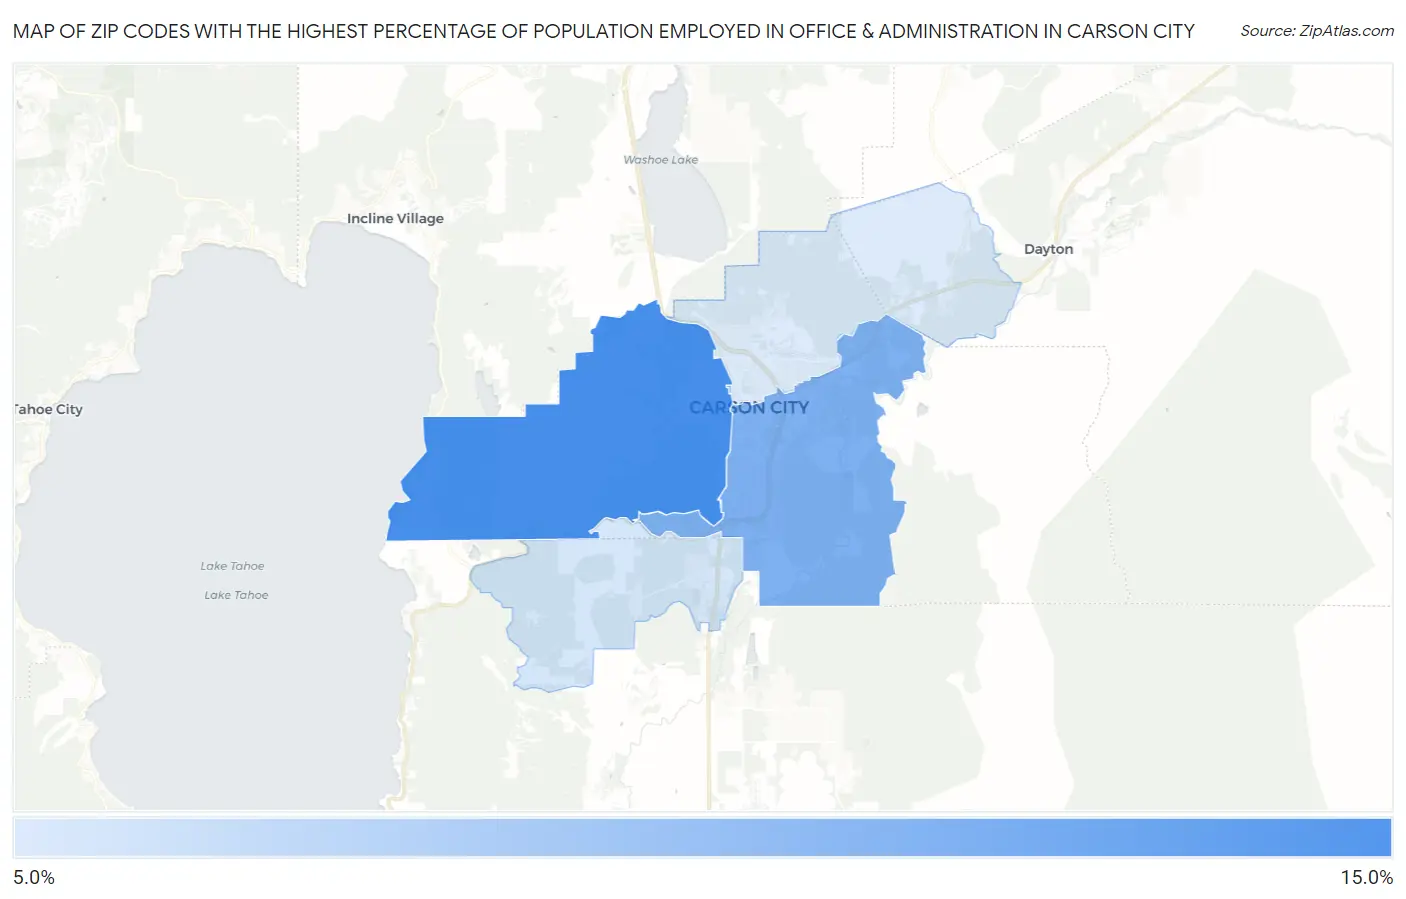
Map of Zip Codes with the Highest Percentage of Population Employed in Office & Administration in Carson City
11.1%
13.2%
Zip Codes with the Highest Percentage of Population Employed in Office & Administration in Carson City, NV
| Zip Code | % Employed | vs State | vs National | |
| 1. | 89703 | 13.2% | 11.8%(+1.33)#39 | 10.9%(+2.31)#7,656 |
| 2. | 89701 | 12.4% | 11.8%(+0.573)#51 | 10.9%(+1.55)#9,553 |
| 3. | 89705 | 11.2% | 11.8%(-0.619)#78 | 10.9%(+0.358)#13,165 |
| 4. | 89706 | 11.1% | 11.8%(-0.725)#83 | 10.9%(+0.251)#13,515 |
1
Common Questions
What are the Top 3 Zip Codes with the Highest Percentage of Population Employed in Office & Administration in Carson City, NV?
Top 3 Zip Codes with the Highest Percentage of Population Employed in Office & Administration in Carson City, NV are:
What zip code has the Highest Percentage of Population Employed in Office & Administration in Carson City, NV?
89703 has the Highest Percentage of Population Employed in Office & Administration in Carson City, NV with 13.2%.
What is the Percentage of Population Employed in Office & Administration in Nevada?
Percentage of Population Employed in Office & Administration in Nevada is 11.8%.
What is the Percentage of Population Employed in Office & Administration in the United States?
Percentage of Population Employed in Office & Administration in the United States is 10.9%.