Zip Codes with the Highest Percentage of Population Employed in Architecture & Engineering in Carson City, NV
RELATED REPORTS & OPTIONS
Architecture & Engineering
Carson City
Compare Zip Codes
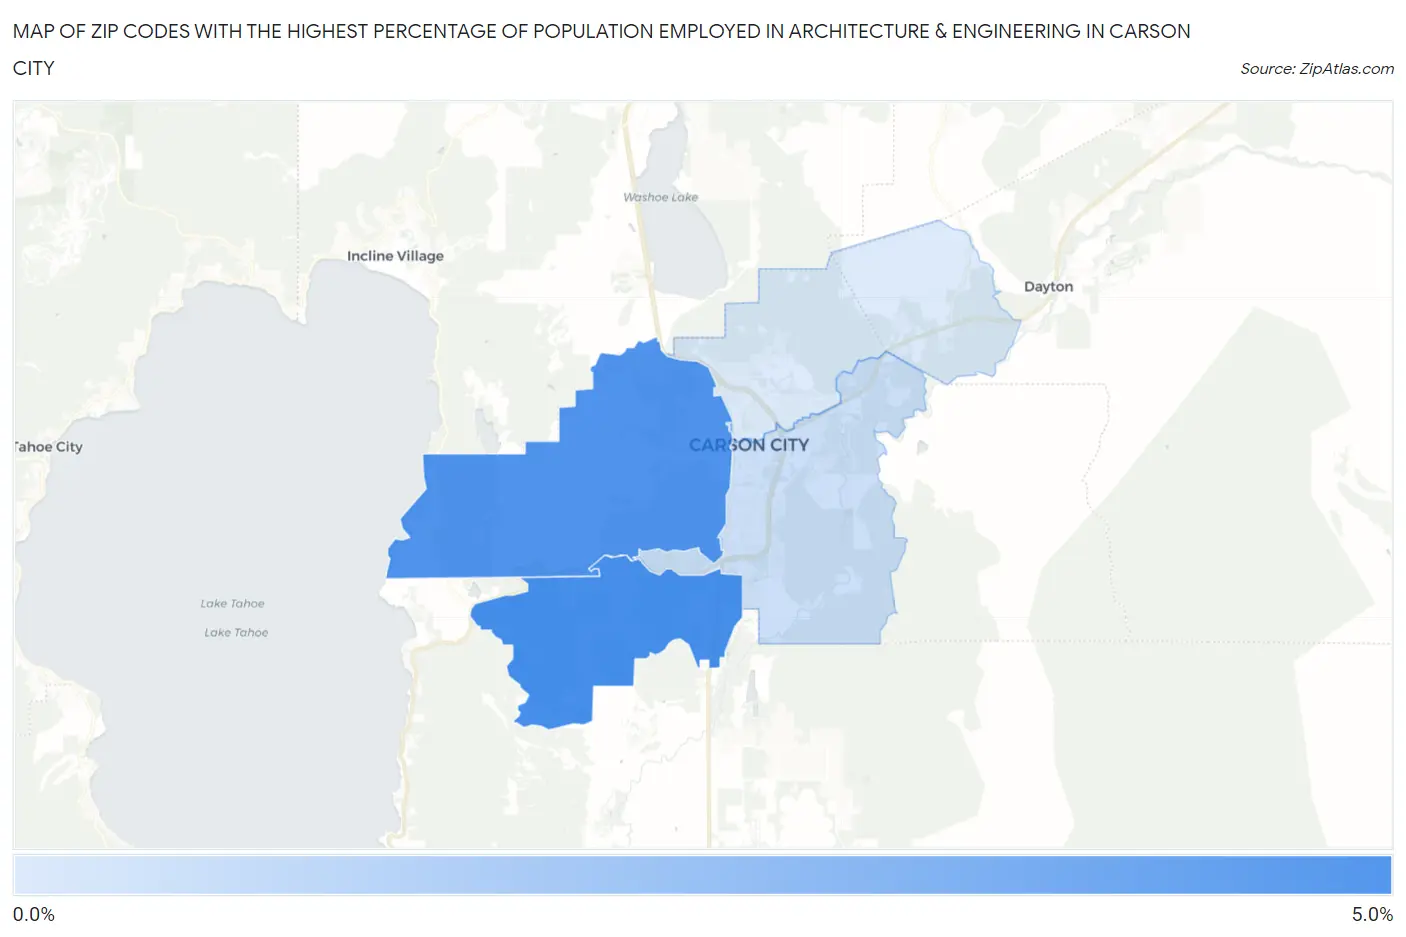
Map of Zip Codes with the Highest Percentage of Population Employed in Architecture & Engineering in Carson City
0.66%
4.2%
Zip Codes with the Highest Percentage of Population Employed in Architecture & Engineering in Carson City, NV
| Zip Code | % Employed | vs State | vs National | |
| 1. | 89705 | 4.2% | 1.5%(+2.67)#12 | 2.1%(+2.01)#2,547 |
| 2. | 89703 | 4.0% | 1.5%(+2.50)#13 | 2.1%(+1.84)#2,783 |
| 3. | 89701 | 1.1% | 1.5%(-0.434)#71 | 2.1%(-1.10)#16,235 |
| 4. | 89706 | 0.66% | 1.5%(-0.821)#90 | 2.1%(-1.49)#19,146 |
1
Common Questions
What are the Top 3 Zip Codes with the Highest Percentage of Population Employed in Architecture & Engineering in Carson City, NV?
Top 3 Zip Codes with the Highest Percentage of Population Employed in Architecture & Engineering in Carson City, NV are:
What zip code has the Highest Percentage of Population Employed in Architecture & Engineering in Carson City, NV?
89705 has the Highest Percentage of Population Employed in Architecture & Engineering in Carson City, NV with 4.2%.
What is the Percentage of Population Employed in Architecture & Engineering in Nevada?
Percentage of Population Employed in Architecture & Engineering in Nevada is 1.5%.
What is the Percentage of Population Employed in Architecture & Engineering in the United States?
Percentage of Population Employed in Architecture & Engineering in the United States is 2.1%.