New Egypt, NJ Map & Demographics
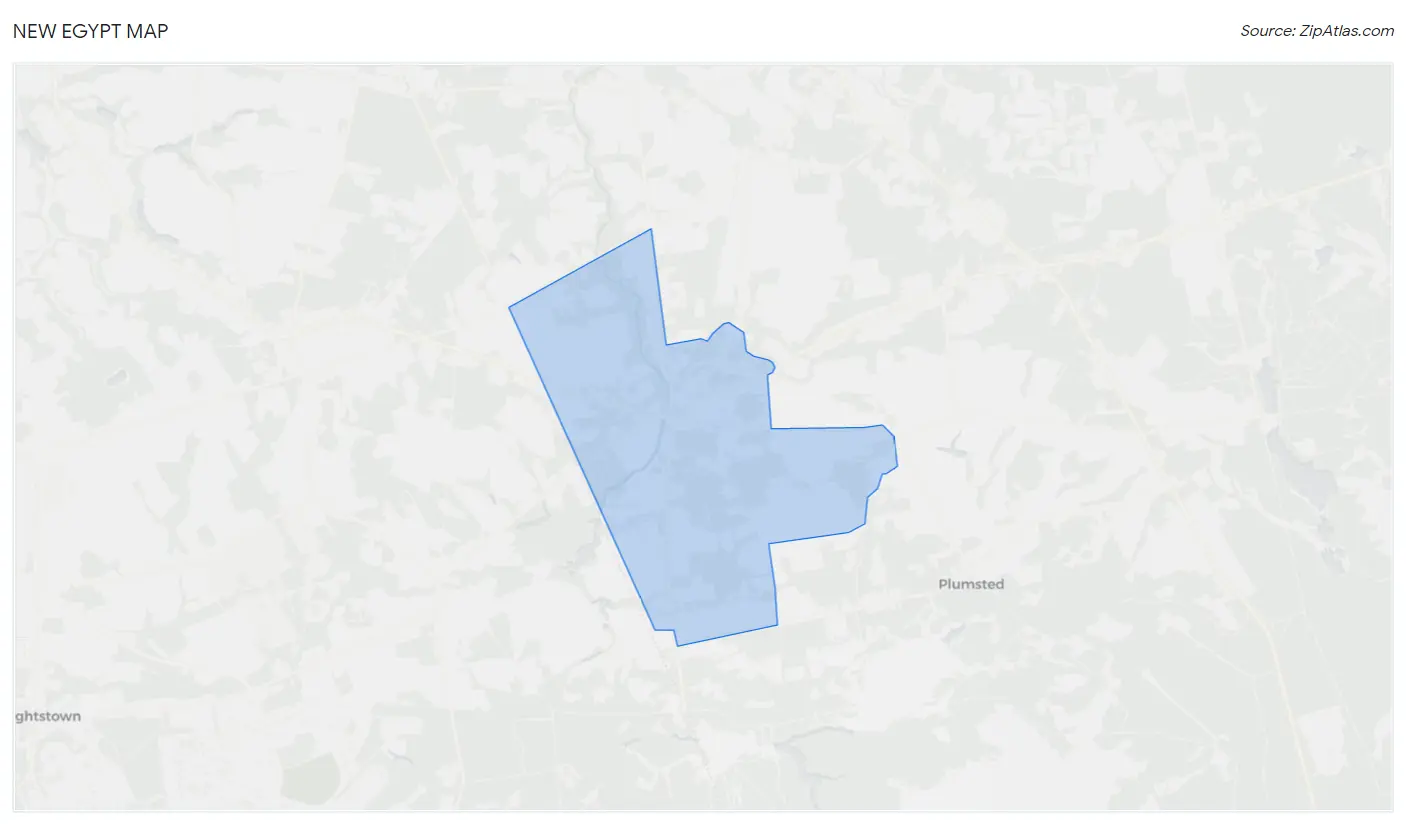
New Egypt Map
New Egypt Overview
$41,224
PER CAPITA INCOME
$86,080
AVG FAMILY INCOME
$70,060
AVG HOUSEHOLD INCOME
19.8%
WAGE / INCOME GAP [ % ]
80.2¢/ $1
WAGE / INCOME GAP [ $ ]
0.37
INEQUALITY / GINI INDEX
1,552
TOTAL POPULATION
876
MALE POPULATION
676
FEMALE POPULATION
129.59
MALES / 100 FEMALES
77.17
FEMALES / 100 MALES
52.9
MEDIAN AGE
2.6
AVG FAMILY SIZE
1.8
AVG HOUSEHOLD SIZE
962
LABOR FORCE [ PEOPLE ]
66.7%
PERCENT IN LABOR FORCE
6.8%
UNEMPLOYMENT RATE
New Egypt Zip Codes
New Egypt Area Codes
Income in New Egypt
Income Overview in New Egypt
Per Capita Income in New Egypt is $41,224, while median incomes of families and households are $86,080 and $70,060 respectively.
| Characteristic | Number | Measure |
| Per Capita Income | 1,552 | $41,224 |
| Median Family Income | 403 | $86,080 |
| Mean Family Income | 403 | $99,292 |
| Median Household Income | 861 | $70,060 |
| Mean Household Income | 861 | $73,800 |
| Income Deficit | 403 | $0 |
| Wage / Income Gap (%) | 1,552 | 19.81% |
| Wage / Income Gap ($) | 1,552 | 80.19¢ per $1 |
| Gini / Inequality Index | 1,552 | 0.37 |
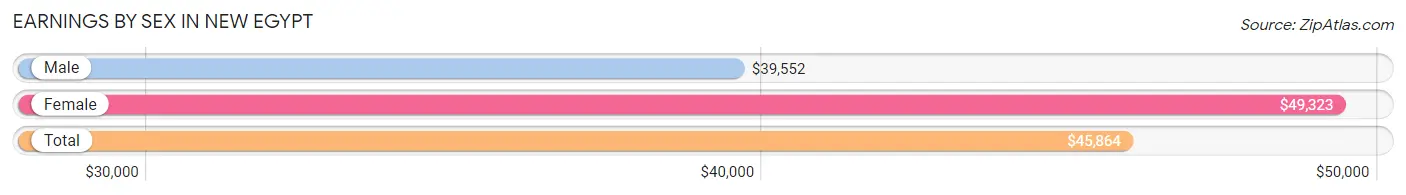
Earnings by Sex in New Egypt
Average Earnings in New Egypt are $45,864, $39,552 for men and $49,323 for women, a difference of 19.8%.
| Sex | Number | Average Earnings |
| Male | 615 (60.1%) | $39,552 |
| Female | 409 (39.9%) | $49,323 |
| Total | 1,024 (100.0%) | $45,864 |
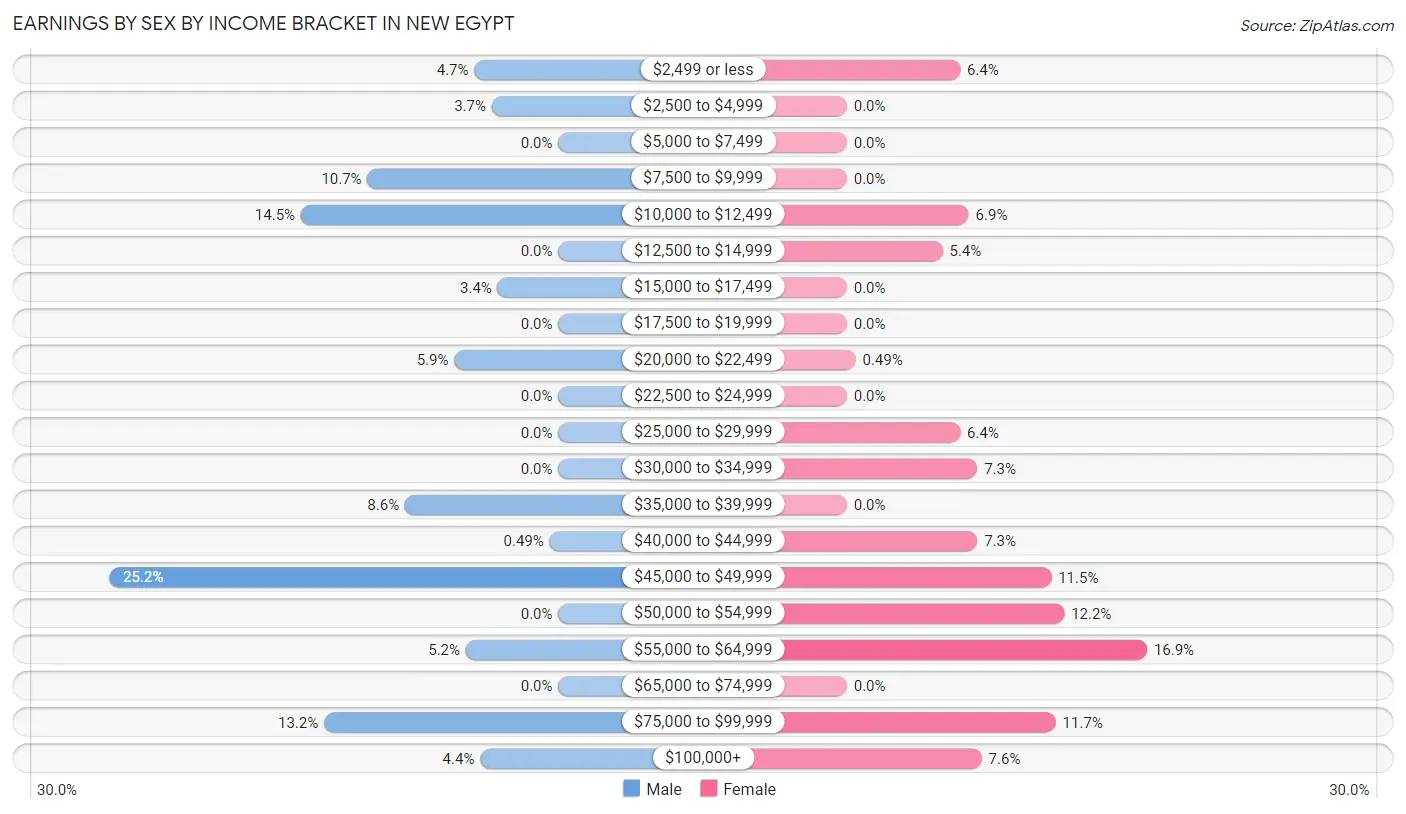
Earnings by Sex by Income Bracket in New Egypt
The most common earnings brackets in New Egypt are $45,000 to $49,999 for men (155 | 25.2%) and $55,000 to $64,999 for women (69 | 16.9%).
| Income | Male | Female |
| $2,499 or less | 29 (4.7%) | 26 (6.4%) |
| $2,500 to $4,999 | 23 (3.7%) | 0 (0.0%) |
| $5,000 to $7,499 | 0 (0.0%) | 0 (0.0%) |
| $7,500 to $9,999 | 66 (10.7%) | 0 (0.0%) |
| $10,000 to $12,499 | 89 (14.5%) | 28 (6.9%) |
| $12,500 to $14,999 | 0 (0.0%) | 22 (5.4%) |
| $15,000 to $17,499 | 21 (3.4%) | 0 (0.0%) |
| $17,500 to $19,999 | 0 (0.0%) | 0 (0.0%) |
| $20,000 to $22,499 | 36 (5.9%) | 2 (0.5%) |
| $22,500 to $24,999 | 0 (0.0%) | 0 (0.0%) |
| $25,000 to $29,999 | 0 (0.0%) | 26 (6.4%) |
| $30,000 to $34,999 | 0 (0.0%) | 30 (7.3%) |
| $35,000 to $39,999 | 53 (8.6%) | 0 (0.0%) |
| $40,000 to $44,999 | 3 (0.5%) | 30 (7.3%) |
| $45,000 to $49,999 | 155 (25.2%) | 47 (11.5%) |
| $50,000 to $54,999 | 0 (0.0%) | 50 (12.2%) |
| $55,000 to $64,999 | 32 (5.2%) | 69 (16.9%) |
| $65,000 to $74,999 | 0 (0.0%) | 0 (0.0%) |
| $75,000 to $99,999 | 81 (13.2%) | 48 (11.7%) |
| $100,000+ | 27 (4.4%) | 31 (7.6%) |
| Total | 615 (100.0%) | 409 (100.0%) |
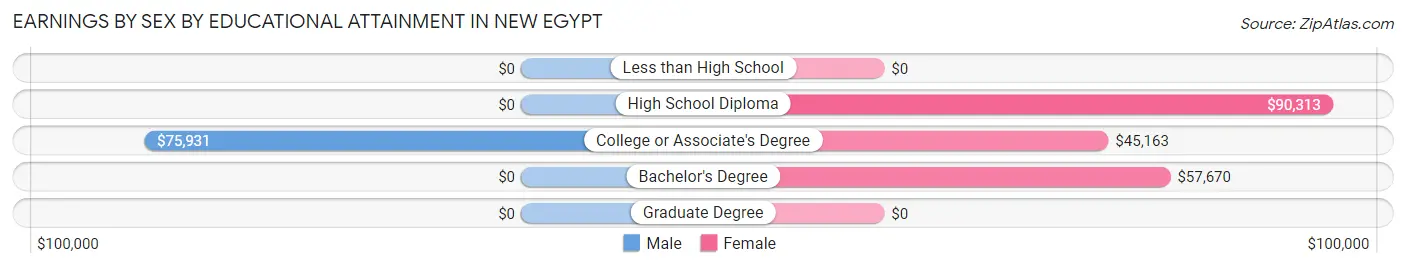
Earnings by Sex by Educational Attainment in New Egypt
Average earnings in New Egypt are $46,767 for men and $51,563 for women, a difference of 9.3%. Men with an educational attainment of college or associate's degree enjoy the highest average annual earnings of $75,931, while those with college or associate's degree education earn the least with $75,931. Women with an educational attainment of high school diploma earn the most with the average annual earnings of $90,313, while those with college or associate's degree education have the smallest earnings of $45,163.
| Educational Attainment | Male Income | Female Income |
| Less than High School | - | - |
| High School Diploma | - | - |
| College or Associate's Degree | $75,931 | $45,163 |
| Bachelor's Degree | - | - |
| Graduate Degree | - | - |
| Total | $46,767 | $51,563 |
Family Income in New Egypt
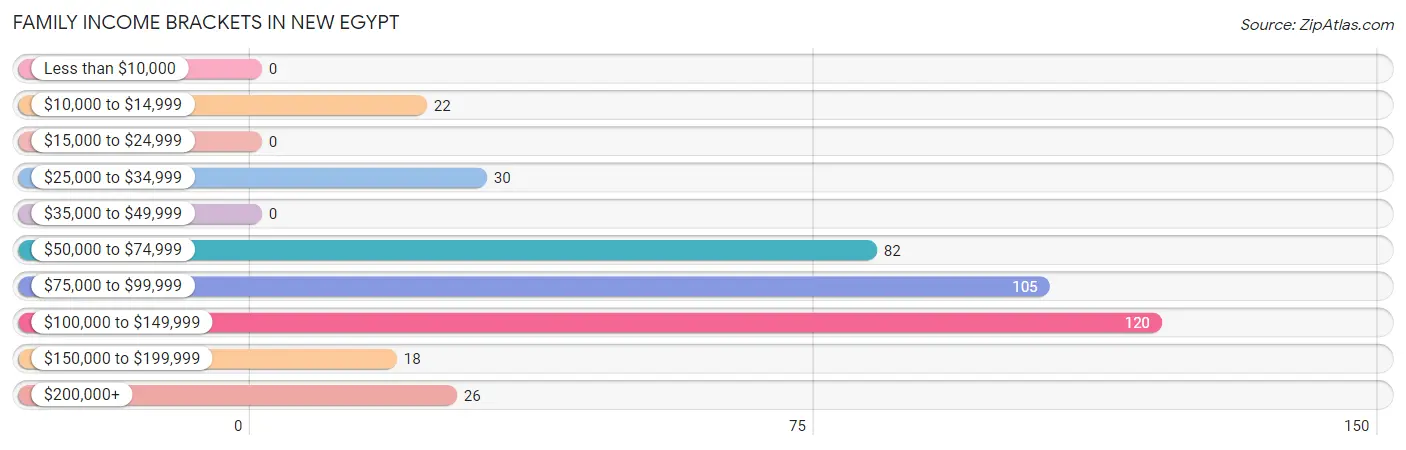
Family Income Brackets in New Egypt
According to the New Egypt family income data, there are 120 families falling into the $100,000 to $149,999 income range, which is the most common income bracket and makes up 29.8% of all families.
| Income Bracket | # Families | % Families |
| Less than $10,000 | 0 | 0.0% |
| $10,000 to $14,999 | 22 | 5.5% |
| $15,000 to $24,999 | 0 | 0.0% |
| $25,000 to $34,999 | 30 | 7.4% |
| $35,000 to $49,999 | 0 | 0.0% |
| $50,000 to $74,999 | 82 | 20.3% |
| $75,000 to $99,999 | 105 | 26.1% |
| $100,000 to $149,999 | 120 | 29.8% |
| $150,000 to $199,999 | 18 | 4.5% |
| $200,000+ | 26 | 6.5% |
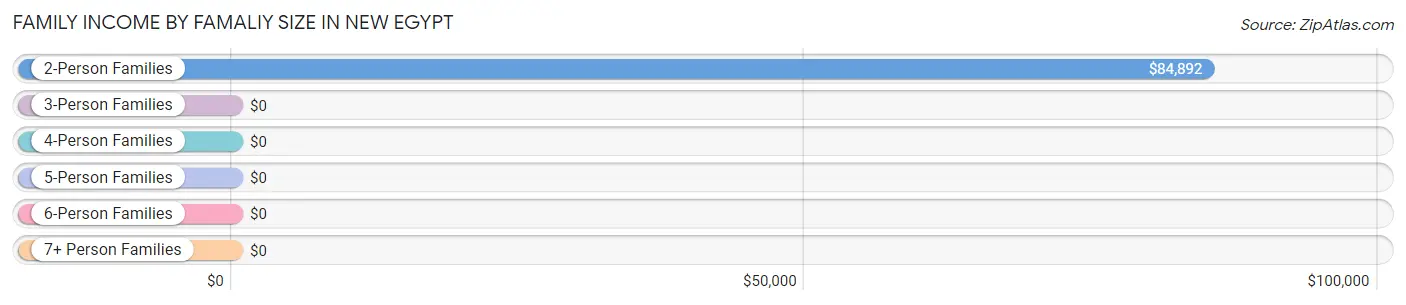
Family Income by Famaliy Size in New Egypt
2-person families (235 | 58.3%) account for the highest median family income in New Egypt with $84,892 per family, while 2-person families (235 | 58.3%) have the highest median income of $42,446 per family member.
| Income Bracket | # Families | Median Income |
| 2-Person Families | 235 (58.3%) | $84,892 |
| 3-Person Families | 131 (32.5%) | $0 |
| 4-Person Families | 0 (0.0%) | $0 |
| 5-Person Families | 18 (4.5%) | $0 |
| 6-Person Families | 19 (4.7%) | $0 |
| 7+ Person Families | 0 (0.0%) | $0 |
| Total | 403 (100.0%) | $86,080 |
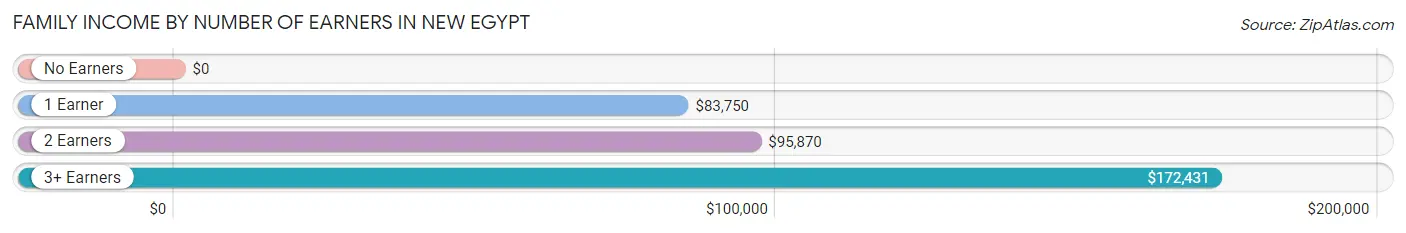
Family Income by Number of Earners in New Egypt
| Number of Earners | # Families | Median Income |
| No Earners | 22 (5.5%) | $0 |
| 1 Earner | 142 (35.2%) | $83,750 |
| 2 Earners | 200 (49.6%) | $95,870 |
| 3+ Earners | 39 (9.7%) | $172,431 |
| Total | 403 (100.0%) | $86,080 |
Household Income in New Egypt
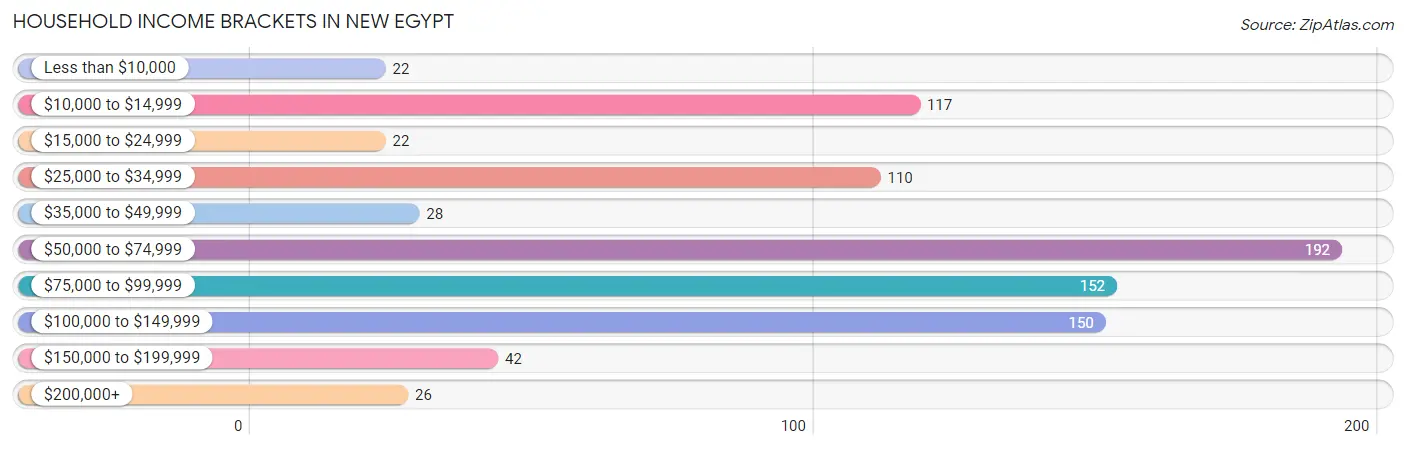
Household Income Brackets in New Egypt
With 192 households falling in the category, the $50,000 to $74,999 income range is the most frequent in New Egypt, accounting for 22.3% of all households. In contrast, only 22 households (2.6%) fall into the less than $10,000 income bracket, making it the least populous group.
| Income Bracket | # Households | % Households |
| Less than $10,000 | 22 | 2.6% |
| $10,000 to $14,999 | 117 | 13.6% |
| $15,000 to $24,999 | 22 | 2.6% |
| $25,000 to $34,999 | 110 | 12.8% |
| $35,000 to $49,999 | 28 | 3.3% |
| $50,000 to $74,999 | 192 | 22.3% |
| $75,000 to $99,999 | 152 | 17.7% |
| $100,000 to $149,999 | 150 | 17.4% |
| $150,000 to $199,999 | 42 | 4.9% |
| $200,000+ | 26 | 3.0% |
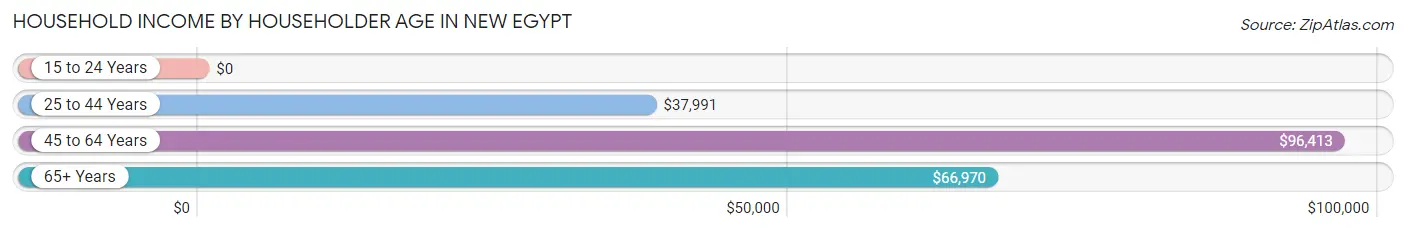
Household Income by Householder Age in New Egypt
The median household income in New Egypt is $70,060, with the highest median household income of $96,413 found in the 45 to 64 years age bracket for the primary householder. A total of 302 households (35.1%) fall into this category. Meanwhile, the 15 to 24 years age bracket for the primary householder has the lowest median household income of $0, with 28 households (3.3%) in this group.
| Income Bracket | # Households | Median Income |
| 15 to 24 Years | 28 (3.3%) | $0 |
| 25 to 44 Years | 249 (28.9%) | $37,991 |
| 45 to 64 Years | 302 (35.1%) | $96,413 |
| 65+ Years | 282 (32.8%) | $66,970 |
| Total | 861 (100.0%) | $70,060 |
Poverty in New Egypt
Income Below Poverty by Sex and Age in New Egypt
With 12.8% poverty level for males and 13.8% for females among the residents of New Egypt, 6 to 11 year old males and 18 to 24 year old females are the most vulnerable to poverty, with 20 males (100.0%) and 28 females (100.0%) in their respective age groups living below the poverty level.
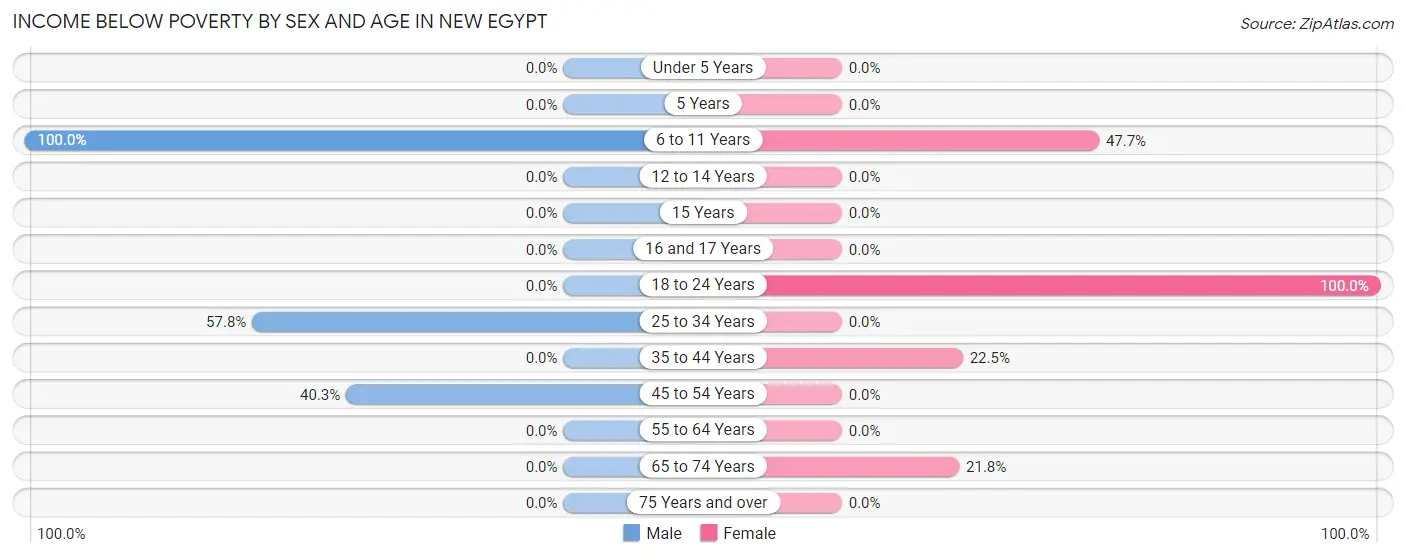
| Age Bracket | Male | Female |
| Under 5 Years | 0 (0.0%) | 0 (0.0%) |
| 5 Years | 0 (0.0%) | 0 (0.0%) |
| 6 to 11 Years | 20 (100.0%) | 21 (47.7%) |
| 12 to 14 Years | 0 (0.0%) | 0 (0.0%) |
| 15 Years | 0 (0.0%) | 0 (0.0%) |
| 16 and 17 Years | 0 (0.0%) | 0 (0.0%) |
| 18 to 24 Years | 0 (0.0%) | 28 (100.0%) |
| 25 to 34 Years | 67 (57.8%) | 0 (0.0%) |
| 35 to 44 Years | 0 (0.0%) | 22 (22.5%) |
| 45 to 54 Years | 25 (40.3%) | 0 (0.0%) |
| 55 to 64 Years | 0 (0.0%) | 0 (0.0%) |
| 65 to 74 Years | 0 (0.0%) | 22 (21.8%) |
| 75 Years and over | 0 (0.0%) | 0 (0.0%) |
| Total | 112 (12.8%) | 93 (13.8%) |
Income Above Poverty by Sex and Age in New Egypt
According to the poverty statistics in New Egypt, males aged under 5 years and females aged 12 to 14 years are the age groups that are most secure financially, with 100.0% of males and 100.0% of females in these age groups living above the poverty line.
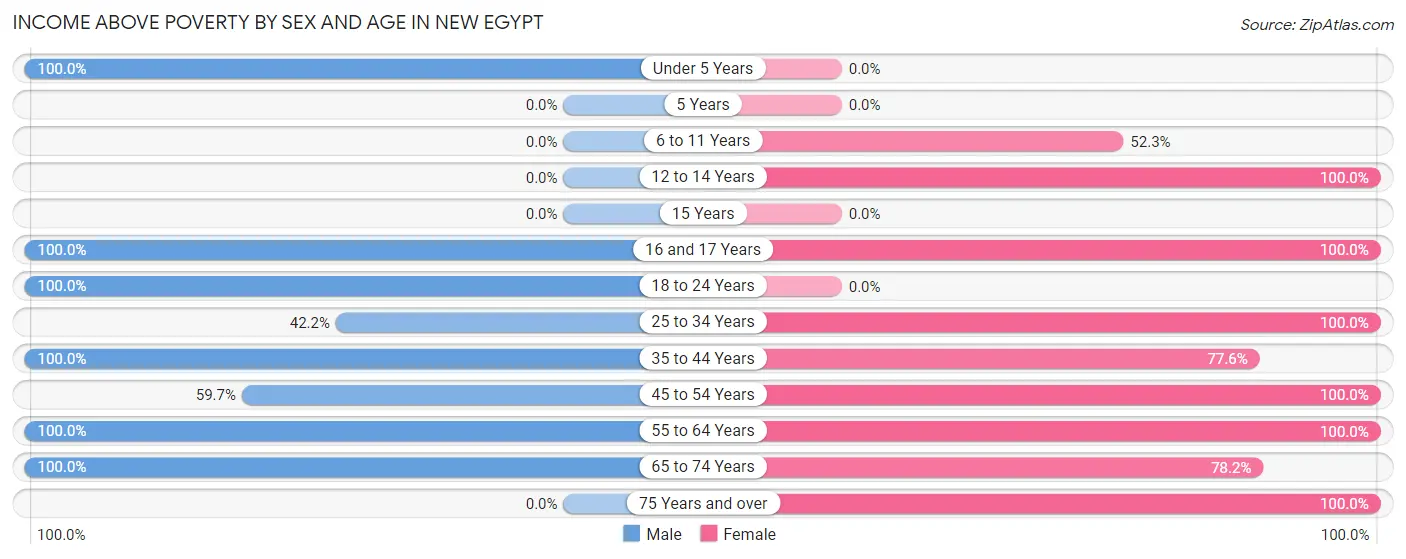
| Age Bracket | Male | Female |
| Under 5 Years | 30 (100.0%) | 0 (0.0%) |
| 5 Years | 0 (0.0%) | 0 (0.0%) |
| 6 to 11 Years | 0 (0.0%) | 23 (52.3%) |
| 12 to 14 Years | 0 (0.0%) | 16 (100.0%) |
| 15 Years | 0 (0.0%) | 0 (0.0%) |
| 16 and 17 Years | 52 (100.0%) | 22 (100.0%) |
| 18 to 24 Years | 117 (100.0%) | 0 (0.0%) |
| 25 to 34 Years | 49 (42.2%) | 79 (100.0%) |
| 35 to 44 Years | 64 (100.0%) | 76 (77.5%) |
| 45 to 54 Years | 37 (59.7%) | 58 (100.0%) |
| 55 to 64 Years | 176 (100.0%) | 165 (100.0%) |
| 65 to 74 Years | 239 (100.0%) | 79 (78.2%) |
| 75 Years and over | 0 (0.0%) | 65 (100.0%) |
| Total | 764 (87.2%) | 583 (86.2%) |
Income Below Poverty Among Married-Couple Families in New Egypt
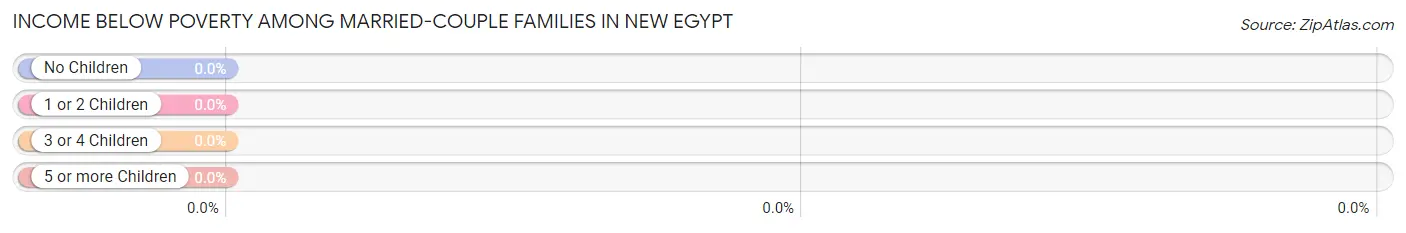
| Children | Above Poverty | Below Poverty |
| No Children | 197 (100.0%) | 0 (0.0%) |
| 1 or 2 Children | 75 (100.0%) | 0 (0.0%) |
| 3 or 4 Children | 0 (0.0%) | 0 (0.0%) |
| 5 or more Children | 0 (0.0%) | 0 (0.0%) |
| Total | 272 (100.0%) | 0 (0.0%) |
Income Below Poverty Among Single-Parent Households in New Egypt
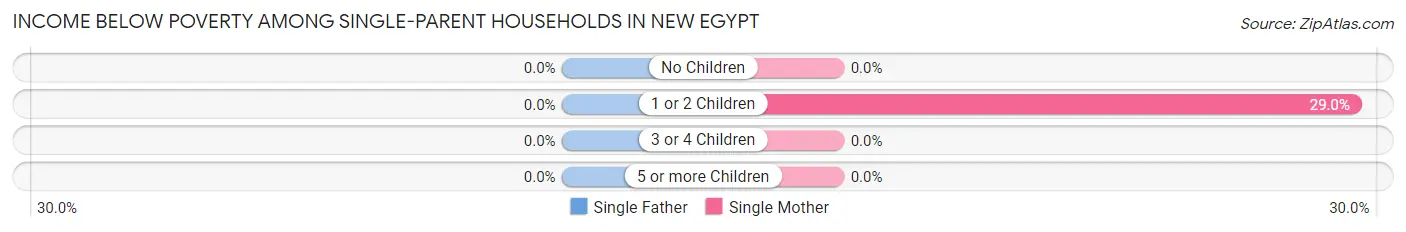
| Children | Single Father | Single Mother |
| No Children | 0 (0.0%) | 0 (0.0%) |
| 1 or 2 Children | 0 (0.0%) | 22 (28.9%) |
| 3 or 4 Children | 0 (0.0%) | 0 (0.0%) |
| 5 or more Children | 0 (0.0%) | 0 (0.0%) |
| Total | 0 (0.0%) | 22 (19.8%) |
Income Below Poverty Among Married-Couple vs Single-Parent Households in New Egypt
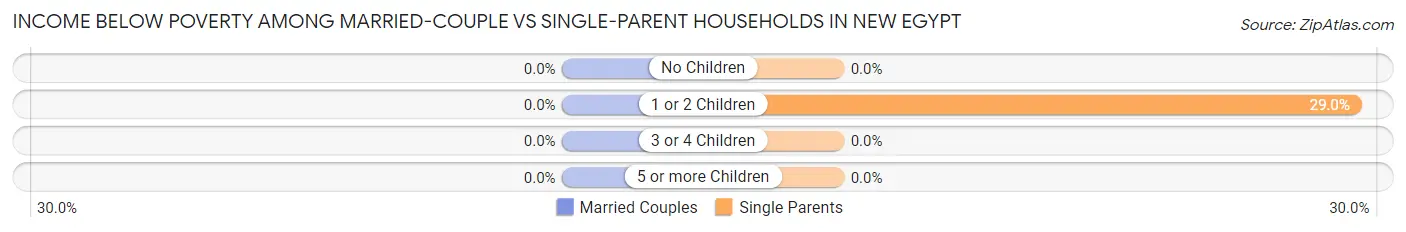
| Children | Married-Couple Families | Single-Parent Households |
| No Children | 0 (0.0%) | 0 (0.0%) |
| 1 or 2 Children | 0 (0.0%) | 22 (28.9%) |
| 3 or 4 Children | 0 (0.0%) | 0 (0.0%) |
| 5 or more Children | 0 (0.0%) | 0 (0.0%) |
| Total | 0 (0.0%) | 22 (16.8%) |
Race in New Egypt
The most populous races in New Egypt are , and White / Caucasian (1,552 | 100.0%).
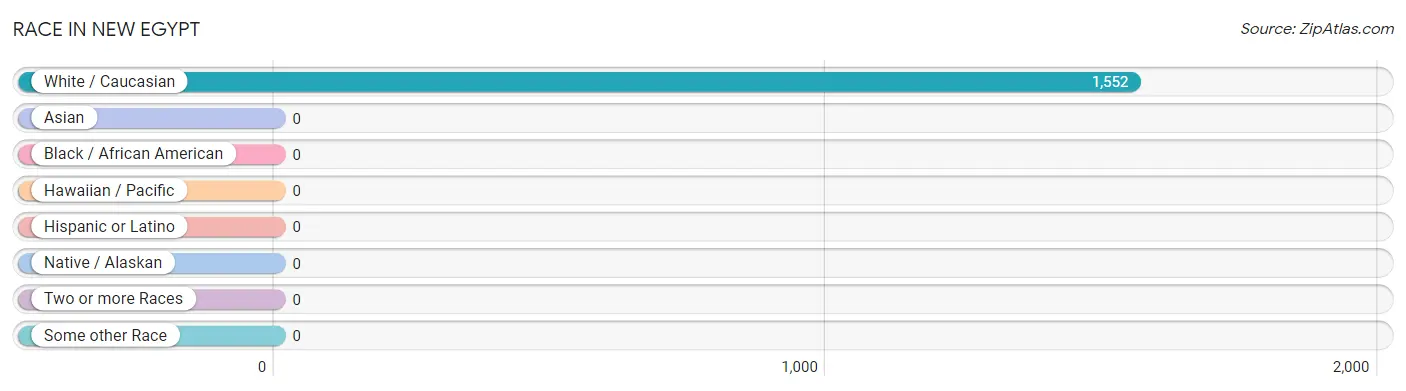
| Race | # Population | % Population |
| Asian | 0 | 0.0% |
| Black / African American | 0 | 0.0% |
| Hawaiian / Pacific | 0 | 0.0% |
| Hispanic or Latino | 0 | 0.0% |
| Native / Alaskan | 0 | 0.0% |
| White / Caucasian | 1,552 | 100.0% |
| Two or more Races | 0 | 0.0% |
| Some other Race | 0 | 0.0% |
| Total | 1,552 | 100.0% |
Ancestry in New Egypt
The most populous ancestries reported in New Egypt are Irish (633 | 40.8%), Italian (437 | 28.2%), German (178 | 11.5%), Dutch (176 | 11.3%), and English (129 | 8.3%), together accounting for 100.1% of all New Egypt residents.
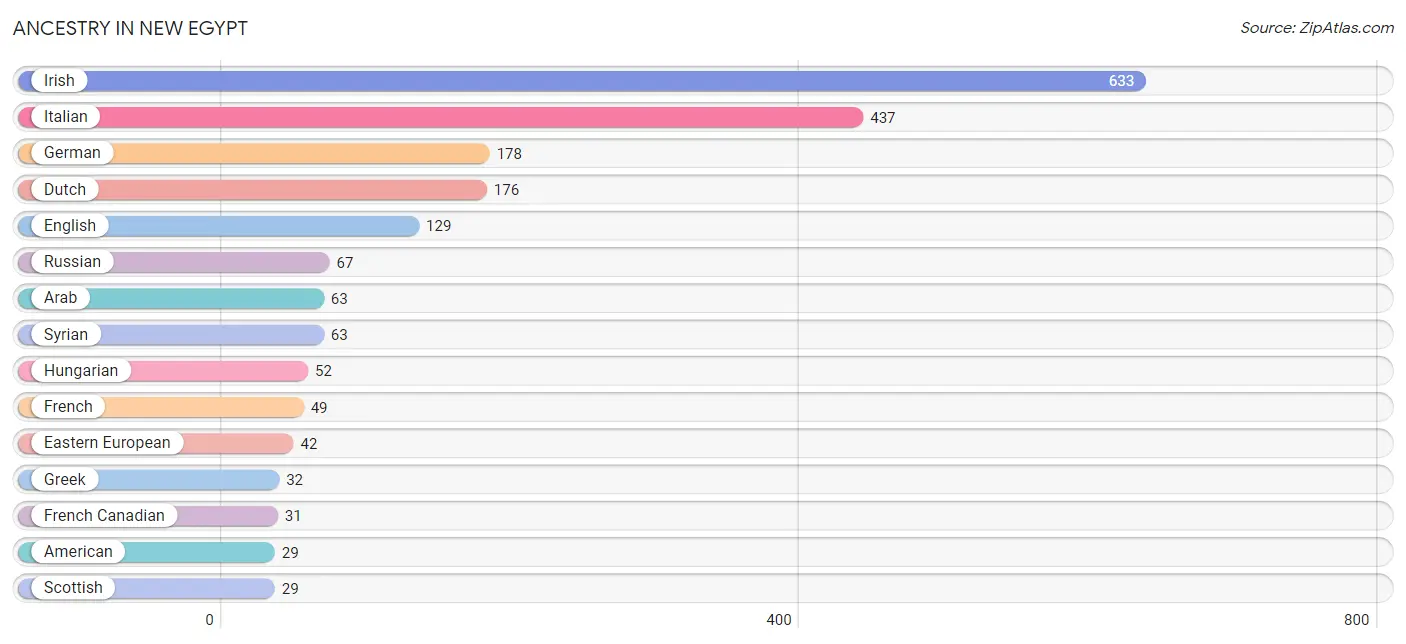
| Ancestry | # Population | % Population |
| American | 29 | 1.9% |
| Arab | 63 | 4.1% |
| Dutch | 176 | 11.3% |
| Eastern European | 42 | 2.7% |
| English | 129 | 8.3% |
| French | 49 | 3.2% |
| French Canadian | 31 | 2.0% |
| German | 178 | 11.5% |
| Greek | 32 | 2.1% |
| Hungarian | 52 | 3.4% |
| Irish | 633 | 40.8% |
| Italian | 437 | 28.2% |
| Northern European | 24 | 1.5% |
| Russian | 67 | 4.3% |
| Scottish | 29 | 1.9% |
| Syrian | 63 | 4.1% | View All 16 Rows |
Immigrants in New Egypt
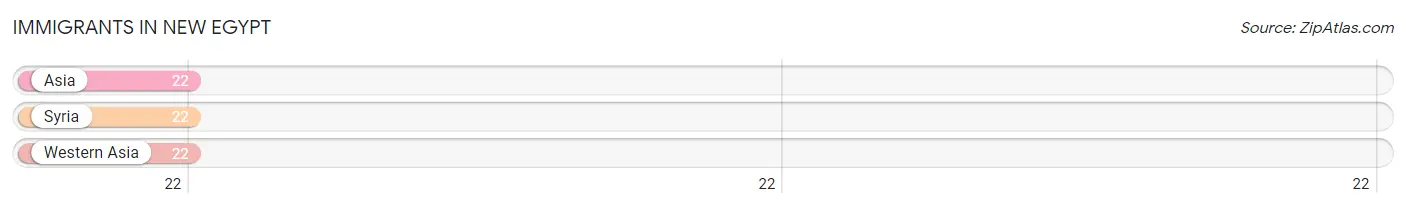
The most numerous immigrant groups reported in New Egypt came from Asia (22 | 1.4%), Syria (22 | 1.4%), and Western Asia (22 | 1.4%), together accounting for 4.3% of all New Egypt residents.
| Immigration Origin | # Population | % Population |
| Asia | 22 | 1.4% |
| Syria | 22 | 1.4% |
| Western Asia | 22 | 1.4% | View All 3 Rows |
Sex and Age in New Egypt
Sex and Age in New Egypt
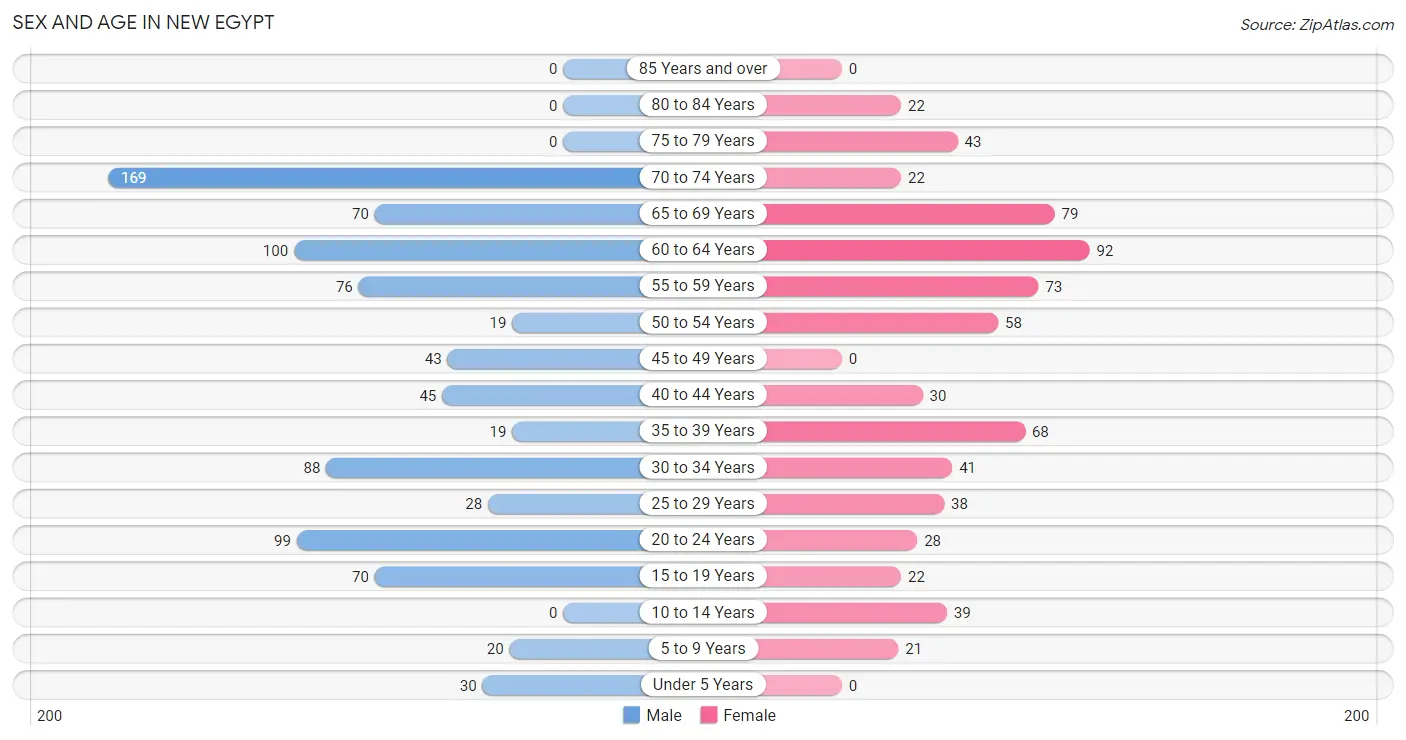
The most populous age groups in New Egypt are 70 to 74 Years (169 | 19.3%) for men and 60 to 64 Years (92 | 13.6%) for women.
| Age Bracket | Male | Female |
| Under 5 Years | 30 (3.4%) | 0 (0.0%) |
| 5 to 9 Years | 20 (2.3%) | 21 (3.1%) |
| 10 to 14 Years | 0 (0.0%) | 39 (5.8%) |
| 15 to 19 Years | 70 (8.0%) | 22 (3.3%) |
| 20 to 24 Years | 99 (11.3%) | 28 (4.1%) |
| 25 to 29 Years | 28 (3.2%) | 38 (5.6%) |
| 30 to 34 Years | 88 (10.1%) | 41 (6.1%) |
| 35 to 39 Years | 19 (2.2%) | 68 (10.1%) |
| 40 to 44 Years | 45 (5.1%) | 30 (4.4%) |
| 45 to 49 Years | 43 (4.9%) | 0 (0.0%) |
| 50 to 54 Years | 19 (2.2%) | 58 (8.6%) |
| 55 to 59 Years | 76 (8.7%) | 73 (10.8%) |
| 60 to 64 Years | 100 (11.4%) | 92 (13.6%) |
| 65 to 69 Years | 70 (8.0%) | 79 (11.7%) |
| 70 to 74 Years | 169 (19.3%) | 22 (3.3%) |
| 75 to 79 Years | 0 (0.0%) | 43 (6.4%) |
| 80 to 84 Years | 0 (0.0%) | 22 (3.3%) |
| 85 Years and over | 0 (0.0%) | 0 (0.0%) |
| Total | 876 (100.0%) | 676 (100.0%) |
Families and Households in New Egypt
Median Family Size in New Egypt
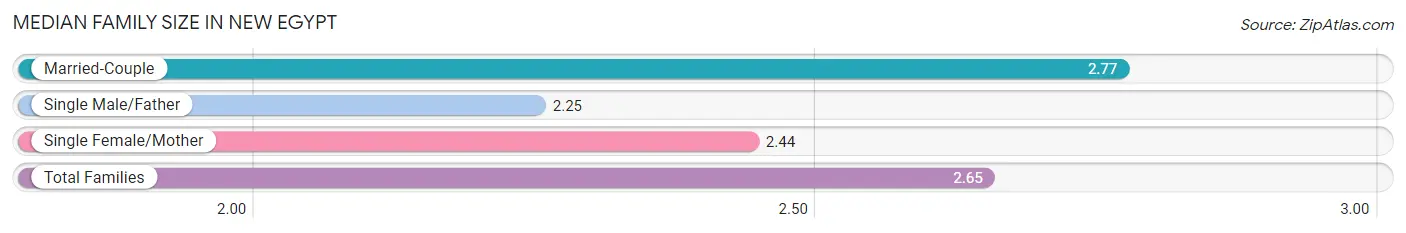
The median family size in New Egypt is 2.65 persons per family, with married-couple families (272 | 67.5%) accounting for the largest median family size of 2.77 persons per family. On the other hand, single male/father families (20 | 5.0%) represent the smallest median family size with 2.25 persons per family.
| Family Type | # Families | Family Size |
| Married-Couple | 272 (67.5%) | 2.77 |
| Single Male/Father | 20 (5.0%) | 2.25 |
| Single Female/Mother | 111 (27.5%) | 2.44 |
| Total Families | 403 (100.0%) | 2.65 |
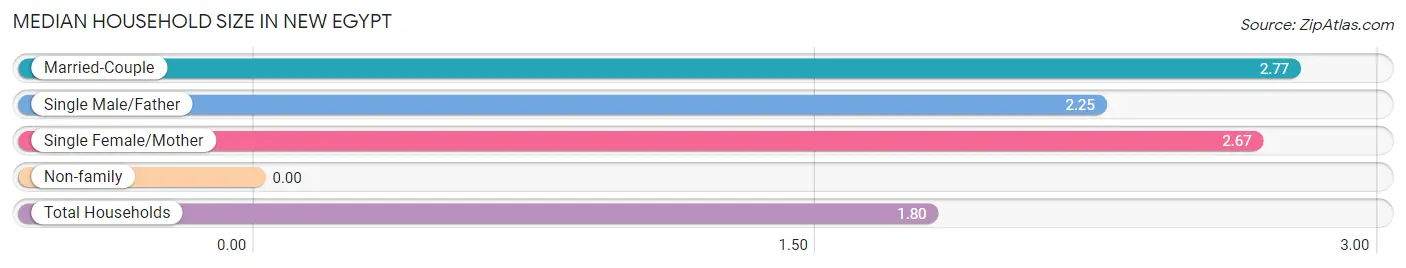
Median Household Size in New Egypt
| Household Type | # Households | Household Size |
| Married-Couple | 272 (31.6%) | 2.77 |
| Single Male/Father | 20 (2.3%) | 2.25 |
| Single Female/Mother | 111 (12.9%) | 2.67 |
| Non-family | 458 (53.2%) | - |
| Total Households | 861 (100.0%) | 1.80 |
Household Size by Marriage Status in New Egypt
Out of a total of 861 households in New Egypt, 403 (46.8%) are family households, while 458 (53.2%) are nonfamily households. The most numerous type of family households are 2-person households, comprising 235, and the most common type of nonfamily households are 1-person households, comprising 458.
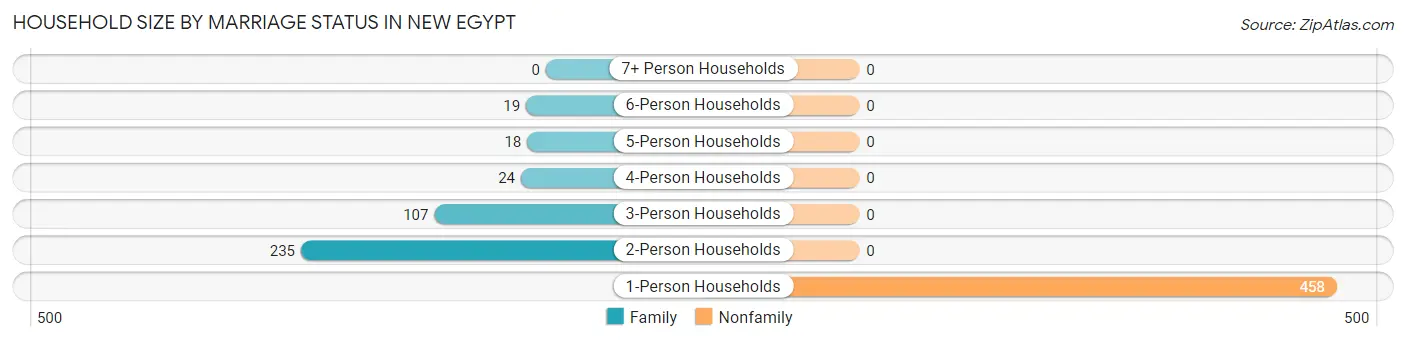
| Household Size | Family Households | Nonfamily Households |
| 1-Person Households | - | 458 (53.2%) |
| 2-Person Households | 235 (27.3%) | 0 (0.0%) |
| 3-Person Households | 107 (12.4%) | 0 (0.0%) |
| 4-Person Households | 24 (2.8%) | 0 (0.0%) |
| 5-Person Households | 18 (2.1%) | 0 (0.0%) |
| 6-Person Households | 19 (2.2%) | 0 (0.0%) |
| 7+ Person Households | 0 (0.0%) | 0 (0.0%) |
| Total | 403 (46.8%) | 458 (53.2%) |
Female Fertility in New Egypt
Fertility by Age in New Egypt
Average fertility rate in New Egypt is 156.0 births per 1,000 women. Women in the age bracket of 20 to 34 years have the highest fertility rate with 355.0 births per 1,000 women. Women in the age bracket of 20 to 34 years acount for 100.0% of all women with births.
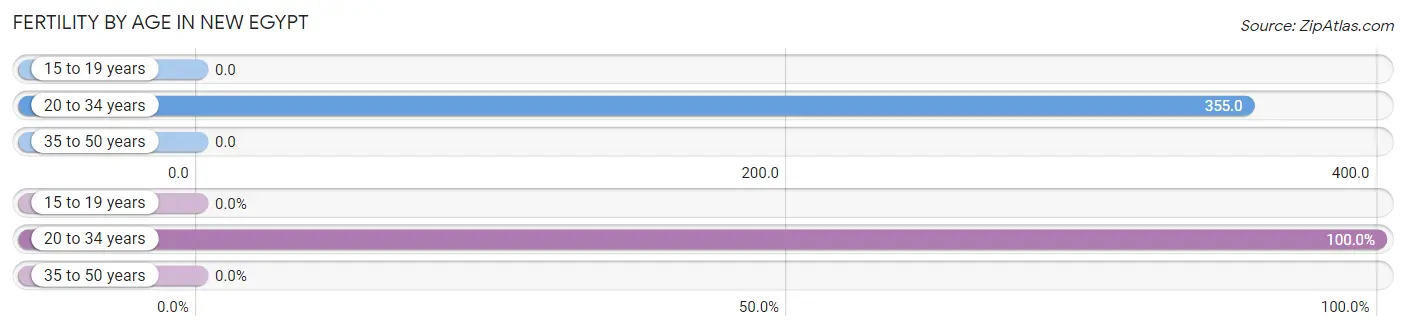
| Age Bracket | Women with Births | Births / 1,000 Women |
| 15 to 19 years | 0 (0.0%) | 0.0 |
| 20 to 34 years | 38 (100.0%) | 355.0 |
| 35 to 50 years | 0 (0.0%) | 0.0 |
| Total | 38 (100.0%) | 156.0 |
Fertility by Age by Marriage Status in New Egypt
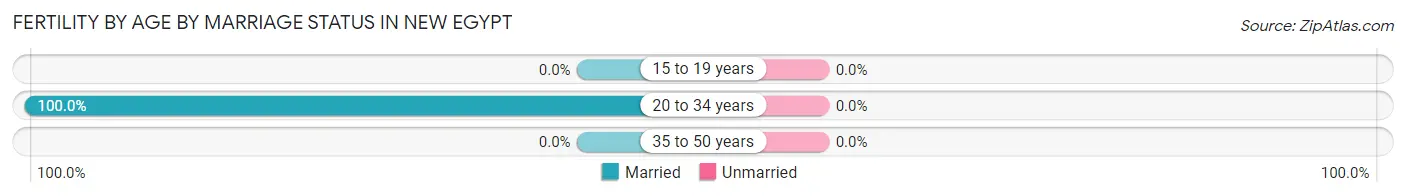
| Age Bracket | Married | Unmarried |
| 15 to 19 years | 0 (0.0%) | 0 (0.0%) |
| 20 to 34 years | 38 (100.0%) | 0 (0.0%) |
| 35 to 50 years | 0 (0.0%) | 0 (0.0%) |
| Total | 38 (100.0%) | 0 (0.0%) |
Fertility by Education in New Egypt
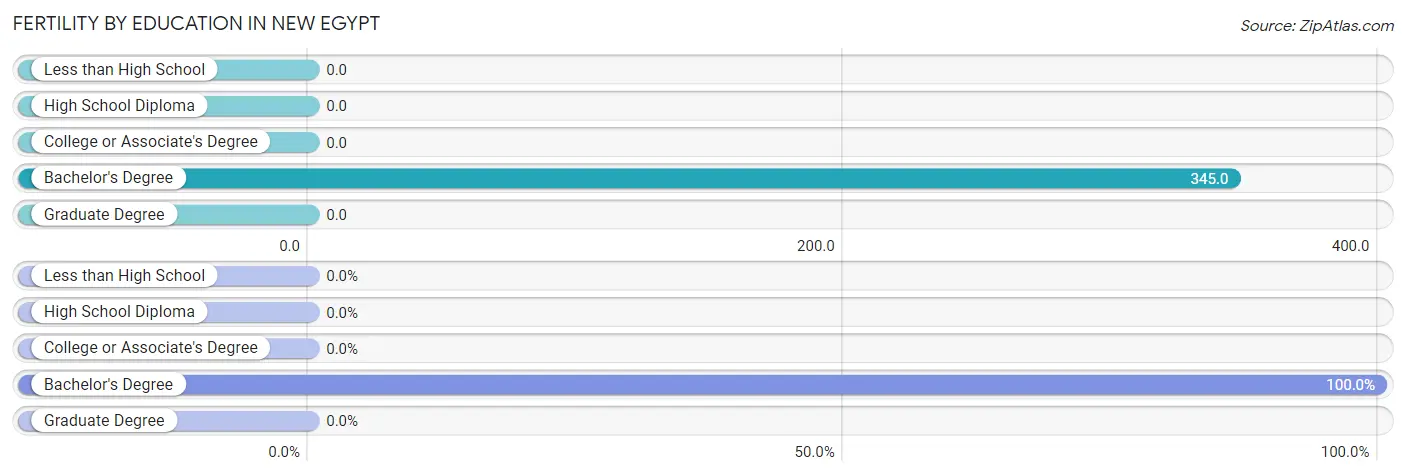
| Educational Attainment | Women with Births | Births / 1,000 Women |
| Less than High School | 0 (0.0%) | 0.0 |
| High School Diploma | 0 (0.0%) | 0.0 |
| College or Associate's Degree | 0 (0.0%) | 0.0 |
| Bachelor's Degree | 38 (100.0%) | 345.0 |
| Graduate Degree | 0 (0.0%) | 0.0 |
| Total | 38 (100.0%) | 156.0 |
Fertility by Education by Marriage Status in New Egypt
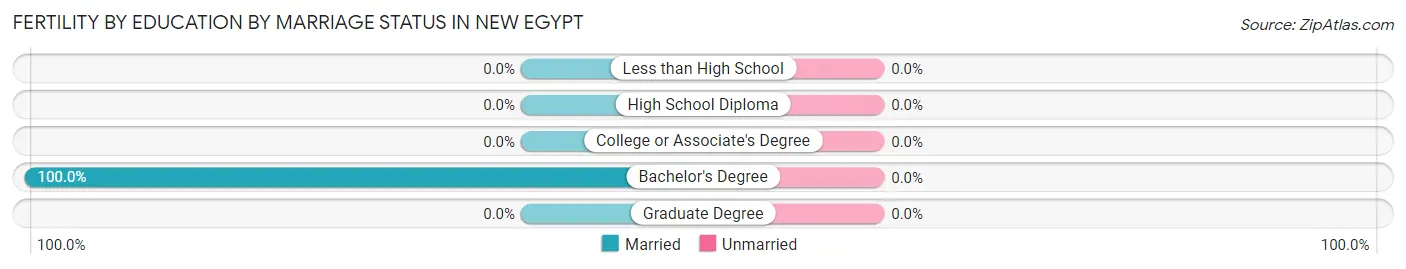
| Educational Attainment | Married | Unmarried |
| Less than High School | 0 (0.0%) | 0 (0.0%) |
| High School Diploma | 0 (0.0%) | 0 (0.0%) |
| College or Associate's Degree | 0 (0.0%) | 0 (0.0%) |
| Bachelor's Degree | 38 (100.0%) | 0 (0.0%) |
| Graduate Degree | 0 (0.0%) | 0 (0.0%) |
| Total | 38 (100.0%) | 0 (0.0%) |
Employment Characteristics in New Egypt
Employment by Class of Employer in New Egypt
Among the 898 employed individuals in New Egypt, private company employees (480 | 53.4%), not-for-profit organizations (249 | 27.7%), and local government employees (67 | 7.5%) make up the most common classes of employment.
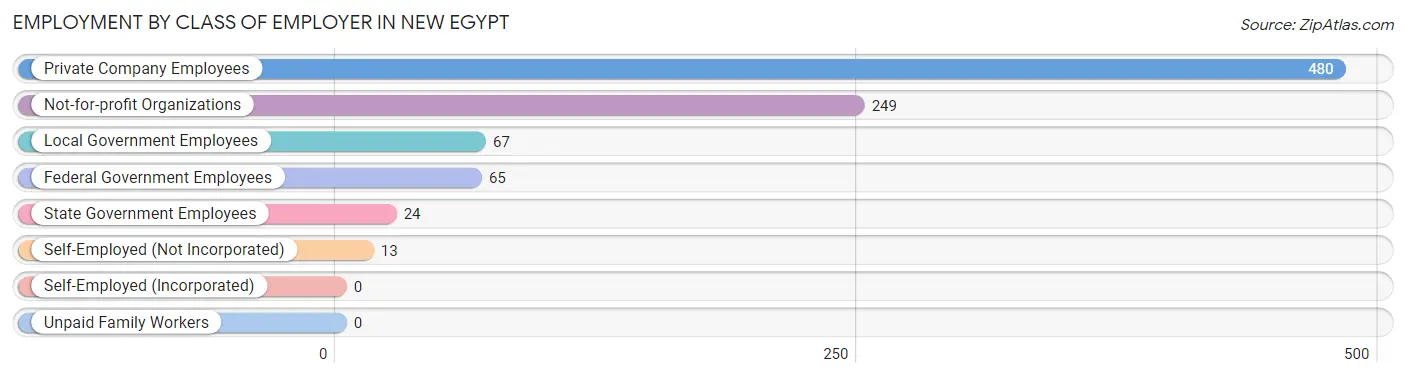
| Employer Class | # Employees | % Employees |
| Private Company Employees | 480 | 53.4% |
| Self-Employed (Incorporated) | 0 | 0.0% |
| Self-Employed (Not Incorporated) | 13 | 1.5% |
| Not-for-profit Organizations | 249 | 27.7% |
| Local Government Employees | 67 | 7.5% |
| State Government Employees | 24 | 2.7% |
| Federal Government Employees | 65 | 7.2% |
| Unpaid Family Workers | 0 | 0.0% |
| Total | 898 | 100.0% |
Employment Status by Age in New Egypt
According to the labor force statistics for New Egypt, out of the total population over 16 years of age (1,442), 66.7% or 962 individuals are in the labor force, with 6.8% or 65 of them unemployed. The age group with the highest labor force participation rate is 20 to 24 years, with 100.0% or 127 individuals in the labor force. Within the labor force, the 55 to 59 years age range has the highest percentage of unemployed individuals, with 19.4% or 20 of them being unemployed.
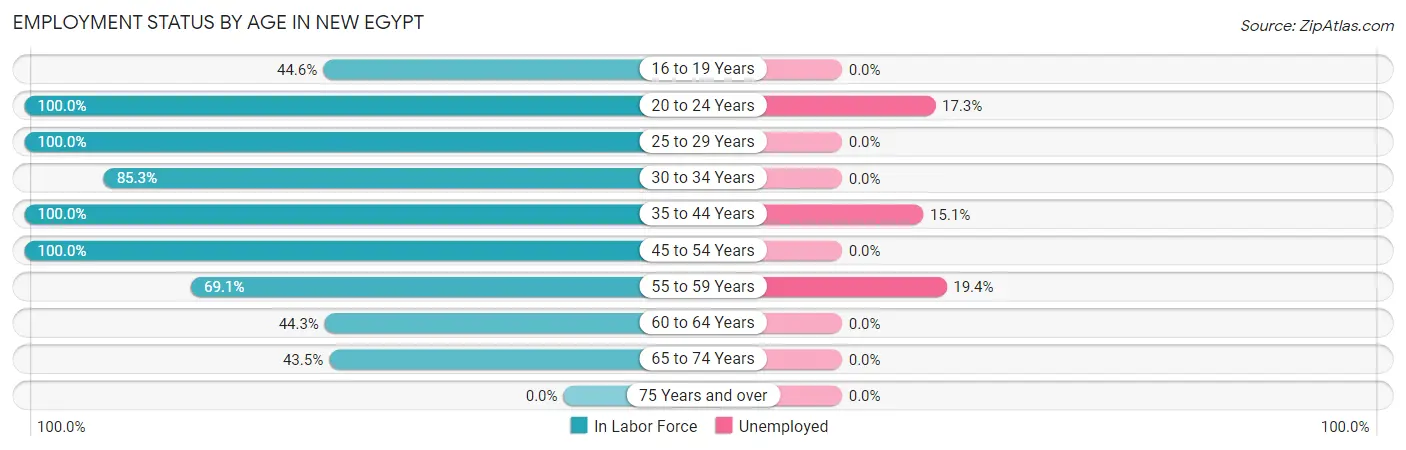
| Age Bracket | In Labor Force | Unemployed |
| 16 to 19 Years | 41 (44.6%) | 0 (0.0%) |
| 20 to 24 Years | 127 (100.0%) | 22 (17.3%) |
| 25 to 29 Years | 66 (100.0%) | 0 (0.0%) |
| 30 to 34 Years | 110 (85.3%) | 0 (0.0%) |
| 35 to 44 Years | 162 (100.0%) | 24 (15.1%) |
| 45 to 54 Years | 120 (100.0%) | 0 (0.0%) |
| 55 to 59 Years | 103 (69.1%) | 20 (19.4%) |
| 60 to 64 Years | 85 (44.3%) | 0 (0.0%) |
| 65 to 74 Years | 148 (43.5%) | 0 (0.0%) |
| 75 Years and over | 0 (0.0%) | 0 (0.0%) |
| Total | 962 (66.7%) | 65 (6.8%) |
Employment Status by Educational Attainment in New Egypt
According to labor force statistics for New Egypt, 79.0% of individuals (646) out of the total population between 25 and 64 years of age (818) are in the labor force, with 6.7% or 43 of them being unemployed. The group with the highest labor force participation rate are those with the educational attainment of less than high school, with 100.0% or 58 individuals in the labor force. Within the labor force, individuals with high school diploma education have the highest percentage of unemployment, with 13.9% or 20 of them being unemployed.
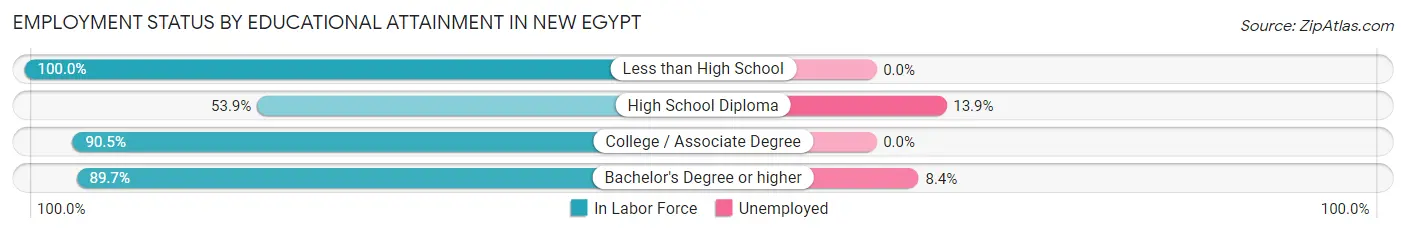
| Educational Attainment | In Labor Force | Unemployed |
| Less than High School | 58 (100.0%) | 0 (0.0%) |
| High School Diploma | 144 (53.9%) | 37 (13.9%) |
| College / Associate Degree | 182 (90.5%) | 0 (0.0%) |
| Bachelor's Degree or higher | 262 (89.7%) | 25 (8.4%) |
| Total | 646 (79.0%) | 55 (6.7%) |
Employment Occupations by Sex in New Egypt
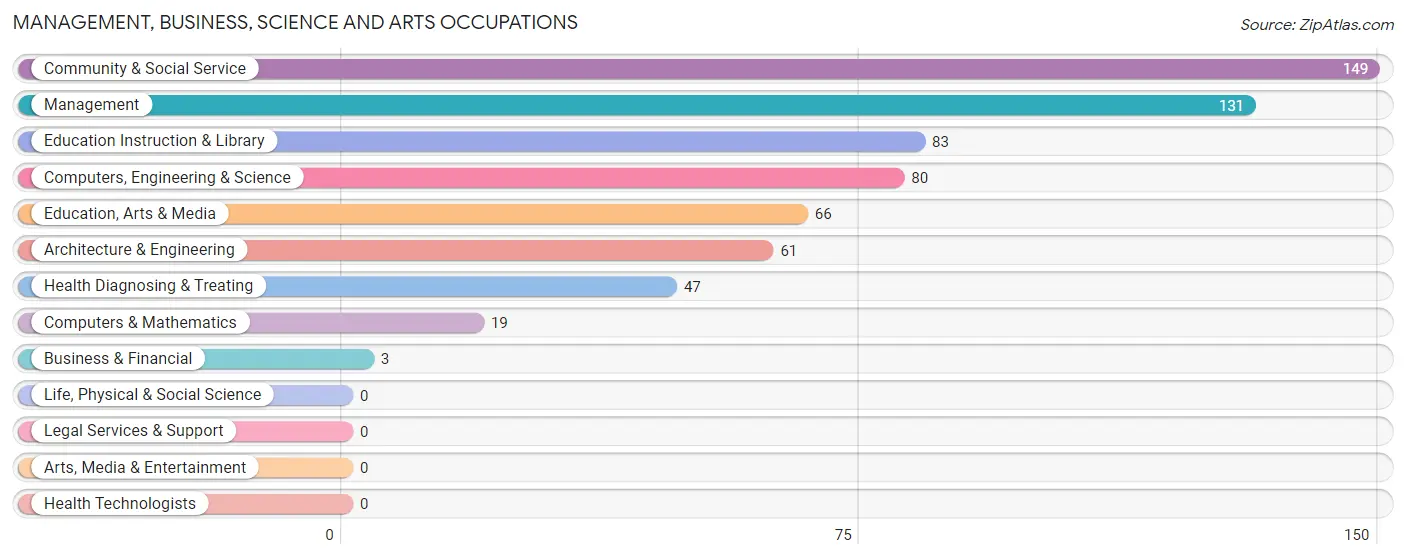
Management, Business, Science and Arts Occupations
The most common Management, Business, Science and Arts occupations in New Egypt are Community & Social Service (149 | 16.9%), Management (131 | 14.8%), Education Instruction & Library (83 | 9.4%), Computers, Engineering & Science (80 | 9.1%), and Education, Arts & Media (66 | 7.5%).
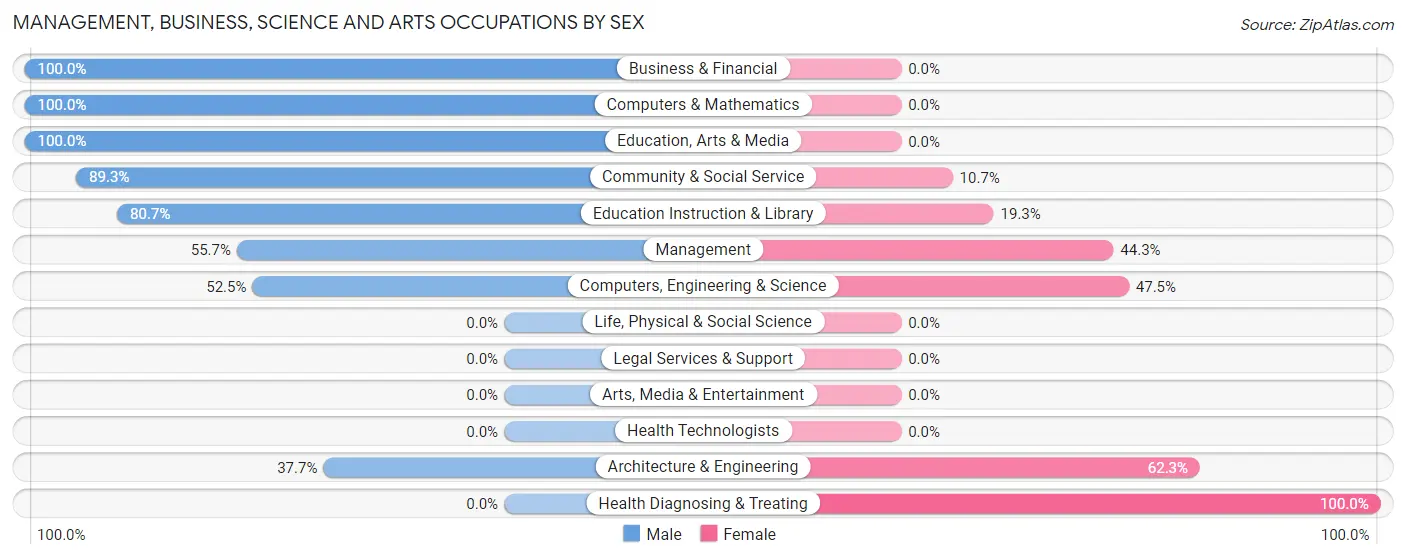
Management, Business, Science and Arts Occupations by Sex
Within the Management, Business, Science and Arts occupations in New Egypt, the most male-oriented occupations are Business & Financial (100.0%), Computers & Mathematics (100.0%), and Education, Arts & Media (100.0%), while the most female-oriented occupations are Health Diagnosing & Treating (100.0%), Architecture & Engineering (62.3%), and Computers, Engineering & Science (47.5%).
| Occupation | Male | Female |
| Management | 73 (55.7%) | 58 (44.3%) |
| Business & Financial | 3 (100.0%) | 0 (0.0%) |
| Computers, Engineering & Science | 42 (52.5%) | 38 (47.5%) |
| Computers & Mathematics | 19 (100.0%) | 0 (0.0%) |
| Architecture & Engineering | 23 (37.7%) | 38 (62.3%) |
| Life, Physical & Social Science | 0 (0.0%) | 0 (0.0%) |
| Community & Social Service | 133 (89.3%) | 16 (10.7%) |
| Education, Arts & Media | 66 (100.0%) | 0 (0.0%) |
| Legal Services & Support | 0 (0.0%) | 0 (0.0%) |
| Education Instruction & Library | 67 (80.7%) | 16 (19.3%) |
| Arts, Media & Entertainment | 0 (0.0%) | 0 (0.0%) |
| Health Diagnosing & Treating | 0 (0.0%) | 47 (100.0%) |
| Health Technologists | 0 (0.0%) | 0 (0.0%) |
| Total (Category) | 251 (61.2%) | 159 (38.8%) |
| Total (Overall) | 525 (59.5%) | 357 (40.5%) |
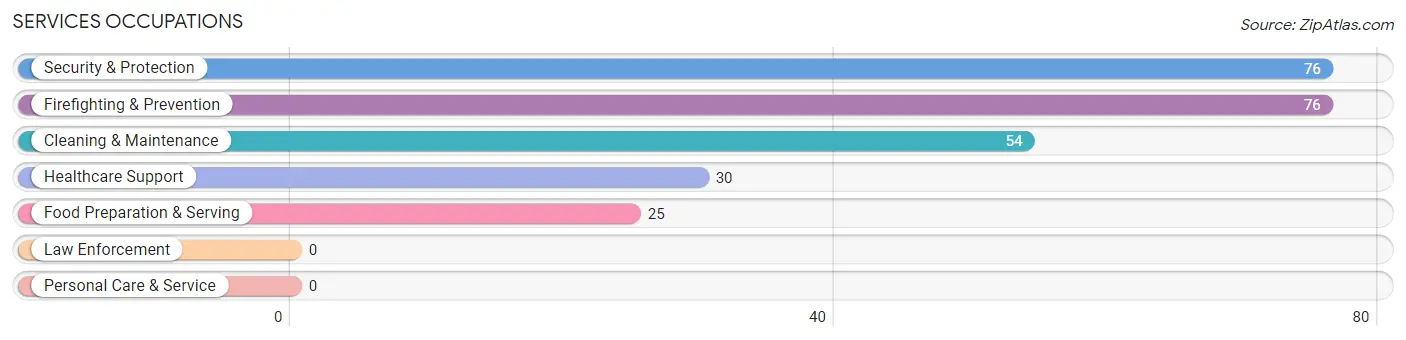
Services Occupations
The most common Services occupations in New Egypt are Security & Protection (76 | 8.6%), Firefighting & Prevention (76 | 8.6%), Cleaning & Maintenance (54 | 6.1%), Healthcare Support (30 | 3.4%), and Food Preparation & Serving (25 | 2.8%).
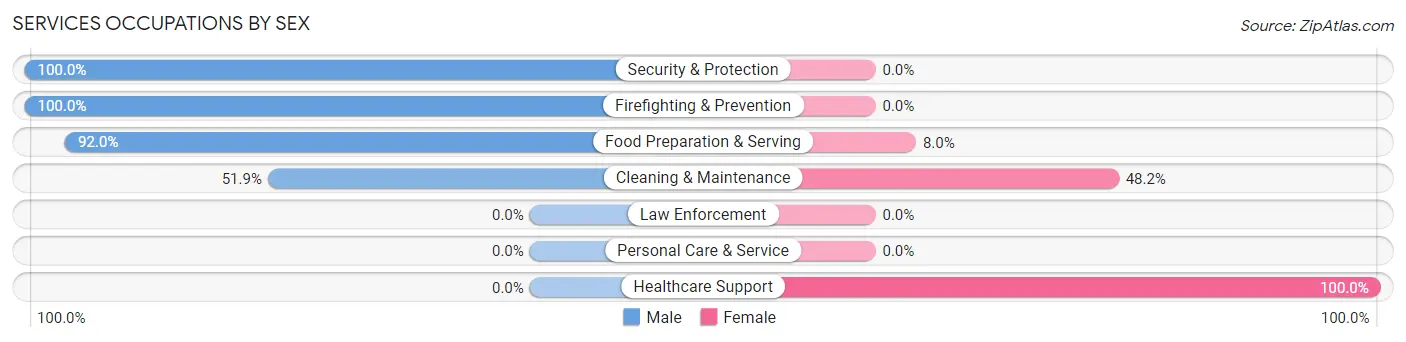
Services Occupations by Sex
Within the Services occupations in New Egypt, the most male-oriented occupations are Security & Protection (100.0%), Firefighting & Prevention (100.0%), and Food Preparation & Serving (92.0%), while the most female-oriented occupations are Healthcare Support (100.0%), Cleaning & Maintenance (48.1%), and Food Preparation & Serving (8.0%).
| Occupation | Male | Female |
| Healthcare Support | 0 (0.0%) | 30 (100.0%) |
| Security & Protection | 76 (100.0%) | 0 (0.0%) |
| Firefighting & Prevention | 76 (100.0%) | 0 (0.0%) |
| Law Enforcement | 0 (0.0%) | 0 (0.0%) |
| Food Preparation & Serving | 23 (92.0%) | 2 (8.0%) |
| Cleaning & Maintenance | 28 (51.8%) | 26 (48.1%) |
| Personal Care & Service | 0 (0.0%) | 0 (0.0%) |
| Total (Category) | 127 (68.6%) | 58 (31.4%) |
| Total (Overall) | 525 (59.5%) | 357 (40.5%) |
Sales and Office Occupations
The most common Sales and Office occupations in New Egypt are , and Office & Administration (164 | 18.6%).
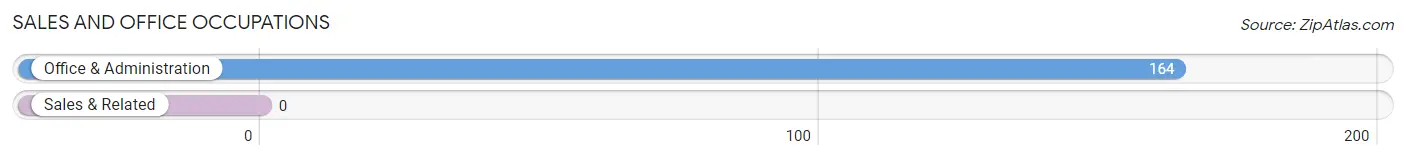
Sales and Office Occupations by Sex
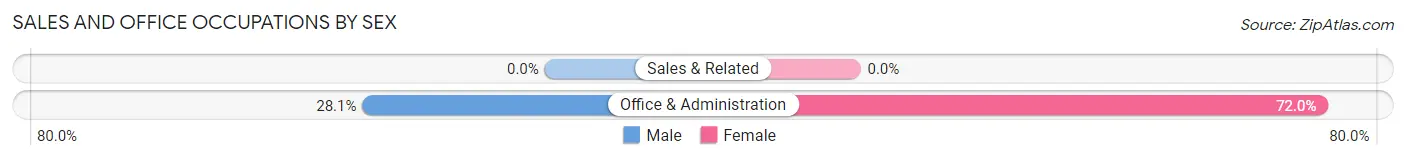
| Occupation | Male | Female |
| Sales & Related | 0 (0.0%) | 0 (0.0%) |
| Office & Administration | 46 (28.1%) | 118 (72.0%) |
| Total (Category) | 46 (28.1%) | 118 (72.0%) |
| Total (Overall) | 525 (59.5%) | 357 (40.5%) |
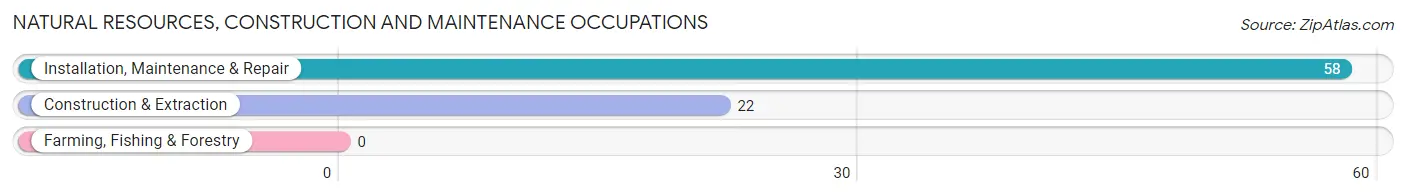
Natural Resources, Construction and Maintenance Occupations
The most common Natural Resources, Construction and Maintenance occupations in New Egypt are Installation, Maintenance & Repair (58 | 6.6%), and Construction & Extraction (22 | 2.5%).
Natural Resources, Construction and Maintenance Occupations by Sex
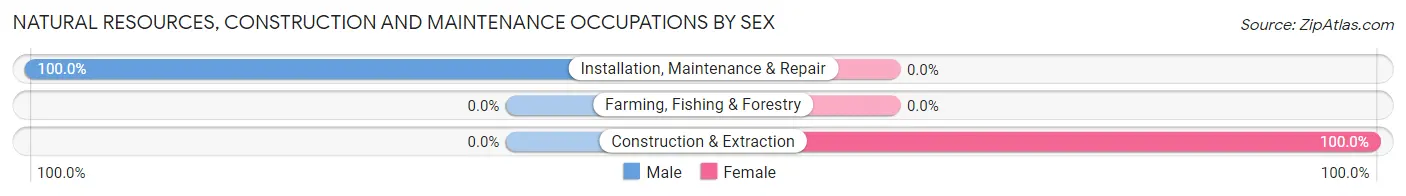
| Occupation | Male | Female |
| Farming, Fishing & Forestry | 0 (0.0%) | 0 (0.0%) |
| Construction & Extraction | 0 (0.0%) | 22 (100.0%) |
| Installation, Maintenance & Repair | 58 (100.0%) | 0 (0.0%) |
| Total (Category) | 58 (72.5%) | 22 (27.5%) |
| Total (Overall) | 525 (59.5%) | 357 (40.5%) |
Production, Transportation and Moving Occupations
The most common Production, Transportation and Moving occupations in New Egypt are Material Moving (25 | 2.8%), and Production (18 | 2.0%).
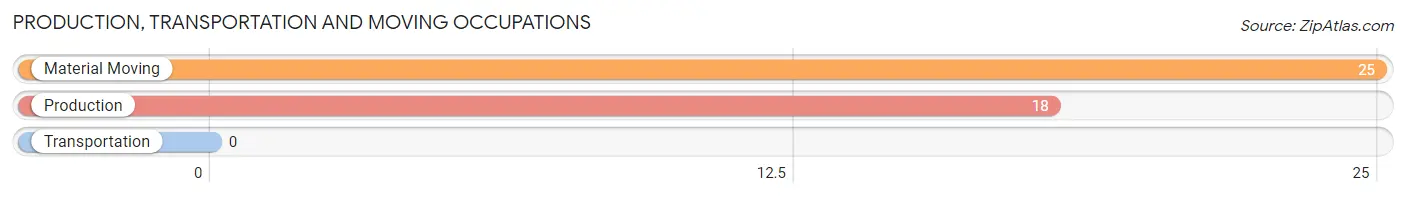
Production, Transportation and Moving Occupations by Sex
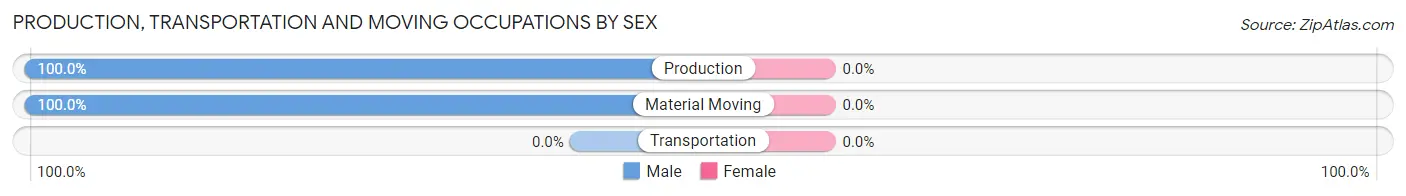
| Occupation | Male | Female |
| Production | 18 (100.0%) | 0 (0.0%) |
| Transportation | 0 (0.0%) | 0 (0.0%) |
| Material Moving | 25 (100.0%) | 0 (0.0%) |
| Total (Category) | 43 (100.0%) | 0 (0.0%) |
| Total (Overall) | 525 (59.5%) | 357 (40.5%) |
Employment Industries by Sex in New Egypt
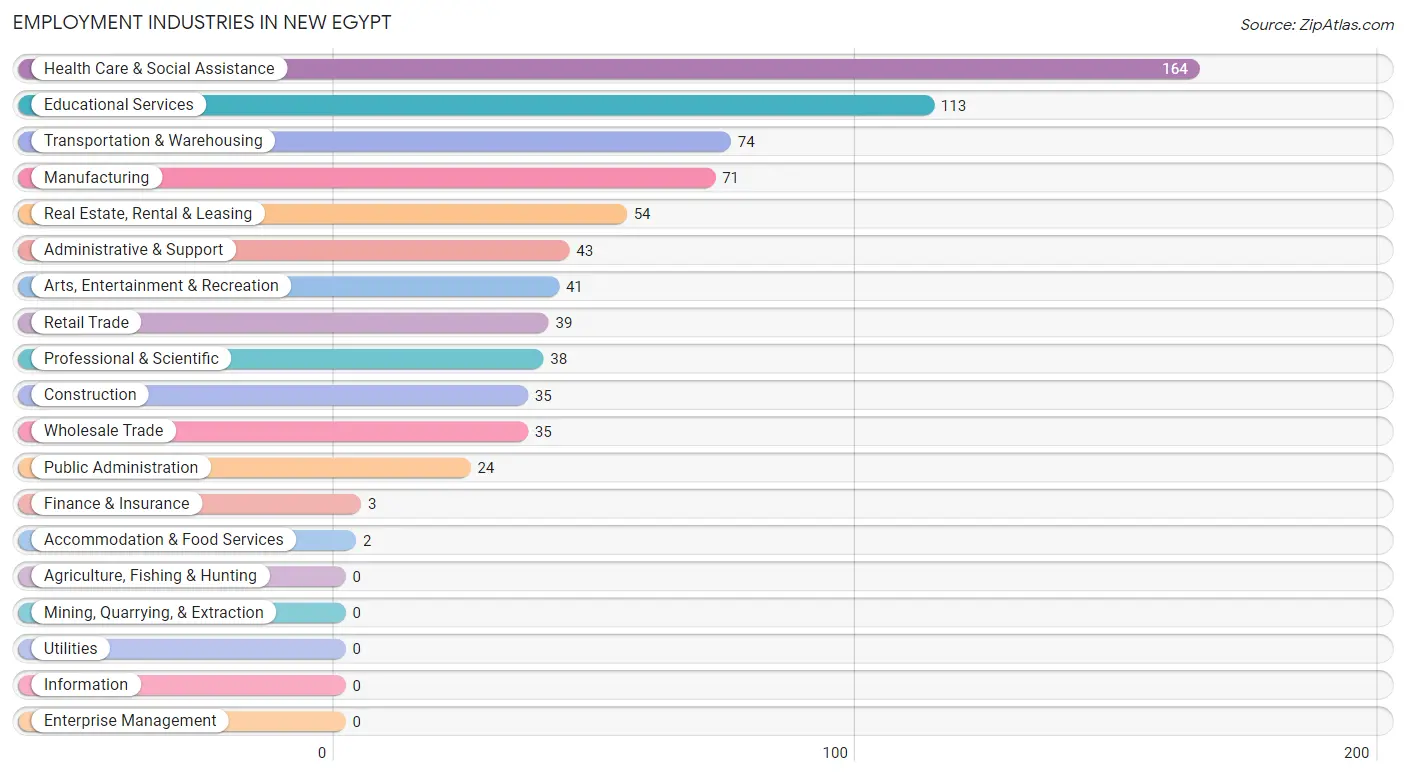
Employment Industries in New Egypt
The major employment industries in New Egypt include Health Care & Social Assistance (164 | 18.6%), Educational Services (113 | 12.8%), Transportation & Warehousing (74 | 8.4%), Manufacturing (71 | 8.1%), and Real Estate, Rental & Leasing (54 | 6.1%).
Employment Industries by Sex in New Egypt
The New Egypt industries that see more men than women are Retail Trade (100.0%), Finance & Insurance (100.0%), and Real Estate, Rental & Leasing (100.0%), whereas the industries that tend to have a higher number of women are Professional & Scientific (100.0%), Accommodation & Food Services (100.0%), and Public Administration (100.0%).
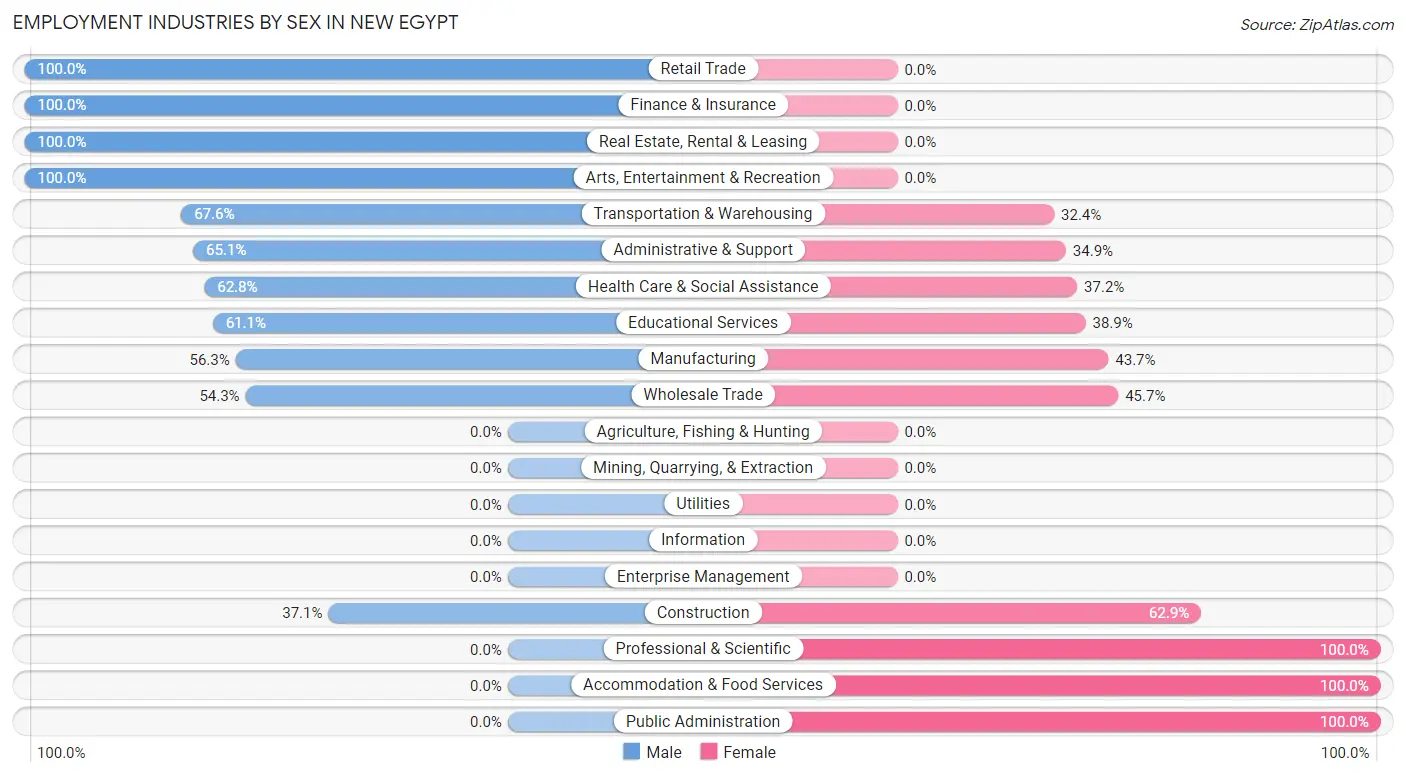
| Industry | Male | Female |
| Agriculture, Fishing & Hunting | 0 (0.0%) | 0 (0.0%) |
| Mining, Quarrying, & Extraction | 0 (0.0%) | 0 (0.0%) |
| Construction | 13 (37.1%) | 22 (62.9%) |
| Manufacturing | 40 (56.3%) | 31 (43.7%) |
| Wholesale Trade | 19 (54.3%) | 16 (45.7%) |
| Retail Trade | 39 (100.0%) | 0 (0.0%) |
| Transportation & Warehousing | 50 (67.6%) | 24 (32.4%) |
| Utilities | 0 (0.0%) | 0 (0.0%) |
| Information | 0 (0.0%) | 0 (0.0%) |
| Finance & Insurance | 3 (100.0%) | 0 (0.0%) |
| Real Estate, Rental & Leasing | 54 (100.0%) | 0 (0.0%) |
| Professional & Scientific | 0 (0.0%) | 38 (100.0%) |
| Enterprise Management | 0 (0.0%) | 0 (0.0%) |
| Administrative & Support | 28 (65.1%) | 15 (34.9%) |
| Educational Services | 69 (61.1%) | 44 (38.9%) |
| Health Care & Social Assistance | 103 (62.8%) | 61 (37.2%) |
| Arts, Entertainment & Recreation | 41 (100.0%) | 0 (0.0%) |
| Accommodation & Food Services | 0 (0.0%) | 2 (100.0%) |
| Public Administration | 0 (0.0%) | 24 (100.0%) |
| Total | 525 (59.5%) | 357 (40.5%) |
Education in New Egypt
School Enrollment in New Egypt
The most common levels of schooling among the 244 students in New Egypt are high school (108 | 44.3%), college / undergraduate (72 | 29.5%), and elementary school (41 | 16.8%).
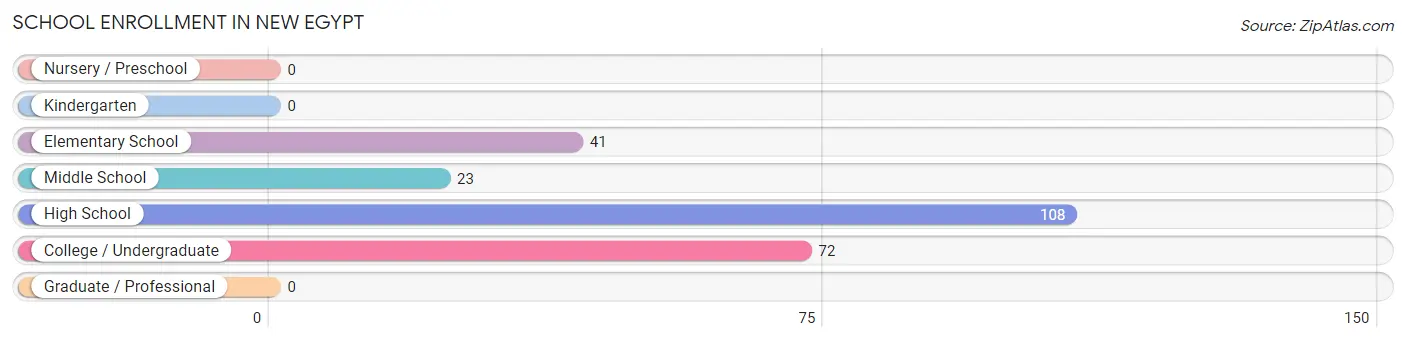
| School Level | # Students | % Students |
| Nursery / Preschool | 0 | 0.0% |
| Kindergarten | 0 | 0.0% |
| Elementary School | 41 | 16.8% |
| Middle School | 23 | 9.4% |
| High School | 108 | 44.3% |
| College / Undergraduate | 72 | 29.5% |
| Graduate / Professional | 0 | 0.0% |
| Total | 244 | 100.0% |
School Enrollment by Age by Funding Source in New Egypt
Out of a total of 244 students who are enrolled in schools in New Egypt, 69 (28.3%) attend a private institution, while the remaining 175 (71.7%) are enrolled in public schools. The age group of 25 to 34 year olds has the highest likelihood of being enrolled in private schools, with 26 (100.0% in the age bracket) enrolled. Conversely, the age group of 5 to 9 year old has the lowest likelihood of being enrolled in a private school, with 41 (100.0% in the age bracket) attending a public institution.
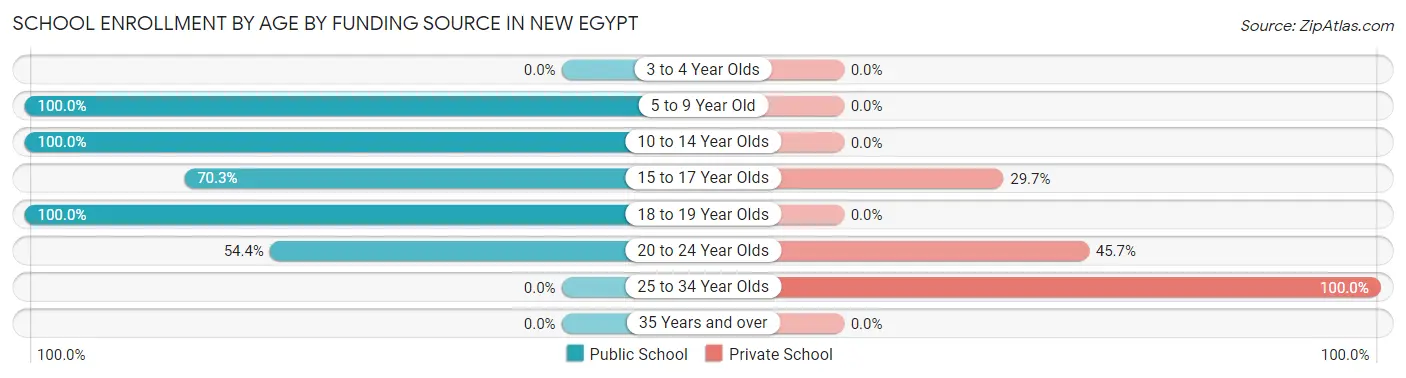
| Age Bracket | Public School | Private School |
| 3 to 4 Year Olds | 0 (0.0%) | 0 (0.0%) |
| 5 to 9 Year Old | 41 (100.0%) | 0 (0.0%) |
| 10 to 14 Year Olds | 39 (100.0%) | 0 (0.0%) |
| 15 to 17 Year Olds | 52 (70.3%) | 22 (29.7%) |
| 18 to 19 Year Olds | 18 (100.0%) | 0 (0.0%) |
| 20 to 24 Year Olds | 25 (54.3%) | 21 (45.7%) |
| 25 to 34 Year Olds | 0 (0.0%) | 26 (100.0%) |
| 35 Years and over | 0 (0.0%) | 0 (0.0%) |
| Total | 175 (71.7%) | 69 (28.3%) |
Educational Attainment by Field of Study in New Egypt
Education (150 | 37.2%), business (69 | 17.1%), liberal arts & history (66 | 16.4%), physical & health sciences (60 | 14.9%), and psychology (24 | 6.0%) are the most common fields of study among 403 individuals in New Egypt who have obtained a bachelor's degree or higher.
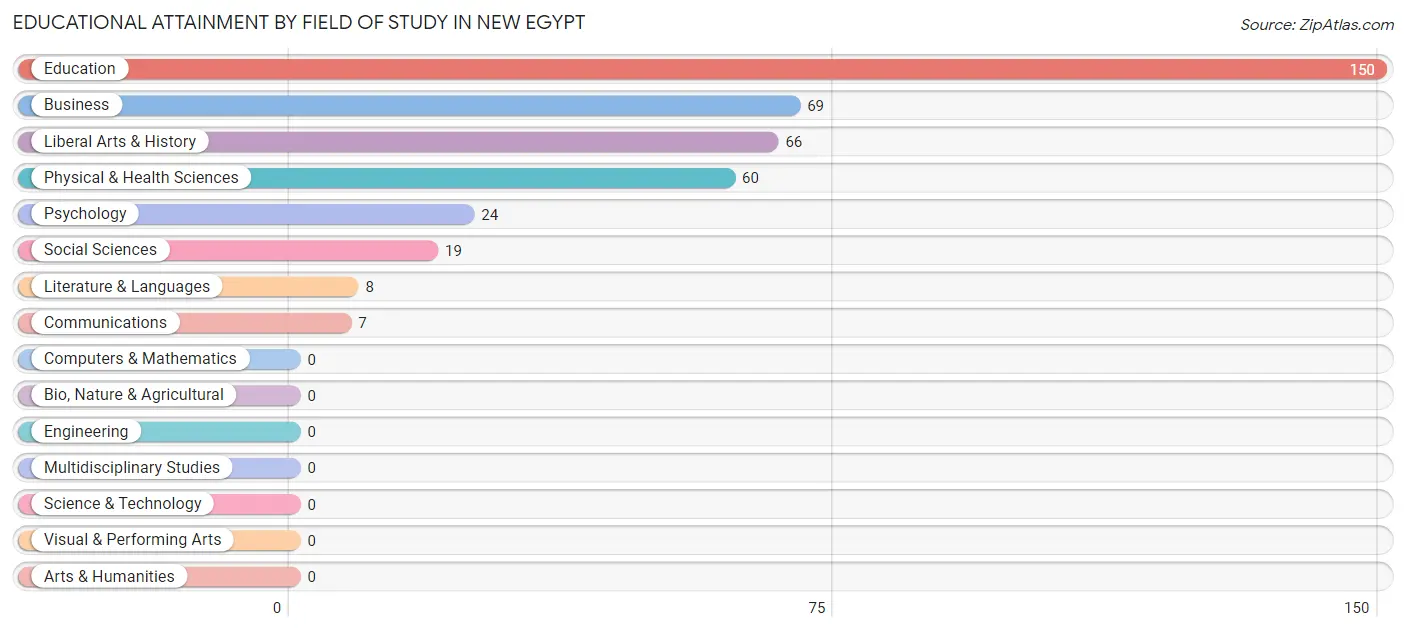
| Field of Study | # Graduates | % Graduates |
| Computers & Mathematics | 0 | 0.0% |
| Bio, Nature & Agricultural | 0 | 0.0% |
| Physical & Health Sciences | 60 | 14.9% |
| Psychology | 24 | 6.0% |
| Social Sciences | 19 | 4.7% |
| Engineering | 0 | 0.0% |
| Multidisciplinary Studies | 0 | 0.0% |
| Science & Technology | 0 | 0.0% |
| Business | 69 | 17.1% |
| Education | 150 | 37.2% |
| Literature & Languages | 8 | 2.0% |
| Liberal Arts & History | 66 | 16.4% |
| Visual & Performing Arts | 0 | 0.0% |
| Communications | 7 | 1.7% |
| Arts & Humanities | 0 | 0.0% |
| Total | 403 | 100.0% |
Transportation & Commute in New Egypt
Vehicle Availability by Sex in New Egypt
The most prevalent vehicle ownership categories in New Egypt are males with 1 vehicle (200, accounting for 37.0%) and females with 1 vehicle (76, making up 56.0%).
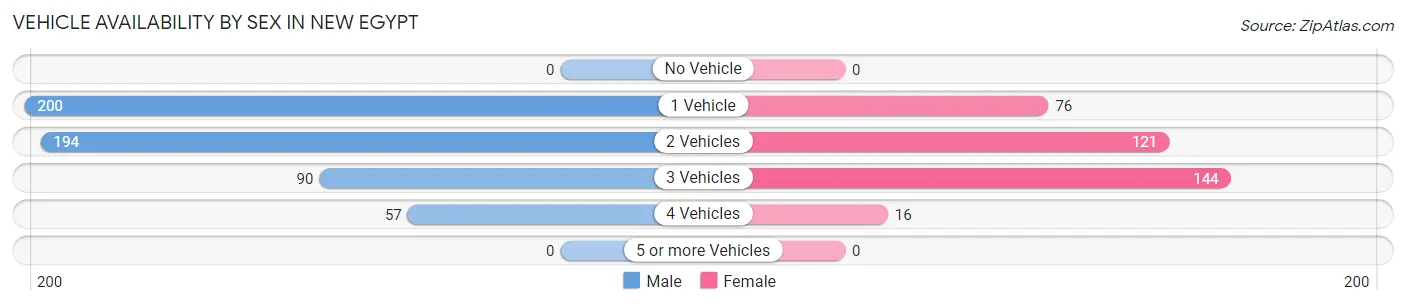
| Vehicles Available | Male | Female |
| No Vehicle | 0 (0.0%) | 0 (0.0%) |
| 1 Vehicle | 200 (37.0%) | 76 (21.3%) |
| 2 Vehicles | 194 (35.9%) | 121 (33.9%) |
| 3 Vehicles | 90 (16.6%) | 144 (40.3%) |
| 4 Vehicles | 57 (10.5%) | 16 (4.5%) |
| 5 or more Vehicles | 0 (0.0%) | 0 (0.0%) |
| Total | 541 (100.0%) | 357 (100.0%) |
Commute Time in New Egypt
The most frequently occuring commute durations in New Egypt are 45 to 59 minutes (213 commuters, 23.7%), 25 to 29 minutes (187 commuters, 20.8%), and 40 to 44 minutes (154 commuters, 17.2%).
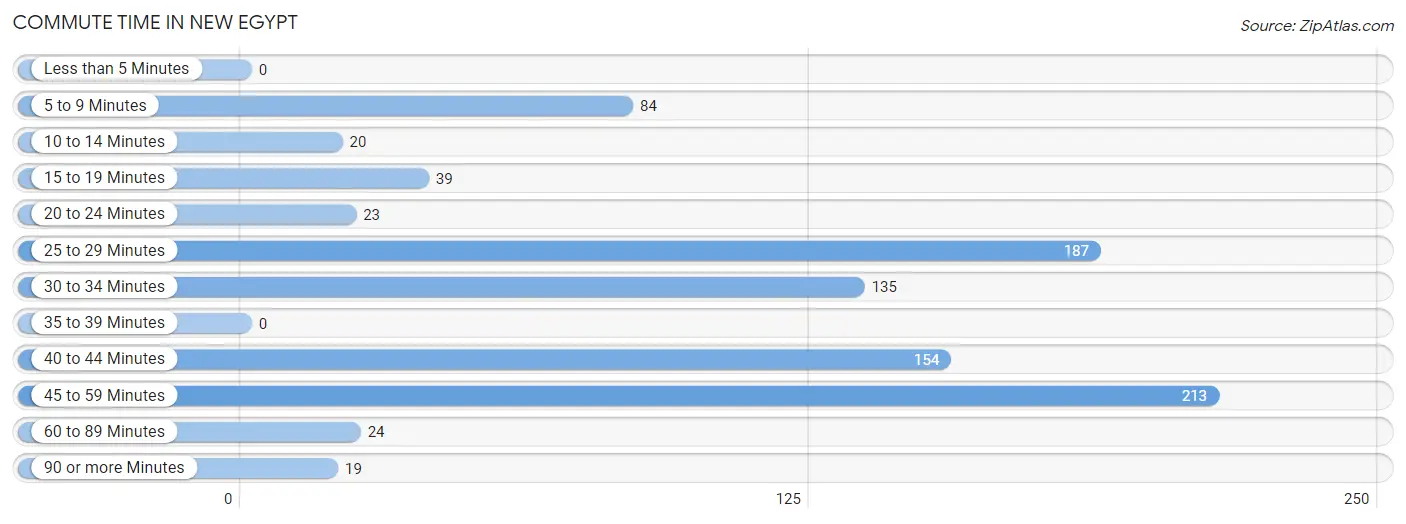
| Commute Time | # Commuters | % Commuters |
| Less than 5 Minutes | 0 | 0.0% |
| 5 to 9 Minutes | 84 | 9.3% |
| 10 to 14 Minutes | 20 | 2.2% |
| 15 to 19 Minutes | 39 | 4.3% |
| 20 to 24 Minutes | 23 | 2.6% |
| 25 to 29 Minutes | 187 | 20.8% |
| 30 to 34 Minutes | 135 | 15.0% |
| 35 to 39 Minutes | 0 | 0.0% |
| 40 to 44 Minutes | 154 | 17.2% |
| 45 to 59 Minutes | 213 | 23.7% |
| 60 to 89 Minutes | 24 | 2.7% |
| 90 or more Minutes | 19 | 2.1% |
Commute Time by Sex in New Egypt
The most common commute times in New Egypt are 30 to 34 minutes (113 commuters, 20.9%) for males and 45 to 59 minutes (130 commuters, 36.4%) for females.
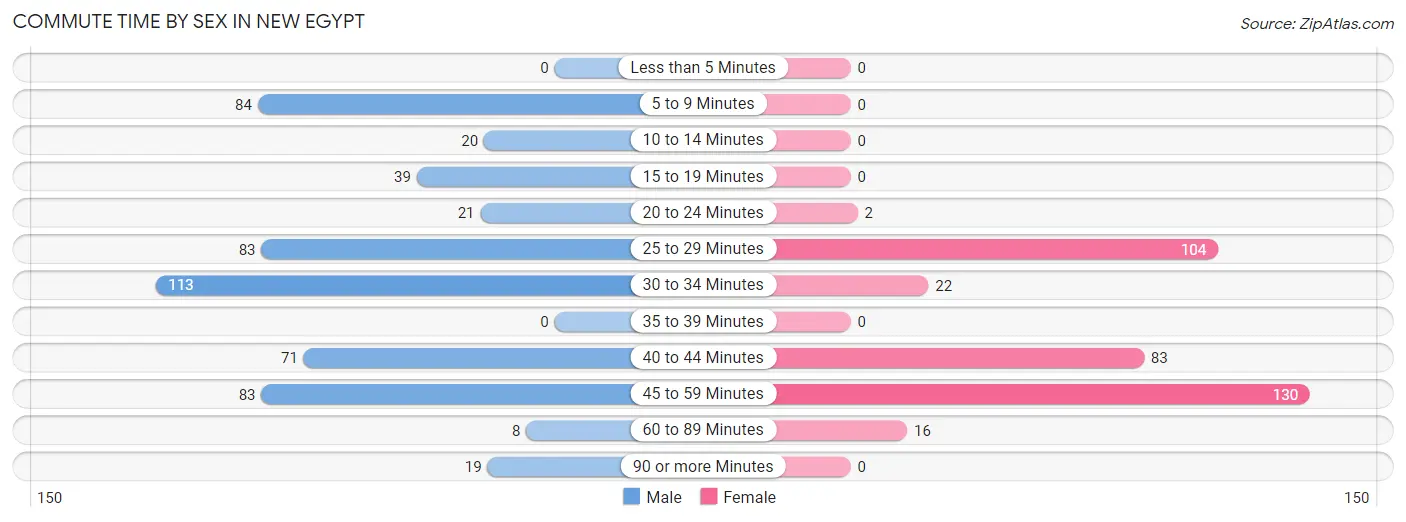
| Commute Time | Male | Female |
| Less than 5 Minutes | 0 (0.0%) | 0 (0.0%) |
| 5 to 9 Minutes | 84 (15.5%) | 0 (0.0%) |
| 10 to 14 Minutes | 20 (3.7%) | 0 (0.0%) |
| 15 to 19 Minutes | 39 (7.2%) | 0 (0.0%) |
| 20 to 24 Minutes | 21 (3.9%) | 2 (0.6%) |
| 25 to 29 Minutes | 83 (15.3%) | 104 (29.1%) |
| 30 to 34 Minutes | 113 (20.9%) | 22 (6.2%) |
| 35 to 39 Minutes | 0 (0.0%) | 0 (0.0%) |
| 40 to 44 Minutes | 71 (13.1%) | 83 (23.3%) |
| 45 to 59 Minutes | 83 (15.3%) | 130 (36.4%) |
| 60 to 89 Minutes | 8 (1.5%) | 16 (4.5%) |
| 90 or more Minutes | 19 (3.5%) | 0 (0.0%) |
Time of Departure to Work by Sex in New Egypt
The most frequent times of departure to work in New Egypt are 4:00 PM to 11:59 PM (173, 32.0%) for males and 7:00 AM to 7:29 AM (100, 28.0%) for females.
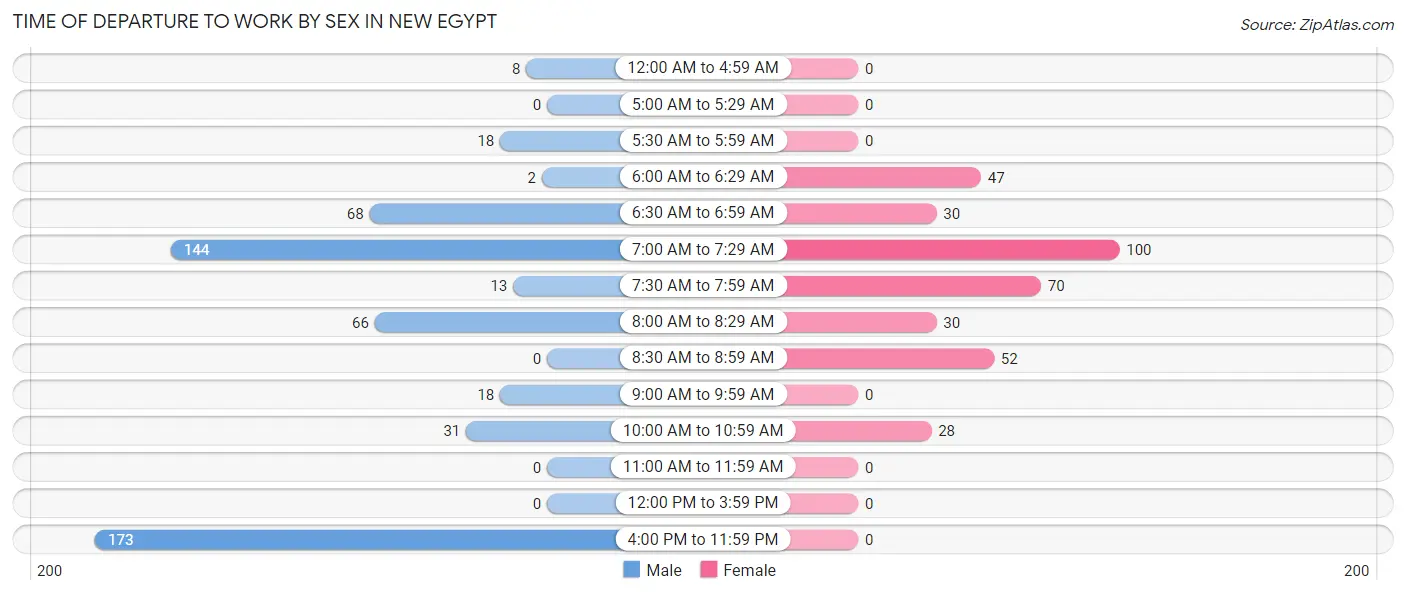
| Time of Departure | Male | Female |
| 12:00 AM to 4:59 AM | 8 (1.5%) | 0 (0.0%) |
| 5:00 AM to 5:29 AM | 0 (0.0%) | 0 (0.0%) |
| 5:30 AM to 5:59 AM | 18 (3.3%) | 0 (0.0%) |
| 6:00 AM to 6:29 AM | 2 (0.4%) | 47 (13.2%) |
| 6:30 AM to 6:59 AM | 68 (12.6%) | 30 (8.4%) |
| 7:00 AM to 7:29 AM | 144 (26.6%) | 100 (28.0%) |
| 7:30 AM to 7:59 AM | 13 (2.4%) | 70 (19.6%) |
| 8:00 AM to 8:29 AM | 66 (12.2%) | 30 (8.4%) |
| 8:30 AM to 8:59 AM | 0 (0.0%) | 52 (14.6%) |
| 9:00 AM to 9:59 AM | 18 (3.3%) | 0 (0.0%) |
| 10:00 AM to 10:59 AM | 31 (5.7%) | 28 (7.8%) |
| 11:00 AM to 11:59 AM | 0 (0.0%) | 0 (0.0%) |
| 12:00 PM to 3:59 PM | 0 (0.0%) | 0 (0.0%) |
| 4:00 PM to 11:59 PM | 173 (32.0%) | 0 (0.0%) |
| Total | 541 (100.0%) | 357 (100.0%) |
Housing Occupancy in New Egypt
Occupancy by Ownership in New Egypt
Of the total 861 dwellings in New Egypt, owner-occupied units account for 535 (62.1%), while renter-occupied units make up 326 (37.9%).
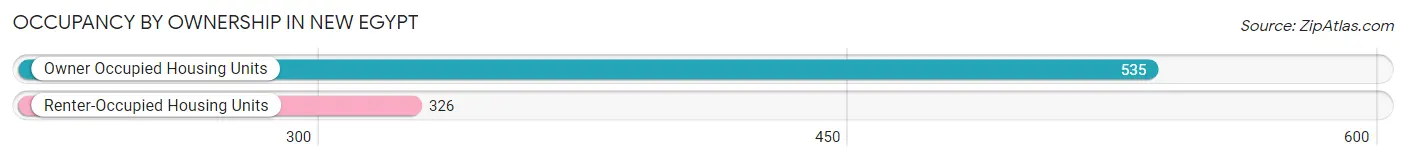
| Occupancy | # Housing Units | % Housing Units |
| Owner Occupied Housing Units | 535 | 62.1% |
| Renter-Occupied Housing Units | 326 | 37.9% |
| Total Occupied Housing Units | 861 | 100.0% |
Occupancy by Household Size in New Egypt
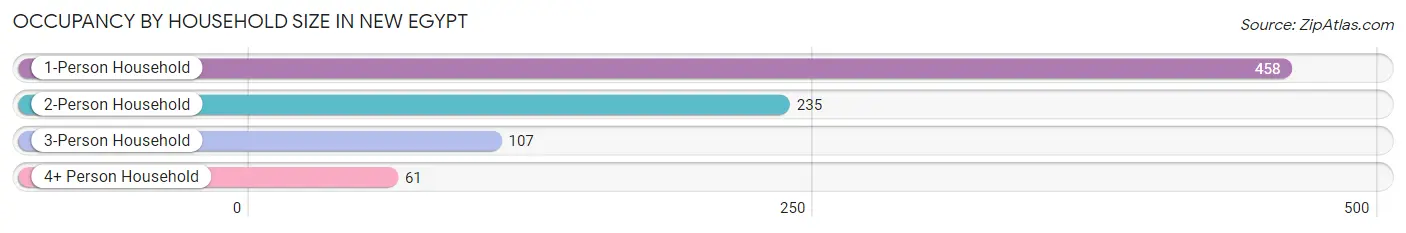
| Household Size | # Housing Units | % Housing Units |
| 1-Person Household | 458 | 53.2% |
| 2-Person Household | 235 | 27.3% |
| 3-Person Household | 107 | 12.4% |
| 4+ Person Household | 61 | 7.1% |
| Total Housing Units | 861 | 100.0% |
Occupancy by Ownership by Household Size in New Egypt
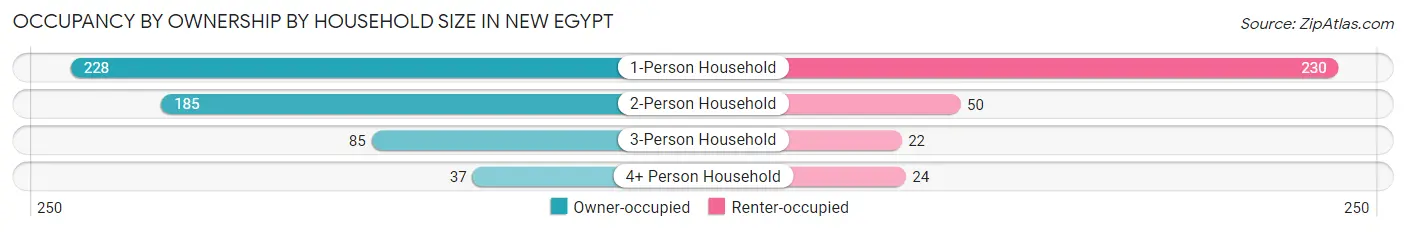
| Household Size | Owner-occupied | Renter-occupied |
| 1-Person Household | 228 (49.8%) | 230 (50.2%) |
| 2-Person Household | 185 (78.7%) | 50 (21.3%) |
| 3-Person Household | 85 (79.4%) | 22 (20.6%) |
| 4+ Person Household | 37 (60.7%) | 24 (39.3%) |
| Total Housing Units | 535 (62.1%) | 326 (37.9%) |
Occupancy by Educational Attainment in New Egypt
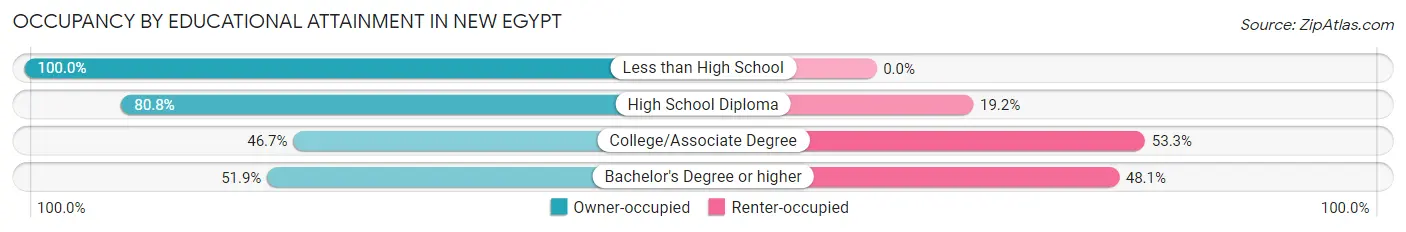
| Household Size | Owner-occupied | Renter-occupied |
| Less than High School | 70 (100.0%) | 0 (0.0%) |
| High School Diploma | 181 (80.8%) | 43 (19.2%) |
| College/Associate Degree | 93 (46.7%) | 106 (53.3%) |
| Bachelor's Degree or higher | 191 (51.9%) | 177 (48.1%) |
Occupancy by Age of Householder in New Egypt
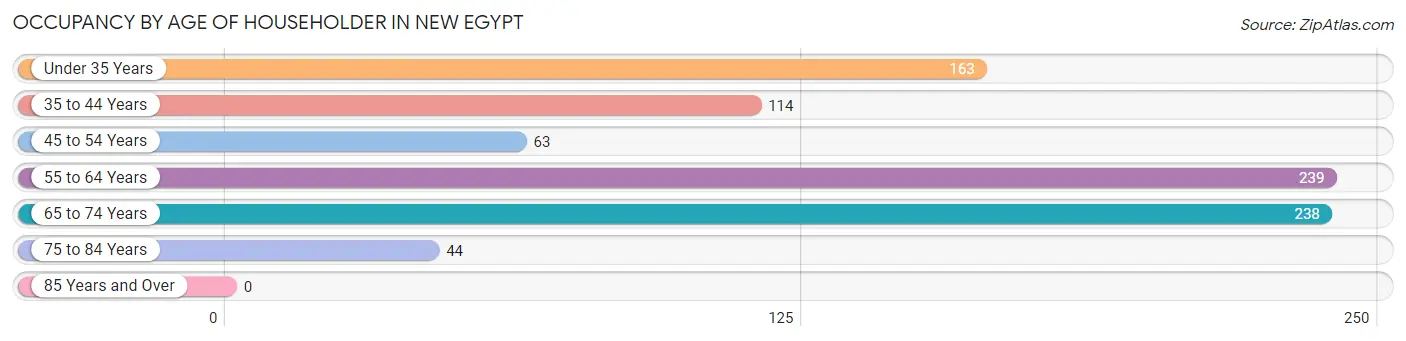
| Age Bracket | # Households | % Households |
| Under 35 Years | 163 | 18.9% |
| 35 to 44 Years | 114 | 13.2% |
| 45 to 54 Years | 63 | 7.3% |
| 55 to 64 Years | 239 | 27.8% |
| 65 to 74 Years | 238 | 27.6% |
| 75 to 84 Years | 44 | 5.1% |
| 85 Years and Over | 0 | 0.0% |
| Total | 861 | 100.0% |
Housing Finances in New Egypt
Median Income by Occupancy in New Egypt
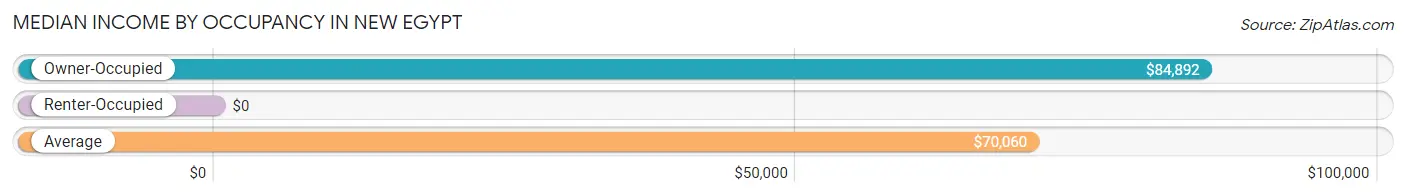
| Occupancy Type | # Households | Median Income |
| Owner-Occupied | 535 (62.1%) | $84,892 |
| Renter-Occupied | 326 (37.9%) | $0 |
| Average | 861 (100.0%) | $70,060 |
Occupancy by Householder Income Bracket in New Egypt
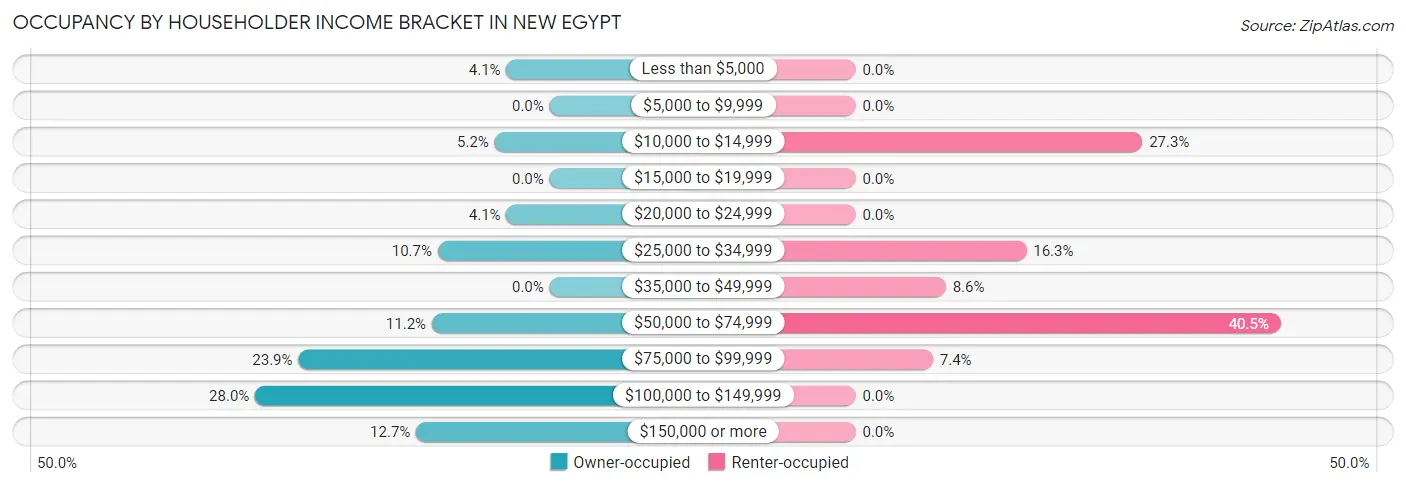
| Income Bracket | Owner-occupied | Renter-occupied |
| Less than $5,000 | 22 (4.1%) | 0 (0.0%) |
| $5,000 to $9,999 | 0 (0.0%) | 0 (0.0%) |
| $10,000 to $14,999 | 28 (5.2%) | 89 (27.3%) |
| $15,000 to $19,999 | 0 (0.0%) | 0 (0.0%) |
| $20,000 to $24,999 | 22 (4.1%) | 0 (0.0%) |
| $25,000 to $34,999 | 57 (10.6%) | 53 (16.3%) |
| $35,000 to $49,999 | 0 (0.0%) | 28 (8.6%) |
| $50,000 to $74,999 | 60 (11.2%) | 132 (40.5%) |
| $75,000 to $99,999 | 128 (23.9%) | 24 (7.4%) |
| $100,000 to $149,999 | 150 (28.0%) | 0 (0.0%) |
| $150,000 or more | 68 (12.7%) | 0 (0.0%) |
| Total | 535 (100.0%) | 326 (100.0%) |
Monthly Housing Cost Tiers in New Egypt
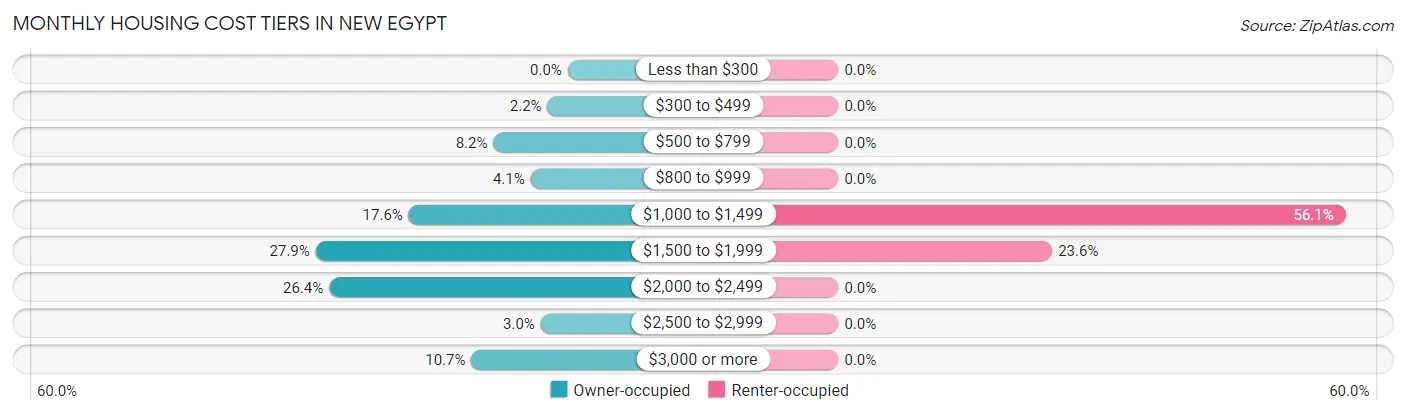
| Monthly Cost | Owner-occupied | Renter-occupied |
| Less than $300 | 0 (0.0%) | 0 (0.0%) |
| $300 to $499 | 12 (2.2%) | 0 (0.0%) |
| $500 to $799 | 44 (8.2%) | 0 (0.0%) |
| $800 to $999 | 22 (4.1%) | 0 (0.0%) |
| $1,000 to $1,499 | 94 (17.6%) | 183 (56.1%) |
| $1,500 to $1,999 | 149 (27.9%) | 77 (23.6%) |
| $2,000 to $2,499 | 141 (26.4%) | 0 (0.0%) |
| $2,500 to $2,999 | 16 (3.0%) | 0 (0.0%) |
| $3,000 or more | 57 (10.6%) | 0 (0.0%) |
| Total | 535 (100.0%) | 326 (100.0%) |
Physical Housing Characteristics in New Egypt
Housing Structures in New Egypt
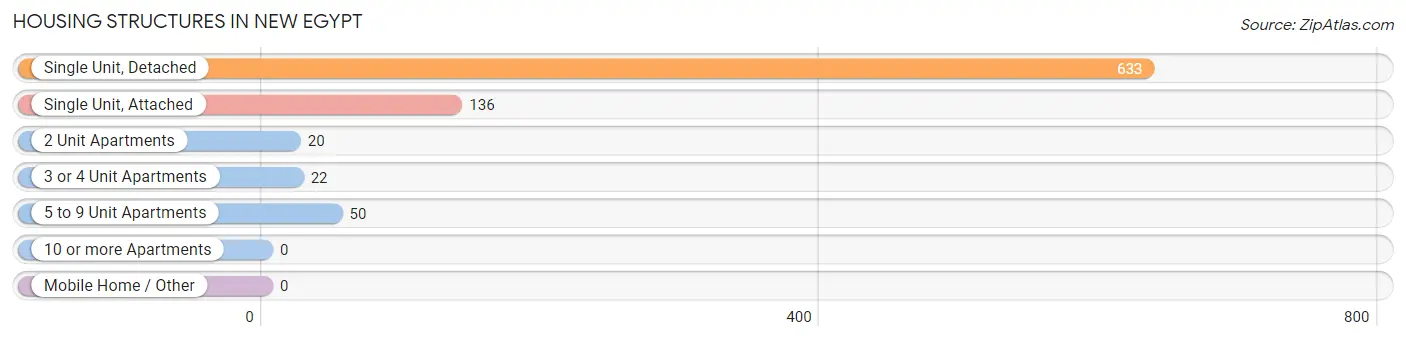
| Structure Type | # Housing Units | % Housing Units |
| Single Unit, Detached | 633 | 73.5% |
| Single Unit, Attached | 136 | 15.8% |
| 2 Unit Apartments | 20 | 2.3% |
| 3 or 4 Unit Apartments | 22 | 2.6% |
| 5 to 9 Unit Apartments | 50 | 5.8% |
| 10 or more Apartments | 0 | 0.0% |
| Mobile Home / Other | 0 | 0.0% |
| Total | 861 | 100.0% |
Housing Structures by Occupancy in New Egypt
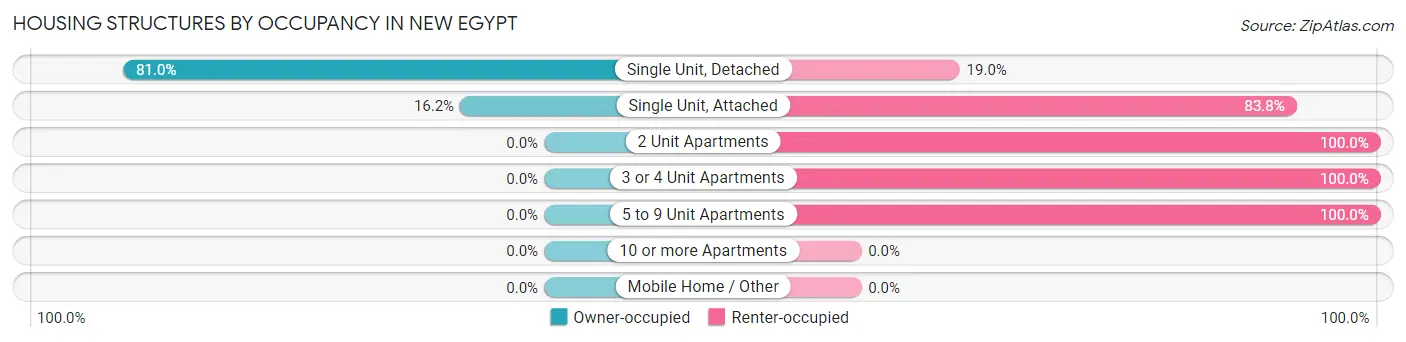
| Structure Type | Owner-occupied | Renter-occupied |
| Single Unit, Detached | 513 (81.0%) | 120 (19.0%) |
| Single Unit, Attached | 22 (16.2%) | 114 (83.8%) |
| 2 Unit Apartments | 0 (0.0%) | 20 (100.0%) |
| 3 or 4 Unit Apartments | 0 (0.0%) | 22 (100.0%) |
| 5 to 9 Unit Apartments | 0 (0.0%) | 50 (100.0%) |
| 10 or more Apartments | 0 (0.0%) | 0 (0.0%) |
| Mobile Home / Other | 0 (0.0%) | 0 (0.0%) |
| Total | 535 (62.1%) | 326 (37.9%) |
Housing Structures by Number of Rooms in New Egypt
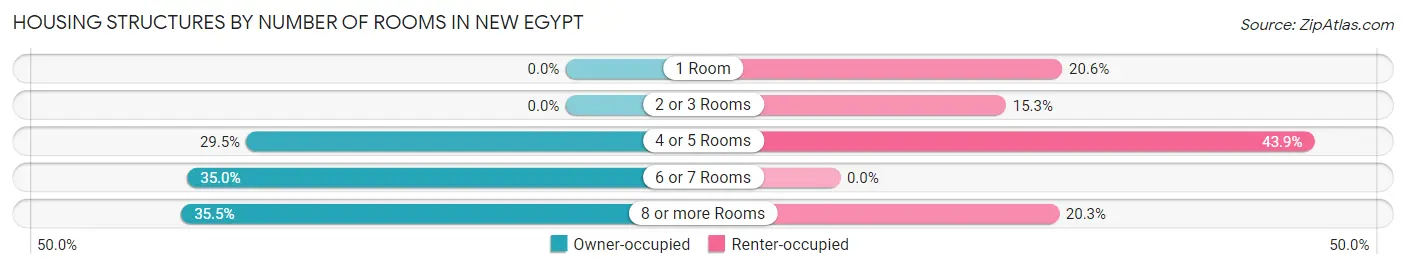
| Number of Rooms | Owner-occupied | Renter-occupied |
| 1 Room | 0 (0.0%) | 67 (20.5%) |
| 2 or 3 Rooms | 0 (0.0%) | 50 (15.3%) |
| 4 or 5 Rooms | 158 (29.5%) | 143 (43.9%) |
| 6 or 7 Rooms | 187 (34.9%) | 0 (0.0%) |
| 8 or more Rooms | 190 (35.5%) | 66 (20.3%) |
| Total | 535 (100.0%) | 326 (100.0%) |
Housing Structure by Heating Type in New Egypt
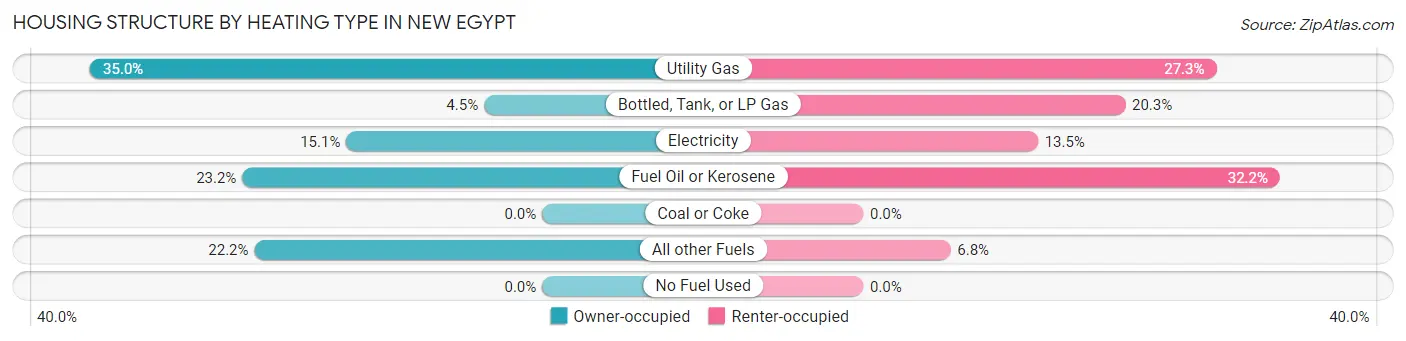
| Heating Type | Owner-occupied | Renter-occupied |
| Utility Gas | 187 (34.9%) | 89 (27.3%) |
| Bottled, Tank, or LP Gas | 24 (4.5%) | 66 (20.3%) |
| Electricity | 81 (15.1%) | 44 (13.5%) |
| Fuel Oil or Kerosene | 124 (23.2%) | 105 (32.2%) |
| Coal or Coke | 0 (0.0%) | 0 (0.0%) |
| All other Fuels | 119 (22.2%) | 22 (6.8%) |
| No Fuel Used | 0 (0.0%) | 0 (0.0%) |
| Total | 535 (100.0%) | 326 (100.0%) |
Household Vehicle Usage in New Egypt
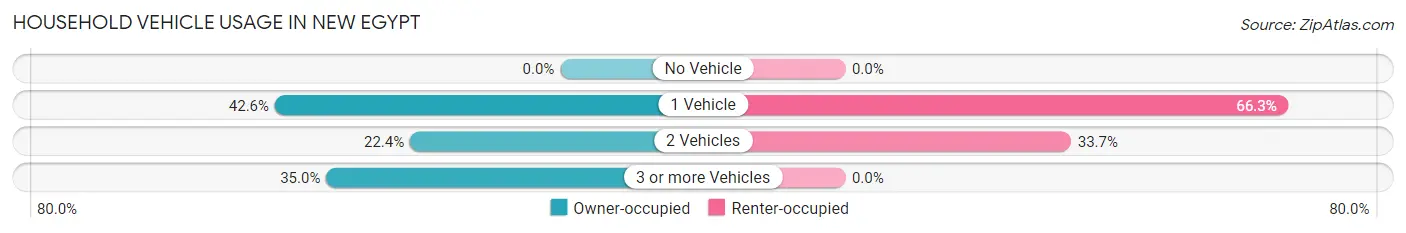
| Vehicles per Household | Owner-occupied | Renter-occupied |
| No Vehicle | 0 (0.0%) | 0 (0.0%) |
| 1 Vehicle | 228 (42.6%) | 216 (66.3%) |
| 2 Vehicles | 120 (22.4%) | 110 (33.7%) |
| 3 or more Vehicles | 187 (34.9%) | 0 (0.0%) |
| Total | 535 (100.0%) | 326 (100.0%) |
Real Estate & Mortgages in New Egypt
Real Estate and Mortgage Overview in New Egypt
| Characteristic | Without Mortgage | With Mortgage |
| Housing Units | 142 | 393 |
| Median Property Value | $337,900 | $346,600 |
| Median Household Income | $85,568 | $68 |
| Monthly Housing Costs | $1,321 | $35 |
| Real Estate Taxes | $7,772 | $12 |
Property Value by Mortgage Status in New Egypt
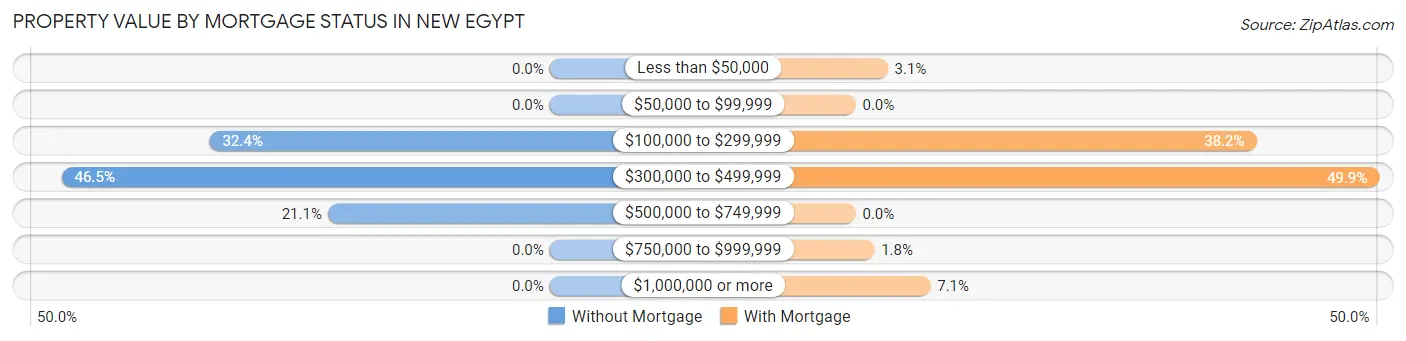
| Property Value | Without Mortgage | With Mortgage |
| Less than $50,000 | 0 (0.0%) | 12 (3.0%) |
| $50,000 to $99,999 | 0 (0.0%) | 0 (0.0%) |
| $100,000 to $299,999 | 46 (32.4%) | 150 (38.2%) |
| $300,000 to $499,999 | 66 (46.5%) | 196 (49.9%) |
| $500,000 to $749,999 | 30 (21.1%) | 0 (0.0%) |
| $750,000 to $999,999 | 0 (0.0%) | 7 (1.8%) |
| $1,000,000 or more | 0 (0.0%) | 28 (7.1%) |
| Total | 142 (100.0%) | 393 (100.0%) |
Household Income by Mortgage Status in New Egypt
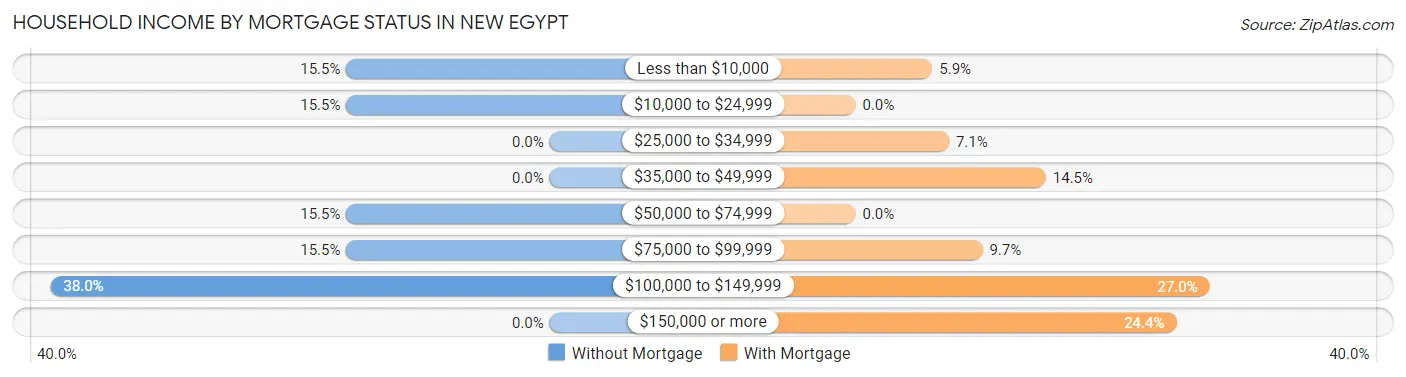
| Household Income | Without Mortgage | With Mortgage |
| Less than $10,000 | 22 (15.5%) | 23 (5.9%) |
| $10,000 to $24,999 | 22 (15.5%) | 0 (0.0%) |
| $25,000 to $34,999 | 0 (0.0%) | 28 (7.1%) |
| $35,000 to $49,999 | 0 (0.0%) | 57 (14.5%) |
| $50,000 to $74,999 | 22 (15.5%) | 0 (0.0%) |
| $75,000 to $99,999 | 22 (15.5%) | 38 (9.7%) |
| $100,000 to $149,999 | 54 (38.0%) | 106 (27.0%) |
| $150,000 or more | 0 (0.0%) | 96 (24.4%) |
| Total | 142 (100.0%) | 393 (100.0%) |
Property Value to Household Income Ratio in New Egypt
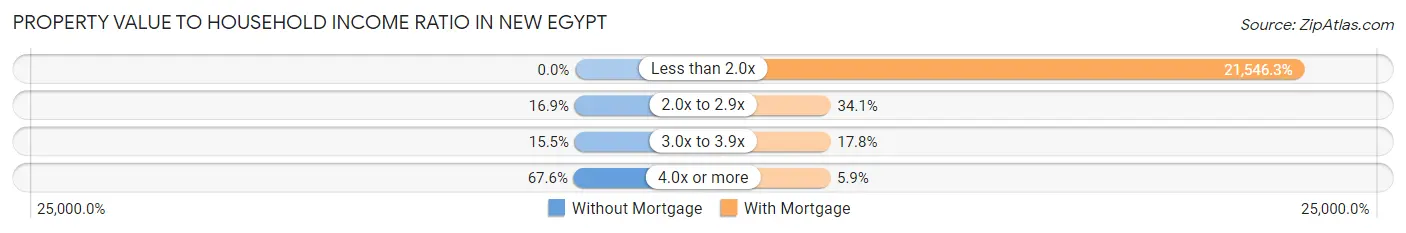
| Value-to-Income Ratio | Without Mortgage | With Mortgage |
| Less than 2.0x | 0 (0.0%) | 84,677 (21,546.3%) |
| 2.0x to 2.9x | 24 (16.9%) | 134 (34.1%) |
| 3.0x to 3.9x | 22 (15.5%) | 70 (17.8%) |
| 4.0x or more | 96 (67.6%) | 23 (5.9%) |
| Total | 142 (100.0%) | 393 (100.0%) |
Real Estate Taxes by Mortgage Status in New Egypt
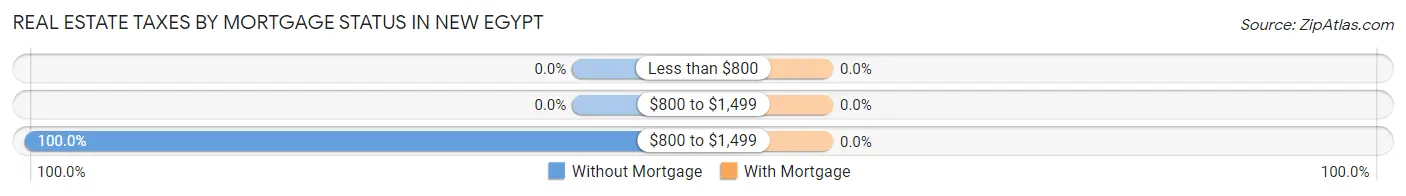
| Property Taxes | Without Mortgage | With Mortgage |
| Less than $800 | 0 (0.0%) | 0 (0.0%) |
| $800 to $1,499 | 0 (0.0%) | 0 (0.0%) |
| $800 to $1,499 | 142 (100.0%) | 0 (0.0%) |
| Total | 142 (100.0%) | 393 (100.0%) |
Health & Disability in New Egypt
Health Insurance Coverage by Age in New Egypt
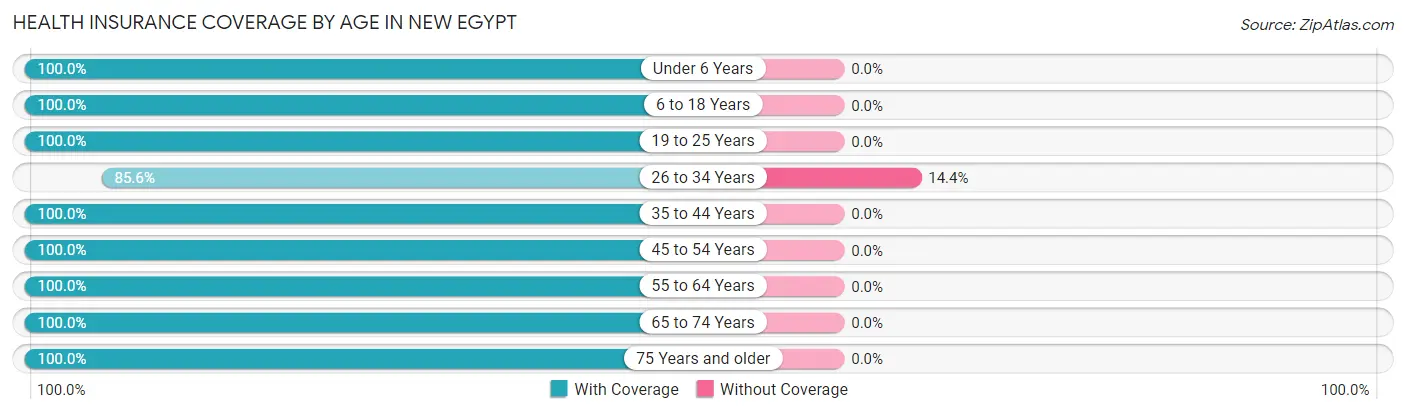
| Age Bracket | With Coverage | Without Coverage |
| Under 6 Years | 30 (100.0%) | 0 (0.0%) |
| 6 to 18 Years | 172 (100.0%) | 0 (0.0%) |
| 19 to 25 Years | 127 (100.0%) | 0 (0.0%) |
| 26 to 34 Years | 167 (85.6%) | 28 (14.4%) |
| 35 to 44 Years | 146 (100.0%) | 0 (0.0%) |
| 45 to 54 Years | 120 (100.0%) | 0 (0.0%) |
| 55 to 64 Years | 341 (100.0%) | 0 (0.0%) |
| 65 to 74 Years | 340 (100.0%) | 0 (0.0%) |
| 75 Years and older | 65 (100.0%) | 0 (0.0%) |
| Total | 1,508 (98.2%) | 28 (1.8%) |
Health Insurance Coverage by Citizenship Status in New Egypt
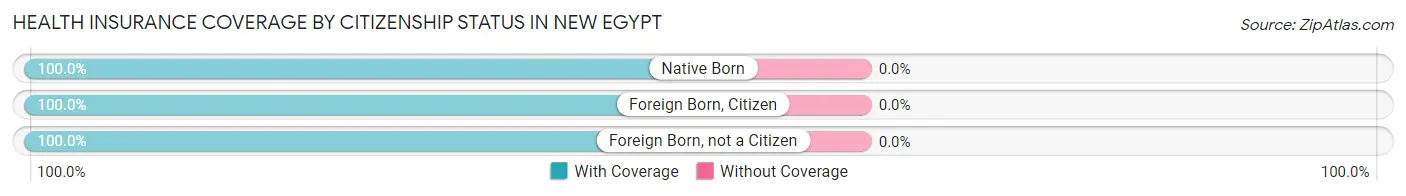
| Citizenship Status | With Coverage | Without Coverage |
| Native Born | 30 (100.0%) | 0 (0.0%) |
| Foreign Born, Citizen | 172 (100.0%) | 0 (0.0%) |
| Foreign Born, not a Citizen | 127 (100.0%) | 0 (0.0%) |
Health Insurance Coverage by Household Income in New Egypt
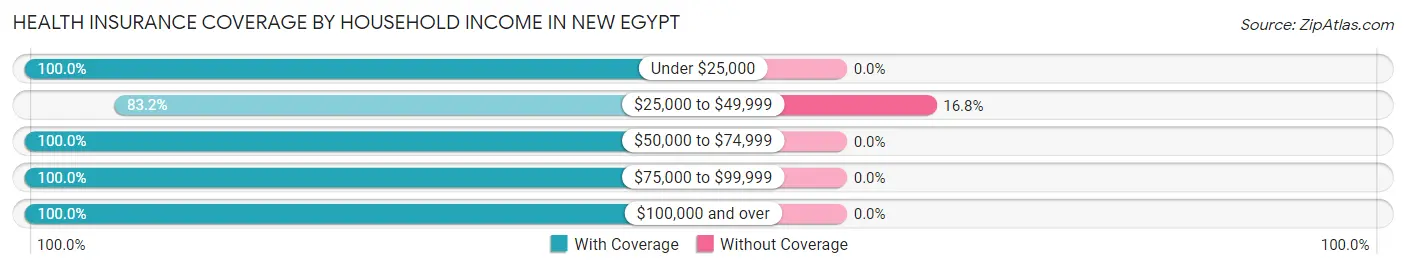
| Household Income | With Coverage | Without Coverage |
| Under $25,000 | 202 (100.0%) | 0 (0.0%) |
| $25,000 to $49,999 | 139 (83.2%) | 28 (16.8%) |
| $50,000 to $74,999 | 354 (100.0%) | 0 (0.0%) |
| $75,000 to $99,999 | 267 (100.0%) | 0 (0.0%) |
| $100,000 and over | 546 (100.0%) | 0 (0.0%) |
Public vs Private Health Insurance Coverage by Age in New Egypt
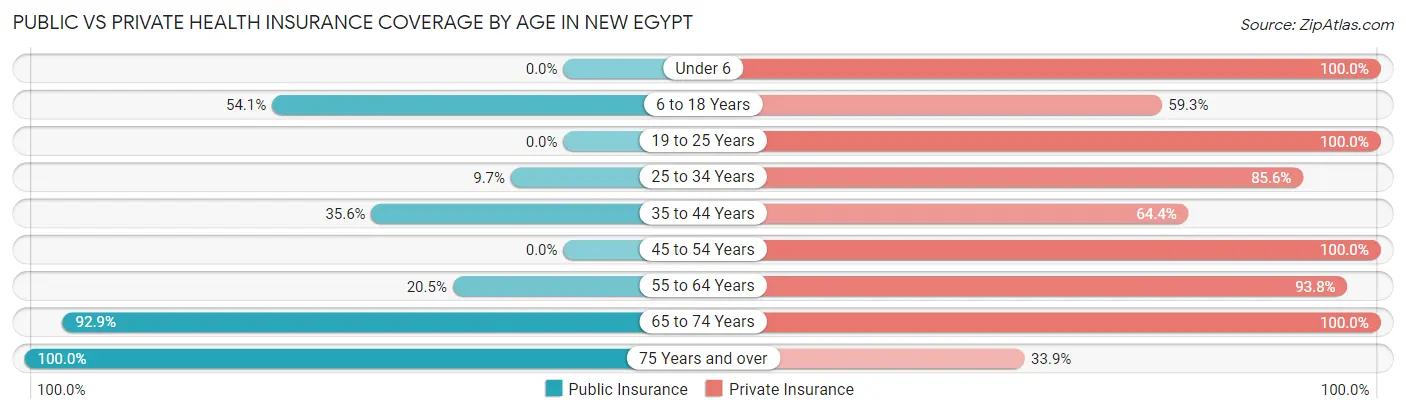
| Age Bracket | Public Insurance | Private Insurance |
| Under 6 | 0 (0.0%) | 30 (100.0%) |
| 6 to 18 Years | 93 (54.1%) | 102 (59.3%) |
| 19 to 25 Years | 0 (0.0%) | 127 (100.0%) |
| 25 to 34 Years | 19 (9.7%) | 167 (85.6%) |
| 35 to 44 Years | 52 (35.6%) | 94 (64.4%) |
| 45 to 54 Years | 0 (0.0%) | 120 (100.0%) |
| 55 to 64 Years | 70 (20.5%) | 320 (93.8%) |
| 65 to 74 Years | 316 (92.9%) | 340 (100.0%) |
| 75 Years and over | 65 (100.0%) | 22 (33.9%) |
| Total | 615 (40.0%) | 1,322 (86.1%) |
Disability Status by Sex by Age in New Egypt
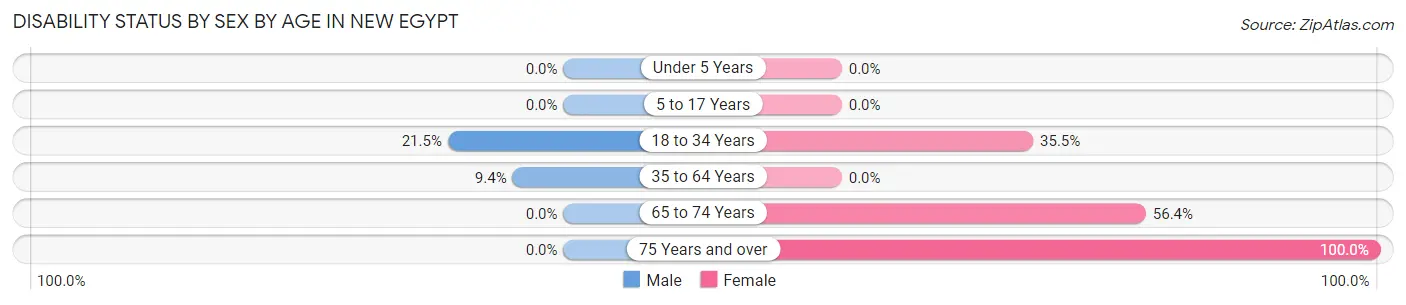
| Age Bracket | Male | Female |
| Under 5 Years | 0 (0.0%) | 0 (0.0%) |
| 5 to 17 Years | 0 (0.0%) | 0 (0.0%) |
| 18 to 34 Years | 50 (21.5%) | 38 (35.5%) |
| 35 to 64 Years | 27 (9.4%) | 0 (0.0%) |
| 65 to 74 Years | 0 (0.0%) | 57 (56.4%) |
| 75 Years and over | 0 (0.0%) | 65 (100.0%) |
Disability Class by Sex by Age in New Egypt
Disability Class: Hearing Difficulty
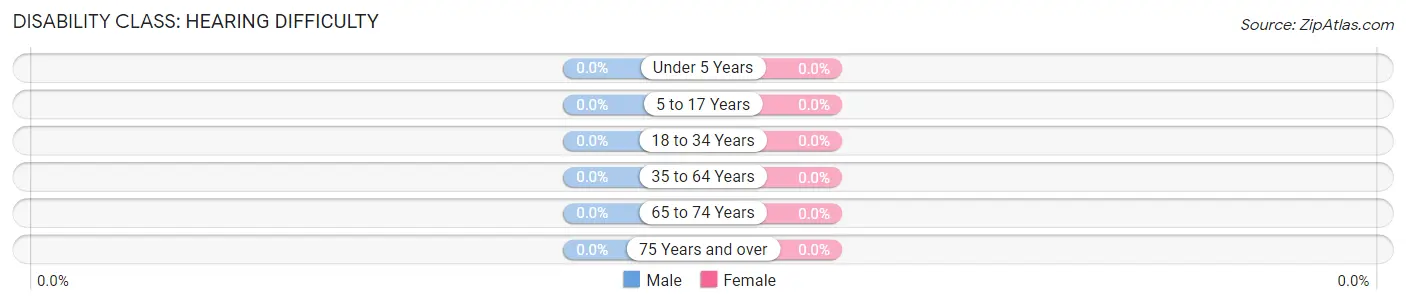
| Age Bracket | Male | Female |
| Under 5 Years | 0 (0.0%) | 0 (0.0%) |
| 5 to 17 Years | 0 (0.0%) | 0 (0.0%) |
| 18 to 34 Years | 0 (0.0%) | 0 (0.0%) |
| 35 to 64 Years | 0 (0.0%) | 0 (0.0%) |
| 65 to 74 Years | 0 (0.0%) | 0 (0.0%) |
| 75 Years and over | 0 (0.0%) | 0 (0.0%) |
Disability Class: Vision Difficulty
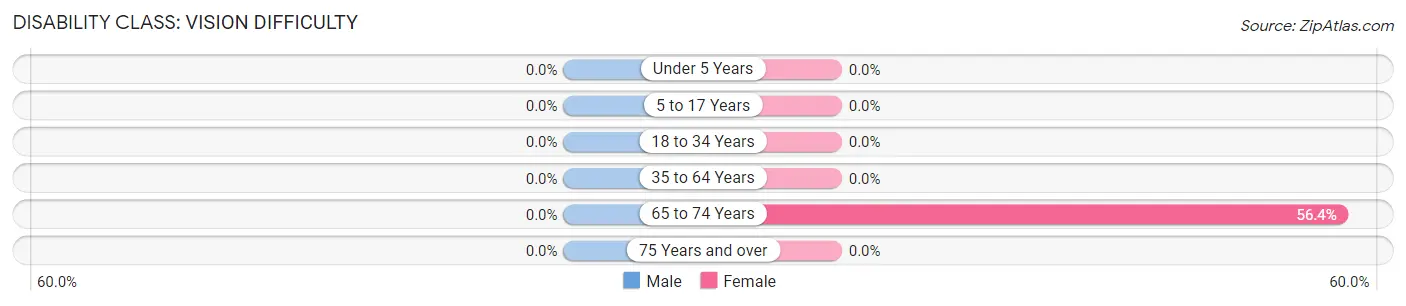
| Age Bracket | Male | Female |
| Under 5 Years | 0 (0.0%) | 0 (0.0%) |
| 5 to 17 Years | 0 (0.0%) | 0 (0.0%) |
| 18 to 34 Years | 0 (0.0%) | 0 (0.0%) |
| 35 to 64 Years | 0 (0.0%) | 0 (0.0%) |
| 65 to 74 Years | 0 (0.0%) | 57 (56.4%) |
| 75 Years and over | 0 (0.0%) | 0 (0.0%) |
Disability Class: Cognitive Difficulty
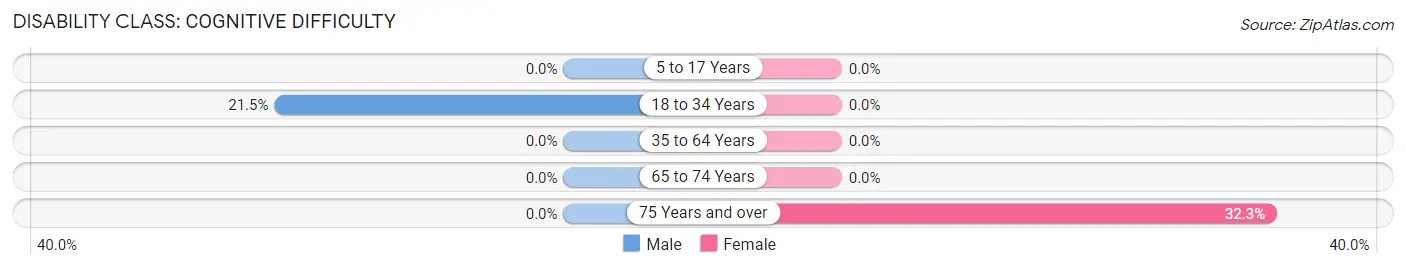
| Age Bracket | Male | Female |
| 5 to 17 Years | 0 (0.0%) | 0 (0.0%) |
| 18 to 34 Years | 50 (21.5%) | 0 (0.0%) |
| 35 to 64 Years | 0 (0.0%) | 0 (0.0%) |
| 65 to 74 Years | 0 (0.0%) | 0 (0.0%) |
| 75 Years and over | 0 (0.0%) | 21 (32.3%) |
Disability Class: Ambulatory Difficulty
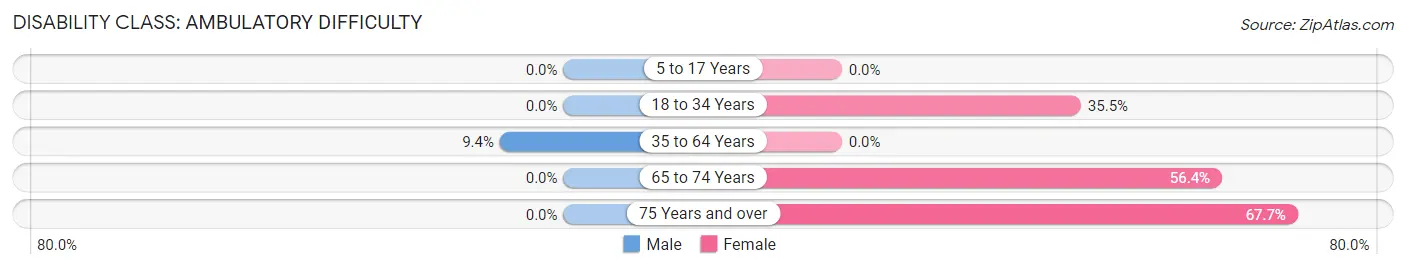
| Age Bracket | Male | Female |
| 5 to 17 Years | 0 (0.0%) | 0 (0.0%) |
| 18 to 34 Years | 0 (0.0%) | 38 (35.5%) |
| 35 to 64 Years | 27 (9.4%) | 0 (0.0%) |
| 65 to 74 Years | 0 (0.0%) | 57 (56.4%) |
| 75 Years and over | 0 (0.0%) | 44 (67.7%) |
Disability Class: Self-Care Difficulty
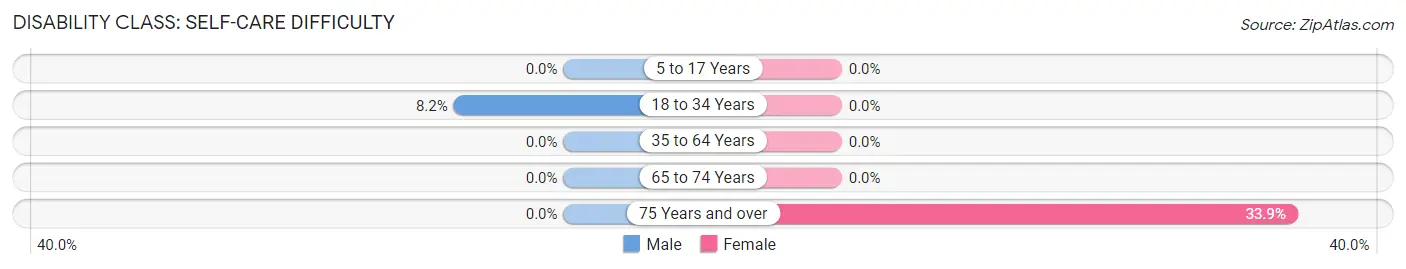
| Age Bracket | Male | Female |
| 5 to 17 Years | 0 (0.0%) | 0 (0.0%) |
| 18 to 34 Years | 19 (8.2%) | 0 (0.0%) |
| 35 to 64 Years | 0 (0.0%) | 0 (0.0%) |
| 65 to 74 Years | 0 (0.0%) | 0 (0.0%) |
| 75 Years and over | 0 (0.0%) | 22 (33.9%) |
Technology Access in New Egypt
Computing Device Access in New Egypt
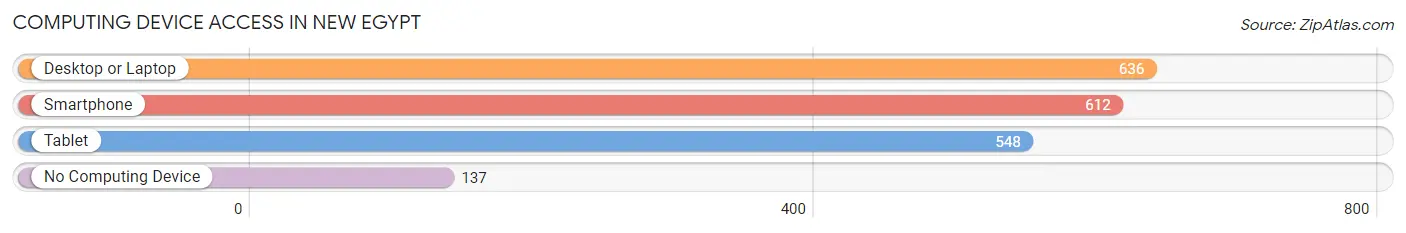
| Device Type | # Households | % Households |
| Desktop or Laptop | 636 | 73.9% |
| Smartphone | 612 | 71.1% |
| Tablet | 548 | 63.6% |
| No Computing Device | 137 | 15.9% |
| Total | 861 | 100.0% |
Internet Access in New Egypt
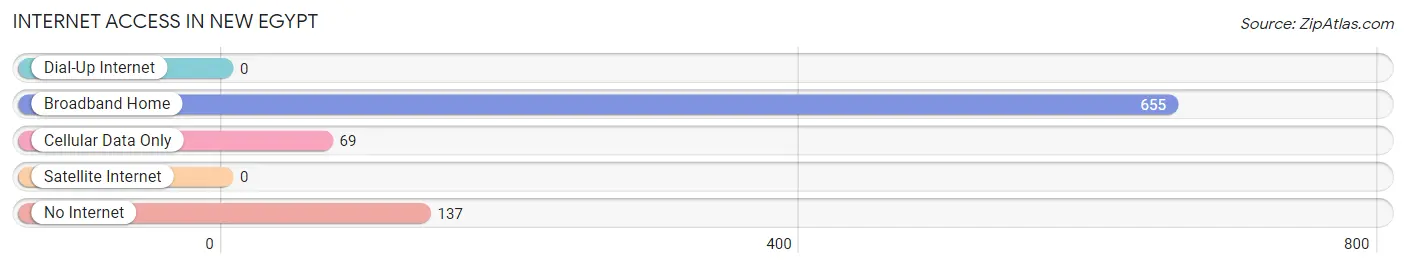
| Internet Type | # Households | % Households |
| Dial-Up Internet | 0 | 0.0% |
| Broadband Home | 655 | 76.1% |
| Cellular Data Only | 69 | 8.0% |
| Satellite Internet | 0 | 0.0% |
| No Internet | 137 | 15.9% |
| Total | 861 | 100.0% |
New Egypt Summary
New Egypt, NJ is a small unincorporated community located in Ocean County, New Jersey. It is situated in the northern part of the county, approximately 10 miles from the Atlantic Ocean. The community is bordered by Plumsted Township to the north, Upper Freehold Township to the east, Jackson Township to the south, and Plumsted Township to the west. The population of New Egypt was estimated to be 1,845 in the 2010 census.
History
New Egypt was originally part of Upper Freehold Township, which was established in 1713. The area was first settled in the late 1700s by a group of Quakers from England. The Quakers named the area New Egypt, after the biblical land of Egypt. The area was primarily used for farming and the Quakers built a meeting house in the area in 1790.
In 1845, the area was split off from Upper Freehold Township and became its own township, known as Plumsted Township. The area was primarily rural and agricultural, with a few small businesses. In the late 1800s, the area began to develop more rapidly, with the construction of a railroad line and the establishment of a post office.
Geography
New Egypt is located in northern Ocean County, approximately 10 miles from the Atlantic Ocean. It is bordered by Plumsted Township to the north, Upper Freehold Township to the east, Jackson Township to the south, and Plumsted Township to the west. The area is mostly flat, with some rolling hills. The soil is mostly sandy and loamy.
Economy
New Egypt is primarily a rural, agricultural community. The area is home to several farms, which produce a variety of crops, including corn, soybeans, and hay. The area is also home to several small businesses, including a few restaurants, a gas station, and a few retail stores.
Demographics
As of the 2010 census, the population of New Egypt was estimated to be 1,845. The population is primarily white (94.3%), with a small percentage of African Americans (2.2%) and Hispanics (2.2%). The median household income is $68,750, and the median home value is $250,000. The unemployment rate is 4.2%.
Conclusion
New Egypt, NJ is a small unincorporated community located in Ocean County, New Jersey. It is situated in the northern part of the county, approximately 10 miles from the Atlantic Ocean. The community is bordered by Plumsted Township to the north, Upper Freehold Township to the east, Jackson Township to the south, and Plumsted Township to the west. The population of New Egypt was estimated to be 1,845 in the 2010 census. The area is primarily rural and agricultural, with a few small businesses. The population is primarily white, with a small percentage of African Americans and Hispanics. The median household income is $68,750, and the median home value is $250,000. The unemployment rate is 4.2%.
Common Questions
What is Per Capita Income in New Egypt?
Per Capita income in New Egypt is $41,224.
What is the Median Family Income in New Egypt?
Median Family Income in New Egypt is $86,080.
What is the Median Household income in New Egypt?
Median Household Income in New Egypt is $70,060.
What is Income or Wage Gap in New Egypt?
Income or Wage Gap in New Egypt is 19.8%.
Women in New Egypt earn 80.2 cents for every dollar earned by a man.
What is Inequality or Gini Index in New Egypt?
Inequality or Gini Index in New Egypt is 0.37.
What is the Total Population of New Egypt?
Total Population of New Egypt is 1,552.
What is the Total Male Population of New Egypt?
Total Male Population of New Egypt is 876.
What is the Total Female Population of New Egypt?
Total Female Population of New Egypt is 676.
What is the Ratio of Males per 100 Females in New Egypt?
There are 129.59 Males per 100 Females in New Egypt.
What is the Ratio of Females per 100 Males in New Egypt?
There are 77.17 Females per 100 Males in New Egypt.
What is the Median Population Age in New Egypt?
Median Population Age in New Egypt is 52.9 Years.
What is the Average Family Size in New Egypt
Average Family Size in New Egypt is 2.6 People.
What is the Average Household Size in New Egypt
Average Household Size in New Egypt is 1.8 People.
How Large is the Labor Force in New Egypt?
There are 962 People in the Labor Forcein in New Egypt.
What is the Percentage of People in the Labor Force in New Egypt?
66.7% of People are in the Labor Force in New Egypt.
What is the Unemployment Rate in New Egypt?
Unemployment Rate in New Egypt is 6.8%.