Ocean City, NJ Map & Demographics
Ocean City Map
Ocean City Overview
$68,244
PER CAPITA INCOME
$135,343
AVG FAMILY INCOME
$98,576
AVG HOUSEHOLD INCOME
38.6%
WAGE / INCOME GAP [ % ]
61.4¢/ $1
WAGE / INCOME GAP [ $ ]
$8,028
FAMILY INCOME DEFICIT
0.50
INEQUALITY / GINI INDEX
11,260
TOTAL POPULATION
5,108
MALE POPULATION
6,152
FEMALE POPULATION
83.03
MALES / 100 FEMALES
120.44
FEMALES / 100 MALES
56.9
MEDIAN AGE
2.7
AVG FAMILY SIZE
2.0
AVG HOUSEHOLD SIZE
5,280
LABOR FORCE [ PEOPLE ]
53.3%
PERCENT IN LABOR FORCE
2.9%
UNEMPLOYMENT RATE
Ocean City Zip Codes
Ocean City Area Codes
Income in Ocean City
Income Overview in Ocean City
Per Capita Income in Ocean City is $68,244, while median incomes of families and households are $135,343 and $98,576 respectively.
| Characteristic | Number | Measure |
| Per Capita Income | 11,260 | $68,244 |
| Median Family Income | 3,260 | $135,343 |
| Mean Family Income | 3,260 | $176,287 |
| Median Household Income | 5,521 | $98,576 |
| Mean Household Income | 5,521 | $141,849 |
| Income Deficit | 3,260 | $8,028 |
| Wage / Income Gap (%) | 11,260 | 38.59% |
| Wage / Income Gap ($) | 11,260 | 61.41¢ per $1 |
| Gini / Inequality Index | 11,260 | 0.50 |
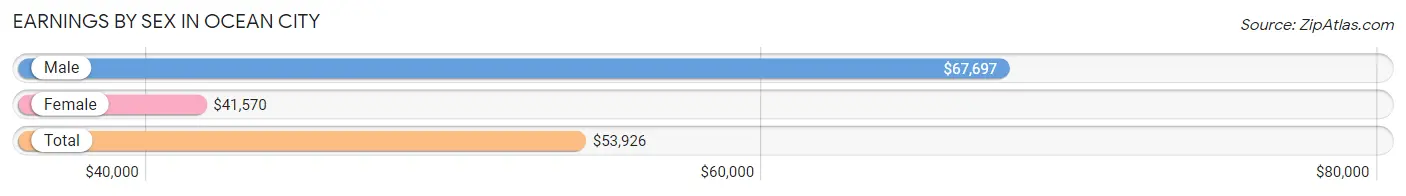
Earnings by Sex in Ocean City
Average Earnings in Ocean City are $53,926, $67,697 for men and $41,570 for women, a difference of 38.6%.
| Sex | Number | Average Earnings |
| Male | 2,891 (50.3%) | $67,697 |
| Female | 2,852 (49.7%) | $41,570 |
| Total | 5,743 (100.0%) | $53,926 |
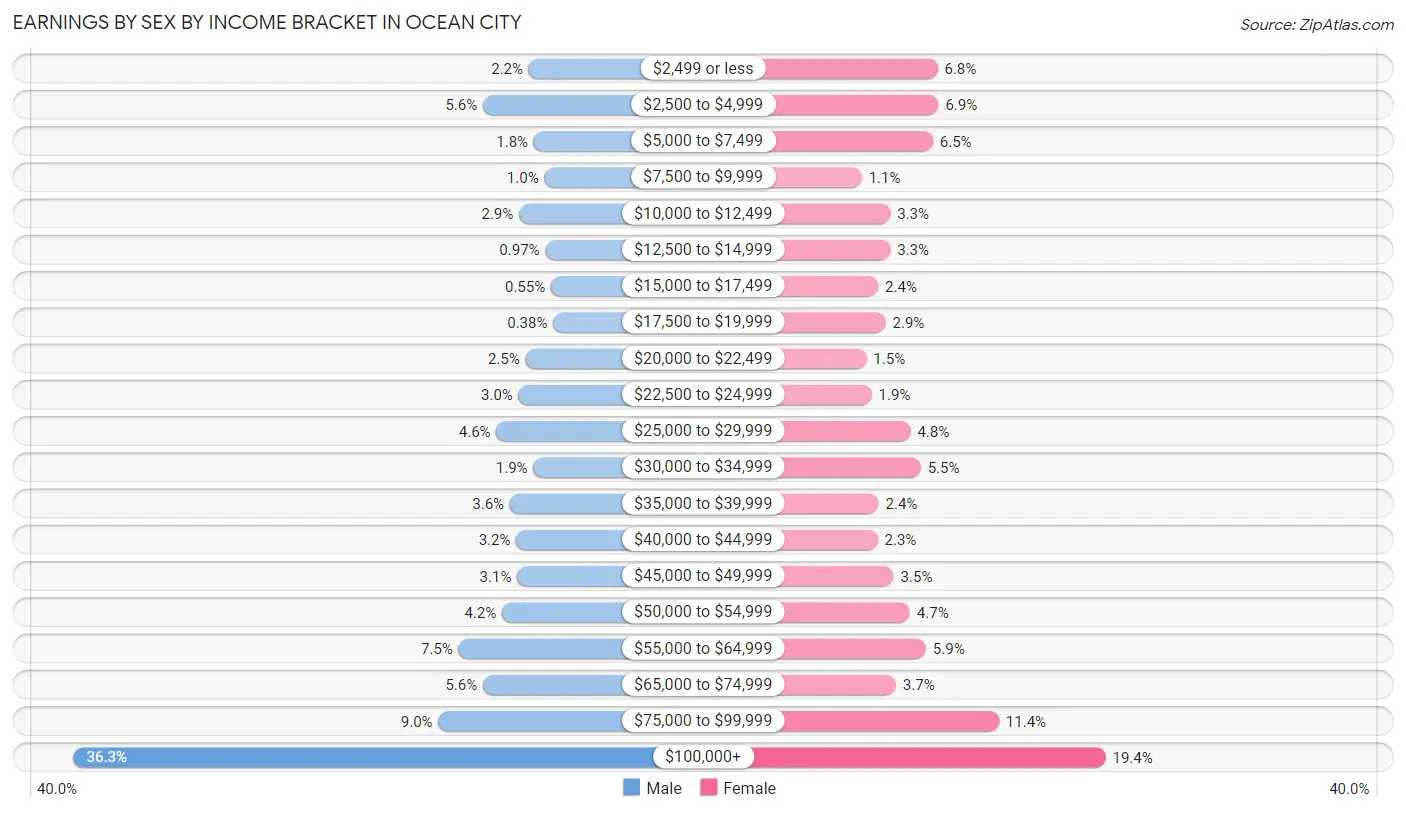
Earnings by Sex by Income Bracket in Ocean City
The most common earnings brackets in Ocean City are $100,000+ for men (1,050 | 36.3%) and $100,000+ for women (553 | 19.4%).
| Income | Male | Female |
| $2,499 or less | 64 (2.2%) | 194 (6.8%) |
| $2,500 to $4,999 | 163 (5.6%) | 196 (6.9%) |
| $5,000 to $7,499 | 53 (1.8%) | 184 (6.5%) |
| $7,500 to $9,999 | 30 (1.0%) | 32 (1.1%) |
| $10,000 to $12,499 | 85 (2.9%) | 93 (3.3%) |
| $12,500 to $14,999 | 28 (1.0%) | 93 (3.3%) |
| $15,000 to $17,499 | 16 (0.5%) | 67 (2.4%) |
| $17,500 to $19,999 | 11 (0.4%) | 83 (2.9%) |
| $20,000 to $22,499 | 71 (2.5%) | 42 (1.5%) |
| $22,500 to $24,999 | 86 (3.0%) | 53 (1.9%) |
| $25,000 to $29,999 | 134 (4.6%) | 136 (4.8%) |
| $30,000 to $34,999 | 54 (1.9%) | 158 (5.5%) |
| $35,000 to $39,999 | 105 (3.6%) | 68 (2.4%) |
| $40,000 to $44,999 | 91 (3.2%) | 66 (2.3%) |
| $45,000 to $49,999 | 89 (3.1%) | 100 (3.5%) |
| $50,000 to $54,999 | 122 (4.2%) | 135 (4.7%) |
| $55,000 to $64,999 | 216 (7.5%) | 169 (5.9%) |
| $65,000 to $74,999 | 163 (5.6%) | 105 (3.7%) |
| $75,000 to $99,999 | 260 (9.0%) | 325 (11.4%) |
| $100,000+ | 1,050 (36.3%) | 553 (19.4%) |
| Total | 2,891 (100.0%) | 2,852 (100.0%) |
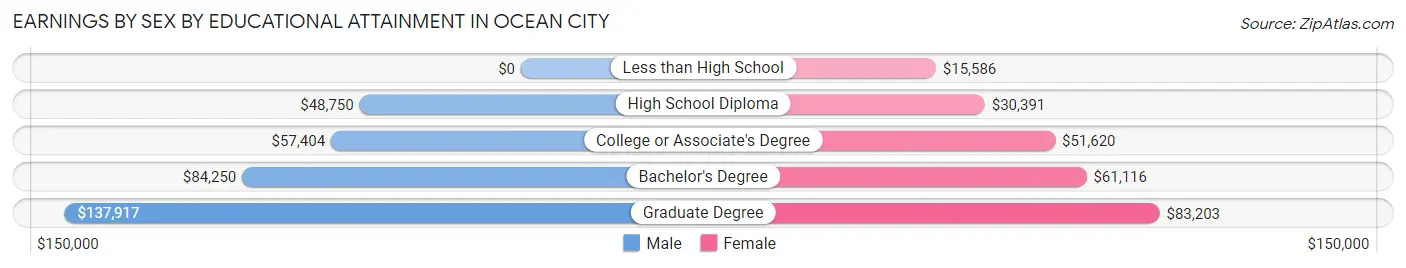
Earnings by Sex by Educational Attainment in Ocean City
Average earnings in Ocean City are $75,781 for men and $51,332 for women, a difference of 32.3%. Men with an educational attainment of graduate degree enjoy the highest average annual earnings of $137,917, while those with high school diploma education earn the least with $48,750. Women with an educational attainment of graduate degree earn the most with the average annual earnings of $83,203, while those with less than high school education have the smallest earnings of $15,586.
| Educational Attainment | Male Income | Female Income |
| Less than High School | - | - |
| High School Diploma | $48,750 | $30,391 |
| College or Associate's Degree | $57,404 | $51,620 |
| Bachelor's Degree | $84,250 | $61,116 |
| Graduate Degree | $137,917 | $83,203 |
| Total | $75,781 | $51,332 |
Family Income in Ocean City
Family Income Brackets in Ocean City
According to the Ocean City family income data, there are 906 families falling into the $200,000+ income range, which is the most common income bracket and makes up 27.8% of all families. Conversely, the less than $10,000 income bracket is the least frequent group with only 26 families (0.8%) belonging to this category.
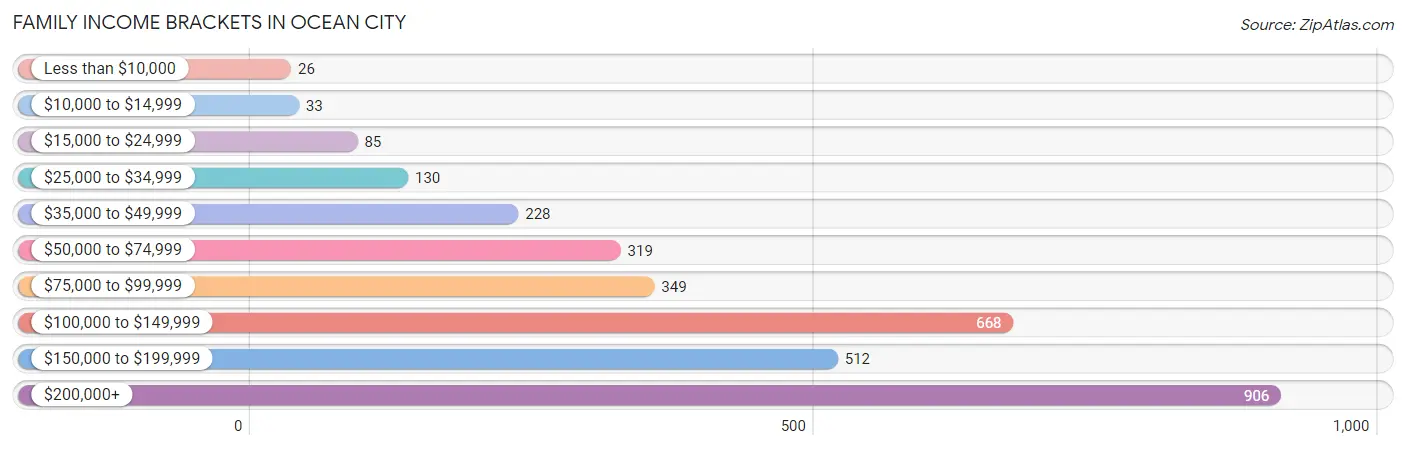
| Income Bracket | # Families | % Families |
| Less than $10,000 | 26 | 0.8% |
| $10,000 to $14,999 | 33 | 1.0% |
| $15,000 to $24,999 | 85 | 2.6% |
| $25,000 to $34,999 | 130 | 4.0% |
| $35,000 to $49,999 | 228 | 7.0% |
| $50,000 to $74,999 | 319 | 9.8% |
| $75,000 to $99,999 | 349 | 10.7% |
| $100,000 to $149,999 | 668 | 20.5% |
| $150,000 to $199,999 | 512 | 15.7% |
| $200,000+ | 906 | 27.8% |
Family Income by Famaliy Size in Ocean City
6-person families (45 | 1.4%) account for the highest median family income in Ocean City with $250,001 per family, while 2-person families (2,128 | 65.3%) have the highest median income of $59,245 per family member.
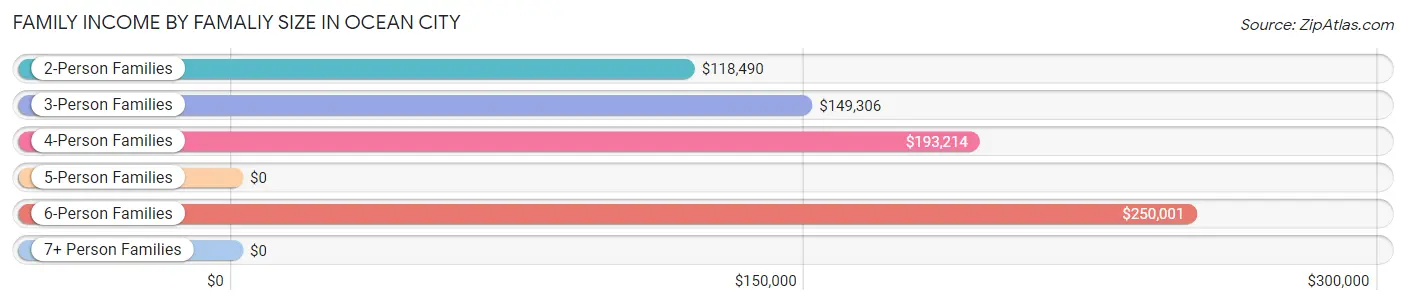
| Income Bracket | # Families | Median Income |
| 2-Person Families | 2,128 (65.3%) | $118,490 |
| 3-Person Families | 391 (12.0%) | $149,306 |
| 4-Person Families | 474 (14.5%) | $193,214 |
| 5-Person Families | 217 (6.7%) | $0 |
| 6-Person Families | 45 (1.4%) | $250,001 |
| 7+ Person Families | 5 (0.2%) | $0 |
| Total | 3,260 (100.0%) | $135,343 |
Family Income by Number of Earners in Ocean City
The median family income in Ocean City is $135,343, with families comprising 3+ earners (390) having the highest median family income of $240,364, while families with no earners (751) have the lowest median family income of $95,563, accounting for 12.0% and 23.0% of families, respectively.
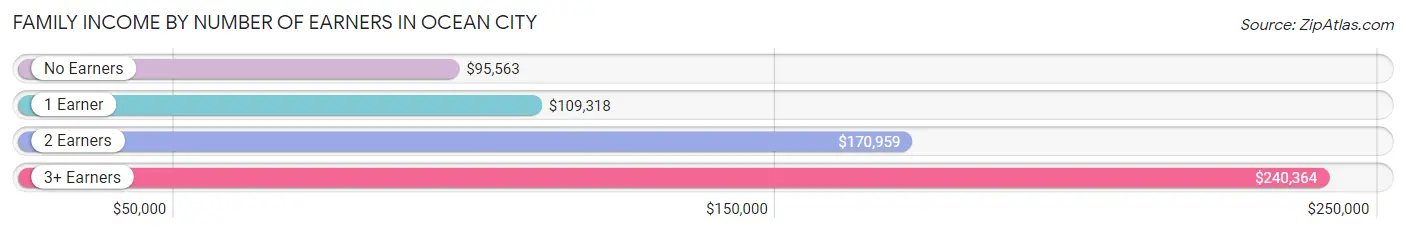
| Number of Earners | # Families | Median Income |
| No Earners | 751 (23.0%) | $95,563 |
| 1 Earner | 1,052 (32.3%) | $109,318 |
| 2 Earners | 1,067 (32.7%) | $170,959 |
| 3+ Earners | 390 (12.0%) | $240,364 |
| Total | 3,260 (100.0%) | $135,343 |
Household Income in Ocean City
Household Income Brackets in Ocean City
With 1,176 households falling in the category, the $200,000+ income range is the most frequent in Ocean City, accounting for 21.3% of all households. In contrast, only 155 households (2.8%) fall into the $10,000 to $14,999 income bracket, making it the least populous group.
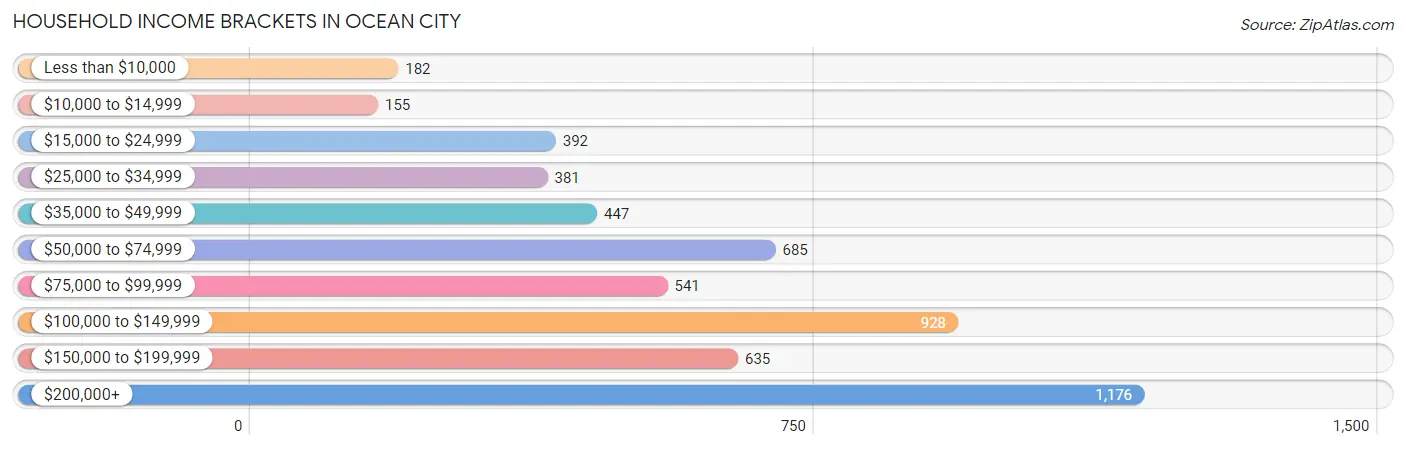
| Income Bracket | # Households | % Households |
| Less than $10,000 | 182 | 3.3% |
| $10,000 to $14,999 | 155 | 2.8% |
| $15,000 to $24,999 | 392 | 7.1% |
| $25,000 to $34,999 | 381 | 6.9% |
| $35,000 to $49,999 | 447 | 8.1% |
| $50,000 to $74,999 | 685 | 12.4% |
| $75,000 to $99,999 | 541 | 9.8% |
| $100,000 to $149,999 | 928 | 16.8% |
| $150,000 to $199,999 | 635 | 11.5% |
| $200,000+ | 1,176 | 21.3% |
Household Income by Householder Age in Ocean City
The median household income in Ocean City is $98,576, with the highest median household income of $148,750 found in the 45 to 64 years age bracket for the primary householder. A total of 2,137 households (38.7%) fall into this category. Meanwhile, the 15 to 24 years age bracket for the primary householder has the lowest median household income of $0, with 85 households (1.5%) in this group.
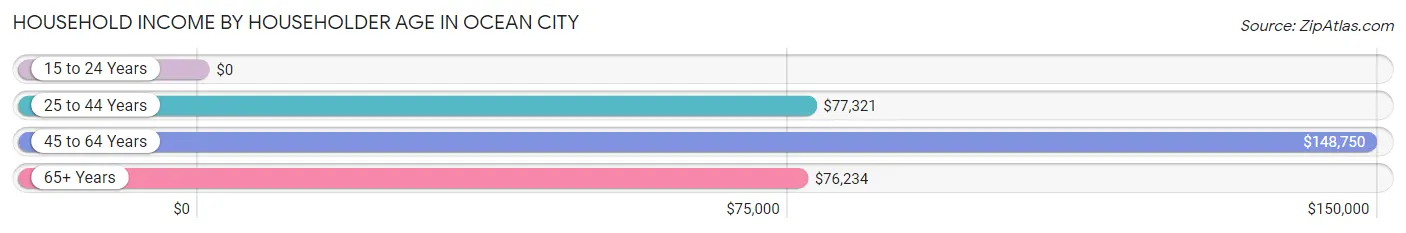
| Income Bracket | # Households | Median Income |
| 15 to 24 Years | 85 (1.5%) | $0 |
| 25 to 44 Years | 826 (15.0%) | $77,321 |
| 45 to 64 Years | 2,137 (38.7%) | $148,750 |
| 65+ Years | 2,473 (44.8%) | $76,234 |
| Total | 5,521 (100.0%) | $98,576 |
Poverty in Ocean City
Income Below Poverty by Sex and Age in Ocean City
With 9.8% poverty level for males and 10.6% for females among the residents of Ocean City, 15 year old males and under 5 year old females are the most vulnerable to poverty, with 62 males (50.4%) and 115 females (66.9%) in their respective age groups living below the poverty level.
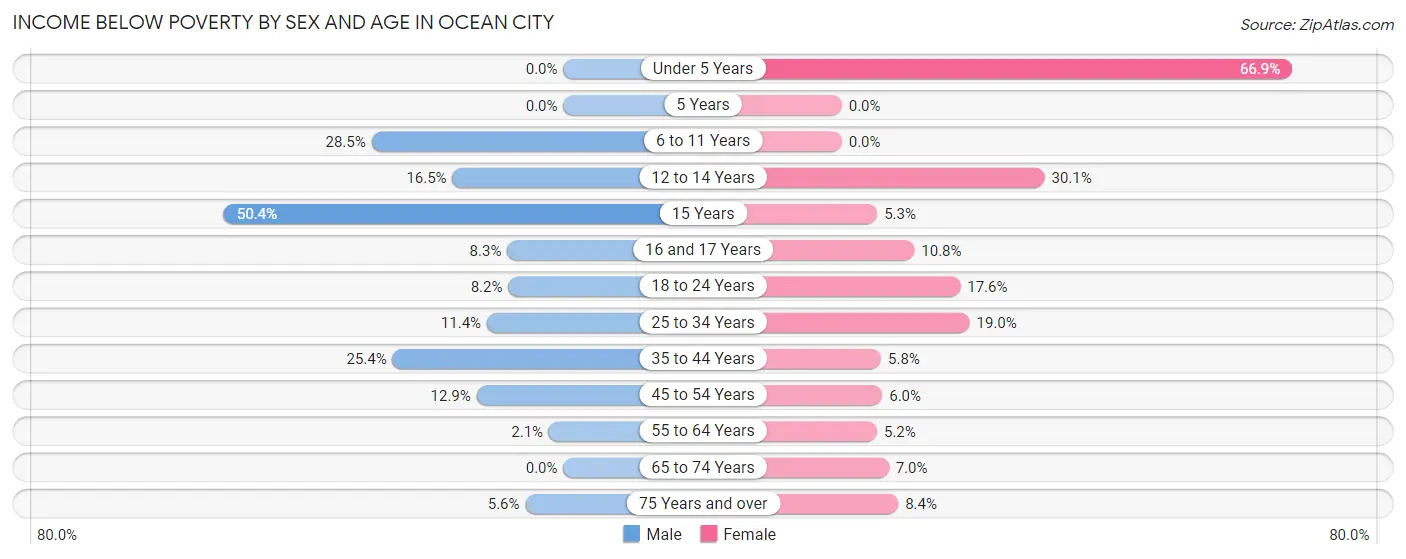
| Age Bracket | Male | Female |
| Under 5 Years | 0 (0.0%) | 115 (66.9%) |
| 5 Years | 0 (0.0%) | 0 (0.0%) |
| 6 to 11 Years | 92 (28.5%) | 0 (0.0%) |
| 12 to 14 Years | 14 (16.5%) | 81 (30.1%) |
| 15 Years | 62 (50.4%) | 5 (5.3%) |
| 16 and 17 Years | 9 (8.3%) | 29 (10.8%) |
| 18 to 24 Years | 22 (8.2%) | 51 (17.6%) |
| 25 to 34 Years | 52 (11.4%) | 82 (19.0%) |
| 35 to 44 Years | 89 (25.4%) | 21 (5.8%) |
| 45 to 54 Years | 101 (12.9%) | 42 (6.0%) |
| 55 to 64 Years | 19 (2.1%) | 61 (5.2%) |
| 65 to 74 Years | 0 (0.0%) | 73 (7.0%) |
| 75 Years and over | 39 (5.6%) | 83 (8.4%) |
| Total | 499 (9.8%) | 643 (10.6%) |
Income Above Poverty by Sex and Age in Ocean City
According to the poverty statistics in Ocean City, males aged under 5 years and females aged 5 years are the age groups that are most secure financially, with 100.0% of males and 100.0% of females in these age groups living above the poverty line.
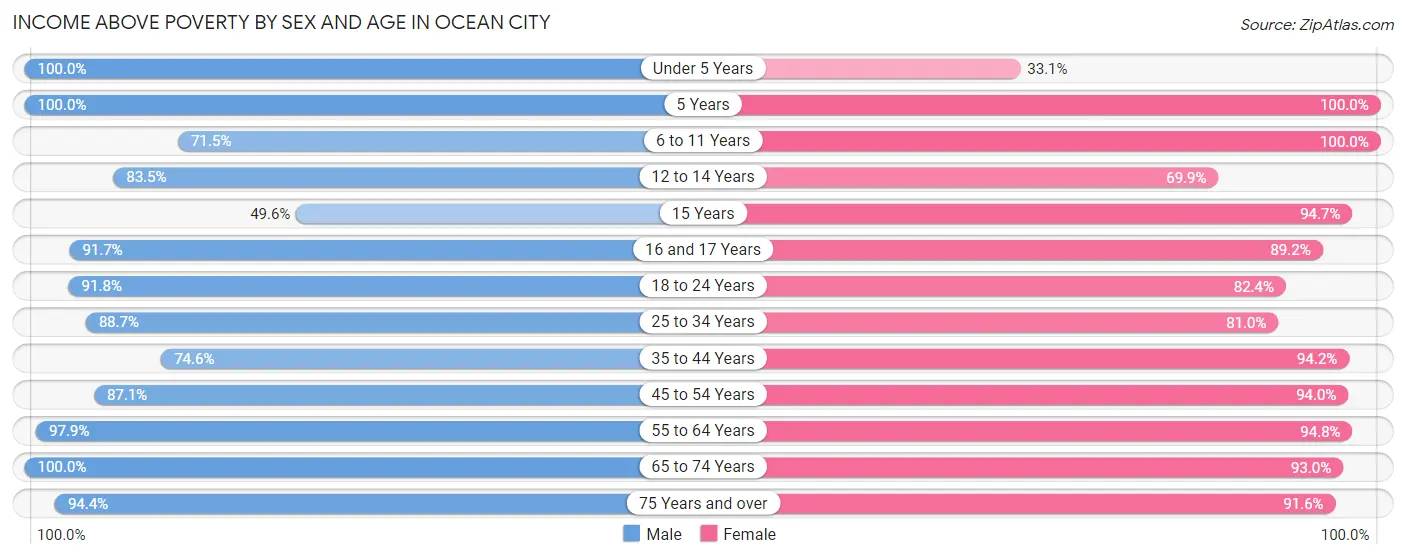
| Age Bracket | Male | Female |
| Under 5 Years | 34 (100.0%) | 57 (33.1%) |
| 5 Years | 7 (100.0%) | 33 (100.0%) |
| 6 to 11 Years | 231 (71.5%) | 212 (100.0%) |
| 12 to 14 Years | 71 (83.5%) | 188 (69.9%) |
| 15 Years | 61 (49.6%) | 90 (94.7%) |
| 16 and 17 Years | 99 (91.7%) | 240 (89.2%) |
| 18 to 24 Years | 247 (91.8%) | 239 (82.4%) |
| 25 to 34 Years | 406 (88.6%) | 350 (81.0%) |
| 35 to 44 Years | 262 (74.6%) | 339 (94.2%) |
| 45 to 54 Years | 683 (87.1%) | 657 (94.0%) |
| 55 to 64 Years | 870 (97.9%) | 1,106 (94.8%) |
| 65 to 74 Years | 974 (100.0%) | 975 (93.0%) |
| 75 Years and over | 652 (94.4%) | 907 (91.6%) |
| Total | 4,597 (90.2%) | 5,393 (89.3%) |
Income Below Poverty Among Married-Couple Families in Ocean City
The poverty statistics for married-couple families in Ocean City show that 5.4% or 152 of the total 2,793 families live below the poverty line. Families with 1 or 2 children have the highest poverty rate of 17.1%, comprising of 109 families. On the other hand, families with 3 or 4 children have the lowest poverty rate of 0.0%, which includes 0 families.
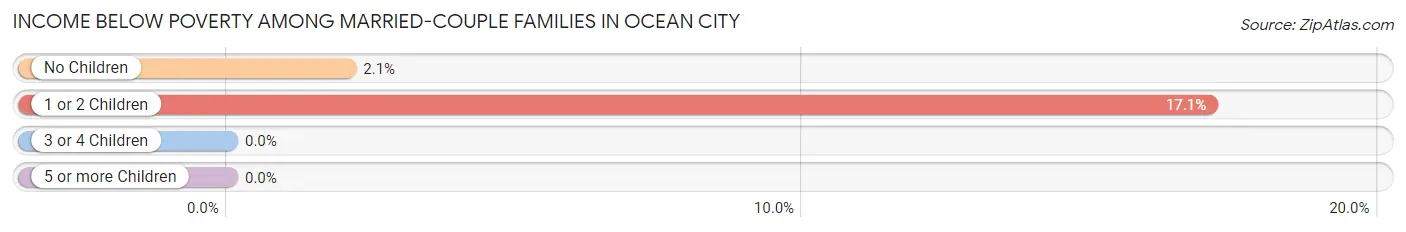
| Children | Above Poverty | Below Poverty |
| No Children | 2,042 (97.9%) | 43 (2.1%) |
| 1 or 2 Children | 530 (82.9%) | 109 (17.1%) |
| 3 or 4 Children | 69 (100.0%) | 0 (0.0%) |
| 5 or more Children | 0 (0.0%) | 0 (0.0%) |
| Total | 2,641 (94.6%) | 152 (5.4%) |
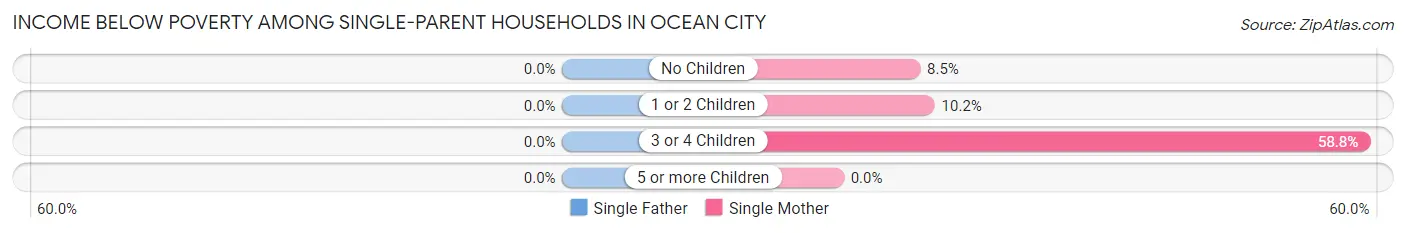
Income Below Poverty Among Single-Parent Households in Ocean City
| Children | Single Father | Single Mother |
| No Children | 0 (0.0%) | 17 (8.5%) |
| 1 or 2 Children | 0 (0.0%) | 18 (10.2%) |
| 3 or 4 Children | 0 (0.0%) | 10 (58.8%) |
| 5 or more Children | 0 (0.0%) | 0 (0.0%) |
| Total | 0 (0.0%) | 45 (11.5%) |
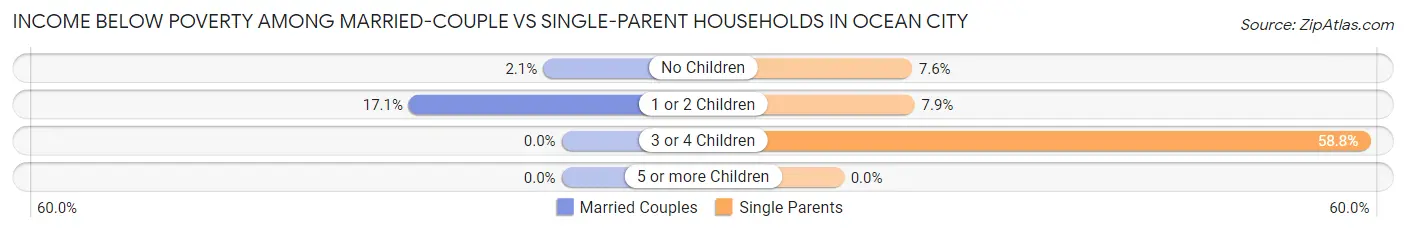
Income Below Poverty Among Married-Couple vs Single-Parent Households in Ocean City
The poverty data for Ocean City shows that 152 of the married-couple family households (5.4%) and 45 of the single-parent households (9.6%) are living below the poverty level. Within the married-couple family households, those with 1 or 2 children have the highest poverty rate, with 109 households (17.1%) falling below the poverty line. Among the single-parent households, those with 3 or 4 children have the highest poverty rate, with 10 household (58.8%) living below poverty.
| Children | Married-Couple Families | Single-Parent Households |
| No Children | 43 (2.1%) | 17 (7.6%) |
| 1 or 2 Children | 109 (17.1%) | 18 (7.9%) |
| 3 or 4 Children | 0 (0.0%) | 10 (58.8%) |
| 5 or more Children | 0 (0.0%) | 0 (0.0%) |
| Total | 152 (5.4%) | 45 (9.6%) |
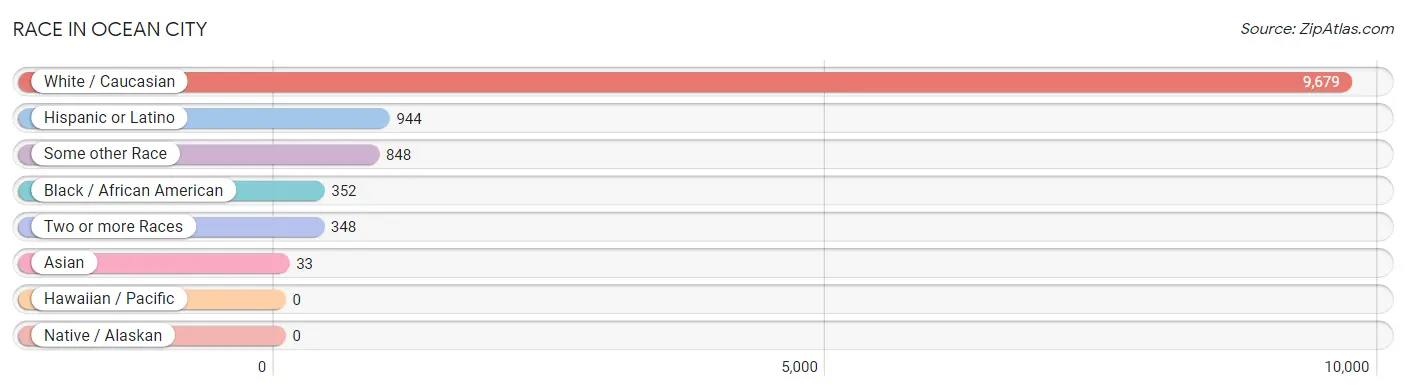
Race in Ocean City
The most populous races in Ocean City are White / Caucasian (9,679 | 86.0%), Hispanic or Latino (944 | 8.4%), and Some other Race (848 | 7.5%).
| Race | # Population | % Population |
| Asian | 33 | 0.3% |
| Black / African American | 352 | 3.1% |
| Hawaiian / Pacific | 0 | 0.0% |
| Hispanic or Latino | 944 | 8.4% |
| Native / Alaskan | 0 | 0.0% |
| White / Caucasian | 9,679 | 86.0% |
| Two or more Races | 348 | 3.1% |
| Some other Race | 848 | 7.5% |
| Total | 11,260 | 100.0% |
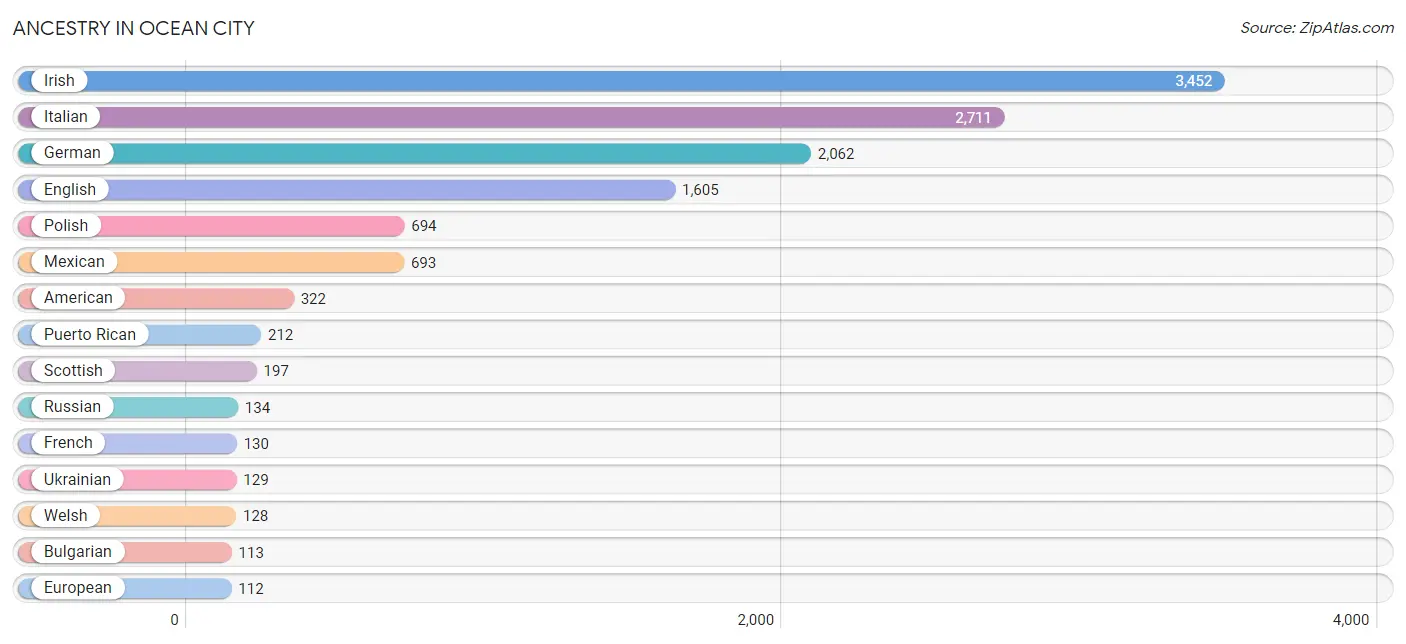
Ancestry in Ocean City
The most populous ancestries reported in Ocean City are Irish (3,452 | 30.7%), Italian (2,711 | 24.1%), German (2,062 | 18.3%), English (1,605 | 14.2%), and Polish (694 | 6.2%), together accounting for 93.5% of all Ocean City residents.
| Ancestry | # Population | % Population |
| African | 8 | 0.1% |
| Albanian | 15 | 0.1% |
| American | 322 | 2.9% |
| Arab | 37 | 0.3% |
| Armenian | 9 | 0.1% |
| Australian | 8 | 0.1% |
| Austrian | 44 | 0.4% |
| Belgian | 6 | 0.1% |
| Brazilian | 1 | 0.0% |
| British | 79 | 0.7% |
| Bulgarian | 113 | 1.0% |
| Canadian | 11 | 0.1% |
| Central American | 28 | 0.3% |
| Cherokee | 7 | 0.1% |
| Czech | 43 | 0.4% |
| Czechoslovakian | 20 | 0.2% |
| Danish | 4 | 0.0% |
| Dutch | 79 | 0.7% |
| Eastern European | 35 | 0.3% |
| English | 1,605 | 14.2% |
| European | 112 | 1.0% |
| Finnish | 15 | 0.1% |
| French | 130 | 1.1% |
| French Canadian | 4 | 0.0% |
| German | 2,062 | 18.3% |
| Greek | 36 | 0.3% |
| Guatemalan | 28 | 0.3% |
| Hungarian | 66 | 0.6% |
| Indian (Asian) | 11 | 0.1% |
| Irish | 3,452 | 30.7% |
| Italian | 2,711 | 24.1% |
| Korean | 18 | 0.2% |
| Lebanese | 37 | 0.3% |
| Lithuanian | 58 | 0.5% |
| Luxembourger | 5 | 0.0% |
| Maltese | 9 | 0.1% |
| Mexican | 693 | 6.1% |
| Northern European | 5 | 0.0% |
| Norwegian | 49 | 0.4% |
| Pennsylvania German | 24 | 0.2% |
| Polish | 694 | 6.2% |
| Portuguese | 6 | 0.1% |
| Puerto Rican | 212 | 1.9% |
| Romanian | 5 | 0.0% |
| Russian | 134 | 1.2% |
| Samoan | 26 | 0.2% |
| Scandinavian | 7 | 0.1% |
| Scotch-Irish | 81 | 0.7% |
| Scottish | 197 | 1.8% |
| Serbian | 14 | 0.1% |
| Slavic | 9 | 0.1% |
| Slovak | 34 | 0.3% |
| Spanish | 11 | 0.1% |
| Subsaharan African | 8 | 0.1% |
| Swedish | 49 | 0.4% |
| Swiss | 39 | 0.4% |
| Ukrainian | 129 | 1.1% |
| Welsh | 128 | 1.1% | View All 58 Rows |
Immigrants in Ocean City
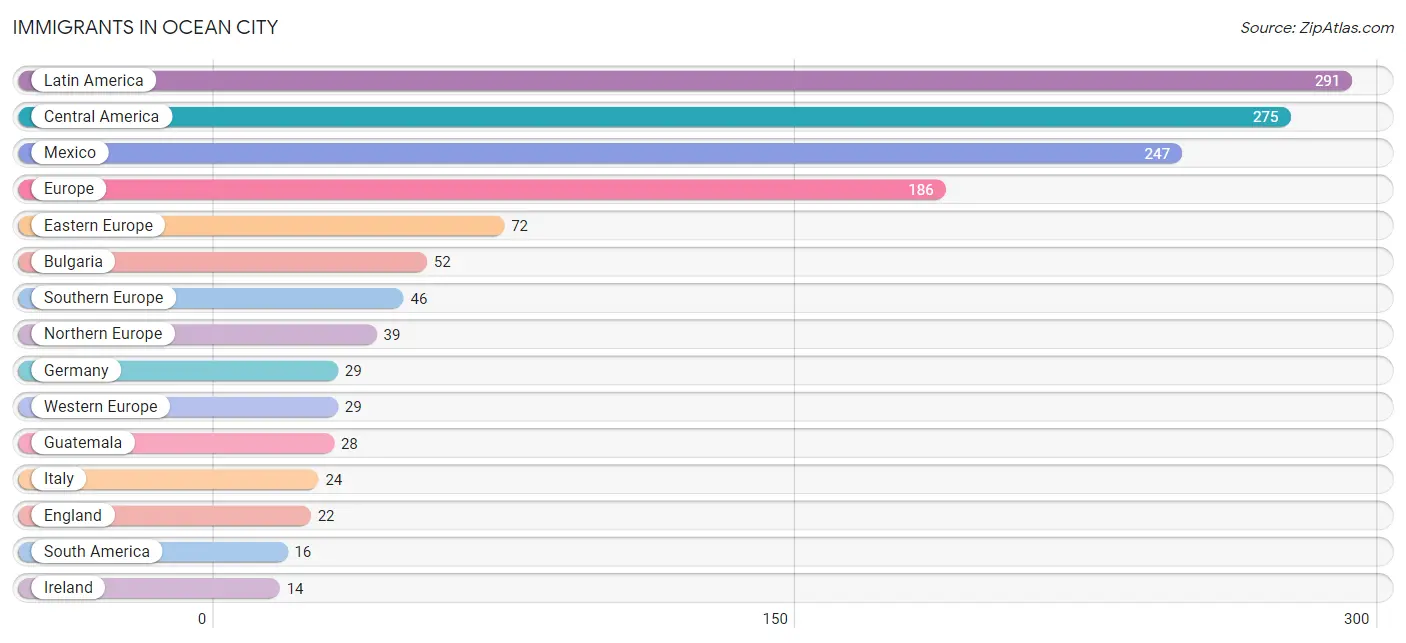
The most numerous immigrant groups reported in Ocean City came from Latin America (291 | 2.6%), Central America (275 | 2.4%), Mexico (247 | 2.2%), Europe (186 | 1.7%), and Eastern Europe (72 | 0.6%), together accounting for 9.5% of all Ocean City residents.
| Immigration Origin | # Population | % Population |
| Asia | 11 | 0.1% |
| Australia | 8 | 0.1% |
| Brazil | 1 | 0.0% |
| Bulgaria | 52 | 0.5% |
| Canada | 10 | 0.1% |
| Central America | 275 | 2.4% |
| Eastern Europe | 72 | 0.6% |
| England | 22 | 0.2% |
| Europe | 186 | 1.7% |
| Germany | 29 | 0.3% |
| Greece | 10 | 0.1% |
| Guatemala | 28 | 0.3% |
| Guyana | 11 | 0.1% |
| Ireland | 14 | 0.1% |
| Italy | 24 | 0.2% |
| Latin America | 291 | 2.6% |
| Latvia | 6 | 0.1% |
| Mexico | 247 | 2.2% |
| Northern Europe | 39 | 0.4% |
| Oceania | 8 | 0.1% |
| Philippines | 11 | 0.1% |
| Portugal | 12 | 0.1% |
| Russia | 5 | 0.0% |
| Scotland | 3 | 0.0% |
| South America | 16 | 0.1% |
| South Eastern Asia | 11 | 0.1% |
| Southern Europe | 46 | 0.4% |
| Venezuela | 4 | 0.0% |
| Western Europe | 29 | 0.3% | View All 29 Rows |
Sex and Age in Ocean City
Sex and Age in Ocean City
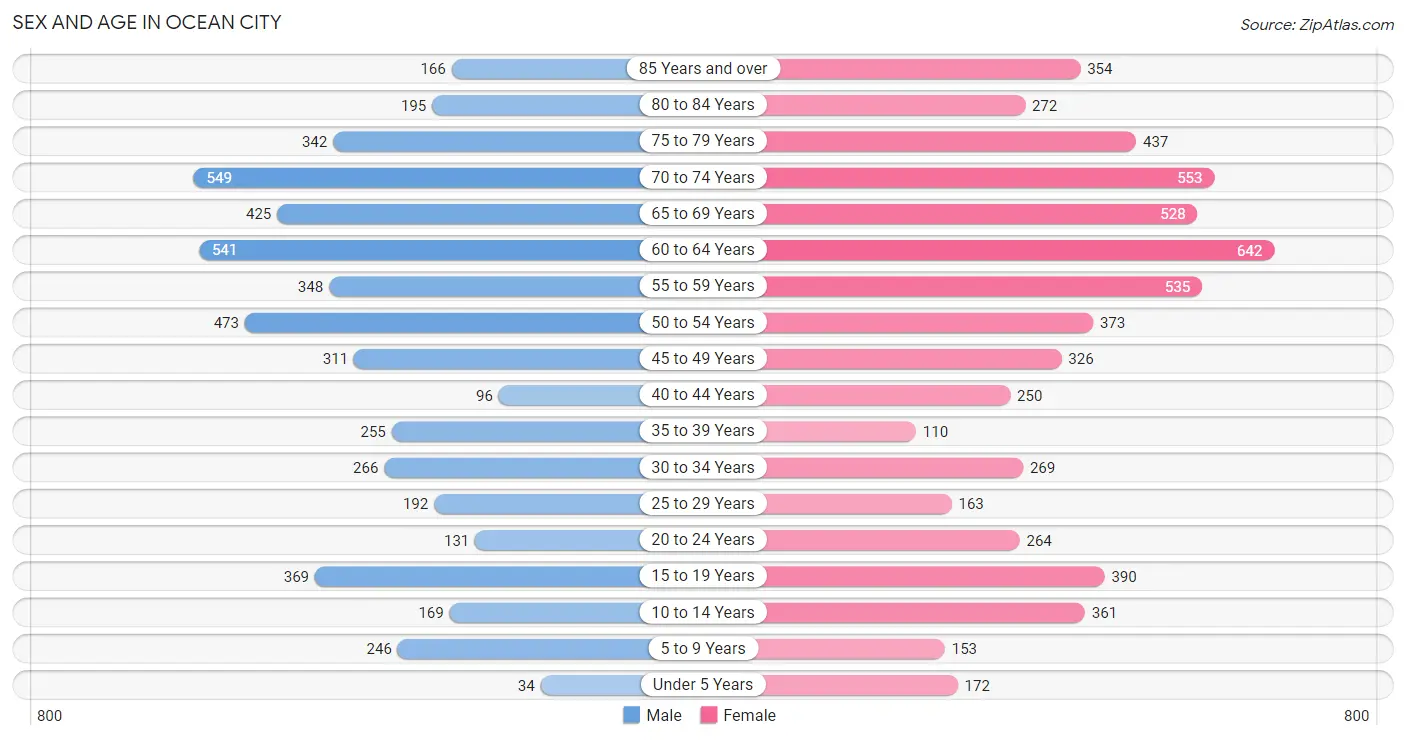
The most populous age groups in Ocean City are 70 to 74 Years (549 | 10.7%) for men and 60 to 64 Years (642 | 10.4%) for women.
| Age Bracket | Male | Female |
| Under 5 Years | 34 (0.7%) | 172 (2.8%) |
| 5 to 9 Years | 246 (4.8%) | 153 (2.5%) |
| 10 to 14 Years | 169 (3.3%) | 361 (5.9%) |
| 15 to 19 Years | 369 (7.2%) | 390 (6.3%) |
| 20 to 24 Years | 131 (2.6%) | 264 (4.3%) |
| 25 to 29 Years | 192 (3.8%) | 163 (2.6%) |
| 30 to 34 Years | 266 (5.2%) | 269 (4.4%) |
| 35 to 39 Years | 255 (5.0%) | 110 (1.8%) |
| 40 to 44 Years | 96 (1.9%) | 250 (4.1%) |
| 45 to 49 Years | 311 (6.1%) | 326 (5.3%) |
| 50 to 54 Years | 473 (9.3%) | 373 (6.1%) |
| 55 to 59 Years | 348 (6.8%) | 535 (8.7%) |
| 60 to 64 Years | 541 (10.6%) | 642 (10.4%) |
| 65 to 69 Years | 425 (8.3%) | 528 (8.6%) |
| 70 to 74 Years | 549 (10.7%) | 553 (9.0%) |
| 75 to 79 Years | 342 (6.7%) | 437 (7.1%) |
| 80 to 84 Years | 195 (3.8%) | 272 (4.4%) |
| 85 Years and over | 166 (3.3%) | 354 (5.8%) |
| Total | 5,108 (100.0%) | 6,152 (100.0%) |
Families and Households in Ocean City
Median Family Size in Ocean City
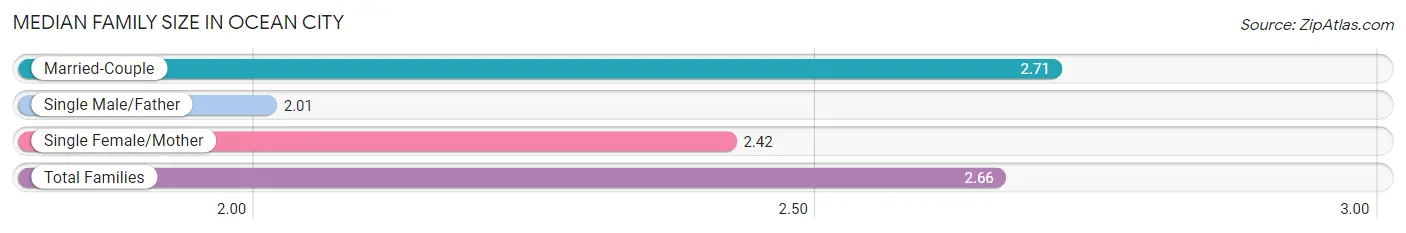
The median family size in Ocean City is 2.66 persons per family, with married-couple families (2,793 | 85.7%) accounting for the largest median family size of 2.71 persons per family. On the other hand, single male/father families (74 | 2.3%) represent the smallest median family size with 2.01 persons per family.
| Family Type | # Families | Family Size |
| Married-Couple | 2,793 (85.7%) | 2.71 |
| Single Male/Father | 74 (2.3%) | 2.01 |
| Single Female/Mother | 393 (12.1%) | 2.42 |
| Total Families | 3,260 (100.0%) | 2.66 |
Median Household Size in Ocean City
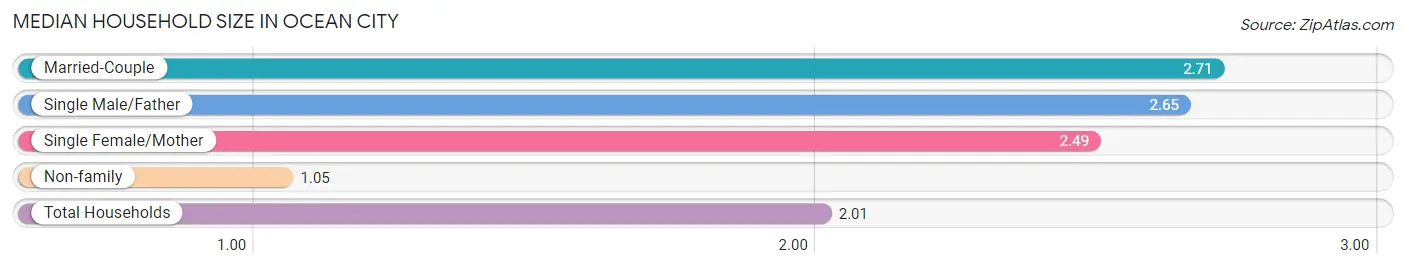
The median household size in Ocean City is 2.01 persons per household, with married-couple households (2,793 | 50.6%) accounting for the largest median household size of 2.71 persons per household. non-family households (2,261 | 40.9%) represent the smallest median household size with 1.05 persons per household.
| Household Type | # Households | Household Size |
| Married-Couple | 2,793 (50.6%) | 2.71 |
| Single Male/Father | 74 (1.3%) | 2.65 |
| Single Female/Mother | 393 (7.1%) | 2.49 |
| Non-family | 2,261 (40.9%) | 1.05 |
| Total Households | 5,521 (100.0%) | 2.01 |
Household Size by Marriage Status in Ocean City
Out of a total of 5,521 households in Ocean City, 3,260 (59.1%) are family households, while 2,261 (40.9%) are nonfamily households. The most numerous type of family households are 2-person households, comprising 2,071, and the most common type of nonfamily households are 1-person households, comprising 2,107.
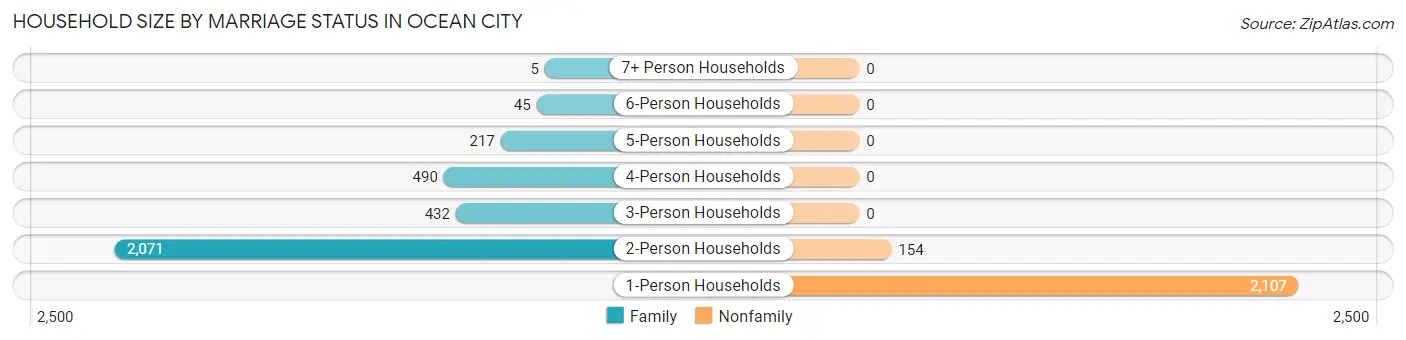
| Household Size | Family Households | Nonfamily Households |
| 1-Person Households | - | 2,107 (38.2%) |
| 2-Person Households | 2,071 (37.5%) | 154 (2.8%) |
| 3-Person Households | 432 (7.8%) | 0 (0.0%) |
| 4-Person Households | 490 (8.9%) | 0 (0.0%) |
| 5-Person Households | 217 (3.9%) | 0 (0.0%) |
| 6-Person Households | 45 (0.8%) | 0 (0.0%) |
| 7+ Person Households | 5 (0.1%) | 0 (0.0%) |
| Total | 3,260 (59.1%) | 2,261 (40.9%) |
Female Fertility in Ocean City
Fertility by Age in Ocean City
Average fertility rate in Ocean City is 11.0 births per 1,000 women. Women in the age bracket of 20 to 34 years have the highest fertility rate with 29.0 births per 1,000 women. Women in the age bracket of 20 to 34 years acount for 100.0% of all women with births.
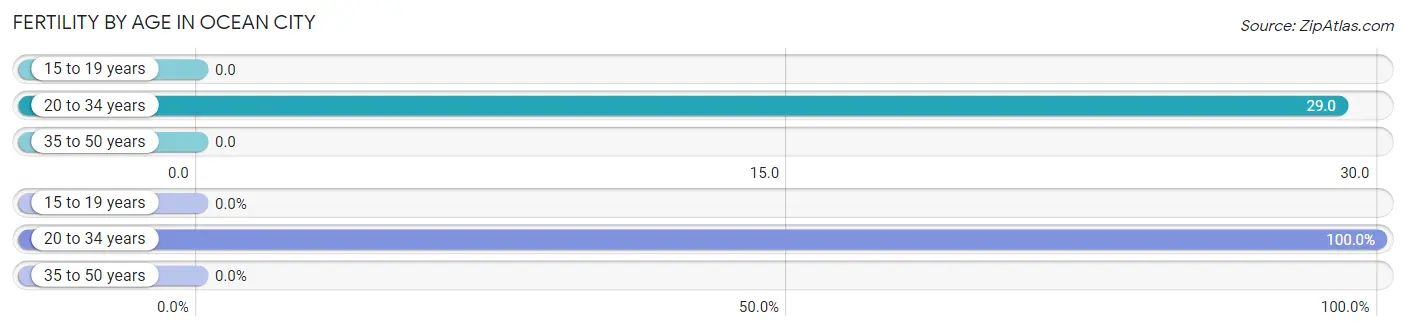
| Age Bracket | Women with Births | Births / 1,000 Women |
| 15 to 19 years | 0 (0.0%) | 0.0 |
| 20 to 34 years | 20 (100.0%) | 29.0 |
| 35 to 50 years | 0 (0.0%) | 0.0 |
| Total | 20 (100.0%) | 11.0 |
Fertility by Age by Marriage Status in Ocean City
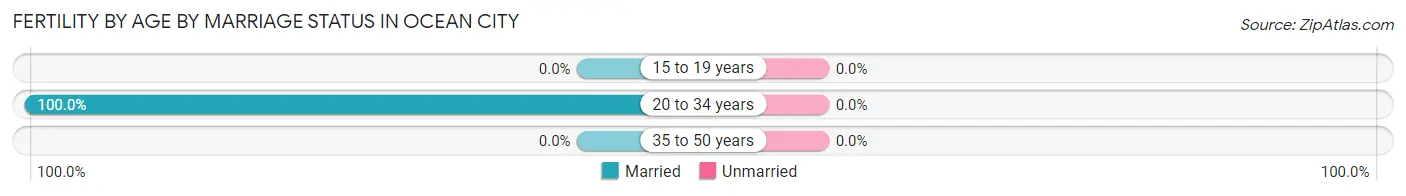
| Age Bracket | Married | Unmarried |
| 15 to 19 years | 0 (0.0%) | 0 (0.0%) |
| 20 to 34 years | 20 (100.0%) | 0 (0.0%) |
| 35 to 50 years | 0 (0.0%) | 0 (0.0%) |
| Total | 20 (100.0%) | 0 (0.0%) |
Fertility by Education in Ocean City
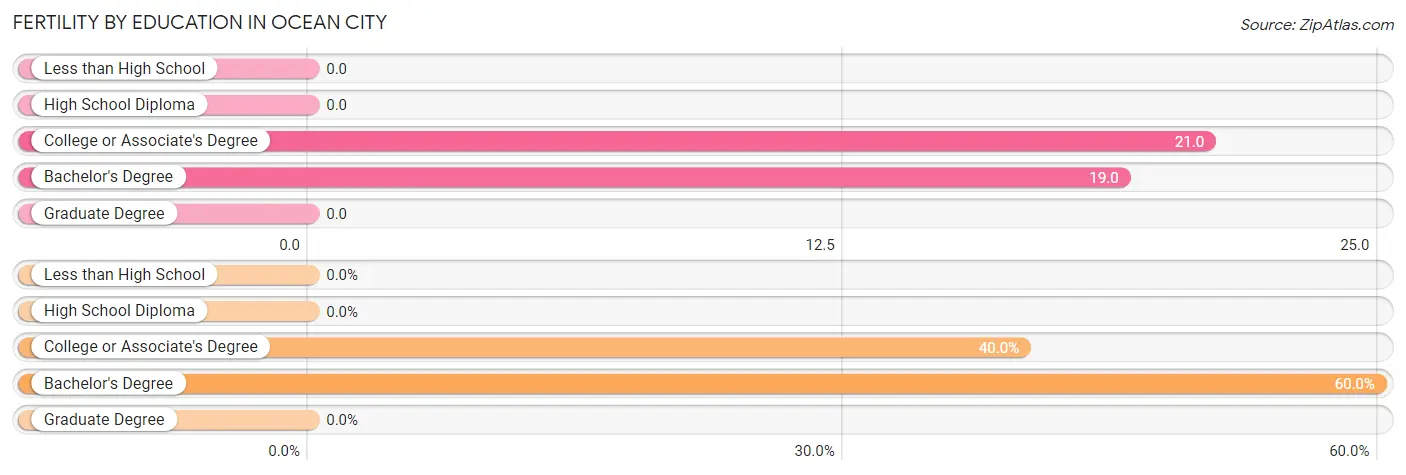
| Educational Attainment | Women with Births | Births / 1,000 Women |
| Less than High School | 0 (0.0%) | 0.0 |
| High School Diploma | 0 (0.0%) | 0.0 |
| College or Associate's Degree | 8 (40.0%) | 21.0 |
| Bachelor's Degree | 12 (60.0%) | 19.0 |
| Graduate Degree | 0 (0.0%) | 0.0 |
| Total | 20 (100.0%) | 11.0 |
Fertility by Education by Marriage Status in Ocean City
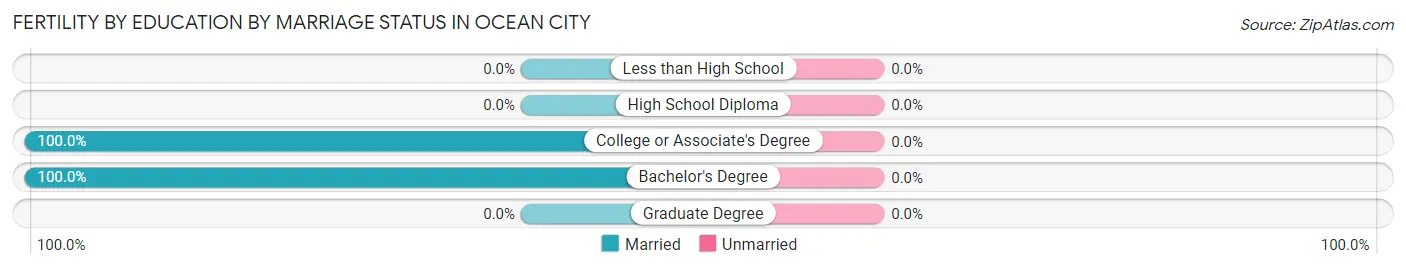
| Educational Attainment | Married | Unmarried |
| Less than High School | 0 (0.0%) | 0 (0.0%) |
| High School Diploma | 0 (0.0%) | 0 (0.0%) |
| College or Associate's Degree | 8 (100.0%) | 0 (0.0%) |
| Bachelor's Degree | 12 (100.0%) | 0 (0.0%) |
| Graduate Degree | 0 (0.0%) | 0 (0.0%) |
| Total | 20 (100.0%) | 0 (0.0%) |
Employment Characteristics in Ocean City
Employment by Class of Employer in Ocean City
Among the 5,108 employed individuals in Ocean City, private company employees (3,024 | 59.2%), local government employees (575 | 11.3%), and not-for-profit organizations (480 | 9.4%) make up the most common classes of employment.
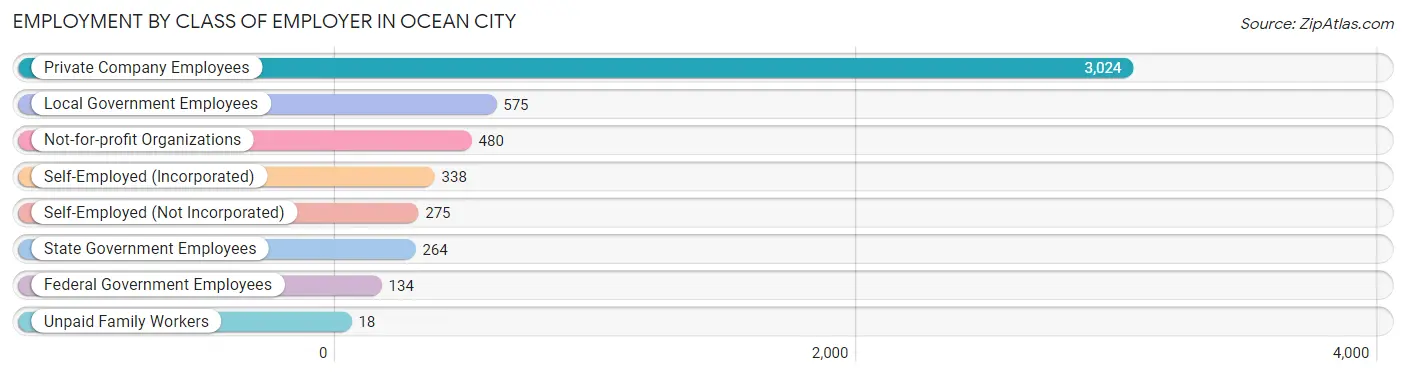
| Employer Class | # Employees | % Employees |
| Private Company Employees | 3,024 | 59.2% |
| Self-Employed (Incorporated) | 338 | 6.6% |
| Self-Employed (Not Incorporated) | 275 | 5.4% |
| Not-for-profit Organizations | 480 | 9.4% |
| Local Government Employees | 575 | 11.3% |
| State Government Employees | 264 | 5.2% |
| Federal Government Employees | 134 | 2.6% |
| Unpaid Family Workers | 18 | 0.4% |
| Total | 5,108 | 100.0% |
Employment Status by Age in Ocean City
According to the labor force statistics for Ocean City, out of the total population over 16 years of age (9,907), 53.3% or 5,280 individuals are in the labor force, with 2.9% or 153 of them unemployed. The age group with the highest labor force participation rate is 35 to 44 years, with 88.5% or 629 individuals in the labor force. Within the labor force, the 30 to 34 years age range has the highest percentage of unemployed individuals, with 7.7% or 35 of them being unemployed.
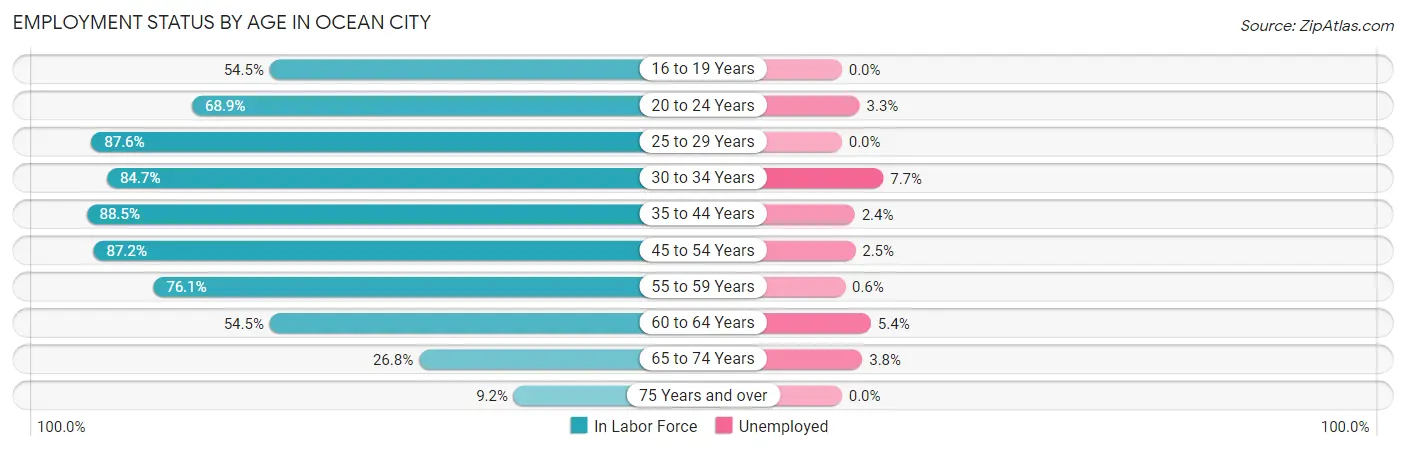
| Age Bracket | In Labor Force | Unemployed |
| 16 to 19 Years | 295 (54.5%) | 0 (0.0%) |
| 20 to 24 Years | 272 (68.9%) | 9 (3.3%) |
| 25 to 29 Years | 311 (87.6%) | 0 (0.0%) |
| 30 to 34 Years | 453 (84.7%) | 35 (7.7%) |
| 35 to 44 Years | 629 (88.5%) | 15 (2.4%) |
| 45 to 54 Years | 1,293 (87.2%) | 32 (2.5%) |
| 55 to 59 Years | 672 (76.1%) | 4 (0.6%) |
| 60 to 64 Years | 645 (54.5%) | 35 (5.4%) |
| 65 to 74 Years | 551 (26.8%) | 21 (3.8%) |
| 75 Years and over | 162 (9.2%) | 0 (0.0%) |
| Total | 5,280 (53.3%) | 153 (2.9%) |
Employment Status by Educational Attainment in Ocean City
According to labor force statistics for Ocean City, 77.7% of individuals (4,002) out of the total population between 25 and 64 years of age (5,150) are in the labor force, with 3.0% or 120 of them being unemployed. The group with the highest labor force participation rate are those with the educational attainment of less than high school, with 89.9% or 187 individuals in the labor force. Within the labor force, individuals with less than high school education have the highest percentage of unemployment, with 13.4% or 25 of them being unemployed.
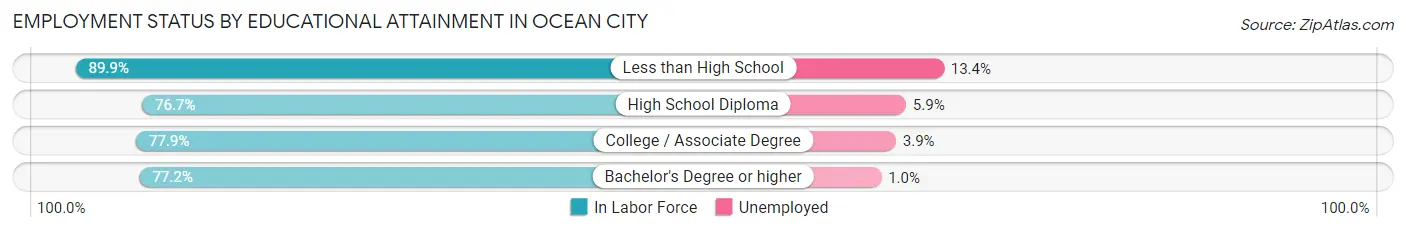
| Educational Attainment | In Labor Force | Unemployed |
| Less than High School | 187 (89.9%) | 28 (13.4%) |
| High School Diploma | 817 (76.7%) | 63 (5.9%) |
| College / Associate Degree | 640 (77.9%) | 32 (3.9%) |
| Bachelor's Degree or higher | 2,358 (77.2%) | 31 (1.0%) |
| Total | 4,002 (77.7%) | 154 (3.0%) |
Employment Occupations by Sex in Ocean City
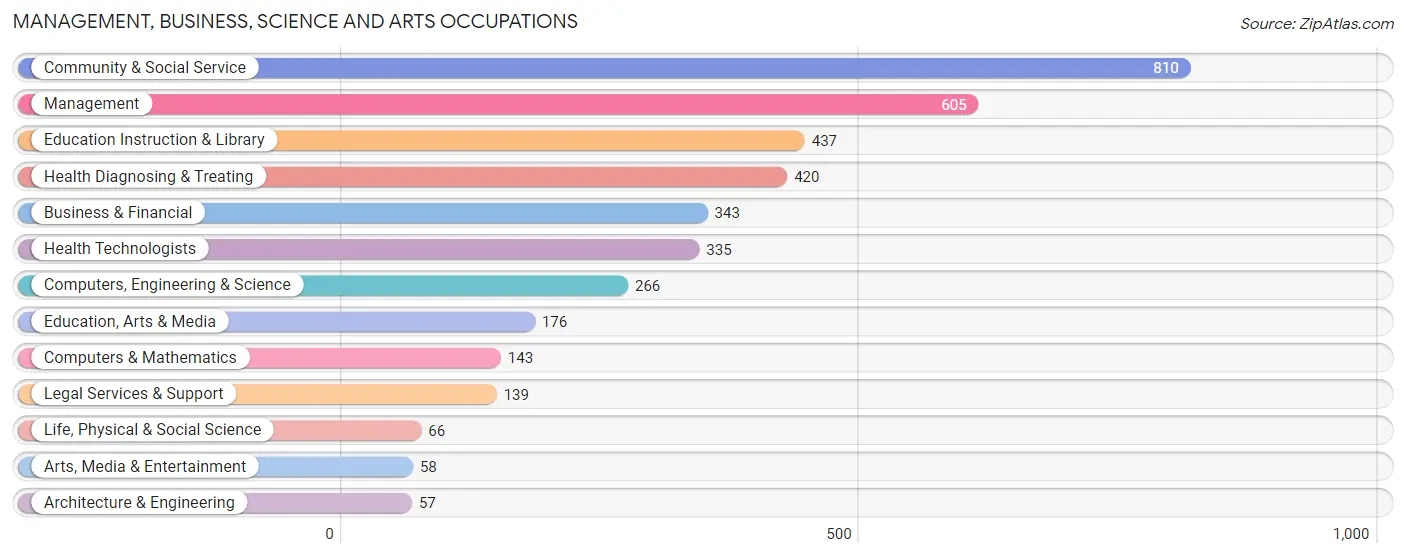
Management, Business, Science and Arts Occupations
The most common Management, Business, Science and Arts occupations in Ocean City are Community & Social Service (810 | 15.8%), Management (605 | 11.8%), Education Instruction & Library (437 | 8.5%), Health Diagnosing & Treating (420 | 8.2%), and Business & Financial (343 | 6.7%).
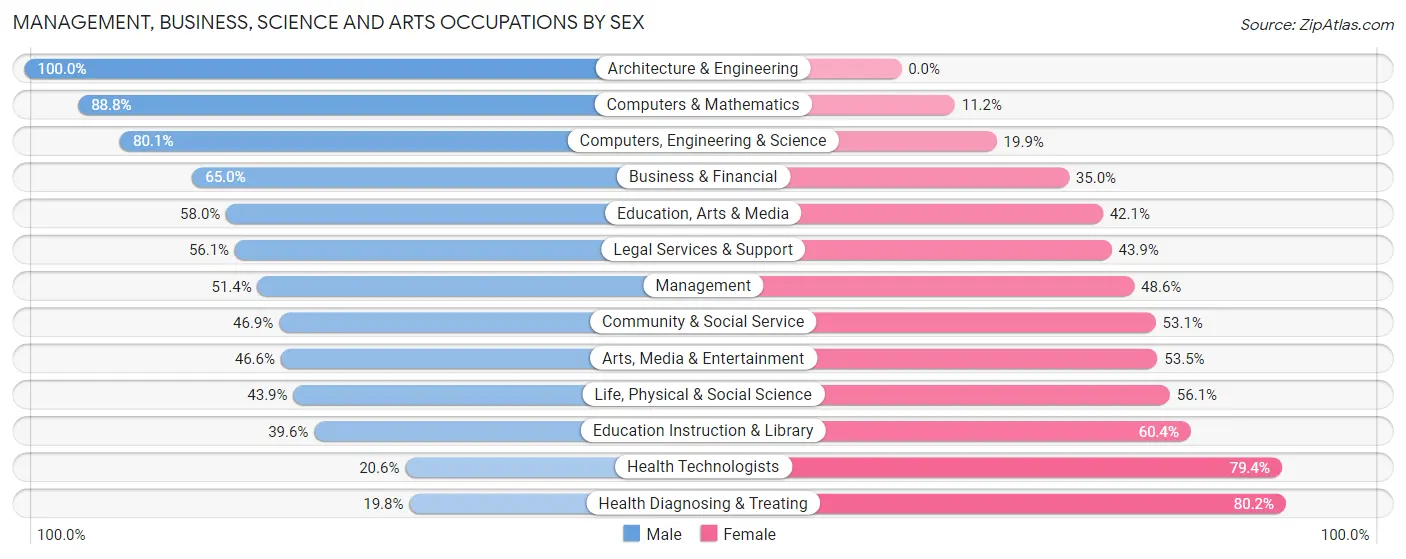
Management, Business, Science and Arts Occupations by Sex
Within the Management, Business, Science and Arts occupations in Ocean City, the most male-oriented occupations are Architecture & Engineering (100.0%), Computers & Mathematics (88.8%), and Computers, Engineering & Science (80.1%), while the most female-oriented occupations are Health Diagnosing & Treating (80.2%), Health Technologists (79.4%), and Education Instruction & Library (60.4%).
| Occupation | Male | Female |
| Management | 311 (51.4%) | 294 (48.6%) |
| Business & Financial | 223 (65.0%) | 120 (35.0%) |
| Computers, Engineering & Science | 213 (80.1%) | 53 (19.9%) |
| Computers & Mathematics | 127 (88.8%) | 16 (11.2%) |
| Architecture & Engineering | 57 (100.0%) | 0 (0.0%) |
| Life, Physical & Social Science | 29 (43.9%) | 37 (56.1%) |
| Community & Social Service | 380 (46.9%) | 430 (53.1%) |
| Education, Arts & Media | 102 (58.0%) | 74 (42.0%) |
| Legal Services & Support | 78 (56.1%) | 61 (43.9%) |
| Education Instruction & Library | 173 (39.6%) | 264 (60.4%) |
| Arts, Media & Entertainment | 27 (46.6%) | 31 (53.4%) |
| Health Diagnosing & Treating | 83 (19.8%) | 337 (80.2%) |
| Health Technologists | 69 (20.6%) | 266 (79.4%) |
| Total (Category) | 1,210 (49.5%) | 1,234 (50.5%) |
| Total (Overall) | 2,598 (50.6%) | 2,533 (49.4%) |
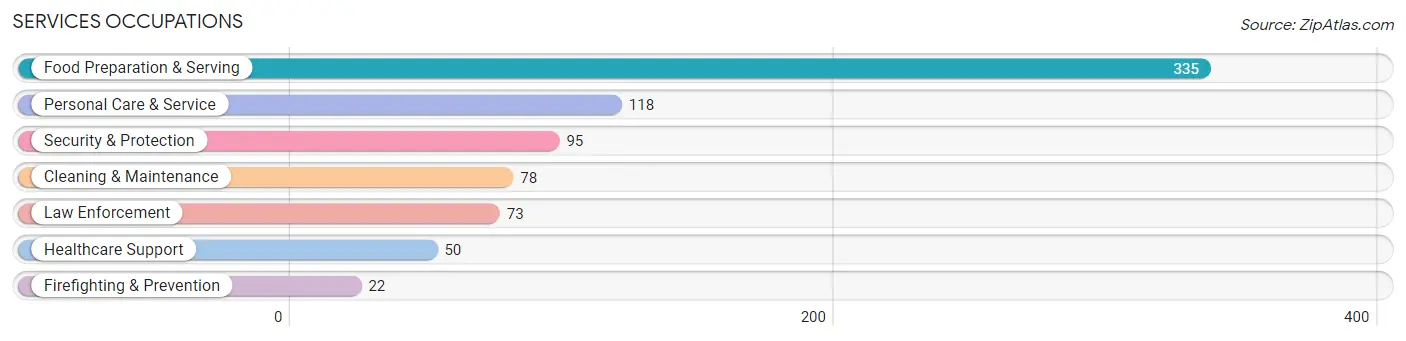
Services Occupations
The most common Services occupations in Ocean City are Food Preparation & Serving (335 | 6.5%), Personal Care & Service (118 | 2.3%), Security & Protection (95 | 1.8%), Cleaning & Maintenance (78 | 1.5%), and Law Enforcement (73 | 1.4%).
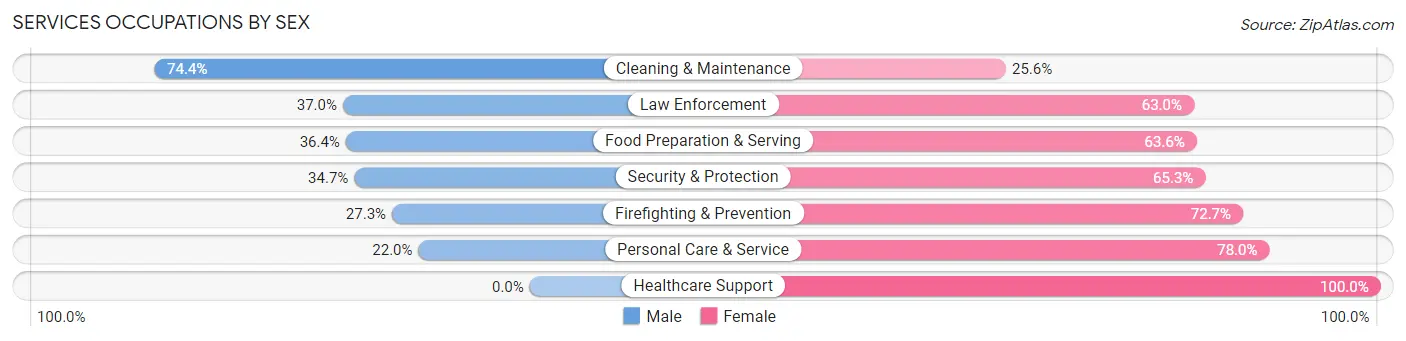
Services Occupations by Sex
Within the Services occupations in Ocean City, the most male-oriented occupations are Cleaning & Maintenance (74.4%), Law Enforcement (37.0%), and Food Preparation & Serving (36.4%), while the most female-oriented occupations are Healthcare Support (100.0%), Personal Care & Service (78.0%), and Firefighting & Prevention (72.7%).
| Occupation | Male | Female |
| Healthcare Support | 0 (0.0%) | 50 (100.0%) |
| Security & Protection | 33 (34.7%) | 62 (65.3%) |
| Firefighting & Prevention | 6 (27.3%) | 16 (72.7%) |
| Law Enforcement | 27 (37.0%) | 46 (63.0%) |
| Food Preparation & Serving | 122 (36.4%) | 213 (63.6%) |
| Cleaning & Maintenance | 58 (74.4%) | 20 (25.6%) |
| Personal Care & Service | 26 (22.0%) | 92 (78.0%) |
| Total (Category) | 239 (35.4%) | 437 (64.6%) |
| Total (Overall) | 2,598 (50.6%) | 2,533 (49.4%) |
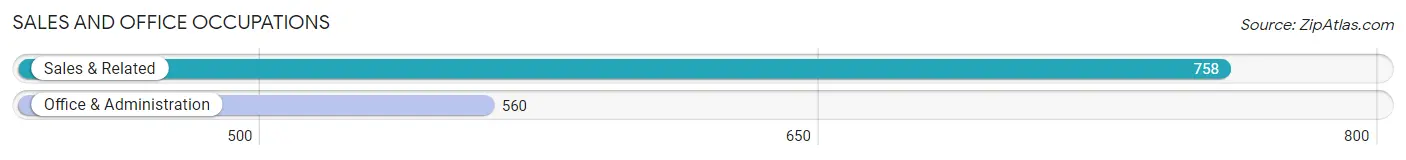
Sales and Office Occupations
The most common Sales and Office occupations in Ocean City are Sales & Related (758 | 14.8%), and Office & Administration (560 | 10.9%).
Sales and Office Occupations by Sex
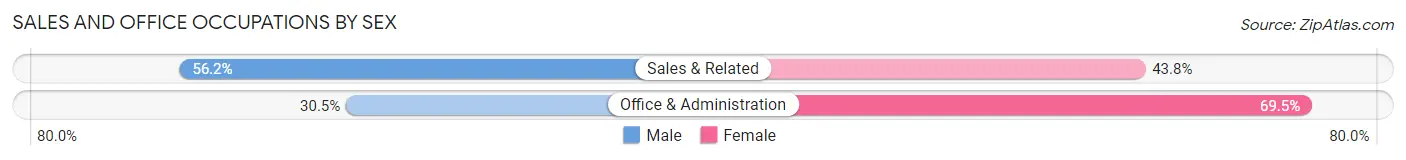
| Occupation | Male | Female |
| Sales & Related | 426 (56.2%) | 332 (43.8%) |
| Office & Administration | 171 (30.5%) | 389 (69.5%) |
| Total (Category) | 597 (45.3%) | 721 (54.7%) |
| Total (Overall) | 2,598 (50.6%) | 2,533 (49.4%) |
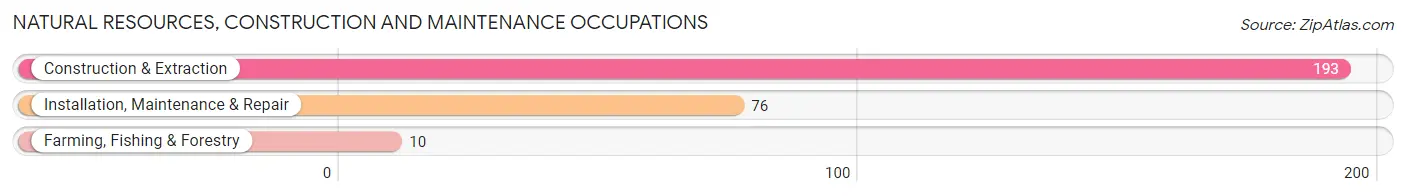
Natural Resources, Construction and Maintenance Occupations
The most common Natural Resources, Construction and Maintenance occupations in Ocean City are Construction & Extraction (193 | 3.8%), Installation, Maintenance & Repair (76 | 1.5%), and Farming, Fishing & Forestry (10 | 0.2%).
Natural Resources, Construction and Maintenance Occupations by Sex
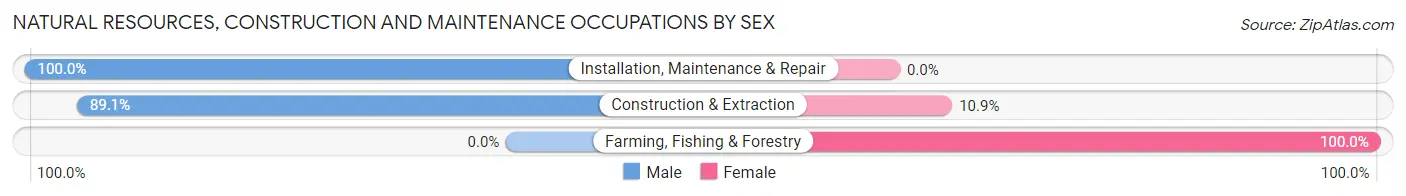
| Occupation | Male | Female |
| Farming, Fishing & Forestry | 0 (0.0%) | 10 (100.0%) |
| Construction & Extraction | 172 (89.1%) | 21 (10.9%) |
| Installation, Maintenance & Repair | 76 (100.0%) | 0 (0.0%) |
| Total (Category) | 248 (88.9%) | 31 (11.1%) |
| Total (Overall) | 2,598 (50.6%) | 2,533 (49.4%) |
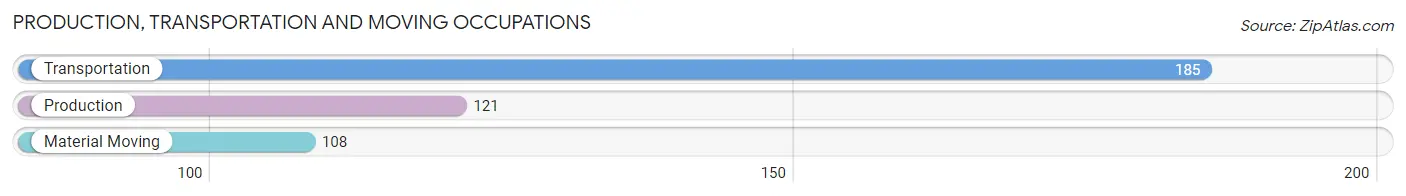
Production, Transportation and Moving Occupations
The most common Production, Transportation and Moving occupations in Ocean City are Transportation (185 | 3.6%), Production (121 | 2.4%), and Material Moving (108 | 2.1%).
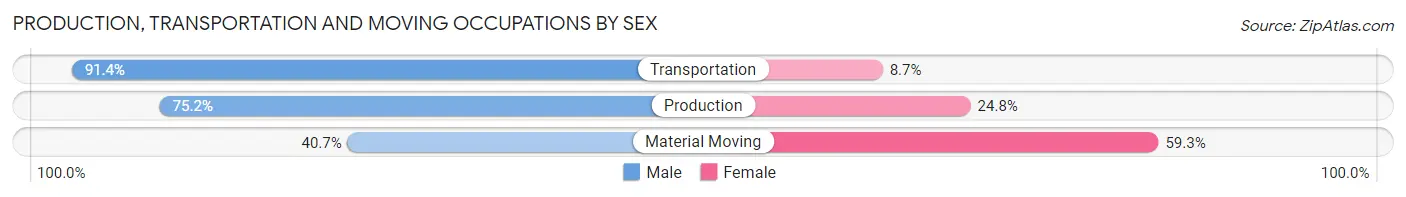
Production, Transportation and Moving Occupations by Sex
| Occupation | Male | Female |
| Production | 91 (75.2%) | 30 (24.8%) |
| Transportation | 169 (91.3%) | 16 (8.6%) |
| Material Moving | 44 (40.7%) | 64 (59.3%) |
| Total (Category) | 304 (73.4%) | 110 (26.6%) |
| Total (Overall) | 2,598 (50.6%) | 2,533 (49.4%) |
Employment Industries by Sex in Ocean City
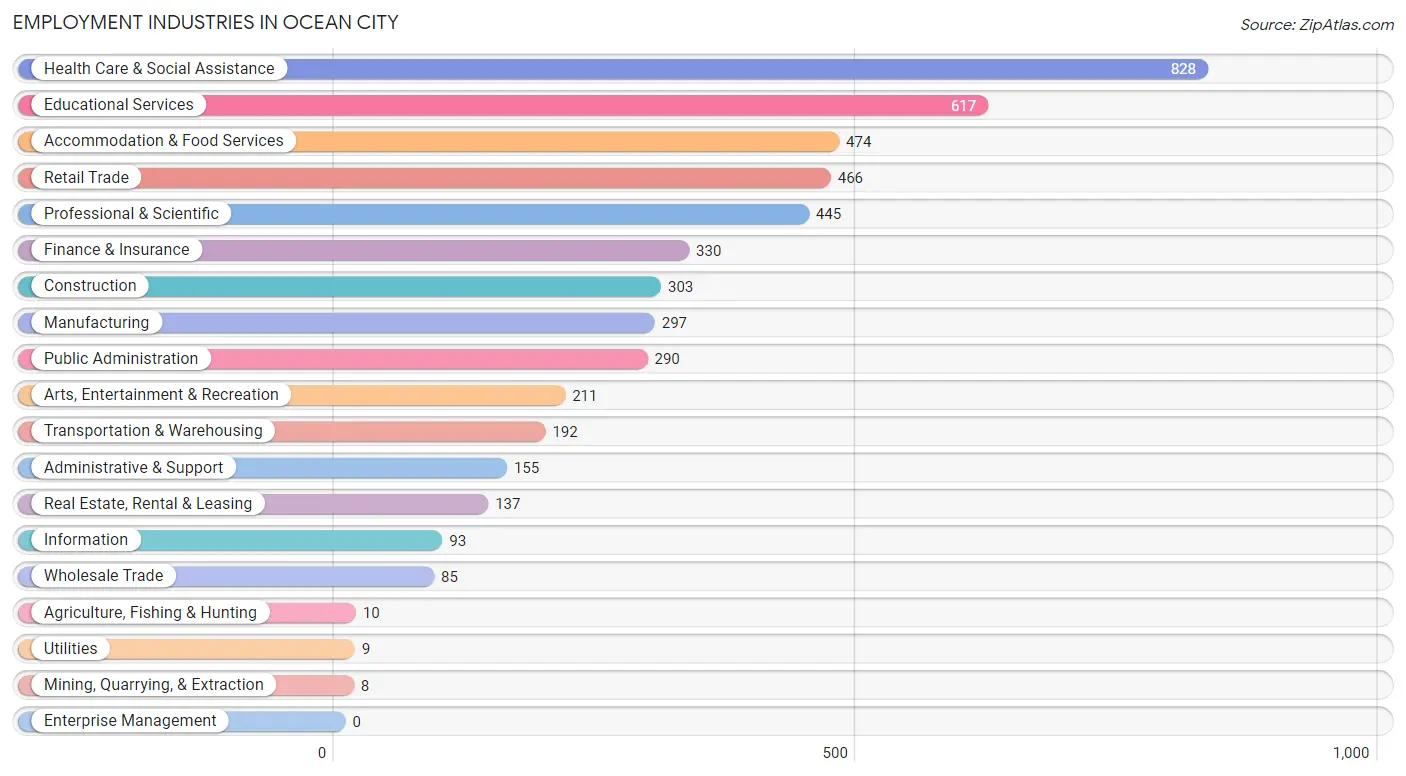
Employment Industries in Ocean City
The major employment industries in Ocean City include Health Care & Social Assistance (828 | 16.1%), Educational Services (617 | 12.0%), Accommodation & Food Services (474 | 9.2%), Retail Trade (466 | 9.1%), and Professional & Scientific (445 | 8.7%).
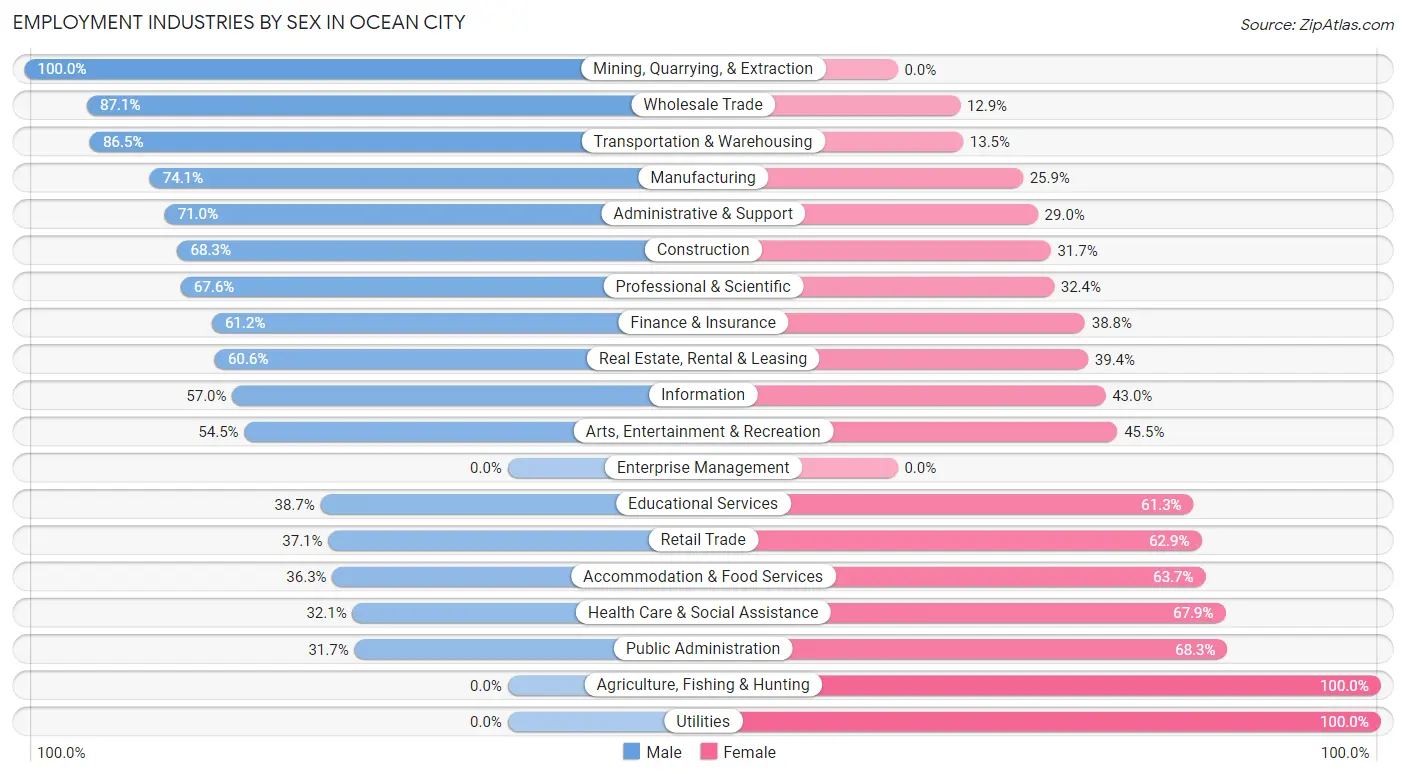
Employment Industries by Sex in Ocean City
The Ocean City industries that see more men than women are Mining, Quarrying, & Extraction (100.0%), Wholesale Trade (87.1%), and Transportation & Warehousing (86.5%), whereas the industries that tend to have a higher number of women are Agriculture, Fishing & Hunting (100.0%), Utilities (100.0%), and Public Administration (68.3%).
| Industry | Male | Female |
| Agriculture, Fishing & Hunting | 0 (0.0%) | 10 (100.0%) |
| Mining, Quarrying, & Extraction | 8 (100.0%) | 0 (0.0%) |
| Construction | 207 (68.3%) | 96 (31.7%) |
| Manufacturing | 220 (74.1%) | 77 (25.9%) |
| Wholesale Trade | 74 (87.1%) | 11 (12.9%) |
| Retail Trade | 173 (37.1%) | 293 (62.9%) |
| Transportation & Warehousing | 166 (86.5%) | 26 (13.5%) |
| Utilities | 0 (0.0%) | 9 (100.0%) |
| Information | 53 (57.0%) | 40 (43.0%) |
| Finance & Insurance | 202 (61.2%) | 128 (38.8%) |
| Real Estate, Rental & Leasing | 83 (60.6%) | 54 (39.4%) |
| Professional & Scientific | 301 (67.6%) | 144 (32.4%) |
| Enterprise Management | 0 (0.0%) | 0 (0.0%) |
| Administrative & Support | 110 (71.0%) | 45 (29.0%) |
| Educational Services | 239 (38.7%) | 378 (61.3%) |
| Health Care & Social Assistance | 266 (32.1%) | 562 (67.9%) |
| Arts, Entertainment & Recreation | 115 (54.5%) | 96 (45.5%) |
| Accommodation & Food Services | 172 (36.3%) | 302 (63.7%) |
| Public Administration | 92 (31.7%) | 198 (68.3%) |
| Total | 2,598 (50.6%) | 2,533 (49.4%) |
Education in Ocean City
School Enrollment in Ocean City
The most common levels of schooling among the 2,046 students in Ocean City are high school (661 | 32.3%), middle school (443 | 21.6%), and elementary school (391 | 19.1%).
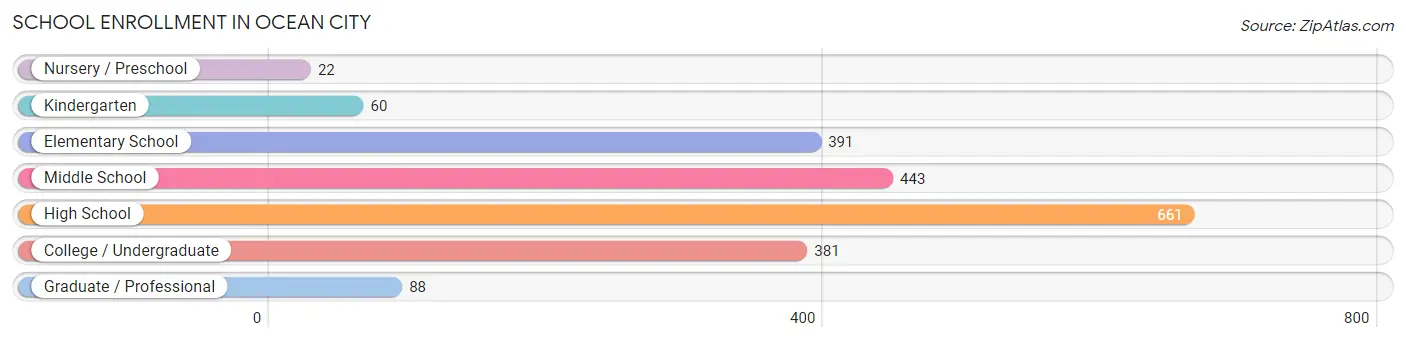
| School Level | # Students | % Students |
| Nursery / Preschool | 22 | 1.1% |
| Kindergarten | 60 | 2.9% |
| Elementary School | 391 | 19.1% |
| Middle School | 443 | 21.6% |
| High School | 661 | 32.3% |
| College / Undergraduate | 381 | 18.6% |
| Graduate / Professional | 88 | 4.3% |
| Total | 2,046 | 100.0% |
School Enrollment by Age by Funding Source in Ocean City
Out of a total of 2,046 students who are enrolled in schools in Ocean City, 352 (17.2%) attend a private institution, while the remaining 1,694 (82.8%) are enrolled in public schools. The age group of 3 to 4 year olds has the highest likelihood of being enrolled in private schools, with 7 (50.0% in the age bracket) enrolled. Conversely, the age group of 10 to 14 year olds has the lowest likelihood of being enrolled in a private school, with 466 (88.9% in the age bracket) attending a public institution.
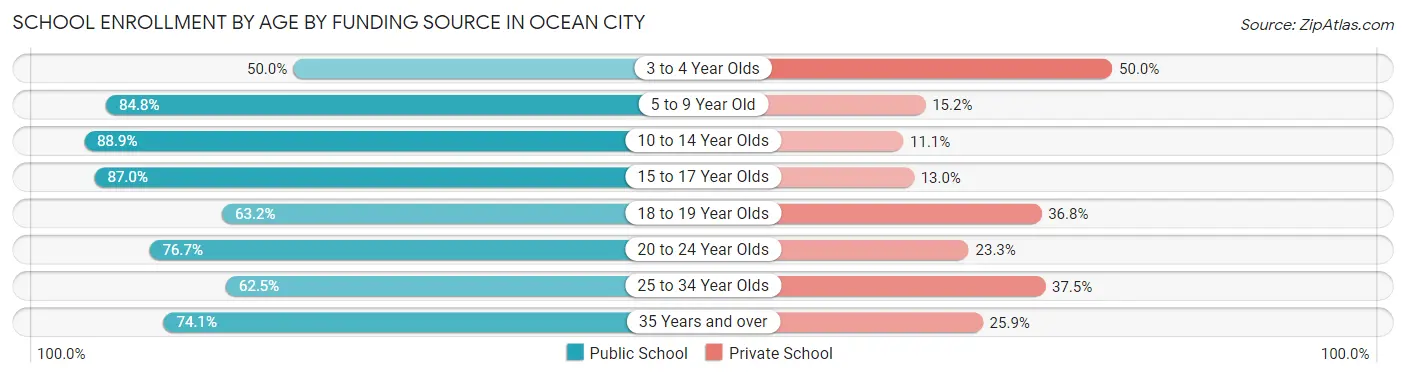
| Age Bracket | Public School | Private School |
| 3 to 4 Year Olds | 7 (50.0%) | 7 (50.0%) |
| 5 to 9 Year Old | 335 (84.8%) | 60 (15.2%) |
| 10 to 14 Year Olds | 466 (88.9%) | 58 (11.1%) |
| 15 to 17 Year Olds | 507 (87.0%) | 76 (13.0%) |
| 18 to 19 Year Olds | 79 (63.2%) | 46 (36.8%) |
| 20 to 24 Year Olds | 188 (76.7%) | 57 (23.3%) |
| 25 to 34 Year Olds | 30 (62.5%) | 18 (37.5%) |
| 35 Years and over | 83 (74.1%) | 29 (25.9%) |
| Total | 1,694 (82.8%) | 352 (17.2%) |
Educational Attainment by Field of Study in Ocean City
Business (1,279 | 24.1%), education (929 | 17.5%), science & technology (563 | 10.6%), social sciences (516 | 9.7%), and engineering (347 | 6.5%) are the most common fields of study among 5,306 individuals in Ocean City who have obtained a bachelor's degree or higher.
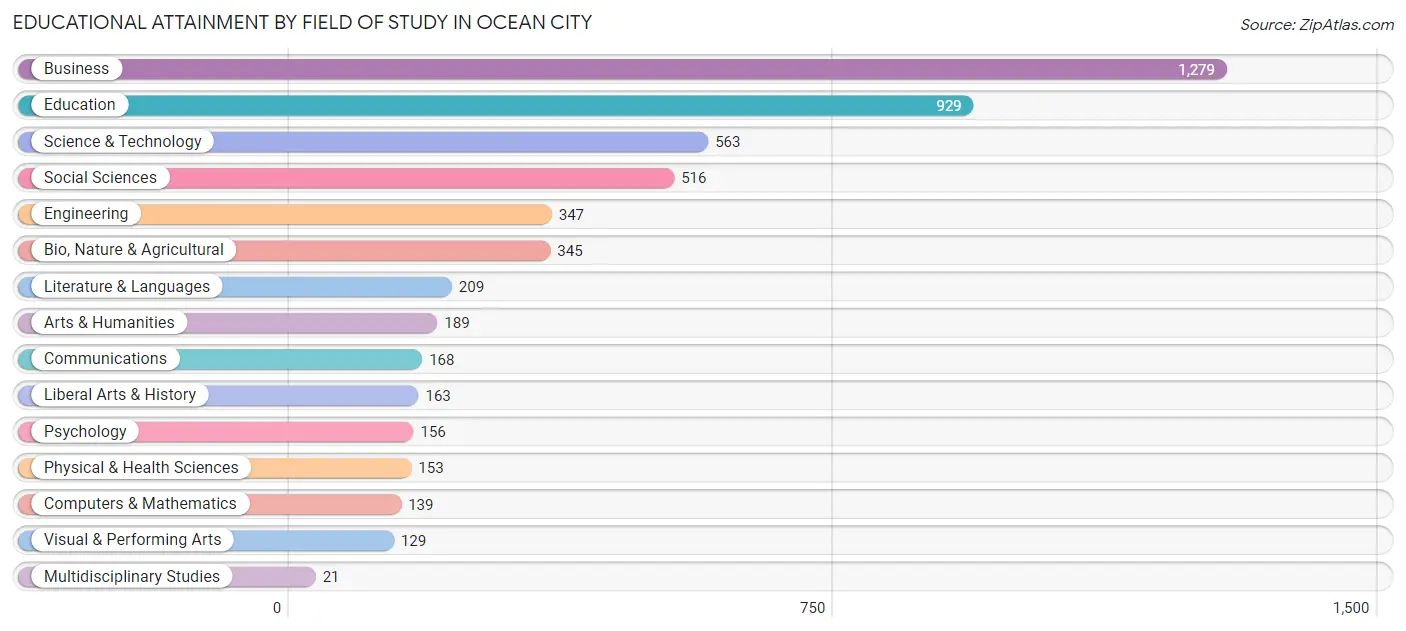
| Field of Study | # Graduates | % Graduates |
| Computers & Mathematics | 139 | 2.6% |
| Bio, Nature & Agricultural | 345 | 6.5% |
| Physical & Health Sciences | 153 | 2.9% |
| Psychology | 156 | 2.9% |
| Social Sciences | 516 | 9.7% |
| Engineering | 347 | 6.5% |
| Multidisciplinary Studies | 21 | 0.4% |
| Science & Technology | 563 | 10.6% |
| Business | 1,279 | 24.1% |
| Education | 929 | 17.5% |
| Literature & Languages | 209 | 3.9% |
| Liberal Arts & History | 163 | 3.1% |
| Visual & Performing Arts | 129 | 2.4% |
| Communications | 168 | 3.2% |
| Arts & Humanities | 189 | 3.6% |
| Total | 5,306 | 100.0% |
Transportation & Commute in Ocean City
Vehicle Availability by Sex in Ocean City
The most prevalent vehicle ownership categories in Ocean City are males with 2 vehicles (1,171, accounting for 45.2%) and females with 2 vehicles (1,077, making up 46.6%).
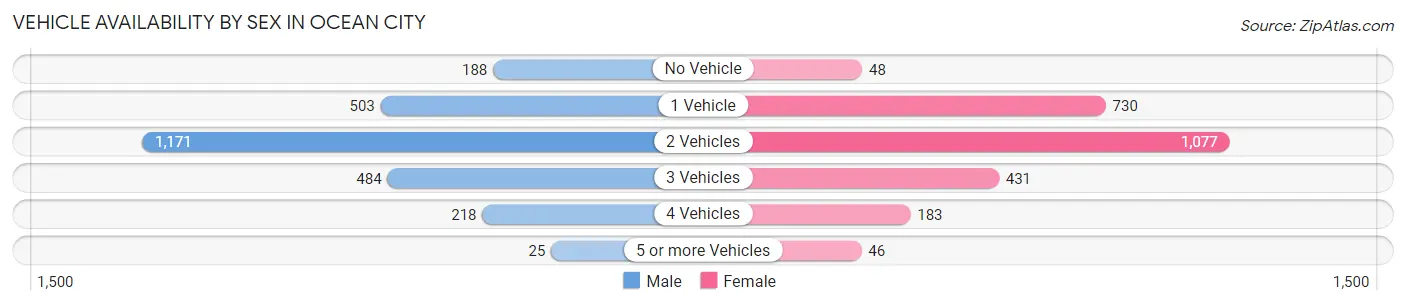
| Vehicles Available | Male | Female |
| No Vehicle | 188 (7.3%) | 48 (1.9%) |
| 1 Vehicle | 503 (19.4%) | 730 (29.0%) |
| 2 Vehicles | 1,171 (45.2%) | 1,077 (42.8%) |
| 3 Vehicles | 484 (18.7%) | 431 (17.1%) |
| 4 Vehicles | 218 (8.4%) | 183 (7.3%) |
| 5 or more Vehicles | 25 (1.0%) | 46 (1.8%) |
| Total | 2,589 (100.0%) | 2,515 (100.0%) |
Commute Time in Ocean City
The most frequently occuring commute durations in Ocean City are 5 to 9 minutes (722 commuters, 16.4%), 10 to 14 minutes (624 commuters, 14.2%), and 30 to 34 minutes (546 commuters, 12.4%).
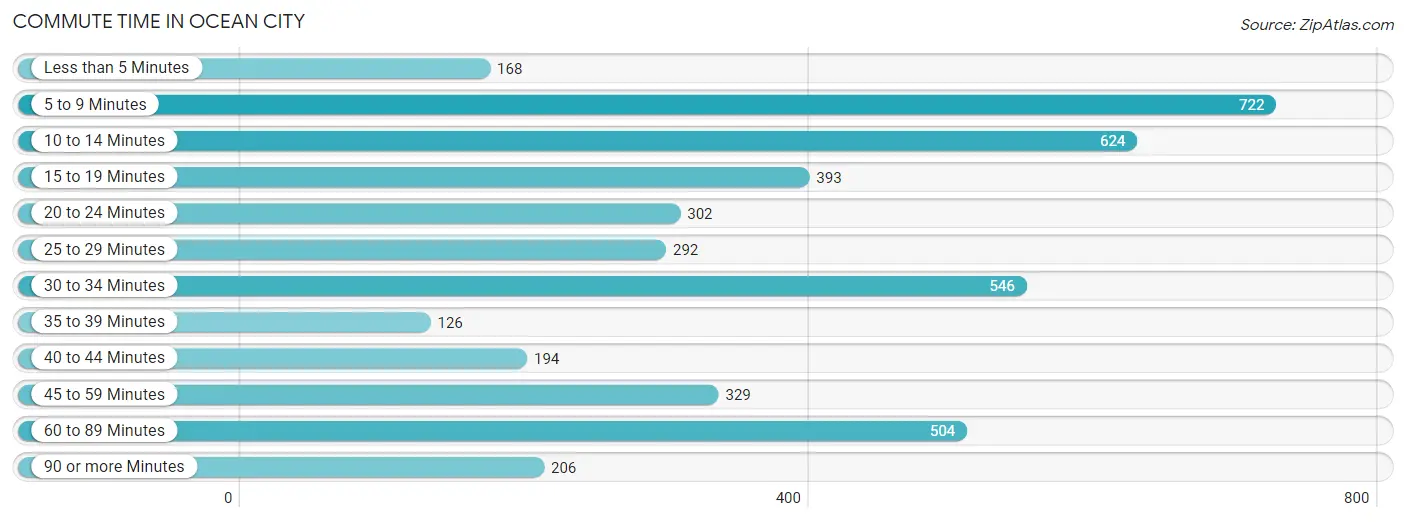
| Commute Time | # Commuters | % Commuters |
| Less than 5 Minutes | 168 | 3.8% |
| 5 to 9 Minutes | 722 | 16.4% |
| 10 to 14 Minutes | 624 | 14.2% |
| 15 to 19 Minutes | 393 | 8.9% |
| 20 to 24 Minutes | 302 | 6.9% |
| 25 to 29 Minutes | 292 | 6.6% |
| 30 to 34 Minutes | 546 | 12.4% |
| 35 to 39 Minutes | 126 | 2.9% |
| 40 to 44 Minutes | 194 | 4.4% |
| 45 to 59 Minutes | 329 | 7.5% |
| 60 to 89 Minutes | 504 | 11.4% |
| 90 or more Minutes | 206 | 4.7% |
Commute Time by Sex in Ocean City
The most common commute times in Ocean City are 60 to 89 minutes (344 commuters, 15.8%) for males and 5 to 9 minutes (446 commuters, 20.0%) for females.
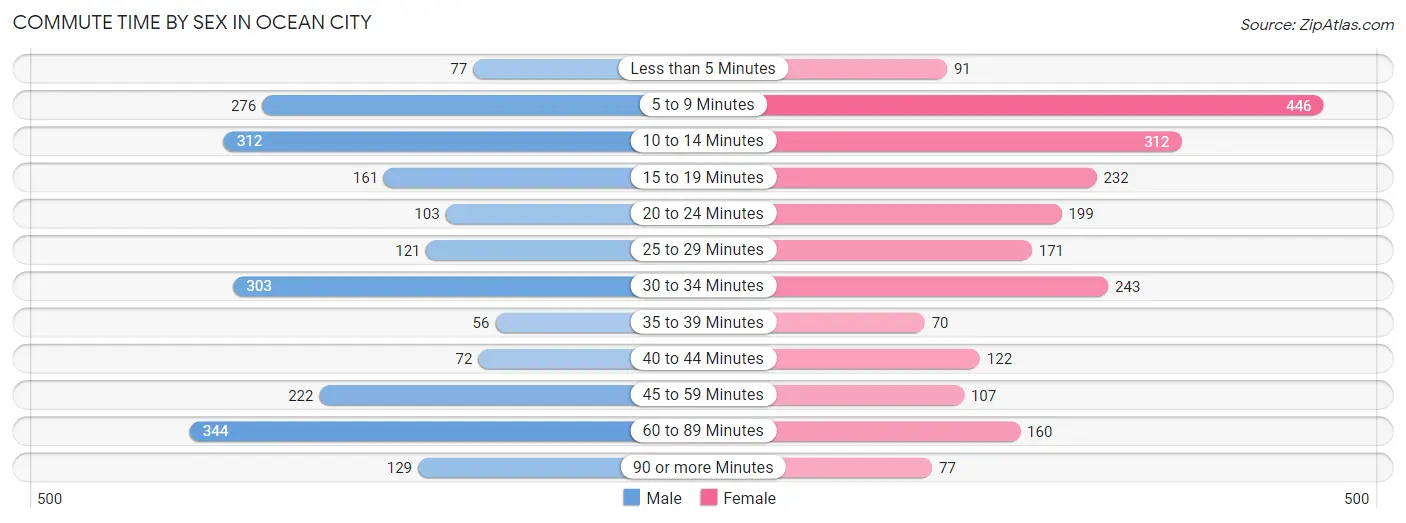
| Commute Time | Male | Female |
| Less than 5 Minutes | 77 (3.5%) | 91 (4.1%) |
| 5 to 9 Minutes | 276 (12.7%) | 446 (20.0%) |
| 10 to 14 Minutes | 312 (14.3%) | 312 (14.0%) |
| 15 to 19 Minutes | 161 (7.4%) | 232 (10.4%) |
| 20 to 24 Minutes | 103 (4.7%) | 199 (8.9%) |
| 25 to 29 Minutes | 121 (5.6%) | 171 (7.7%) |
| 30 to 34 Minutes | 303 (13.9%) | 243 (10.9%) |
| 35 to 39 Minutes | 56 (2.6%) | 70 (3.1%) |
| 40 to 44 Minutes | 72 (3.3%) | 122 (5.5%) |
| 45 to 59 Minutes | 222 (10.2%) | 107 (4.8%) |
| 60 to 89 Minutes | 344 (15.8%) | 160 (7.2%) |
| 90 or more Minutes | 129 (5.9%) | 77 (3.5%) |
Time of Departure to Work by Sex in Ocean City
The most frequent times of departure to work in Ocean City are 8:00 AM to 8:29 AM (443, 20.4%) for males and 7:30 AM to 7:59 AM (341, 15.3%) for females.
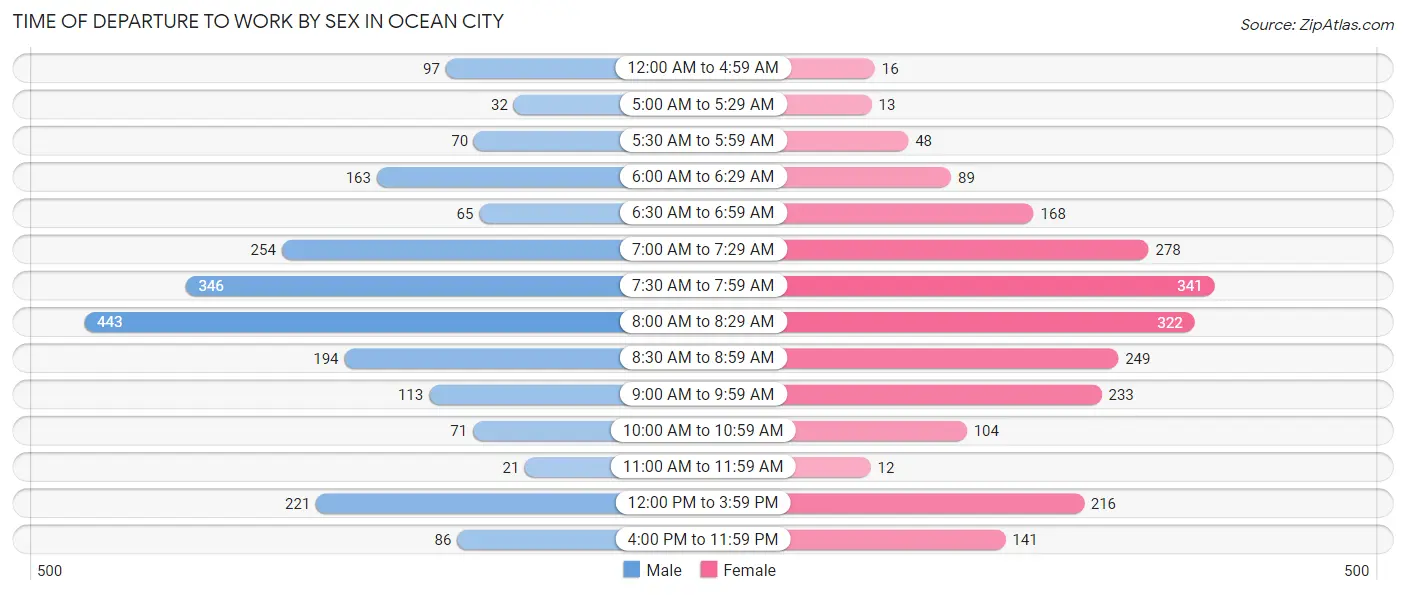
| Time of Departure | Male | Female |
| 12:00 AM to 4:59 AM | 97 (4.5%) | 16 (0.7%) |
| 5:00 AM to 5:29 AM | 32 (1.5%) | 13 (0.6%) |
| 5:30 AM to 5:59 AM | 70 (3.2%) | 48 (2.1%) |
| 6:00 AM to 6:29 AM | 163 (7.5%) | 89 (4.0%) |
| 6:30 AM to 6:59 AM | 65 (3.0%) | 168 (7.5%) |
| 7:00 AM to 7:29 AM | 254 (11.7%) | 278 (12.5%) |
| 7:30 AM to 7:59 AM | 346 (15.9%) | 341 (15.3%) |
| 8:00 AM to 8:29 AM | 443 (20.4%) | 322 (14.4%) |
| 8:30 AM to 8:59 AM | 194 (8.9%) | 249 (11.2%) |
| 9:00 AM to 9:59 AM | 113 (5.2%) | 233 (10.4%) |
| 10:00 AM to 10:59 AM | 71 (3.3%) | 104 (4.7%) |
| 11:00 AM to 11:59 AM | 21 (1.0%) | 12 (0.5%) |
| 12:00 PM to 3:59 PM | 221 (10.2%) | 216 (9.7%) |
| 4:00 PM to 11:59 PM | 86 (4.0%) | 141 (6.3%) |
| Total | 2,176 (100.0%) | 2,230 (100.0%) |
Housing Occupancy in Ocean City
Occupancy by Ownership in Ocean City
Of the total 5,521 dwellings in Ocean City, owner-occupied units account for 3,980 (72.1%), while renter-occupied units make up 1,541 (27.9%).
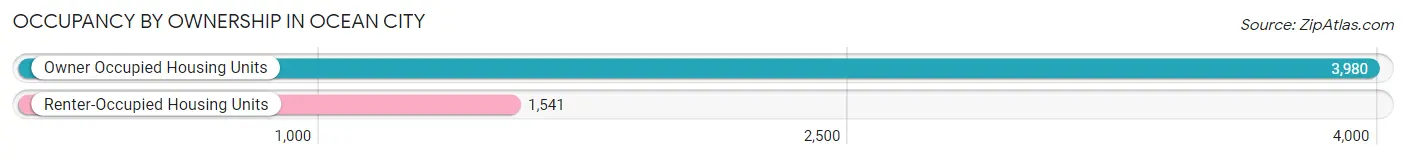
| Occupancy | # Housing Units | % Housing Units |
| Owner Occupied Housing Units | 3,980 | 72.1% |
| Renter-Occupied Housing Units | 1,541 | 27.9% |
| Total Occupied Housing Units | 5,521 | 100.0% |
Occupancy by Household Size in Ocean City
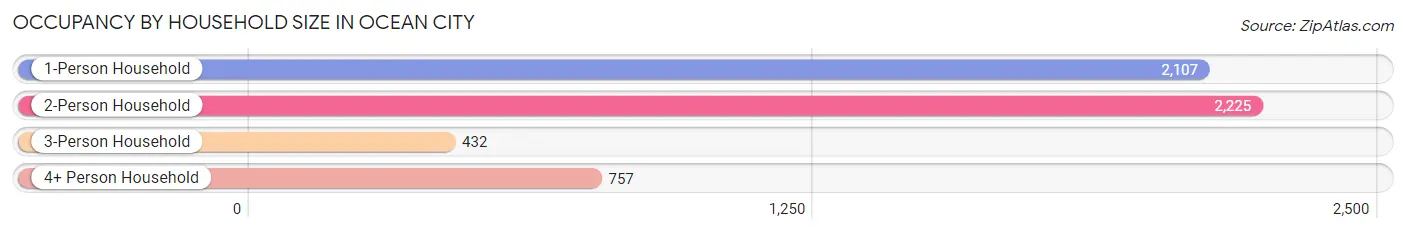
| Household Size | # Housing Units | % Housing Units |
| 1-Person Household | 2,107 | 38.2% |
| 2-Person Household | 2,225 | 40.3% |
| 3-Person Household | 432 | 7.8% |
| 4+ Person Household | 757 | 13.7% |
| Total Housing Units | 5,521 | 100.0% |
Occupancy by Ownership by Household Size in Ocean City
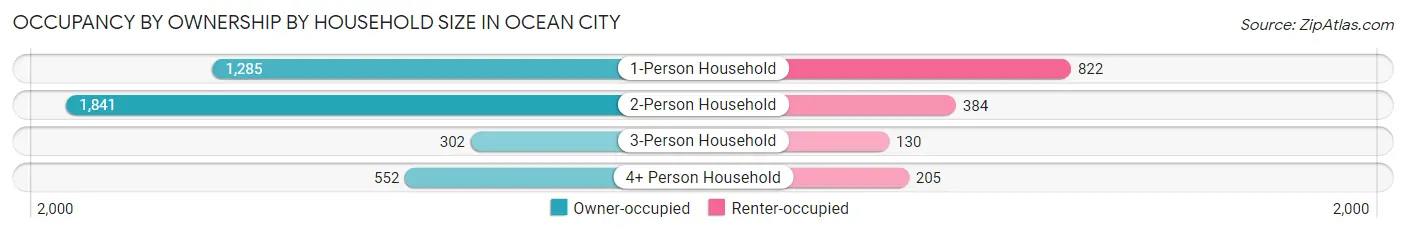
| Household Size | Owner-occupied | Renter-occupied |
| 1-Person Household | 1,285 (61.0%) | 822 (39.0%) |
| 2-Person Household | 1,841 (82.7%) | 384 (17.3%) |
| 3-Person Household | 302 (69.9%) | 130 (30.1%) |
| 4+ Person Household | 552 (72.9%) | 205 (27.1%) |
| Total Housing Units | 3,980 (72.1%) | 1,541 (27.9%) |
Occupancy by Educational Attainment in Ocean City
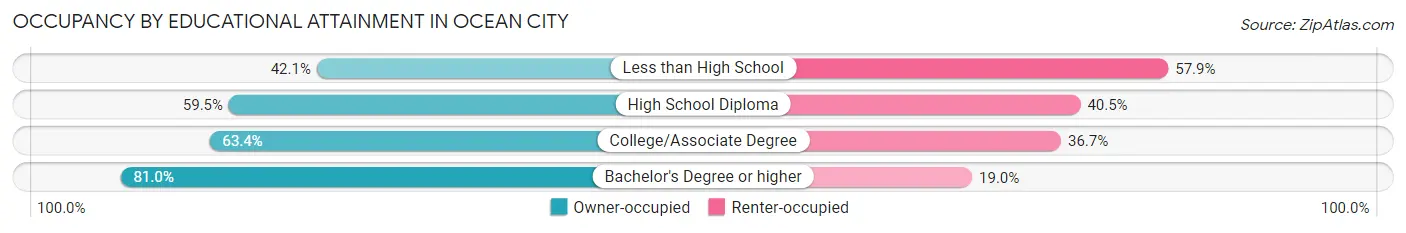
| Household Size | Owner-occupied | Renter-occupied |
| Less than High School | 77 (42.1%) | 106 (57.9%) |
| High School Diploma | 623 (59.5%) | 424 (40.5%) |
| College/Associate Degree | 700 (63.3%) | 405 (36.6%) |
| Bachelor's Degree or higher | 2,580 (81.0%) | 606 (19.0%) |
Occupancy by Age of Householder in Ocean City
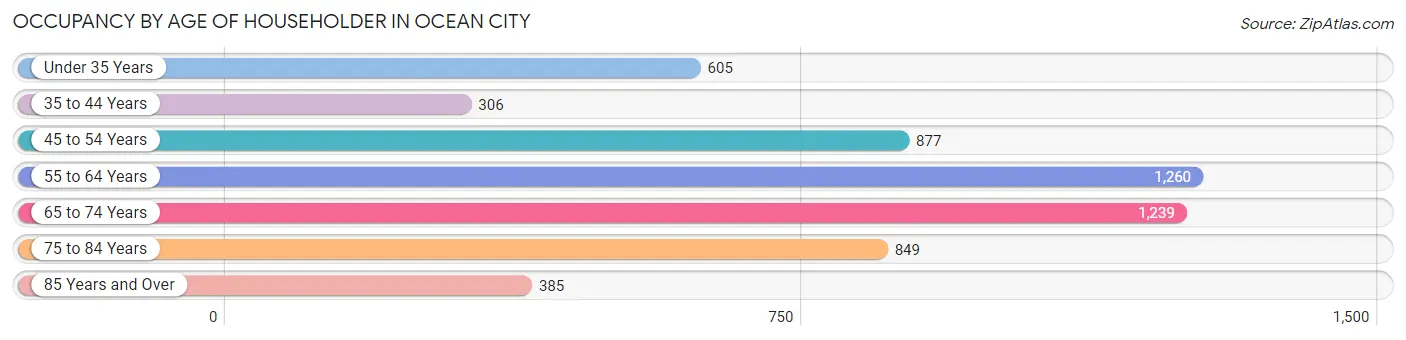
| Age Bracket | # Households | % Households |
| Under 35 Years | 605 | 11.0% |
| 35 to 44 Years | 306 | 5.5% |
| 45 to 54 Years | 877 | 15.9% |
| 55 to 64 Years | 1,260 | 22.8% |
| 65 to 74 Years | 1,239 | 22.4% |
| 75 to 84 Years | 849 | 15.4% |
| 85 Years and Over | 385 | 7.0% |
| Total | 5,521 | 100.0% |
Housing Finances in Ocean City
Median Income by Occupancy in Ocean City
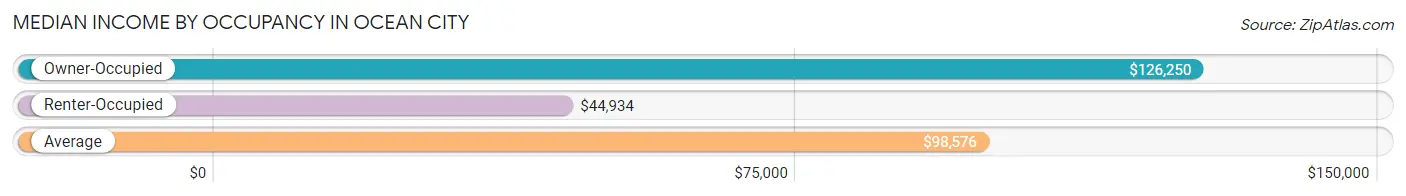
| Occupancy Type | # Households | Median Income |
| Owner-Occupied | 3,980 (72.1%) | $126,250 |
| Renter-Occupied | 1,541 (27.9%) | $44,934 |
| Average | 5,521 (100.0%) | $98,576 |
Occupancy by Householder Income Bracket in Ocean City
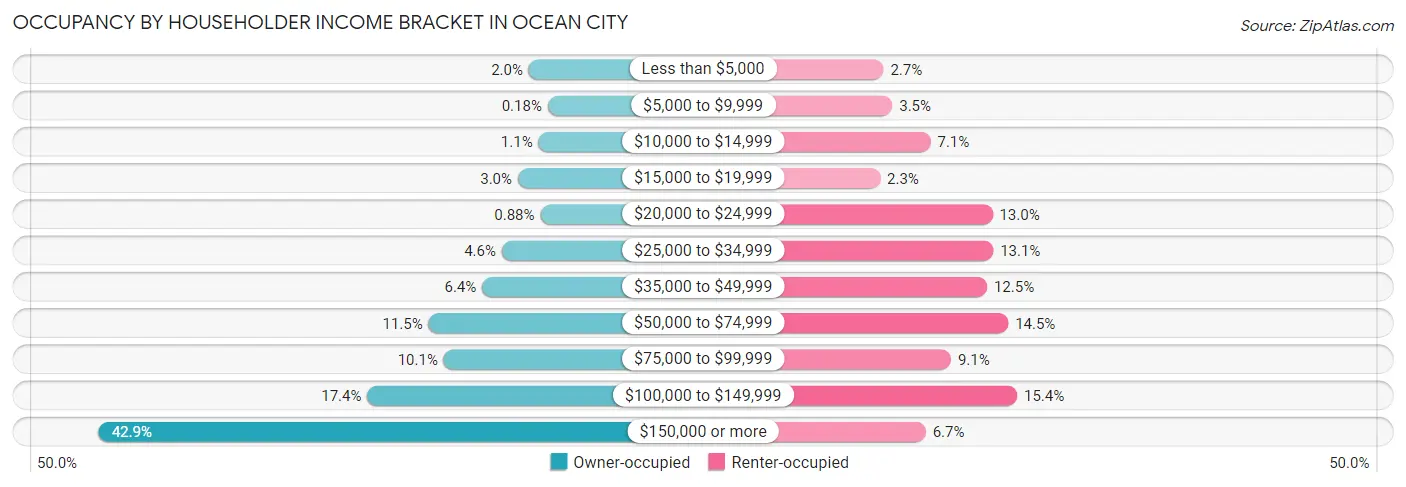
| Income Bracket | Owner-occupied | Renter-occupied |
| Less than $5,000 | 79 (2.0%) | 41 (2.7%) |
| $5,000 to $9,999 | 7 (0.2%) | 54 (3.5%) |
| $10,000 to $14,999 | 42 (1.1%) | 110 (7.1%) |
| $15,000 to $19,999 | 120 (3.0%) | 36 (2.3%) |
| $20,000 to $24,999 | 35 (0.9%) | 201 (13.0%) |
| $25,000 to $34,999 | 181 (4.5%) | 202 (13.1%) |
| $35,000 to $49,999 | 256 (6.4%) | 193 (12.5%) |
| $50,000 to $74,999 | 459 (11.5%) | 224 (14.5%) |
| $75,000 to $99,999 | 401 (10.1%) | 140 (9.1%) |
| $100,000 to $149,999 | 691 (17.4%) | 237 (15.4%) |
| $150,000 or more | 1,709 (42.9%) | 103 (6.7%) |
| Total | 3,980 (100.0%) | 1,541 (100.0%) |
Monthly Housing Cost Tiers in Ocean City
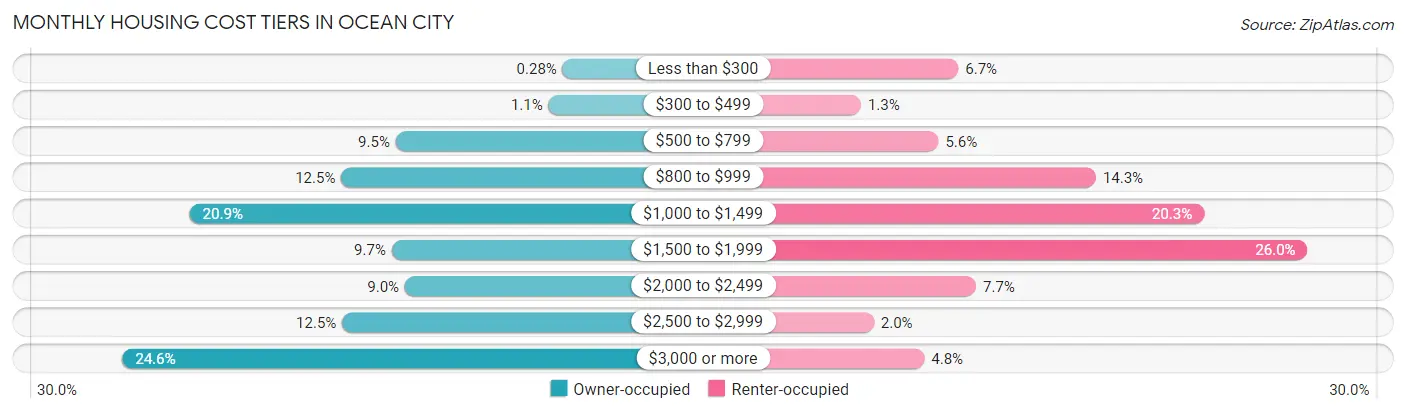
| Monthly Cost | Owner-occupied | Renter-occupied |
| Less than $300 | 11 (0.3%) | 103 (6.7%) |
| $300 to $499 | 42 (1.1%) | 20 (1.3%) |
| $500 to $799 | 378 (9.5%) | 86 (5.6%) |
| $800 to $999 | 498 (12.5%) | 220 (14.3%) |
| $1,000 to $1,499 | 831 (20.9%) | 312 (20.3%) |
| $1,500 to $1,999 | 387 (9.7%) | 400 (26.0%) |
| $2,000 to $2,499 | 358 (9.0%) | 118 (7.7%) |
| $2,500 to $2,999 | 496 (12.5%) | 31 (2.0%) |
| $3,000 or more | 979 (24.6%) | 74 (4.8%) |
| Total | 3,980 (100.0%) | 1,541 (100.0%) |
Physical Housing Characteristics in Ocean City
Housing Structures in Ocean City
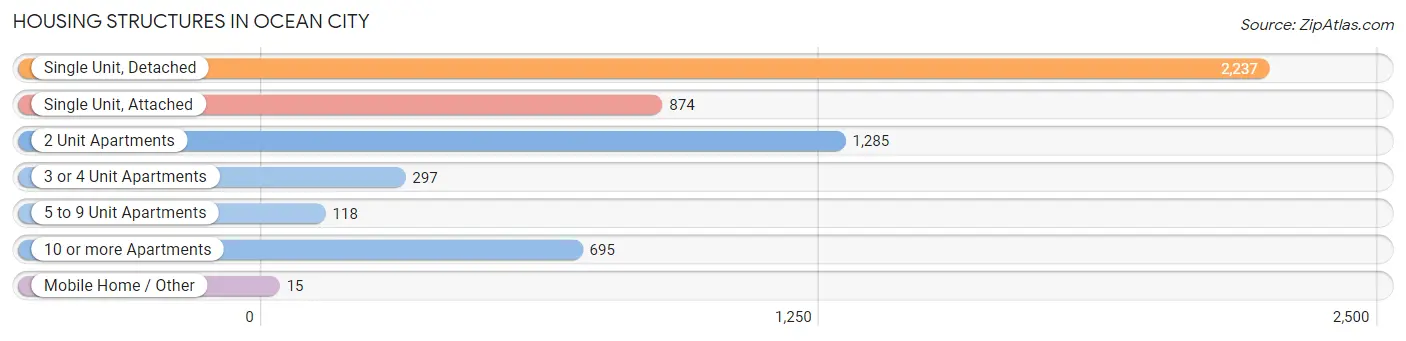
| Structure Type | # Housing Units | % Housing Units |
| Single Unit, Detached | 2,237 | 40.5% |
| Single Unit, Attached | 874 | 15.8% |
| 2 Unit Apartments | 1,285 | 23.3% |
| 3 or 4 Unit Apartments | 297 | 5.4% |
| 5 to 9 Unit Apartments | 118 | 2.1% |
| 10 or more Apartments | 695 | 12.6% |
| Mobile Home / Other | 15 | 0.3% |
| Total | 5,521 | 100.0% |
Housing Structures by Occupancy in Ocean City
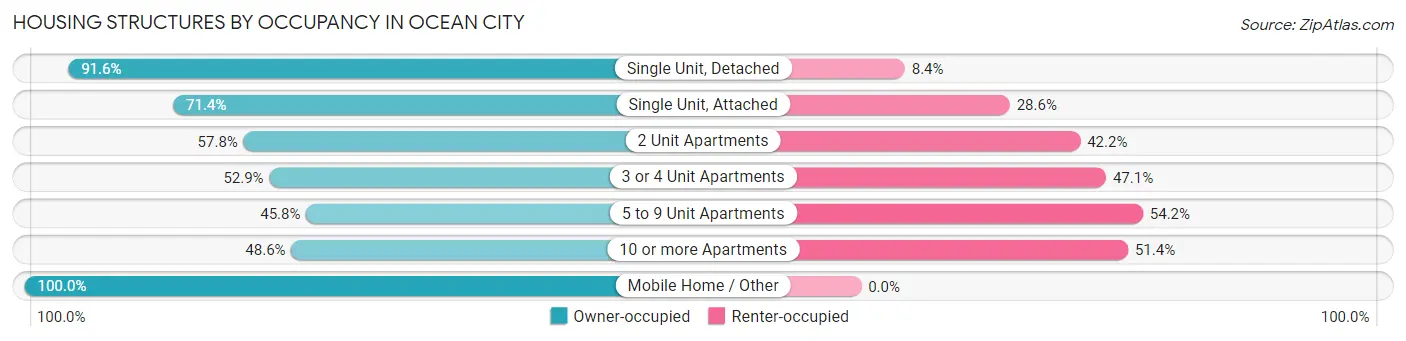
| Structure Type | Owner-occupied | Renter-occupied |
| Single Unit, Detached | 2,049 (91.6%) | 188 (8.4%) |
| Single Unit, Attached | 624 (71.4%) | 250 (28.6%) |
| 2 Unit Apartments | 743 (57.8%) | 542 (42.2%) |
| 3 or 4 Unit Apartments | 157 (52.9%) | 140 (47.1%) |
| 5 to 9 Unit Apartments | 54 (45.8%) | 64 (54.2%) |
| 10 or more Apartments | 338 (48.6%) | 357 (51.4%) |
| Mobile Home / Other | 15 (100.0%) | 0 (0.0%) |
| Total | 3,980 (72.1%) | 1,541 (27.9%) |
Housing Structures by Number of Rooms in Ocean City
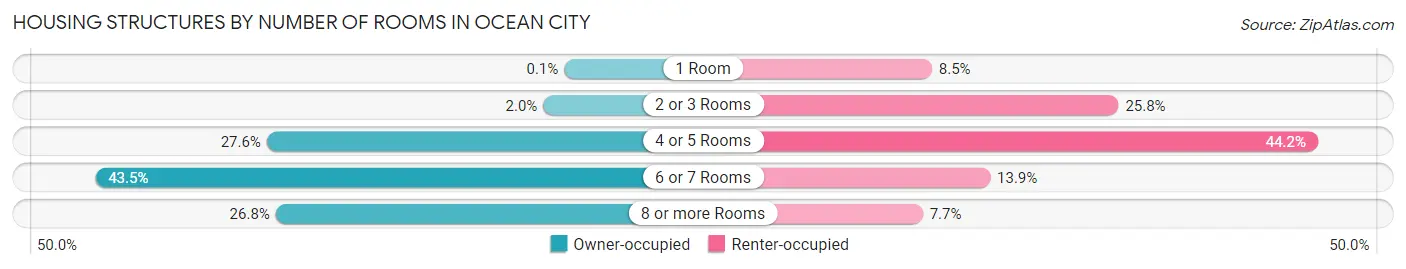
| Number of Rooms | Owner-occupied | Renter-occupied |
| 1 Room | 4 (0.1%) | 131 (8.5%) |
| 2 or 3 Rooms | 81 (2.0%) | 397 (25.8%) |
| 4 or 5 Rooms | 1,099 (27.6%) | 681 (44.2%) |
| 6 or 7 Rooms | 1,730 (43.5%) | 214 (13.9%) |
| 8 or more Rooms | 1,066 (26.8%) | 118 (7.7%) |
| Total | 3,980 (100.0%) | 1,541 (100.0%) |
Housing Structure by Heating Type in Ocean City
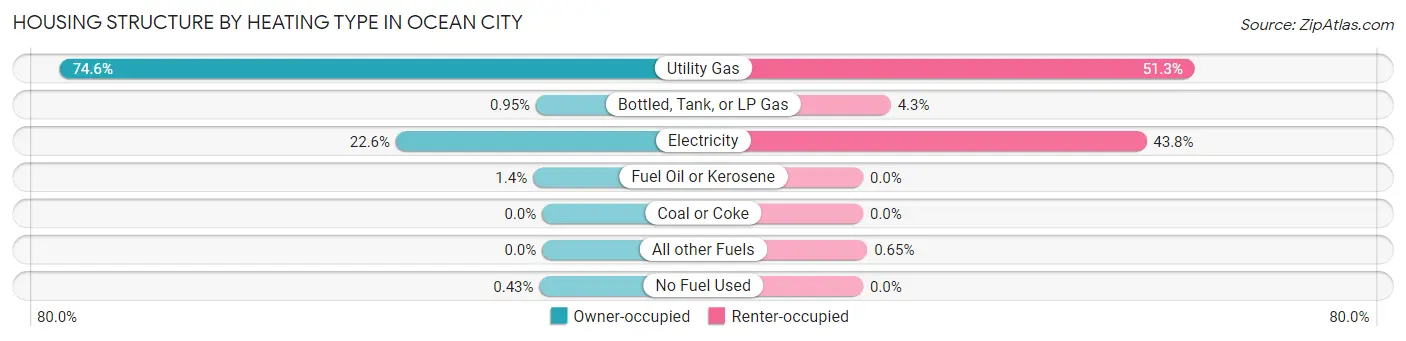
| Heating Type | Owner-occupied | Renter-occupied |
| Utility Gas | 2,969 (74.6%) | 790 (51.3%) |
| Bottled, Tank, or LP Gas | 38 (0.9%) | 66 (4.3%) |
| Electricity | 900 (22.6%) | 675 (43.8%) |
| Fuel Oil or Kerosene | 56 (1.4%) | 0 (0.0%) |
| Coal or Coke | 0 (0.0%) | 0 (0.0%) |
| All other Fuels | 0 (0.0%) | 10 (0.6%) |
| No Fuel Used | 17 (0.4%) | 0 (0.0%) |
| Total | 3,980 (100.0%) | 1,541 (100.0%) |
Household Vehicle Usage in Ocean City
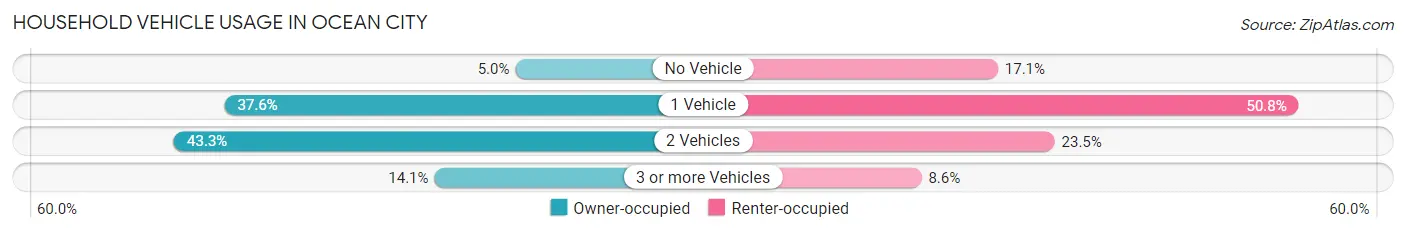
| Vehicles per Household | Owner-occupied | Renter-occupied |
| No Vehicle | 200 (5.0%) | 264 (17.1%) |
| 1 Vehicle | 1,497 (37.6%) | 783 (50.8%) |
| 2 Vehicles | 1,722 (43.3%) | 362 (23.5%) |
| 3 or more Vehicles | 561 (14.1%) | 132 (8.6%) |
| Total | 3,980 (100.0%) | 1,541 (100.0%) |
Real Estate & Mortgages in Ocean City
Real Estate and Mortgage Overview in Ocean City
| Characteristic | Without Mortgage | With Mortgage |
| Housing Units | 1,970 | 2,010 |
| Median Property Value | $630,300 | $688,200 |
| Median Household Income | $94,111 | $1,107 |
| Monthly Housing Costs | $1,054 | $943 |
| Real Estate Taxes | $5,215 | $0 |
Property Value by Mortgage Status in Ocean City
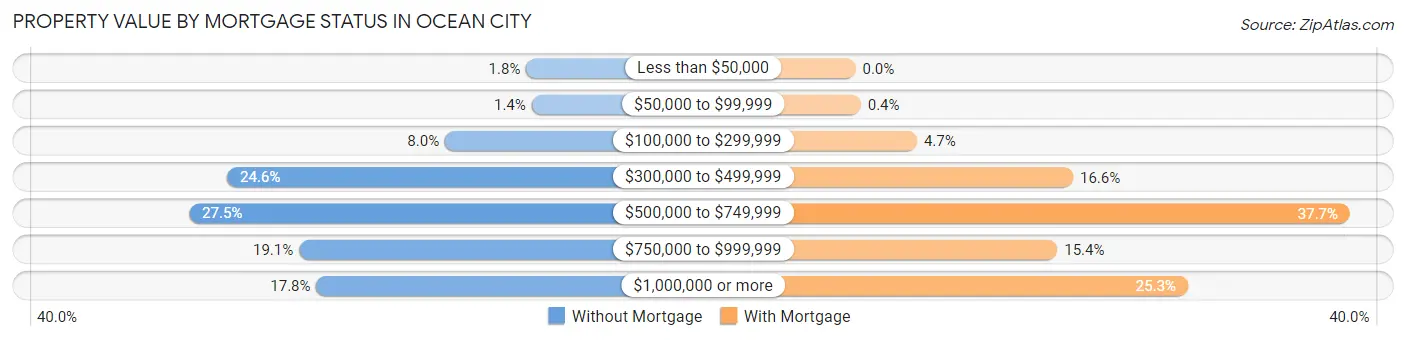
| Property Value | Without Mortgage | With Mortgage |
| Less than $50,000 | 35 (1.8%) | 0 (0.0%) |
| $50,000 to $99,999 | 27 (1.4%) | 8 (0.4%) |
| $100,000 to $299,999 | 157 (8.0%) | 94 (4.7%) |
| $300,000 to $499,999 | 484 (24.6%) | 333 (16.6%) |
| $500,000 to $749,999 | 541 (27.5%) | 757 (37.7%) |
| $750,000 to $999,999 | 376 (19.1%) | 309 (15.4%) |
| $1,000,000 or more | 350 (17.8%) | 509 (25.3%) |
| Total | 1,970 (100.0%) | 2,010 (100.0%) |
Household Income by Mortgage Status in Ocean City
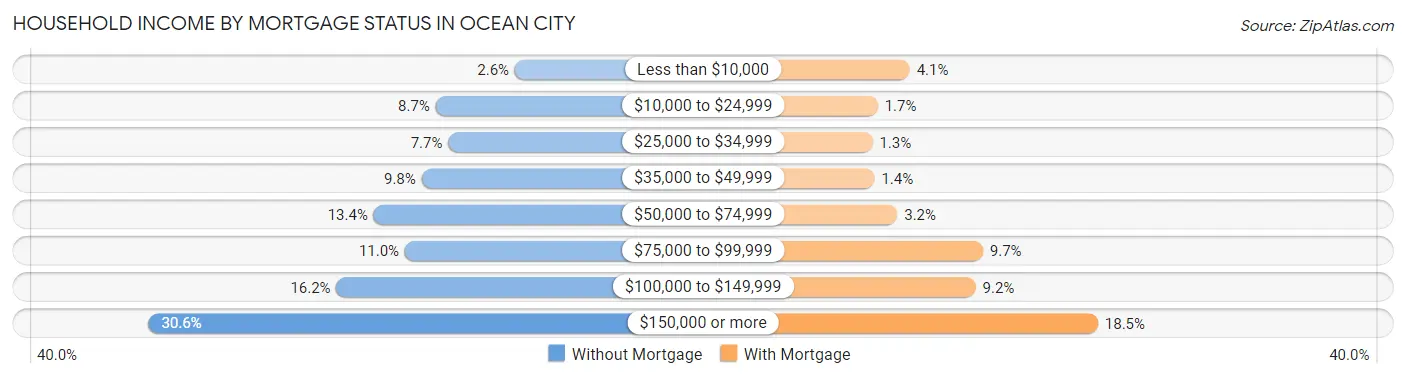
| Household Income | Without Mortgage | With Mortgage |
| Less than $10,000 | 52 (2.6%) | 83 (4.1%) |
| $10,000 to $24,999 | 171 (8.7%) | 34 (1.7%) |
| $25,000 to $34,999 | 152 (7.7%) | 26 (1.3%) |
| $35,000 to $49,999 | 192 (9.8%) | 29 (1.4%) |
| $50,000 to $74,999 | 264 (13.4%) | 64 (3.2%) |
| $75,000 to $99,999 | 217 (11.0%) | 195 (9.7%) |
| $100,000 to $149,999 | 320 (16.2%) | 184 (9.1%) |
| $150,000 or more | 602 (30.6%) | 371 (18.5%) |
| Total | 1,970 (100.0%) | 2,010 (100.0%) |
Property Value to Household Income Ratio in Ocean City
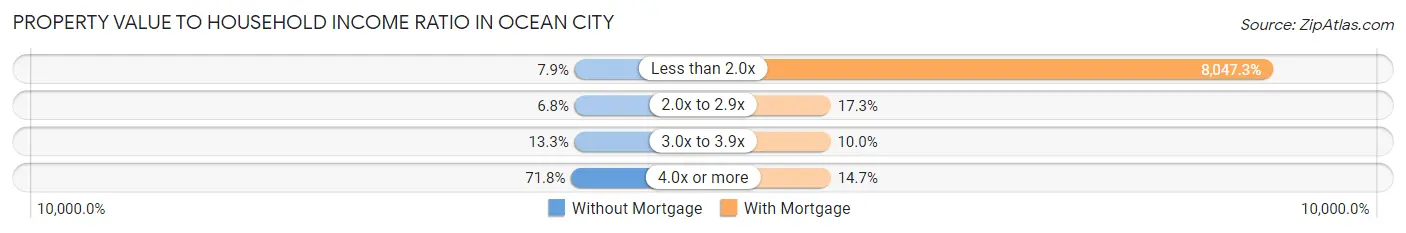
| Value-to-Income Ratio | Without Mortgage | With Mortgage |
| Less than 2.0x | 155 (7.9%) | 161,750 (8,047.3%) |
| 2.0x to 2.9x | 133 (6.8%) | 347 (17.3%) |
| 3.0x to 3.9x | 261 (13.3%) | 200 (10.0%) |
| 4.0x or more | 1,414 (71.8%) | 296 (14.7%) |
| Total | 1,970 (100.0%) | 2,010 (100.0%) |
Real Estate Taxes by Mortgage Status in Ocean City
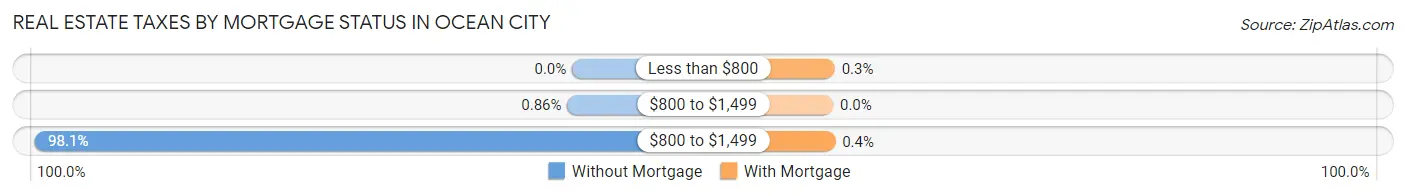
| Property Taxes | Without Mortgage | With Mortgage |
| Less than $800 | 0 (0.0%) | 6 (0.3%) |
| $800 to $1,499 | 17 (0.9%) | 0 (0.0%) |
| $800 to $1,499 | 1,932 (98.1%) | 8 (0.4%) |
| Total | 1,970 (100.0%) | 2,010 (100.0%) |
Health & Disability in Ocean City
Health Insurance Coverage by Age in Ocean City
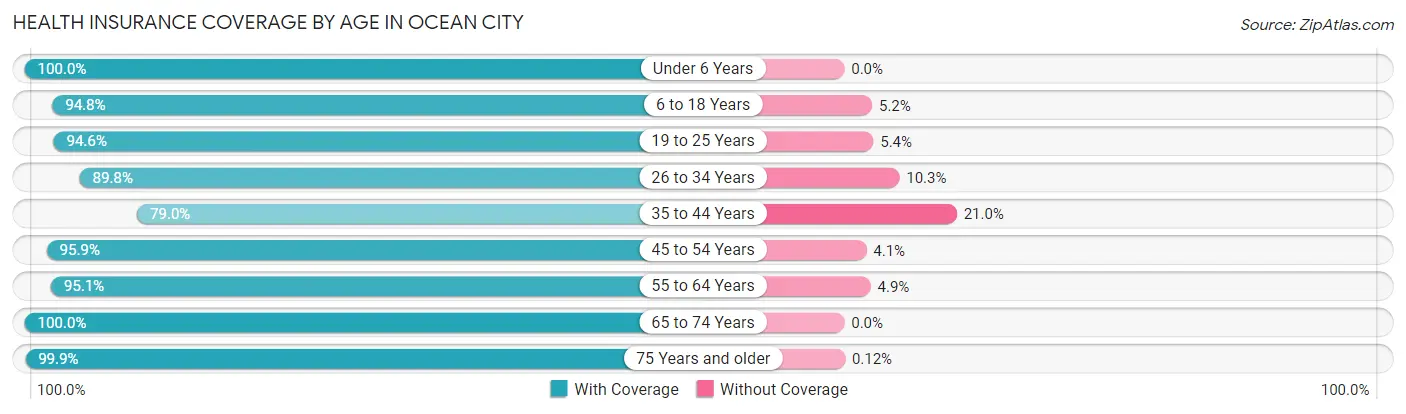
| Age Bracket | With Coverage | Without Coverage |
| Under 6 Years | 246 (100.0%) | 0 (0.0%) |
| 6 to 18 Years | 1,522 (94.8%) | 83 (5.2%) |
| 19 to 25 Years | 472 (94.6%) | 27 (5.4%) |
| 26 to 34 Years | 744 (89.7%) | 85 (10.2%) |
| 35 to 44 Years | 562 (79.0%) | 149 (21.0%) |
| 45 to 54 Years | 1,422 (95.9%) | 61 (4.1%) |
| 55 to 64 Years | 1,955 (95.1%) | 101 (4.9%) |
| 65 to 74 Years | 2,022 (100.0%) | 0 (0.0%) |
| 75 Years and older | 1,679 (99.9%) | 2 (0.1%) |
| Total | 10,624 (95.4%) | 508 (4.6%) |
Health Insurance Coverage by Citizenship Status in Ocean City
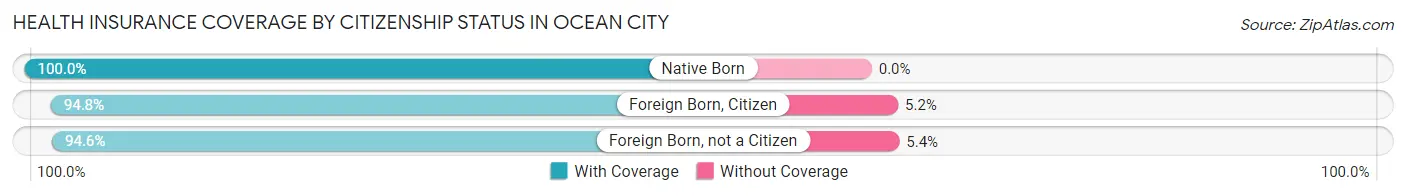
| Citizenship Status | With Coverage | Without Coverage |
| Native Born | 246 (100.0%) | 0 (0.0%) |
| Foreign Born, Citizen | 1,522 (94.8%) | 83 (5.2%) |
| Foreign Born, not a Citizen | 472 (94.6%) | 27 (5.4%) |
Health Insurance Coverage by Household Income in Ocean City
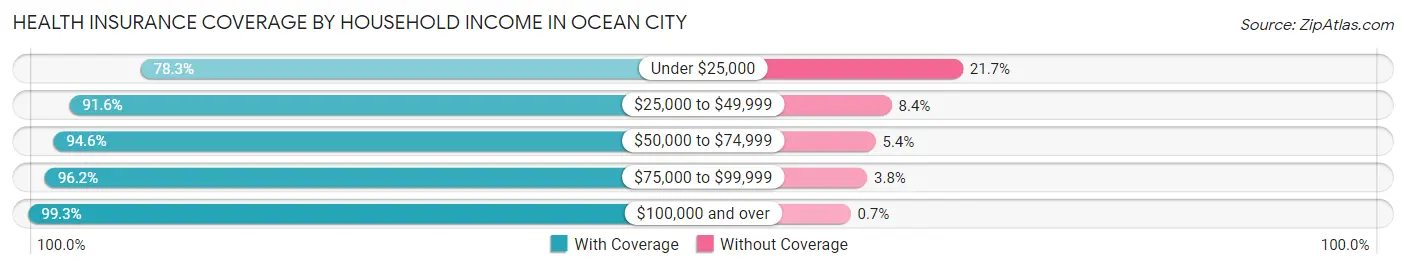
| Household Income | With Coverage | Without Coverage |
| Under $25,000 | 853 (78.3%) | 237 (21.7%) |
| $25,000 to $49,999 | 1,287 (91.6%) | 118 (8.4%) |
| $50,000 to $74,999 | 1,105 (94.6%) | 63 (5.4%) |
| $75,000 to $99,999 | 1,163 (96.2%) | 46 (3.8%) |
| $100,000 and over | 6,205 (99.3%) | 44 (0.7%) |
Public vs Private Health Insurance Coverage by Age in Ocean City
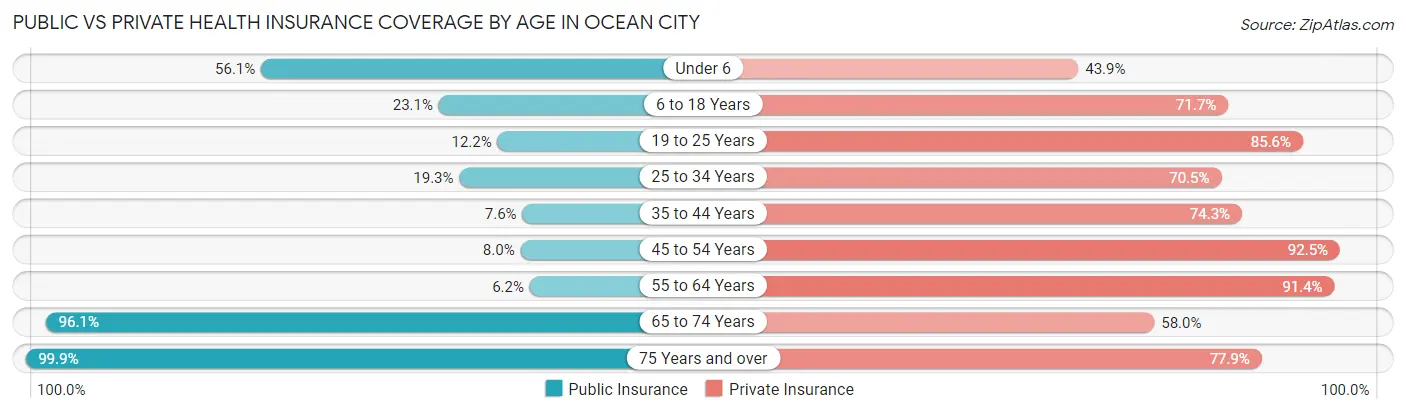
| Age Bracket | Public Insurance | Private Insurance |
| Under 6 | 138 (56.1%) | 108 (43.9%) |
| 6 to 18 Years | 371 (23.1%) | 1,151 (71.7%) |
| 19 to 25 Years | 61 (12.2%) | 427 (85.6%) |
| 25 to 34 Years | 160 (19.3%) | 584 (70.5%) |
| 35 to 44 Years | 54 (7.6%) | 528 (74.3%) |
| 45 to 54 Years | 118 (8.0%) | 1,371 (92.4%) |
| 55 to 64 Years | 128 (6.2%) | 1,880 (91.4%) |
| 65 to 74 Years | 1,943 (96.1%) | 1,173 (58.0%) |
| 75 Years and over | 1,679 (99.9%) | 1,310 (77.9%) |
| Total | 4,652 (41.8%) | 8,532 (76.6%) |
Disability Status by Sex by Age in Ocean City
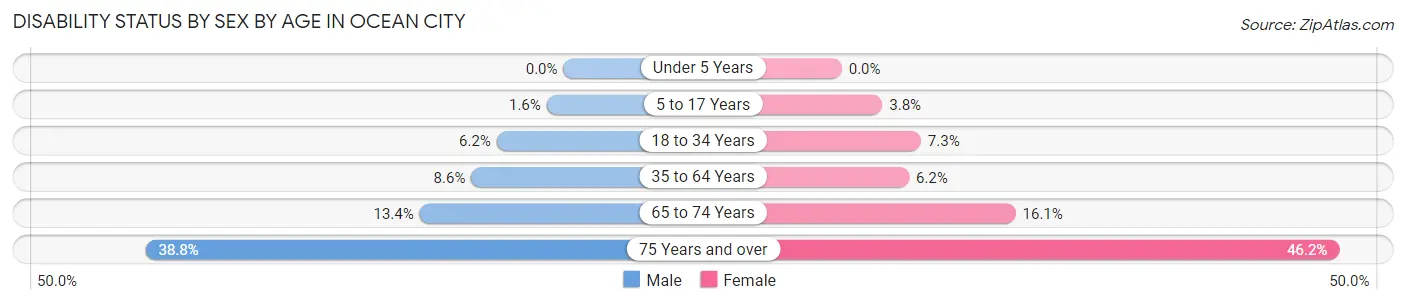
| Age Bracket | Male | Female |
| Under 5 Years | 0 (0.0%) | 0 (0.0%) |
| 5 to 17 Years | 10 (1.5%) | 33 (3.8%) |
| 18 to 34 Years | 45 (6.2%) | 53 (7.3%) |
| 35 to 64 Years | 173 (8.6%) | 139 (6.2%) |
| 65 to 74 Years | 130 (13.4%) | 169 (16.1%) |
| 75 Years and over | 268 (38.8%) | 457 (46.2%) |
Disability Class by Sex by Age in Ocean City
Disability Class: Hearing Difficulty
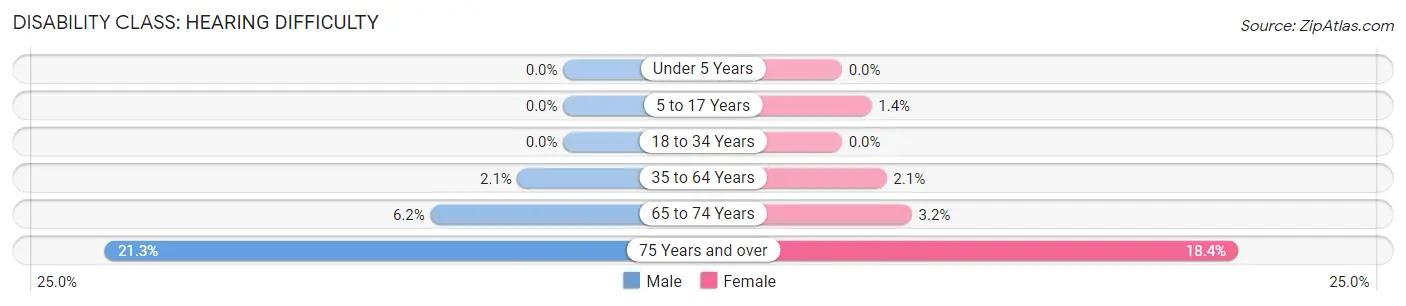
| Age Bracket | Male | Female |
| Under 5 Years | 0 (0.0%) | 0 (0.0%) |
| 5 to 17 Years | 0 (0.0%) | 12 (1.4%) |
| 18 to 34 Years | 0 (0.0%) | 0 (0.0%) |
| 35 to 64 Years | 43 (2.1%) | 46 (2.1%) |
| 65 to 74 Years | 60 (6.2%) | 34 (3.2%) |
| 75 Years and over | 147 (21.3%) | 182 (18.4%) |
Disability Class: Vision Difficulty
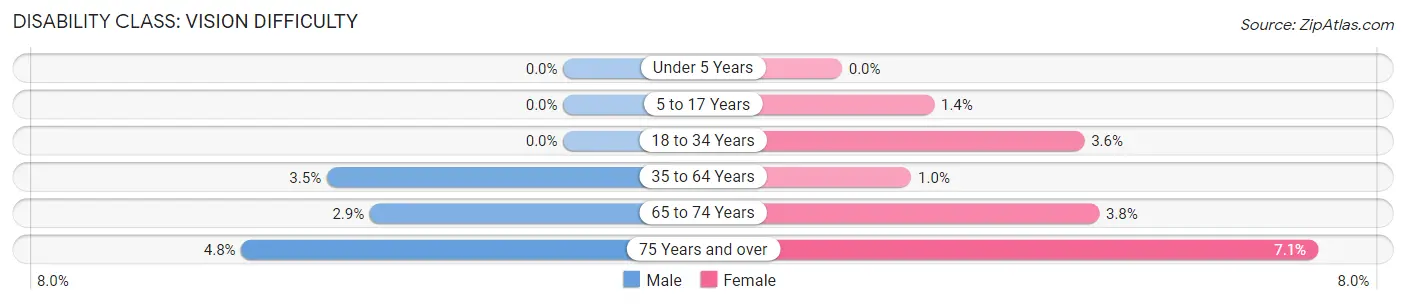
| Age Bracket | Male | Female |
| Under 5 Years | 0 (0.0%) | 0 (0.0%) |
| 5 to 17 Years | 0 (0.0%) | 12 (1.4%) |
| 18 to 34 Years | 0 (0.0%) | 26 (3.6%) |
| 35 to 64 Years | 71 (3.5%) | 23 (1.0%) |
| 65 to 74 Years | 28 (2.9%) | 40 (3.8%) |
| 75 Years and over | 33 (4.8%) | 70 (7.1%) |
Disability Class: Cognitive Difficulty
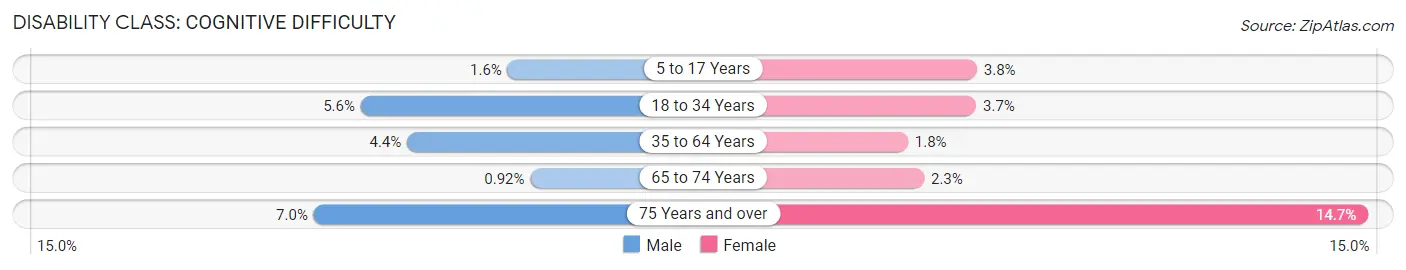
| Age Bracket | Male | Female |
| 5 to 17 Years | 10 (1.5%) | 33 (3.8%) |
| 18 to 34 Years | 41 (5.6%) | 27 (3.7%) |
| 35 to 64 Years | 88 (4.3%) | 41 (1.8%) |
| 65 to 74 Years | 9 (0.9%) | 24 (2.3%) |
| 75 Years and over | 48 (7.0%) | 145 (14.6%) |
Disability Class: Ambulatory Difficulty
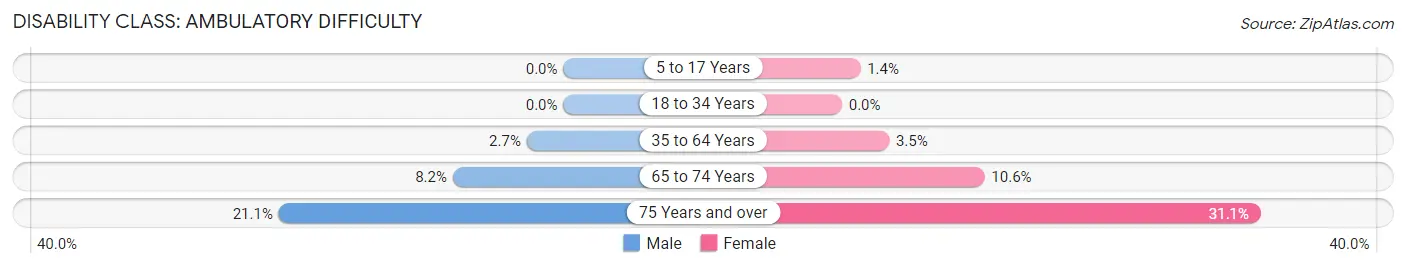
| Age Bracket | Male | Female |
| 5 to 17 Years | 0 (0.0%) | 12 (1.4%) |
| 18 to 34 Years | 0 (0.0%) | 0 (0.0%) |
| 35 to 64 Years | 55 (2.7%) | 78 (3.5%) |
| 65 to 74 Years | 80 (8.2%) | 111 (10.6%) |
| 75 Years and over | 146 (21.1%) | 308 (31.1%) |
Disability Class: Self-Care Difficulty
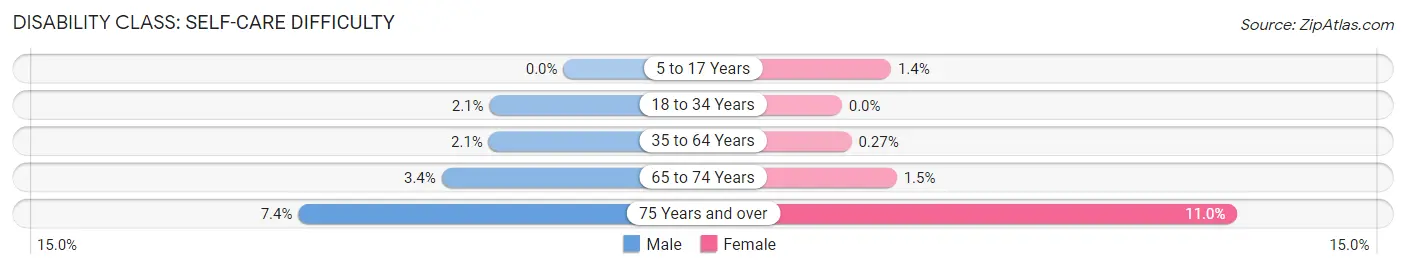
| Age Bracket | Male | Female |
| 5 to 17 Years | 0 (0.0%) | 12 (1.4%) |
| 18 to 34 Years | 15 (2.1%) | 0 (0.0%) |
| 35 to 64 Years | 42 (2.1%) | 6 (0.3%) |
| 65 to 74 Years | 33 (3.4%) | 16 (1.5%) |
| 75 Years and over | 51 (7.4%) | 109 (11.0%) |
Technology Access in Ocean City
Computing Device Access in Ocean City
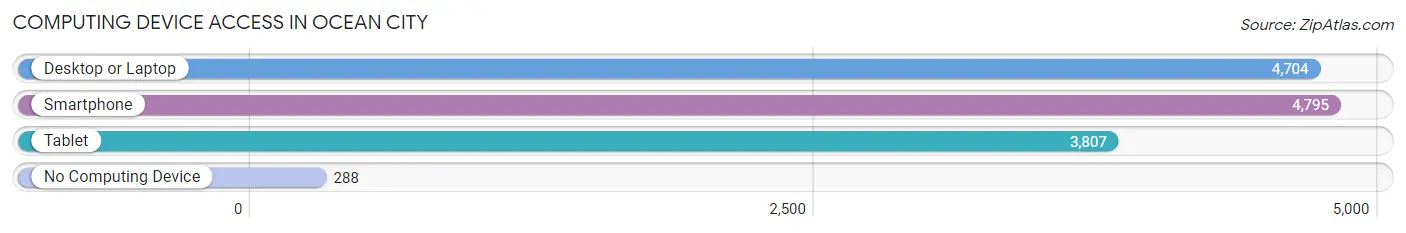
| Device Type | # Households | % Households |
| Desktop or Laptop | 4,704 | 85.2% |
| Smartphone | 4,795 | 86.9% |
| Tablet | 3,807 | 69.0% |
| No Computing Device | 288 | 5.2% |
| Total | 5,521 | 100.0% |
Internet Access in Ocean City
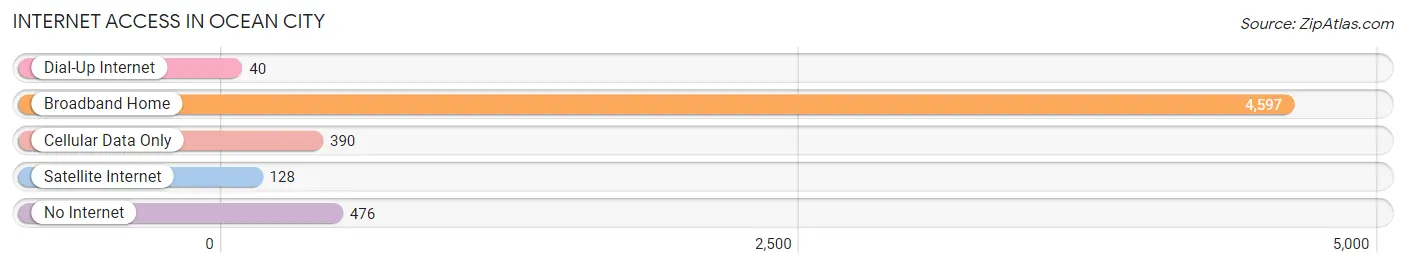
| Internet Type | # Households | % Households |
| Dial-Up Internet | 40 | 0.7% |
| Broadband Home | 4,597 | 83.3% |
| Cellular Data Only | 390 | 7.1% |
| Satellite Internet | 128 | 2.3% |
| No Internet | 476 | 8.6% |
| Total | 5,521 | 100.0% |
Ocean City Summary
Introduction
Ocean City, New Jersey is a small coastal town located in Cape May County, New Jersey. It is a popular summer destination for tourists and locals alike, and is known for its beautiful beaches, boardwalk, and family-friendly atmosphere. The town has a rich history, and has been a popular vacation spot since the late 19th century. This paper will explore the history, geography, economy, and demographics of Ocean City, New Jersey in 2000 words.
History
The area that is now Ocean City was first inhabited by the Lenni Lenape Native Americans. The first European settlers arrived in the area in the late 1600s, and the town was officially founded in 1879. The town was originally called Peck’s Beach, after the Peck family who owned the land. In 1883, the town was renamed Ocean City, and the first boardwalk was built in 1884.
The town quickly became a popular summer destination for tourists from Philadelphia and New York City. The town was known for its beautiful beaches, boardwalk, and family-friendly atmosphere. In the early 1900s, the town was a popular destination for wealthy families from the Northeast.
In the 1950s, the town began to attract more middle-class families, and the town’s population began to grow. The town was also a popular destination for college students, and the town’s economy began to grow. In the 1960s, the town began to attract more tourists from around the country, and the town’s economy continued to grow.
Today, Ocean City is a popular summer destination for tourists from around the world. The town is known for its beautiful beaches, boardwalk, and family-friendly atmosphere. The town is also home to a variety of restaurants, shops, and attractions.
Geography
Ocean City is located in Cape May County, New Jersey. The town is situated on a barrier island, and is bordered by the Atlantic Ocean to the east and the Great Egg Harbor Bay to the west. The town is approximately 8.5 miles long and 2.5 miles wide.
The town is divided into two sections: the north end and the south end. The north end is the more developed section of the town, and is home to the boardwalk, restaurants, shops, and attractions. The south end is the more residential section of the town, and is home to many of the town’s beaches.
The town is also home to several parks, including the Ocean City Boardwalk, the Ocean City Beach, and the Ocean City Fishing Pier. The town is also home to several marinas, including the Ocean City Marina and the Ocean City Yacht Club.
Economy
The economy of Ocean City is largely based on tourism. The town is a popular summer destination for tourists from around the world, and the town’s economy is heavily reliant on the tourism industry. The town is home to a variety of restaurants, shops, and attractions, and the town’s economy is also supported by the fishing industry.
The town is also home to several marinas, and the town’s economy is supported by the boating and fishing industries. The town is also home to several manufacturing companies, and the town’s economy is supported by the manufacturing industry.
Demographics
According to the 2010 United States Census, the population of Ocean City was 11,701. The town has a population density of 1,845 people per square mile. The median age of the town’s population is 48.7 years, and the median household income is $60,945.
The town is predominantly white, with 87.3% of the population identifying as white. The town is also home to a large Hispanic population, with 8.3% of the population identifying as Hispanic or Latino. The town is also home to a small African American population, with 2.2% of the population identifying as African American.
Conclusion
Ocean City, New Jersey is a small coastal town located in Cape May County, New Jersey. The town has a rich history, and has been a popular summer destination since the late 19th century. This paper has explored the history, geography, economy, and demographics of Ocean City, New Jersey in 2000 words. The town is a popular summer destination for tourists from around the world, and the town’s economy is largely based on tourism. The town is predominantly white, with 87.3% of the population identifying as white. The town is also home to a large Hispanic population, with 8.3% of the population identifying as Hispanic or Latino. The town is also home to a small African American population, with 2.2% of the population identifying as African American.
Common Questions
What is Per Capita Income in Ocean City?
Per Capita income in Ocean City is $68,244.
What is the Median Family Income in Ocean City?
Median Family Income in Ocean City is $135,343.
What is the Median Household income in Ocean City?
Median Household Income in Ocean City is $98,576.
What is Income or Wage Gap in Ocean City?
Income or Wage Gap in Ocean City is 38.6%.
Women in Ocean City earn 61.4 cents for every dollar earned by a man.
What is Family Income Deficit in Ocean City?
Family Income Deficit in Ocean City is $8,028.
Families that are below poverty line in Ocean City earn $8,028 less on average than the poverty threshold level.
What is Inequality or Gini Index in Ocean City?
Inequality or Gini Index in Ocean City is 0.50.
What is the Total Population of Ocean City?
Total Population of Ocean City is 11,260.
What is the Total Male Population of Ocean City?
Total Male Population of Ocean City is 5,108.
What is the Total Female Population of Ocean City?
Total Female Population of Ocean City is 6,152.
What is the Ratio of Males per 100 Females in Ocean City?
There are 83.03 Males per 100 Females in Ocean City.
What is the Ratio of Females per 100 Males in Ocean City?
There are 120.44 Females per 100 Males in Ocean City.
What is the Median Population Age in Ocean City?
Median Population Age in Ocean City is 56.9 Years.
What is the Average Family Size in Ocean City
Average Family Size in Ocean City is 2.7 People.
What is the Average Household Size in Ocean City
Average Household Size in Ocean City is 2.0 People.
How Large is the Labor Force in Ocean City?
There are 5,280 People in the Labor Forcein in Ocean City.
What is the Percentage of People in the Labor Force in Ocean City?
53.3% of People are in the Labor Force in Ocean City.
What is the Unemployment Rate in Ocean City?
Unemployment Rate in Ocean City is 2.9%.