Northfield, NJ Map & Demographics
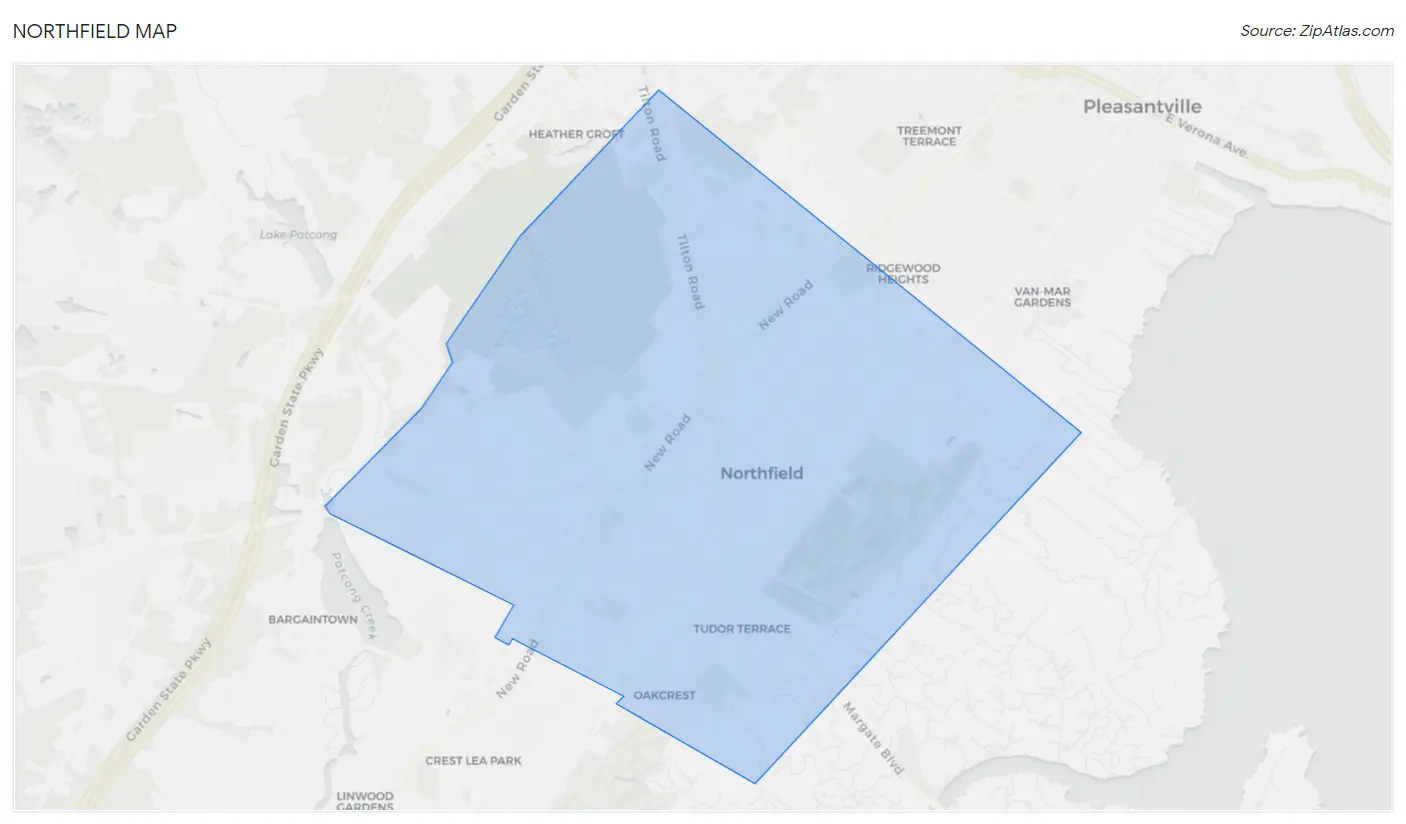
Northfield Map
Northfield Overview
$51,741
PER CAPITA INCOME
$116,641
AVG FAMILY INCOME
$103,977
AVG HOUSEHOLD INCOME
29.3%
WAGE / INCOME GAP [ % ]
70.7¢/ $1
WAGE / INCOME GAP [ $ ]
0.47
INEQUALITY / GINI INDEX
8,432
TOTAL POPULATION
4,187
MALE POPULATION
4,245
FEMALE POPULATION
98.63
MALES / 100 FEMALES
101.39
FEMALES / 100 MALES
44.2
MEDIAN AGE
3.2
AVG FAMILY SIZE
2.6
AVG HOUSEHOLD SIZE
4,516
LABOR FORCE [ PEOPLE ]
65.1%
PERCENT IN LABOR FORCE
5.8%
UNEMPLOYMENT RATE
Northfield Zip Codes
Income in Northfield
Income Overview in Northfield
Per Capita Income in Northfield is $51,741, while median incomes of families and households are $116,641 and $103,977 respectively.
| Characteristic | Number | Measure |
| Per Capita Income | 8,432 | $51,741 |
| Median Family Income | 2,227 | $116,641 |
| Mean Family Income | 2,227 | $162,353 |
| Median Household Income | 3,159 | $103,977 |
| Mean Household Income | 3,159 | $137,280 |
| Income Deficit | 2,227 | $0 |
| Wage / Income Gap (%) | 8,432 | 29.32% |
| Wage / Income Gap ($) | 8,432 | 70.68¢ per $1 |
| Gini / Inequality Index | 8,432 | 0.47 |
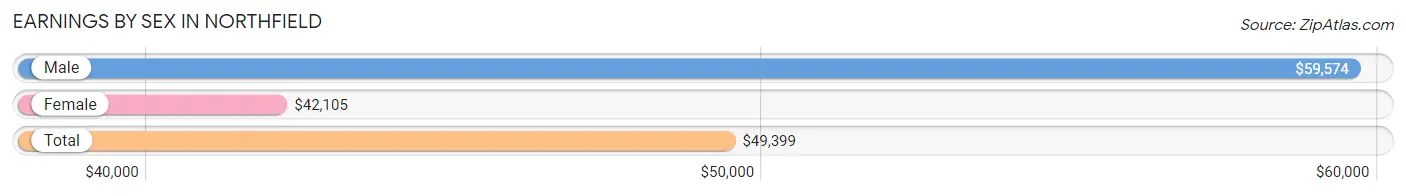
Earnings by Sex in Northfield
Average Earnings in Northfield are $49,399, $59,574 for men and $42,105 for women, a difference of 29.3%.
| Sex | Number | Average Earnings |
| Male | 2,419 (52.4%) | $59,574 |
| Female | 2,201 (47.6%) | $42,105 |
| Total | 4,620 (100.0%) | $49,399 |
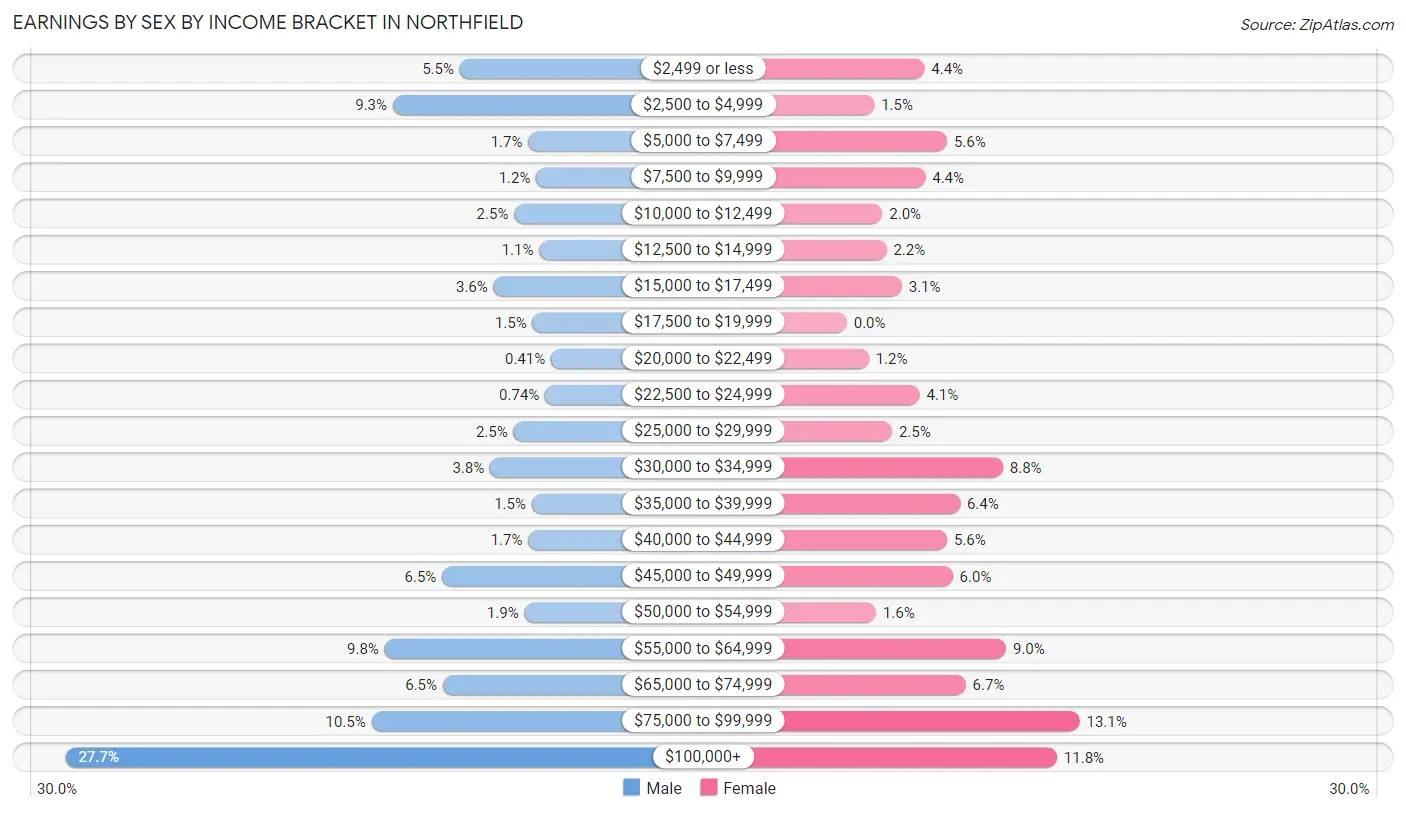
Earnings by Sex by Income Bracket in Northfield
The most common earnings brackets in Northfield are $100,000+ for men (670 | 27.7%) and $75,000 to $99,999 for women (288 | 13.1%).
| Income | Male | Female |
| $2,499 or less | 134 (5.5%) | 96 (4.4%) |
| $2,500 to $4,999 | 225 (9.3%) | 34 (1.5%) |
| $5,000 to $7,499 | 41 (1.7%) | 124 (5.6%) |
| $7,500 to $9,999 | 30 (1.2%) | 97 (4.4%) |
| $10,000 to $12,499 | 60 (2.5%) | 44 (2.0%) |
| $12,500 to $14,999 | 26 (1.1%) | 49 (2.2%) |
| $15,000 to $17,499 | 88 (3.6%) | 68 (3.1%) |
| $17,500 to $19,999 | 35 (1.5%) | 0 (0.0%) |
| $20,000 to $22,499 | 10 (0.4%) | 27 (1.2%) |
| $22,500 to $24,999 | 18 (0.7%) | 90 (4.1%) |
| $25,000 to $29,999 | 61 (2.5%) | 56 (2.5%) |
| $30,000 to $34,999 | 93 (3.8%) | 193 (8.8%) |
| $35,000 to $39,999 | 36 (1.5%) | 140 (6.4%) |
| $40,000 to $44,999 | 41 (1.7%) | 124 (5.6%) |
| $45,000 to $49,999 | 158 (6.5%) | 131 (5.9%) |
| $50,000 to $54,999 | 46 (1.9%) | 36 (1.6%) |
| $55,000 to $64,999 | 236 (9.8%) | 197 (8.9%) |
| $65,000 to $74,999 | 157 (6.5%) | 147 (6.7%) |
| $75,000 to $99,999 | 254 (10.5%) | 288 (13.1%) |
| $100,000+ | 670 (27.7%) | 260 (11.8%) |
| Total | 2,419 (100.0%) | 2,201 (100.0%) |
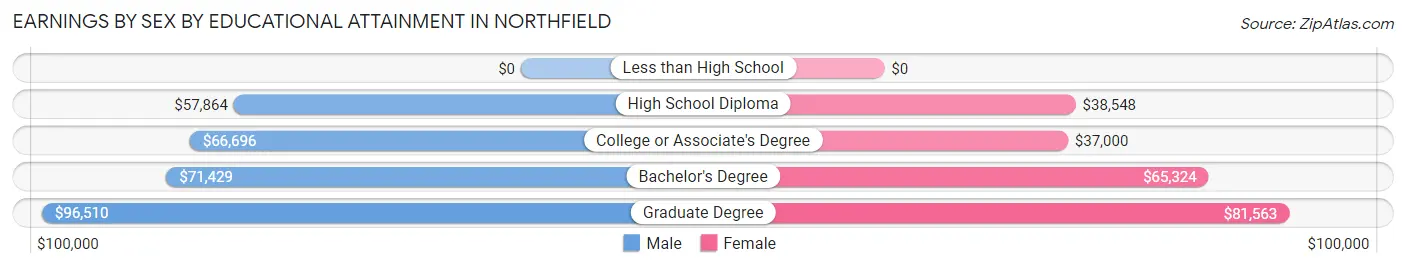
Earnings by Sex by Educational Attainment in Northfield
Average earnings in Northfield are $69,375 for men and $47,246 for women, a difference of 31.9%. Men with an educational attainment of graduate degree enjoy the highest average annual earnings of $96,510, while those with high school diploma education earn the least with $57,864. Women with an educational attainment of graduate degree earn the most with the average annual earnings of $81,563, while those with college or associate's degree education have the smallest earnings of $37,000.
| Educational Attainment | Male Income | Female Income |
| Less than High School | - | - |
| High School Diploma | $57,864 | $38,548 |
| College or Associate's Degree | $66,696 | $37,000 |
| Bachelor's Degree | $71,429 | $65,324 |
| Graduate Degree | $96,510 | $81,563 |
| Total | $69,375 | $47,246 |
Family Income in Northfield
Family Income Brackets in Northfield
According to the Northfield family income data, there are 563 families falling into the $100,000 to $149,999 income range, which is the most common income bracket and makes up 25.3% of all families. Conversely, the $25,000 to $34,999 income bracket is the least frequent group with only 22 families (1.0%) belonging to this category.
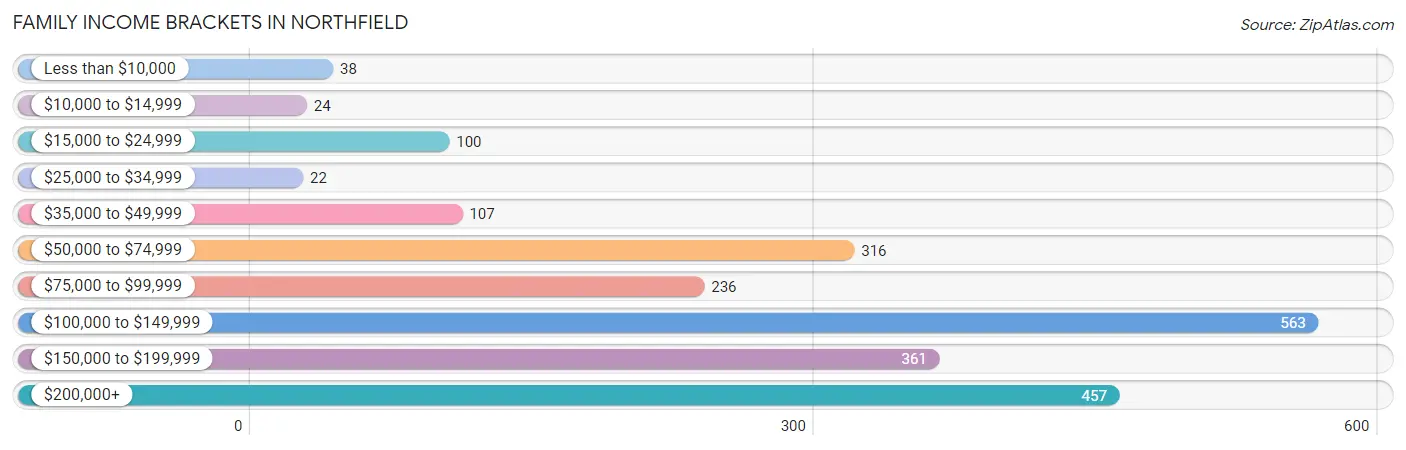
| Income Bracket | # Families | % Families |
| Less than $10,000 | 38 | 1.7% |
| $10,000 to $14,999 | 24 | 1.1% |
| $15,000 to $24,999 | 100 | 4.5% |
| $25,000 to $34,999 | 22 | 1.0% |
| $35,000 to $49,999 | 107 | 4.8% |
| $50,000 to $74,999 | 316 | 14.2% |
| $75,000 to $99,999 | 236 | 10.6% |
| $100,000 to $149,999 | 563 | 25.3% |
| $150,000 to $199,999 | 361 | 16.2% |
| $200,000+ | 457 | 20.5% |
Family Income by Famaliy Size in Northfield
4-person families (447 | 20.1%) account for the highest median family income in Northfield with $169,479 per family, while 2-person families (853 | 38.3%) have the highest median income of $43,003 per family member.
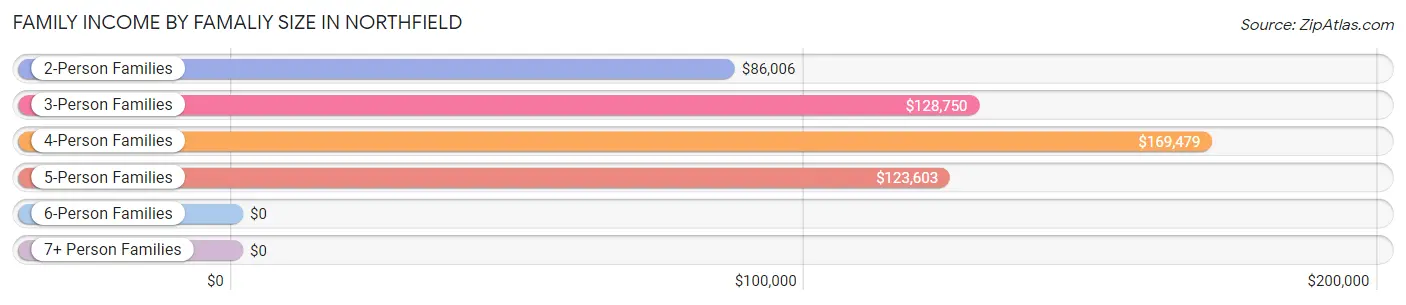
| Income Bracket | # Families | Median Income |
| 2-Person Families | 853 (38.3%) | $86,006 |
| 3-Person Families | 683 (30.7%) | $128,750 |
| 4-Person Families | 447 (20.1%) | $169,479 |
| 5-Person Families | 223 (10.0%) | $123,603 |
| 6-Person Families | 21 (0.9%) | $0 |
| 7+ Person Families | 0 (0.0%) | $0 |
| Total | 2,227 (100.0%) | $116,641 |
Family Income by Number of Earners in Northfield
The median family income in Northfield is $116,641, with families comprising 3+ earners (300) having the highest median family income of $185,855, while families with no earners (279) have the lowest median family income of $49,702, accounting for 13.5% and 12.5% of families, respectively.
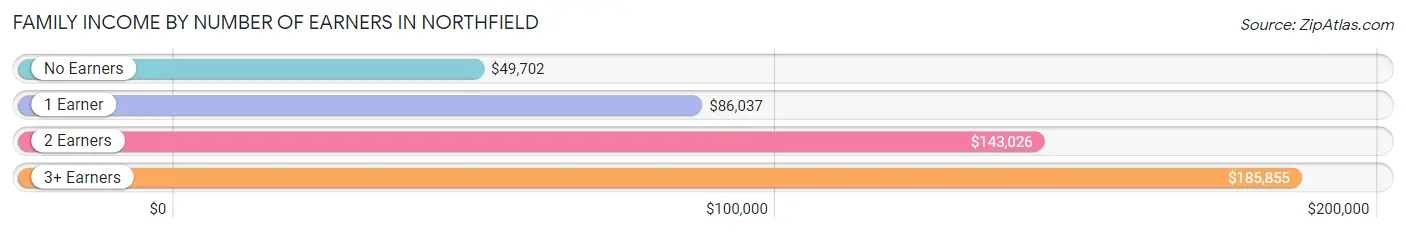
| Number of Earners | # Families | Median Income |
| No Earners | 279 (12.5%) | $49,702 |
| 1 Earner | 594 (26.7%) | $86,037 |
| 2 Earners | 1,054 (47.3%) | $143,026 |
| 3+ Earners | 300 (13.5%) | $185,855 |
| Total | 2,227 (100.0%) | $116,641 |
Household Income in Northfield
Household Income Brackets in Northfield
With 698 households falling in the category, the $100,000 to $149,999 income range is the most frequent in Northfield, accounting for 22.1% of all households. In contrast, only 69 households (2.2%) fall into the less than $10,000 income bracket, making it the least populous group.
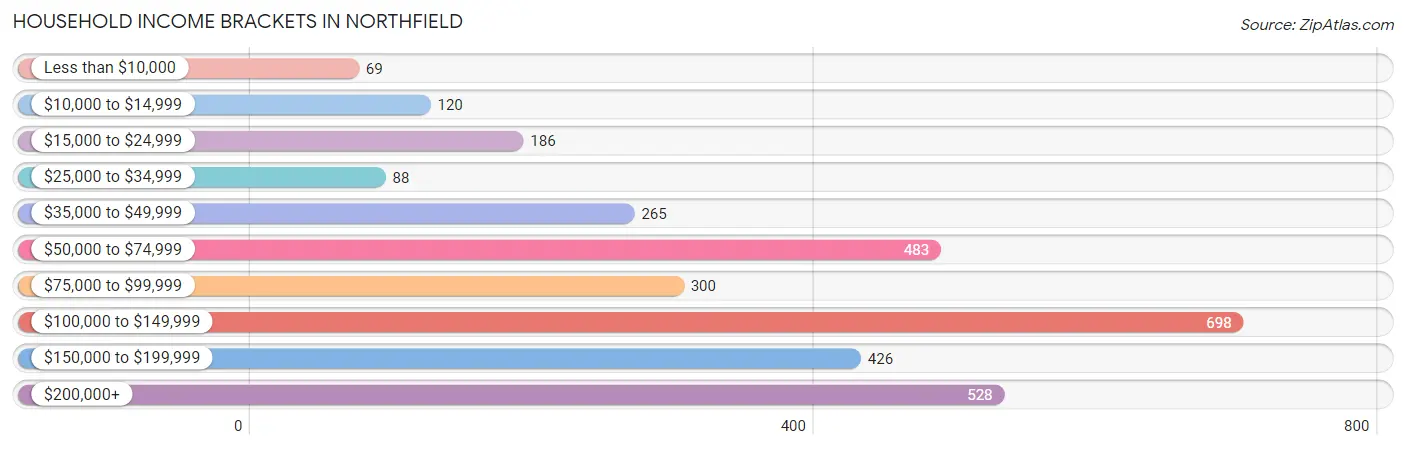
| Income Bracket | # Households | % Households |
| Less than $10,000 | 69 | 2.2% |
| $10,000 to $14,999 | 120 | 3.8% |
| $15,000 to $24,999 | 186 | 5.9% |
| $25,000 to $34,999 | 88 | 2.8% |
| $35,000 to $49,999 | 265 | 8.4% |
| $50,000 to $74,999 | 483 | 15.3% |
| $75,000 to $99,999 | 300 | 9.5% |
| $100,000 to $149,999 | 698 | 22.1% |
| $150,000 to $199,999 | 426 | 13.5% |
| $200,000+ | 528 | 16.7% |
Household Income by Householder Age in Northfield
The median household income in Northfield is $103,977, with the highest median household income of $137,250 found in the 45 to 64 years age bracket for the primary householder. A total of 1,361 households (43.1%) fall into this category. Meanwhile, the 15 to 24 years age bracket for the primary householder has the lowest median household income of $0, with 46 households (1.5%) in this group.
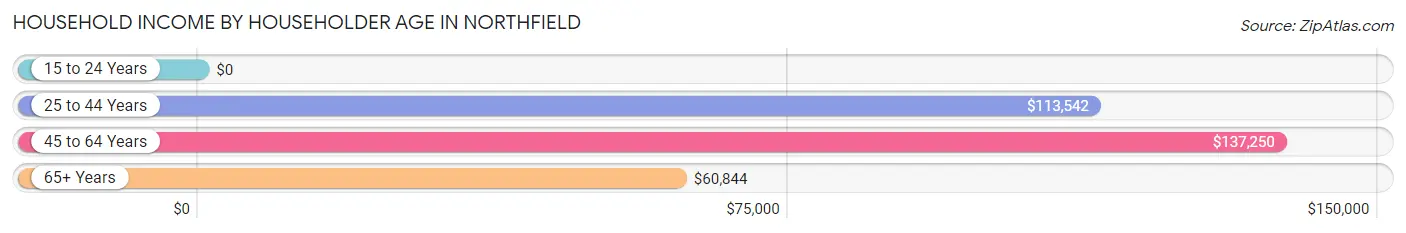
| Income Bracket | # Households | Median Income |
| 15 to 24 Years | 46 (1.5%) | $0 |
| 25 to 44 Years | 781 (24.7%) | $113,542 |
| 45 to 64 Years | 1,361 (43.1%) | $137,250 |
| 65+ Years | 971 (30.7%) | $60,844 |
| Total | 3,159 (100.0%) | $103,977 |
Poverty in Northfield
Income Below Poverty by Sex and Age in Northfield
With 5.6% poverty level for males and 5.1% for females among the residents of Northfield, 16 and 17 year old males and 15 year old females are the most vulnerable to poverty, with 17 males (8.8%) and 12 females (27.3%) in their respective age groups living below the poverty level.
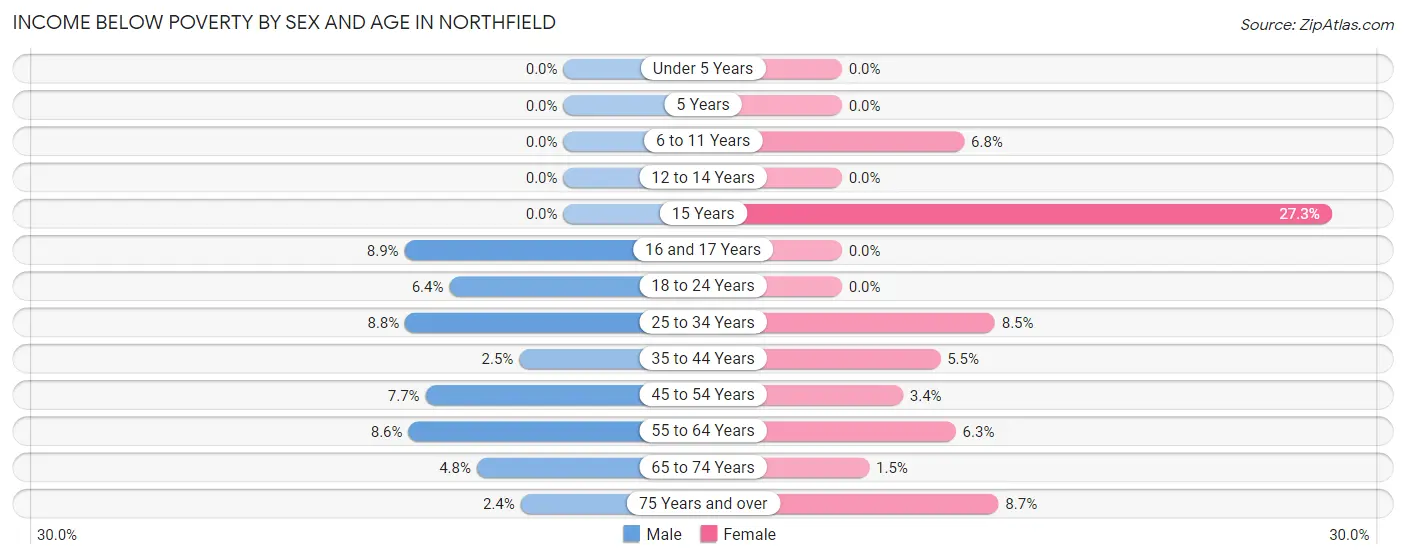
| Age Bracket | Male | Female |
| Under 5 Years | 0 (0.0%) | 0 (0.0%) |
| 5 Years | 0 (0.0%) | 0 (0.0%) |
| 6 to 11 Years | 0 (0.0%) | 29 (6.8%) |
| 12 to 14 Years | 0 (0.0%) | 0 (0.0%) |
| 15 Years | 0 (0.0%) | 12 (27.3%) |
| 16 and 17 Years | 17 (8.8%) | 0 (0.0%) |
| 18 to 24 Years | 29 (6.4%) | 0 (0.0%) |
| 25 to 34 Years | 51 (8.8%) | 30 (8.5%) |
| 35 to 44 Years | 9 (2.5%) | 33 (5.5%) |
| 45 to 54 Years | 40 (7.7%) | 20 (3.4%) |
| 55 to 64 Years | 58 (8.6%) | 45 (6.3%) |
| 65 to 74 Years | 19 (4.8%) | 5 (1.5%) |
| 75 Years and over | 7 (2.4%) | 38 (8.7%) |
| Total | 230 (5.6%) | 212 (5.1%) |
Income Above Poverty by Sex and Age in Northfield
According to the poverty statistics in Northfield, males aged under 5 years and females aged under 5 years are the age groups that are most secure financially, with 100.0% of males and 100.0% of females in these age groups living above the poverty line.
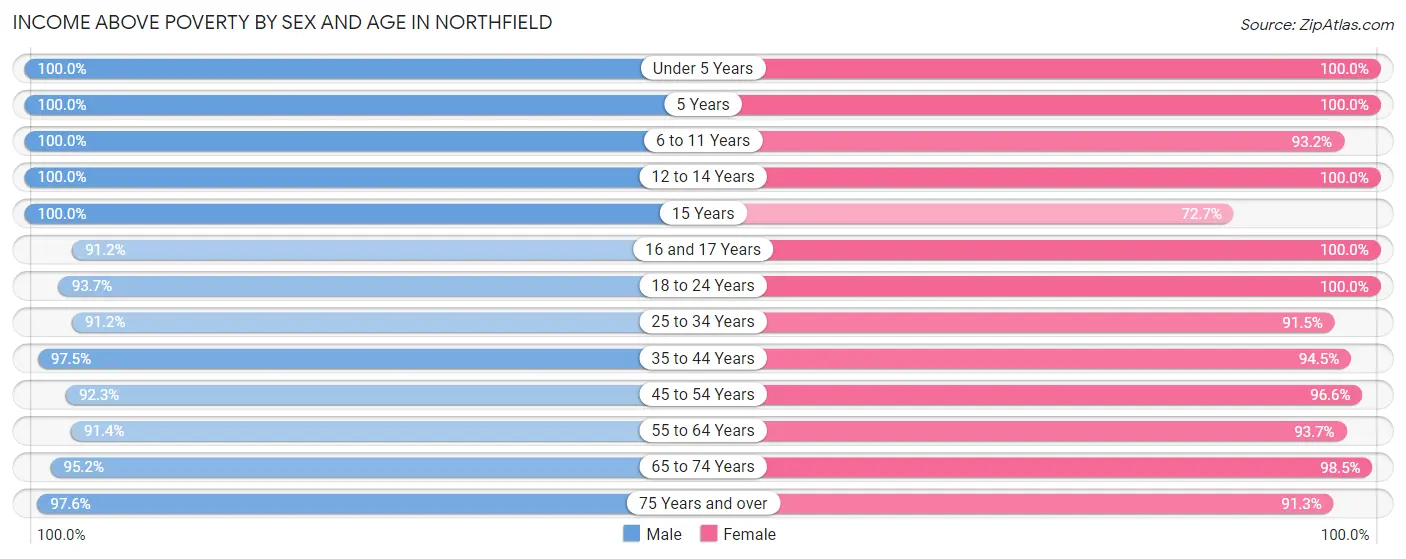
| Age Bracket | Male | Female |
| Under 5 Years | 154 (100.0%) | 113 (100.0%) |
| 5 Years | 55 (100.0%) | 86 (100.0%) |
| 6 to 11 Years | 220 (100.0%) | 397 (93.2%) |
| 12 to 14 Years | 125 (100.0%) | 169 (100.0%) |
| 15 Years | 101 (100.0%) | 32 (72.7%) |
| 16 and 17 Years | 175 (91.1%) | 81 (100.0%) |
| 18 to 24 Years | 428 (93.6%) | 205 (100.0%) |
| 25 to 34 Years | 528 (91.2%) | 322 (91.5%) |
| 35 to 44 Years | 357 (97.5%) | 569 (94.5%) |
| 45 to 54 Years | 481 (92.3%) | 569 (96.6%) |
| 55 to 64 Years | 614 (91.4%) | 665 (93.7%) |
| 65 to 74 Years | 375 (95.2%) | 325 (98.5%) |
| 75 Years and over | 287 (97.6%) | 398 (91.3%) |
| Total | 3,900 (94.4%) | 3,931 (94.9%) |
Income Below Poverty Among Married-Couple Families in Northfield
The poverty statistics for married-couple families in Northfield show that 4.4% or 77 of the total 1,732 families live below the poverty line. Families with 1 or 2 children have the highest poverty rate of 6.1%, comprising of 40 families. On the other hand, families with 3 or 4 children have the lowest poverty rate of 0.0%, which includes 0 families.
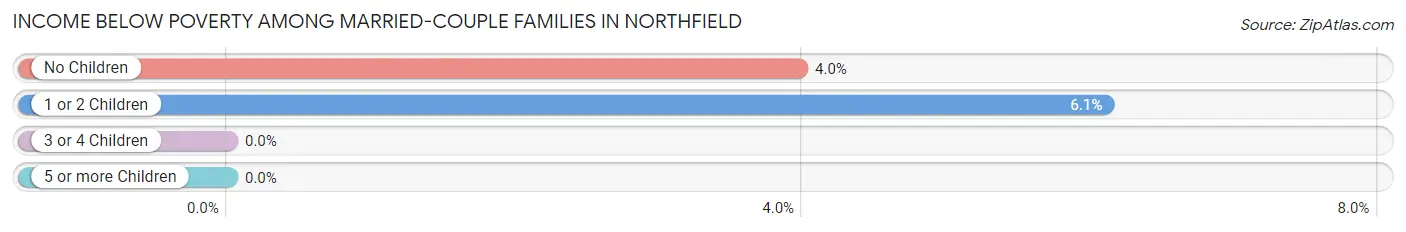
| Children | Above Poverty | Below Poverty |
| No Children | 894 (96.0%) | 37 (4.0%) |
| 1 or 2 Children | 616 (93.9%) | 40 (6.1%) |
| 3 or 4 Children | 145 (100.0%) | 0 (0.0%) |
| 5 or more Children | 0 (0.0%) | 0 (0.0%) |
| Total | 1,655 (95.6%) | 77 (4.4%) |
Income Below Poverty Among Single-Parent Households in Northfield
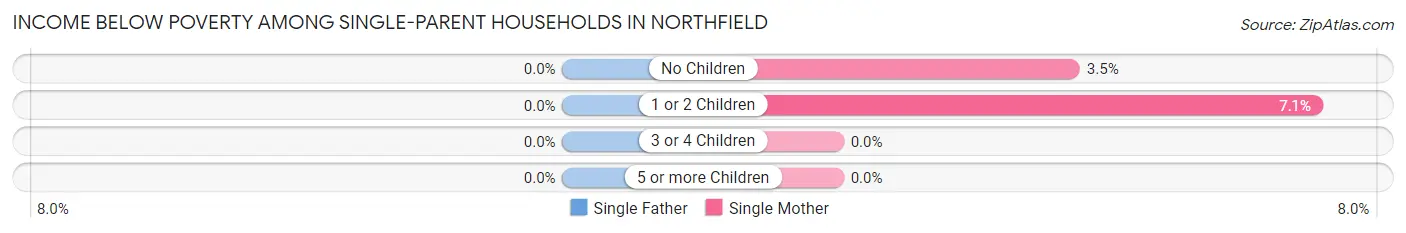
| Children | Single Father | Single Mother |
| No Children | 0 (0.0%) | 5 (3.5%) |
| 1 or 2 Children | 0 (0.0%) | 13 (7.1%) |
| 3 or 4 Children | 0 (0.0%) | 0 (0.0%) |
| 5 or more Children | 0 (0.0%) | 0 (0.0%) |
| Total | 0 (0.0%) | 18 (5.4%) |
Income Below Poverty Among Married-Couple vs Single-Parent Households in Northfield
The poverty data for Northfield shows that 77 of the married-couple family households (4.4%) and 18 of the single-parent households (3.6%) are living below the poverty level. Within the married-couple family households, those with 1 or 2 children have the highest poverty rate, with 40 households (6.1%) falling below the poverty line. Among the single-parent households, those with 1 or 2 children have the highest poverty rate, with 13 household (5.9%) living below poverty.
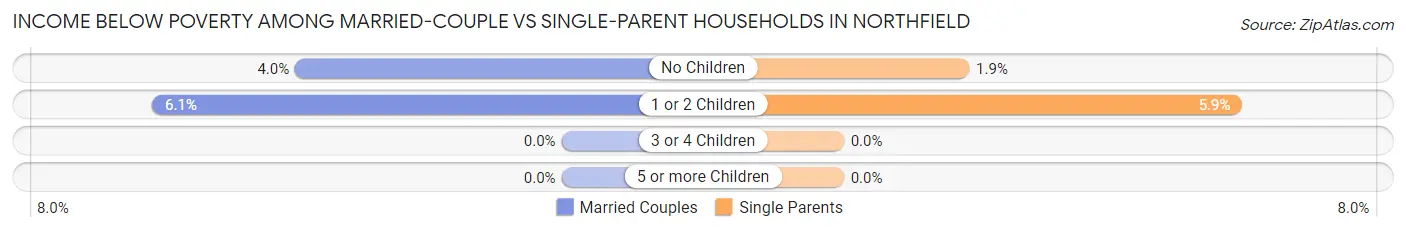
| Children | Married-Couple Families | Single-Parent Households |
| No Children | 37 (4.0%) | 5 (1.9%) |
| 1 or 2 Children | 40 (6.1%) | 13 (5.9%) |
| 3 or 4 Children | 0 (0.0%) | 0 (0.0%) |
| 5 or more Children | 0 (0.0%) | 0 (0.0%) |
| Total | 77 (4.4%) | 18 (3.6%) |
Race in Northfield
The most populous races in Northfield are White / Caucasian (6,743 | 80.0%), Hispanic or Latino (1,024 | 12.1%), and Asian (706 | 8.4%).
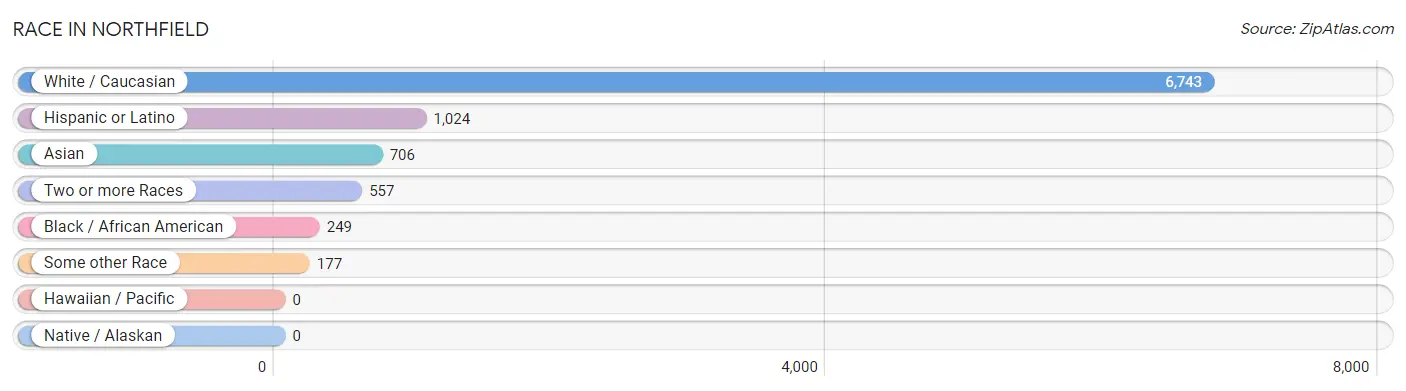
| Race | # Population | % Population |
| Asian | 706 | 8.4% |
| Black / African American | 249 | 2.9% |
| Hawaiian / Pacific | 0 | 0.0% |
| Hispanic or Latino | 1,024 | 12.1% |
| Native / Alaskan | 0 | 0.0% |
| White / Caucasian | 6,743 | 80.0% |
| Two or more Races | 557 | 6.6% |
| Some other Race | 177 | 2.1% |
| Total | 8,432 | 100.0% |
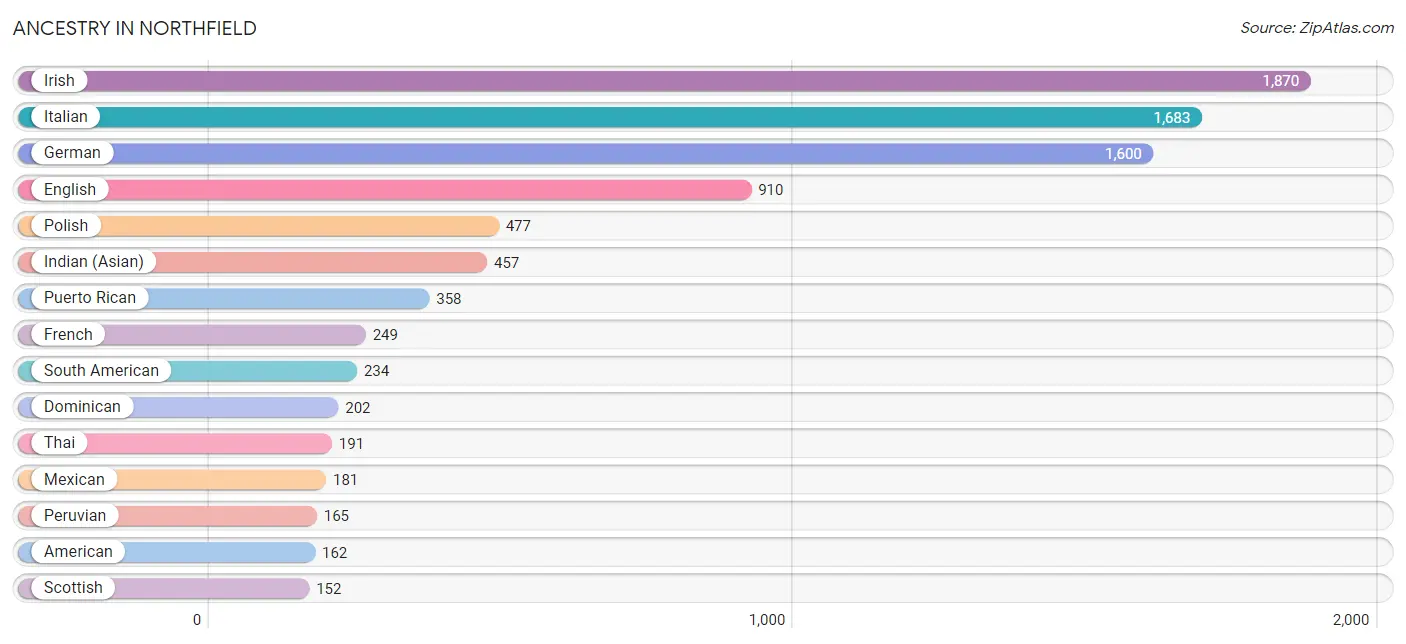
Ancestry in Northfield
The most populous ancestries reported in Northfield are Irish (1,870 | 22.2%), Italian (1,683 | 20.0%), German (1,600 | 19.0%), English (910 | 10.8%), and Polish (477 | 5.7%), together accounting for 77.6% of all Northfield residents.
| Ancestry | # Population | % Population |
| American | 162 | 1.9% |
| Arab | 25 | 0.3% |
| Armenian | 13 | 0.2% |
| Bhutanese | 21 | 0.3% |
| British | 22 | 0.3% |
| Burmese | 16 | 0.2% |
| Canadian | 9 | 0.1% |
| Central American | 49 | 0.6% |
| Central American Indian | 11 | 0.1% |
| Colombian | 55 | 0.6% |
| Czech | 6 | 0.1% |
| Czechoslovakian | 13 | 0.2% |
| Danish | 12 | 0.1% |
| Dominican | 202 | 2.4% |
| Dutch | 137 | 1.6% |
| Eastern European | 23 | 0.3% |
| Ecuadorian | 14 | 0.2% |
| Egyptian | 16 | 0.2% |
| English | 910 | 10.8% |
| European | 70 | 0.8% |
| Finnish | 5 | 0.1% |
| French | 249 | 2.9% |
| French Canadian | 63 | 0.7% |
| German | 1,600 | 19.0% |
| Greek | 74 | 0.9% |
| Honduran | 29 | 0.3% |
| Hungarian | 76 | 0.9% |
| Indian (Asian) | 457 | 5.4% |
| Iranian | 7 | 0.1% |
| Irish | 1,870 | 22.2% |
| Italian | 1,683 | 20.0% |
| Kenyan | 6 | 0.1% |
| Korean | 65 | 0.8% |
| Latvian | 12 | 0.1% |
| Lebanese | 4 | 0.1% |
| Lithuanian | 98 | 1.2% |
| Mexican | 181 | 2.1% |
| Nicaraguan | 20 | 0.2% |
| Northern European | 20 | 0.2% |
| Peruvian | 165 | 2.0% |
| Polish | 477 | 5.7% |
| Portuguese | 60 | 0.7% |
| Puerto Rican | 358 | 4.3% |
| Romanian | 73 | 0.9% |
| Russian | 58 | 0.7% |
| Scandinavian | 49 | 0.6% |
| Scotch-Irish | 90 | 1.1% |
| Scottish | 152 | 1.8% |
| Serbian | 60 | 0.7% |
| Slovak | 12 | 0.1% |
| South American | 234 | 2.8% |
| Subsaharan African | 6 | 0.1% |
| Swedish | 88 | 1.0% |
| Swiss | 18 | 0.2% |
| Thai | 191 | 2.3% |
| Turkish | 6 | 0.1% |
| Ukrainian | 32 | 0.4% |
| Vietnamese | 116 | 1.4% |
| Welsh | 84 | 1.0% |
| Yugoslavian | 10 | 0.1% | View All 60 Rows |
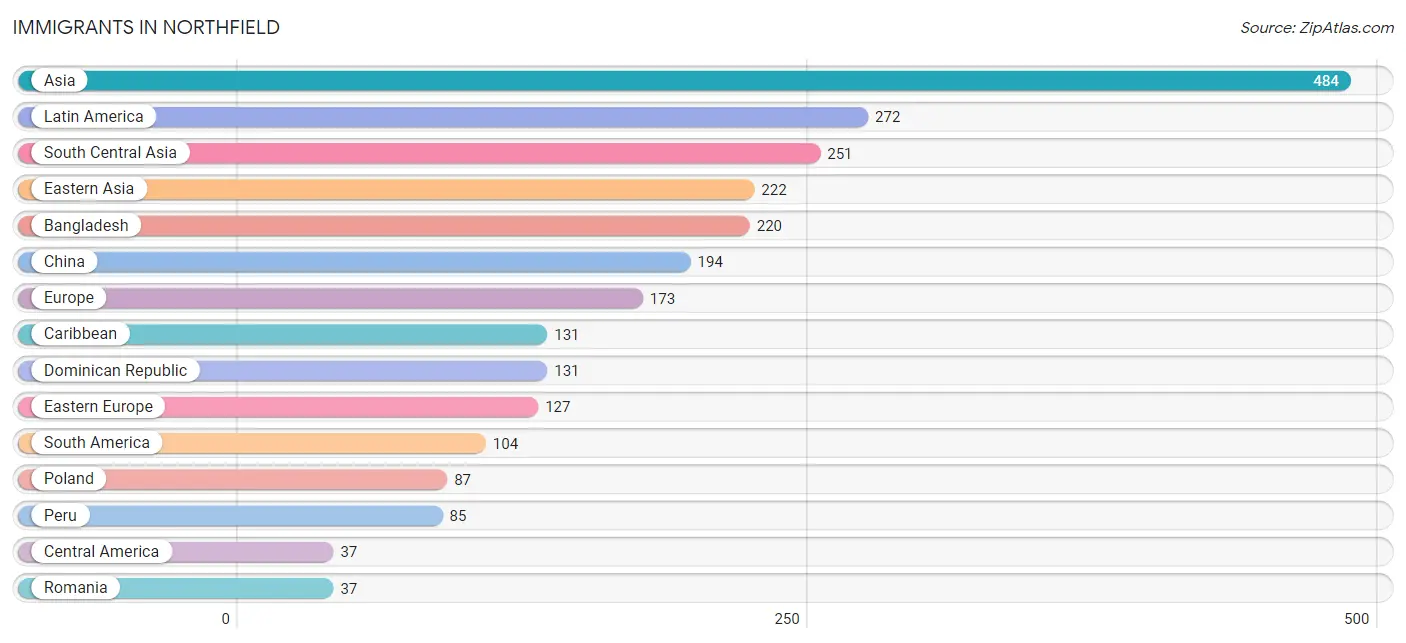
Immigrants in Northfield
The most numerous immigrant groups reported in Northfield came from Asia (484 | 5.7%), Latin America (272 | 3.2%), South Central Asia (251 | 3.0%), Eastern Asia (222 | 2.6%), and Bangladesh (220 | 2.6%), together accounting for 17.2% of all Northfield residents.
| Immigration Origin | # Population | % Population |
| Africa | 6 | 0.1% |
| Asia | 484 | 5.7% |
| Bangladesh | 220 | 2.6% |
| Canada | 21 | 0.3% |
| Caribbean | 131 | 1.5% |
| Central America | 37 | 0.4% |
| China | 194 | 2.3% |
| Colombia | 5 | 0.1% |
| Dominican Republic | 131 | 1.5% |
| Eastern Africa | 6 | 0.1% |
| Eastern Asia | 222 | 2.6% |
| Eastern Europe | 127 | 1.5% |
| Ecuador | 14 | 0.2% |
| England | 12 | 0.1% |
| Europe | 173 | 2.1% |
| Germany | 10 | 0.1% |
| Honduras | 10 | 0.1% |
| India | 24 | 0.3% |
| Iran | 7 | 0.1% |
| Ireland | 8 | 0.1% |
| Italy | 10 | 0.1% |
| Japan | 12 | 0.1% |
| Kenya | 6 | 0.1% |
| Korea | 16 | 0.2% |
| Latin America | 272 | 3.2% |
| Mexico | 17 | 0.2% |
| Netherlands | 6 | 0.1% |
| Nicaragua | 10 | 0.1% |
| Northern Europe | 20 | 0.2% |
| Peru | 85 | 1.0% |
| Philippines | 11 | 0.1% |
| Poland | 87 | 1.0% |
| Romania | 37 | 0.4% |
| South America | 104 | 1.2% |
| South Central Asia | 251 | 3.0% |
| South Eastern Asia | 11 | 0.1% |
| Southern Europe | 10 | 0.1% |
| Taiwan | 4 | 0.1% |
| Ukraine | 3 | 0.0% |
| Western Europe | 16 | 0.2% | View All 40 Rows |
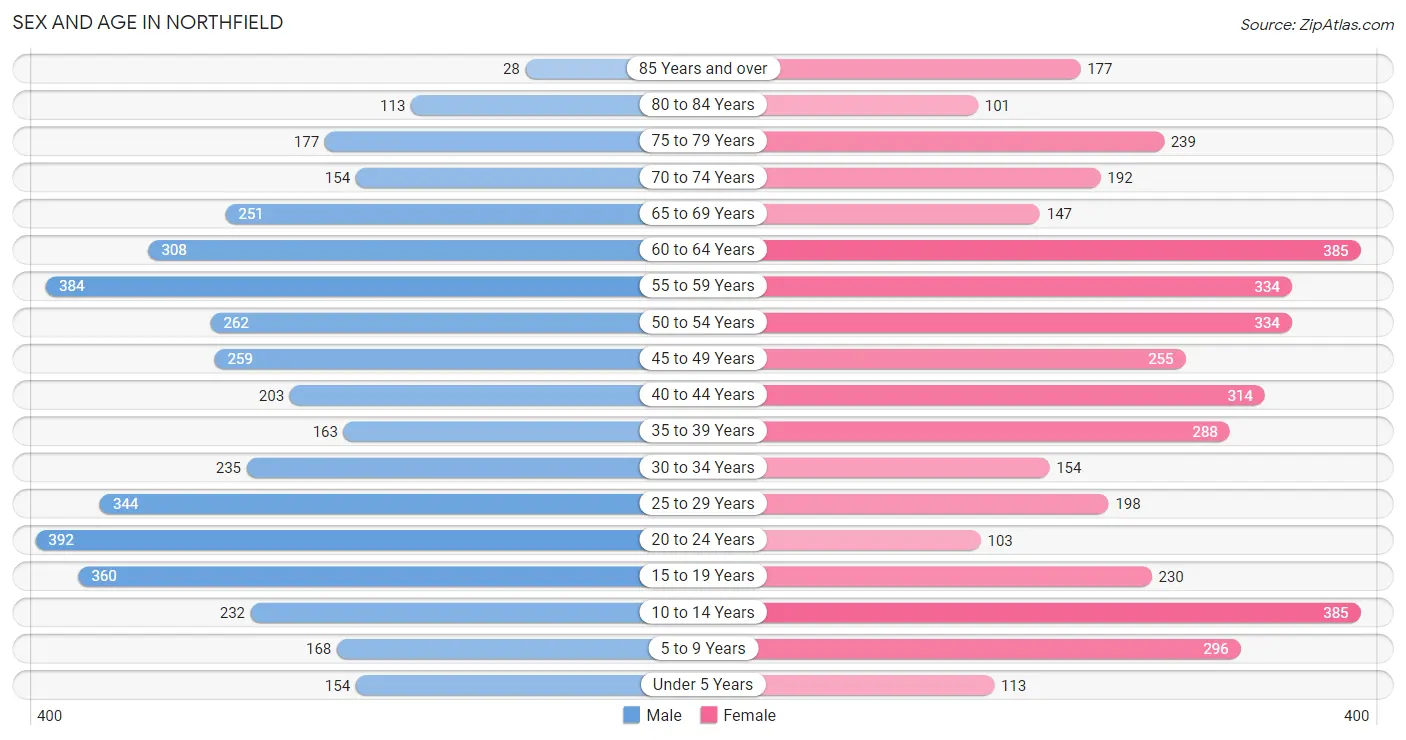
Sex and Age in Northfield
Sex and Age in Northfield
The most populous age groups in Northfield are 20 to 24 Years (392 | 9.4%) for men and 10 to 14 Years (385 | 9.1%) for women.
| Age Bracket | Male | Female |
| Under 5 Years | 154 (3.7%) | 113 (2.7%) |
| 5 to 9 Years | 168 (4.0%) | 296 (7.0%) |
| 10 to 14 Years | 232 (5.5%) | 385 (9.1%) |
| 15 to 19 Years | 360 (8.6%) | 230 (5.4%) |
| 20 to 24 Years | 392 (9.4%) | 103 (2.4%) |
| 25 to 29 Years | 344 (8.2%) | 198 (4.7%) |
| 30 to 34 Years | 235 (5.6%) | 154 (3.6%) |
| 35 to 39 Years | 163 (3.9%) | 288 (6.8%) |
| 40 to 44 Years | 203 (4.9%) | 314 (7.4%) |
| 45 to 49 Years | 259 (6.2%) | 255 (6.0%) |
| 50 to 54 Years | 262 (6.3%) | 334 (7.9%) |
| 55 to 59 Years | 384 (9.2%) | 334 (7.9%) |
| 60 to 64 Years | 308 (7.4%) | 385 (9.1%) |
| 65 to 69 Years | 251 (6.0%) | 147 (3.5%) |
| 70 to 74 Years | 154 (3.7%) | 192 (4.5%) |
| 75 to 79 Years | 177 (4.2%) | 239 (5.6%) |
| 80 to 84 Years | 113 (2.7%) | 101 (2.4%) |
| 85 Years and over | 28 (0.7%) | 177 (4.2%) |
| Total | 4,187 (100.0%) | 4,245 (100.0%) |
Families and Households in Northfield
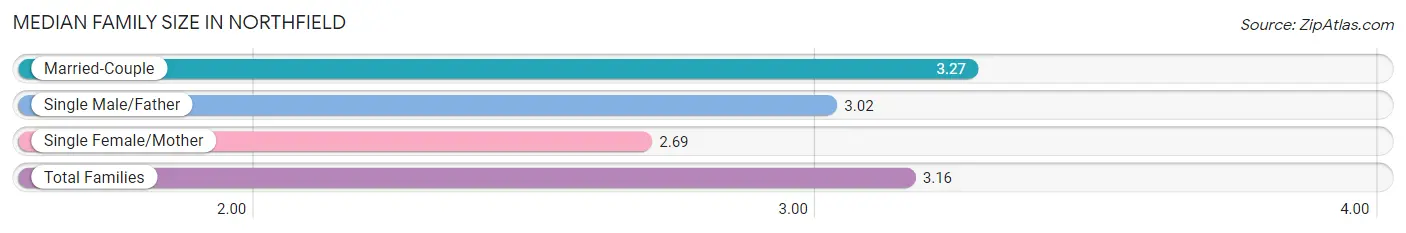
Median Family Size in Northfield
The median family size in Northfield is 3.16 persons per family, with married-couple families (1,732 | 77.8%) accounting for the largest median family size of 3.27 persons per family. On the other hand, single female/mother families (332 | 14.9%) represent the smallest median family size with 2.69 persons per family.
| Family Type | # Families | Family Size |
| Married-Couple | 1,732 (77.8%) | 3.27 |
| Single Male/Father | 163 (7.3%) | 3.02 |
| Single Female/Mother | 332 (14.9%) | 2.69 |
| Total Families | 2,227 (100.0%) | 3.16 |
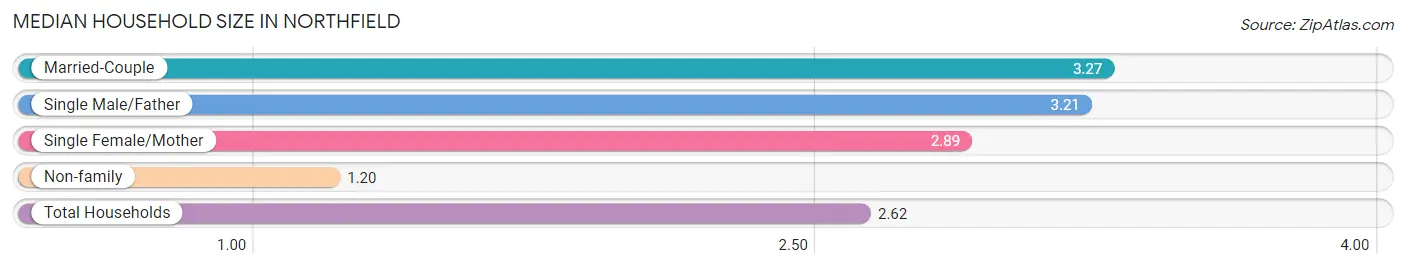
Median Household Size in Northfield
The median household size in Northfield is 2.62 persons per household, with married-couple households (1,732 | 54.8%) accounting for the largest median household size of 3.27 persons per household. non-family households (932 | 29.5%) represent the smallest median household size with 1.20 persons per household.
| Household Type | # Households | Household Size |
| Married-Couple | 1,732 (54.8%) | 3.27 |
| Single Male/Father | 163 (5.2%) | 3.21 |
| Single Female/Mother | 332 (10.5%) | 2.89 |
| Non-family | 932 (29.5%) | 1.20 |
| Total Households | 3,159 (100.0%) | 2.62 |
Household Size by Marriage Status in Northfield
Out of a total of 3,159 households in Northfield, 2,227 (70.5%) are family households, while 932 (29.5%) are nonfamily households. The most numerous type of family households are 2-person households, comprising 756, and the most common type of nonfamily households are 1-person households, comprising 737.
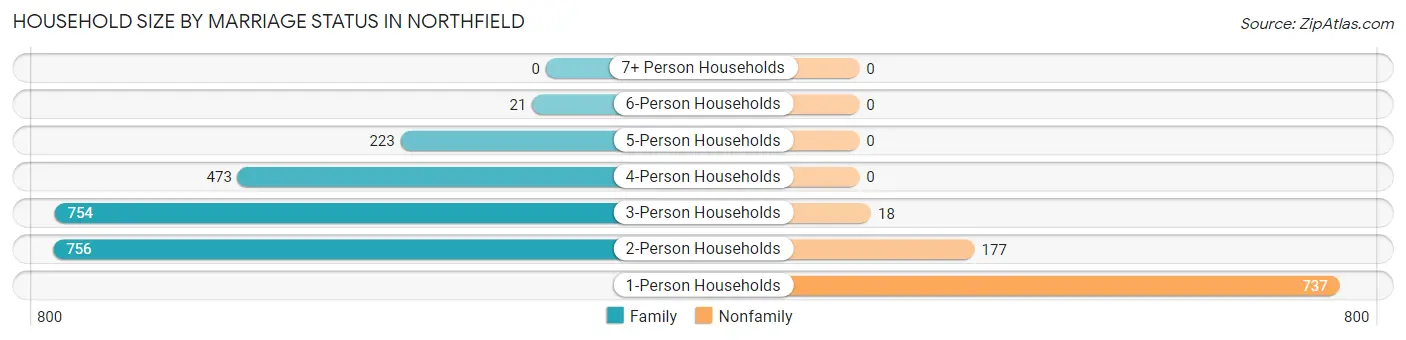
| Household Size | Family Households | Nonfamily Households |
| 1-Person Households | - | 737 (23.3%) |
| 2-Person Households | 756 (23.9%) | 177 (5.6%) |
| 3-Person Households | 754 (23.9%) | 18 (0.6%) |
| 4-Person Households | 473 (15.0%) | 0 (0.0%) |
| 5-Person Households | 223 (7.1%) | 0 (0.0%) |
| 6-Person Households | 21 (0.7%) | 0 (0.0%) |
| 7+ Person Households | 0 (0.0%) | 0 (0.0%) |
| Total | 2,227 (70.5%) | 932 (29.5%) |
Female Fertility in Northfield
Fertility by Age in Northfield
Average fertility rate in Northfield is 41.0 births per 1,000 women. Women in the age bracket of 20 to 34 years have the highest fertility rate with 123.0 births per 1,000 women. Women in the age bracket of 20 to 34 years acount for 87.5% of all women with births.
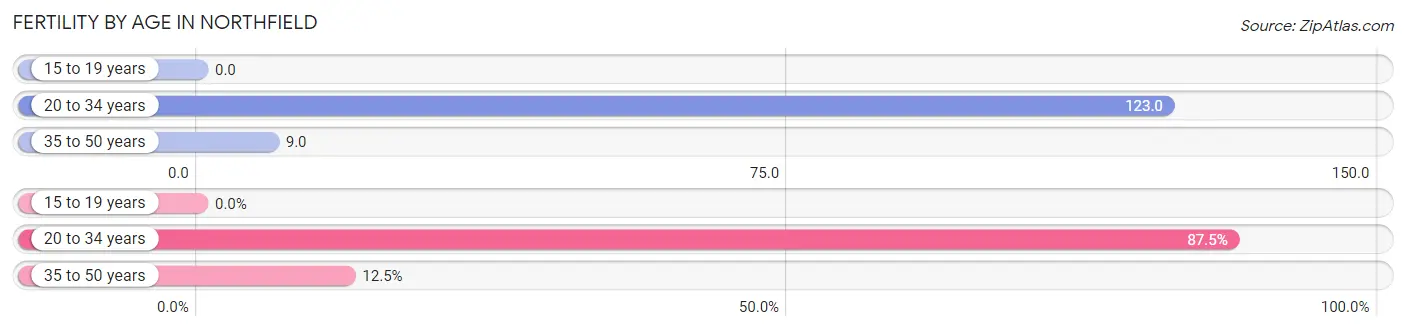
| Age Bracket | Women with Births | Births / 1,000 Women |
| 15 to 19 years | 0 (0.0%) | 0.0 |
| 20 to 34 years | 56 (87.5%) | 123.0 |
| 35 to 50 years | 8 (12.5%) | 9.0 |
| Total | 64 (100.0%) | 41.0 |
Fertility by Age by Marriage Status in Northfield
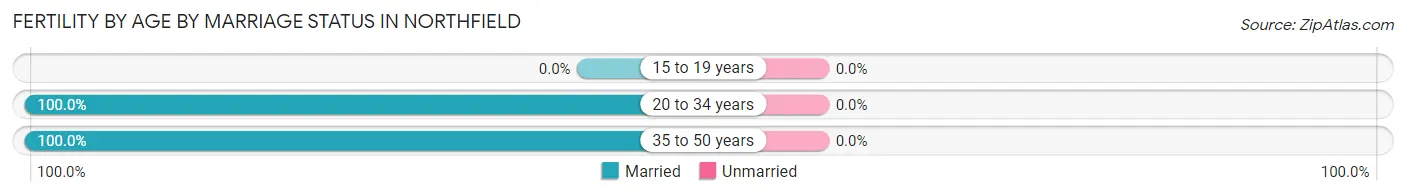
| Age Bracket | Married | Unmarried |
| 15 to 19 years | 0 (0.0%) | 0 (0.0%) |
| 20 to 34 years | 56 (100.0%) | 0 (0.0%) |
| 35 to 50 years | 8 (100.0%) | 0 (0.0%) |
| Total | 64 (100.0%) | 0 (0.0%) |
Fertility by Education in Northfield
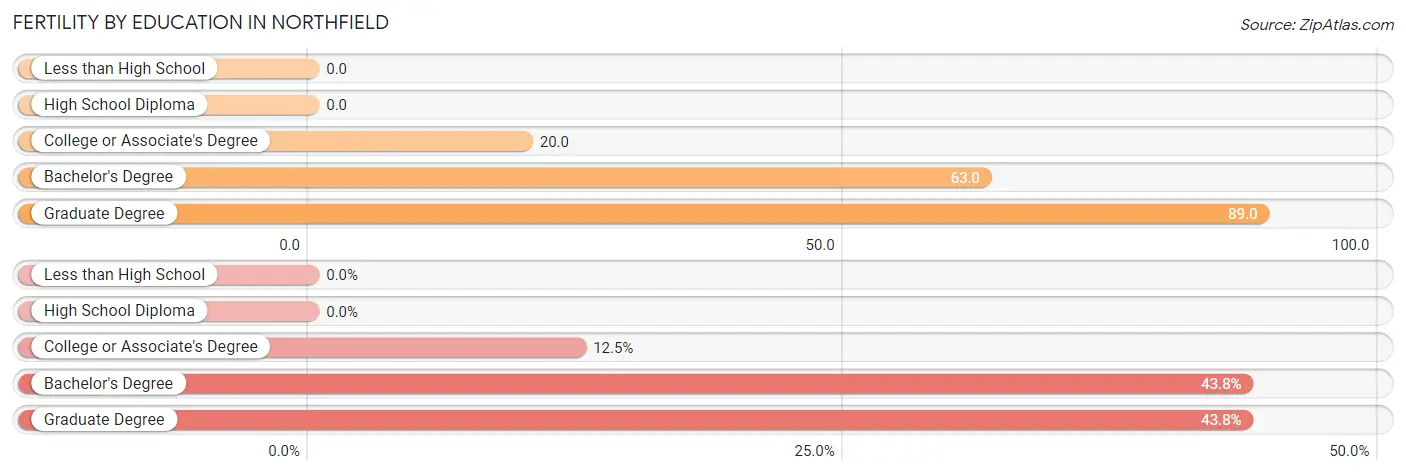
| Educational Attainment | Women with Births | Births / 1,000 Women |
| Less than High School | 0 (0.0%) | 0.0 |
| High School Diploma | 0 (0.0%) | 0.0 |
| College or Associate's Degree | 8 (12.5%) | 20.0 |
| Bachelor's Degree | 28 (43.8%) | 63.0 |
| Graduate Degree | 28 (43.8%) | 89.0 |
| Total | 64 (100.0%) | 41.0 |
Fertility by Education by Marriage Status in Northfield
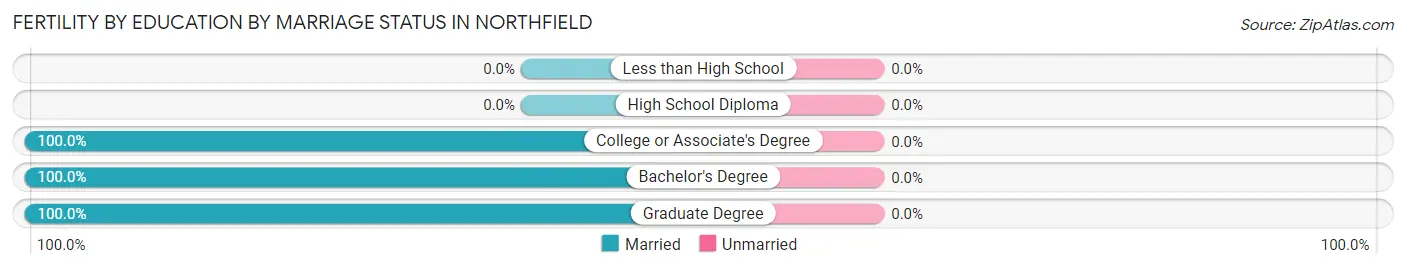
| Educational Attainment | Married | Unmarried |
| Less than High School | 0 (0.0%) | 0 (0.0%) |
| High School Diploma | 0 (0.0%) | 0 (0.0%) |
| College or Associate's Degree | 8 (100.0%) | 0 (0.0%) |
| Bachelor's Degree | 28 (100.0%) | 0 (0.0%) |
| Graduate Degree | 28 (100.0%) | 0 (0.0%) |
| Total | 64 (100.0%) | 0 (0.0%) |
Employment Characteristics in Northfield
Employment by Class of Employer in Northfield
Among the 4,166 employed individuals in Northfield, private company employees (2,754 | 66.1%), local government employees (697 | 16.7%), and not-for-profit organizations (288 | 6.9%) make up the most common classes of employment.
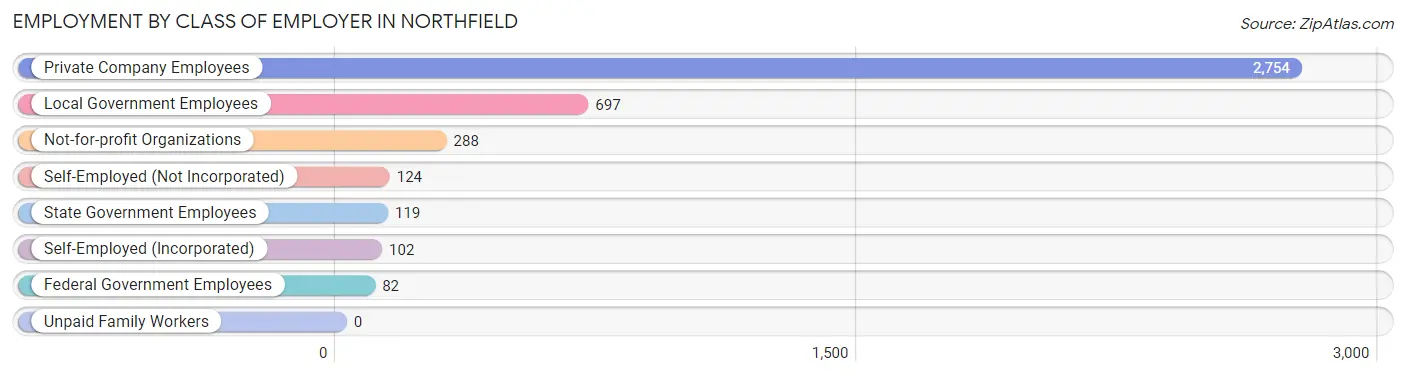
| Employer Class | # Employees | % Employees |
| Private Company Employees | 2,754 | 66.1% |
| Self-Employed (Incorporated) | 102 | 2.5% |
| Self-Employed (Not Incorporated) | 124 | 3.0% |
| Not-for-profit Organizations | 288 | 6.9% |
| Local Government Employees | 697 | 16.7% |
| State Government Employees | 119 | 2.9% |
| Federal Government Employees | 82 | 2.0% |
| Unpaid Family Workers | 0 | 0.0% |
| Total | 4,166 | 100.0% |
Employment Status by Age in Northfield
According to the labor force statistics for Northfield, out of the total population over 16 years of age (6,937), 65.1% or 4,516 individuals are in the labor force, with 5.8% or 262 of them unemployed. The age group with the highest labor force participation rate is 25 to 29 years, with 98.9% or 536 individuals in the labor force. Within the labor force, the 25 to 29 years age range has the highest percentage of unemployed individuals, with 14.7% or 79 of them being unemployed.
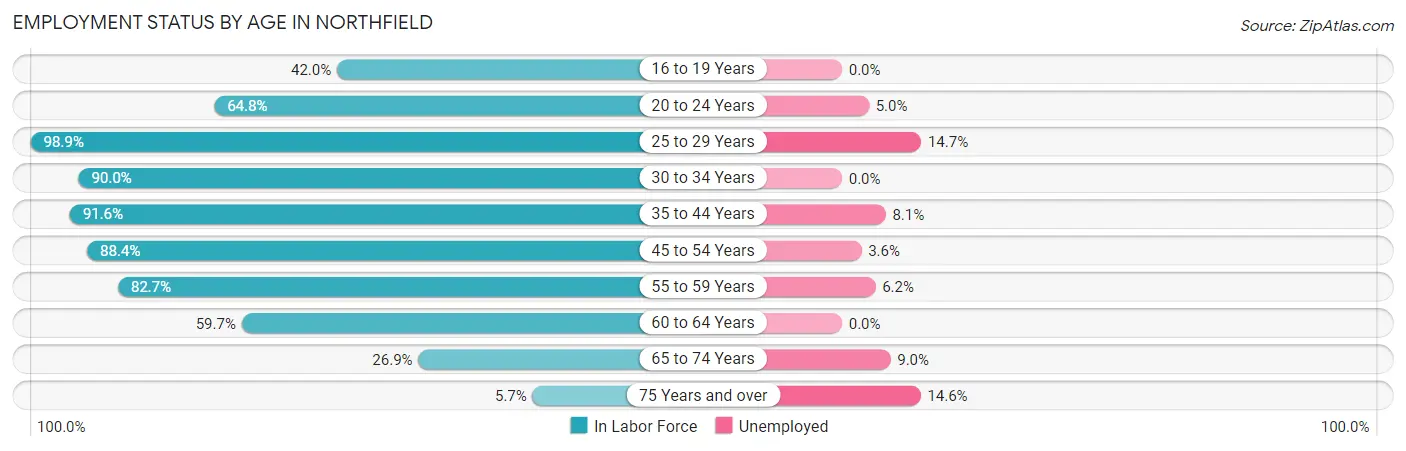
| Age Bracket | In Labor Force | Unemployed |
| 16 to 19 Years | 186 (42.0%) | 0 (0.0%) |
| 20 to 24 Years | 321 (64.8%) | 16 (5.0%) |
| 25 to 29 Years | 536 (98.9%) | 79 (14.7%) |
| 30 to 34 Years | 350 (90.0%) | 0 (0.0%) |
| 35 to 44 Years | 887 (91.6%) | 72 (8.1%) |
| 45 to 54 Years | 981 (88.4%) | 35 (3.6%) |
| 55 to 59 Years | 594 (82.7%) | 37 (6.2%) |
| 60 to 64 Years | 414 (59.7%) | 0 (0.0%) |
| 65 to 74 Years | 200 (26.9%) | 18 (9.0%) |
| 75 Years and over | 48 (5.7%) | 7 (14.6%) |
| Total | 4,516 (65.1%) | 262 (5.8%) |
Employment Status by Educational Attainment in Northfield
According to labor force statistics for Northfield, 85.1% of individuals (3,761) out of the total population between 25 and 64 years of age (4,420) are in the labor force, with 5.9% or 222 of them being unemployed. The group with the highest labor force participation rate are those with the educational attainment of bachelor's degree or higher, with 91.8% or 2,035 individuals in the labor force. Within the labor force, individuals with college / associate degree education have the highest percentage of unemployment, with 11.3% or 115 of them being unemployed.
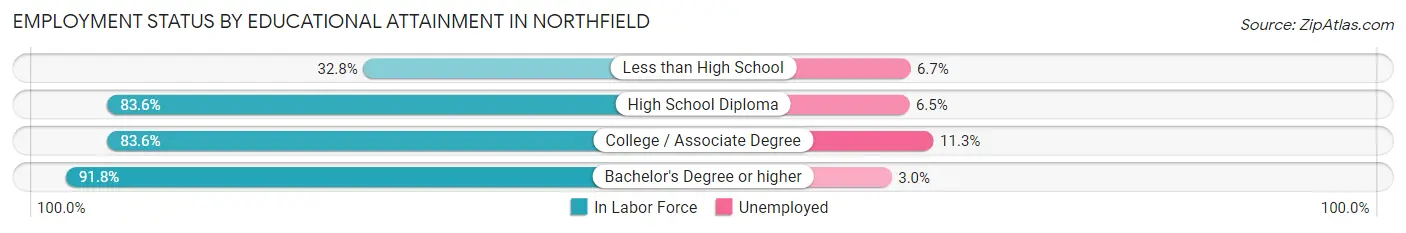
| Educational Attainment | In Labor Force | Unemployed |
| Less than High School | 75 (32.8%) | 15 (6.7%) |
| High School Diploma | 628 (83.6%) | 49 (6.5%) |
| College / Associate Degree | 1,022 (83.6%) | 138 (11.3%) |
| Bachelor's Degree or higher | 2,035 (91.8%) | 67 (3.0%) |
| Total | 3,761 (85.1%) | 261 (5.9%) |
Employment Occupations by Sex in Northfield
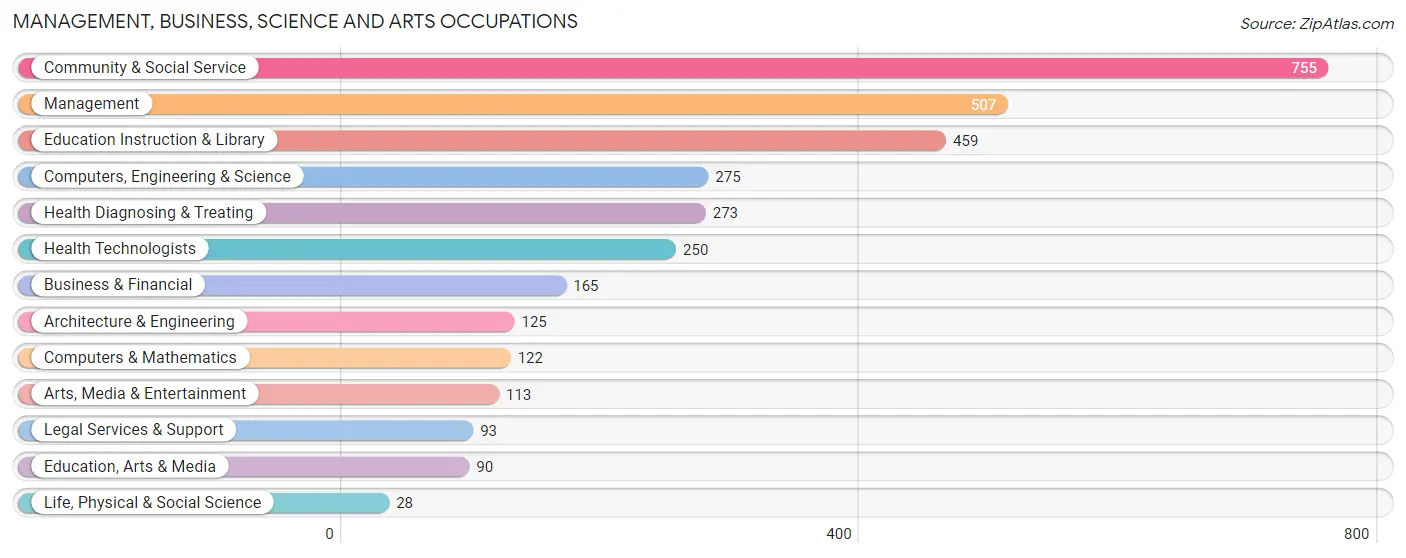
Management, Business, Science and Arts Occupations
The most common Management, Business, Science and Arts occupations in Northfield are Community & Social Service (755 | 17.8%), Management (507 | 11.9%), Education Instruction & Library (459 | 10.8%), Computers, Engineering & Science (275 | 6.5%), and Health Diagnosing & Treating (273 | 6.4%).
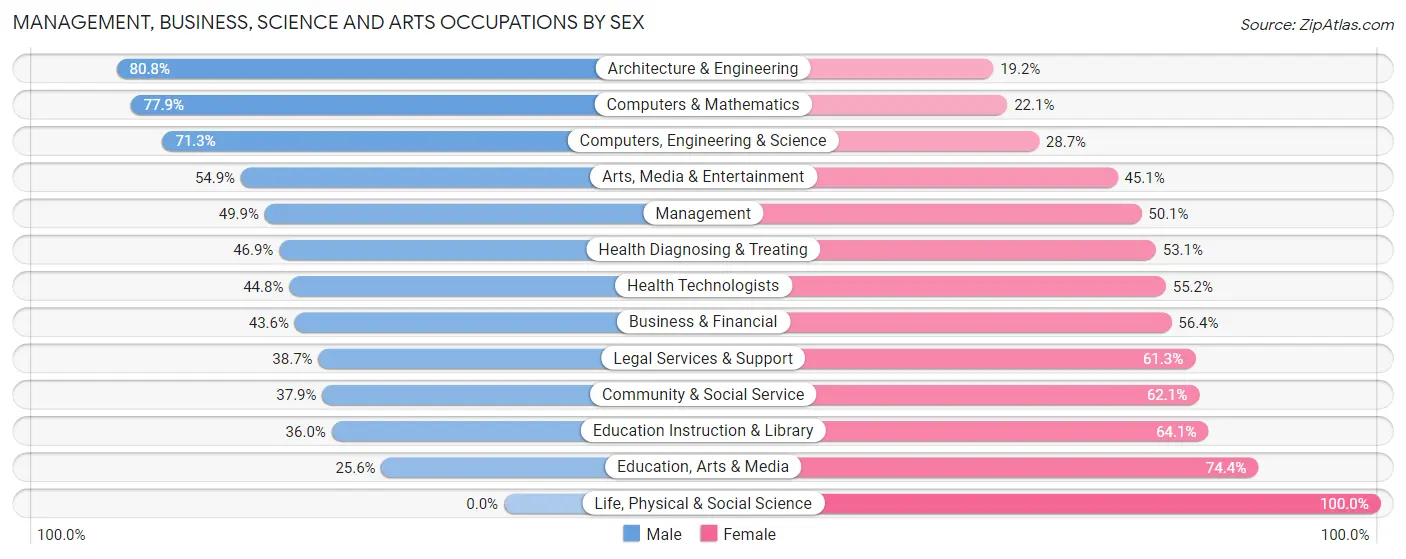
Management, Business, Science and Arts Occupations by Sex
Within the Management, Business, Science and Arts occupations in Northfield, the most male-oriented occupations are Architecture & Engineering (80.8%), Computers & Mathematics (77.9%), and Computers, Engineering & Science (71.3%), while the most female-oriented occupations are Life, Physical & Social Science (100.0%), Education, Arts & Media (74.4%), and Education Instruction & Library (64.0%).
| Occupation | Male | Female |
| Management | 253 (49.9%) | 254 (50.1%) |
| Business & Financial | 72 (43.6%) | 93 (56.4%) |
| Computers, Engineering & Science | 196 (71.3%) | 79 (28.7%) |
| Computers & Mathematics | 95 (77.9%) | 27 (22.1%) |
| Architecture & Engineering | 101 (80.8%) | 24 (19.2%) |
| Life, Physical & Social Science | 0 (0.0%) | 28 (100.0%) |
| Community & Social Service | 286 (37.9%) | 469 (62.1%) |
| Education, Arts & Media | 23 (25.6%) | 67 (74.4%) |
| Legal Services & Support | 36 (38.7%) | 57 (61.3%) |
| Education Instruction & Library | 165 (35.9%) | 294 (64.0%) |
| Arts, Media & Entertainment | 62 (54.9%) | 51 (45.1%) |
| Health Diagnosing & Treating | 128 (46.9%) | 145 (53.1%) |
| Health Technologists | 112 (44.8%) | 138 (55.2%) |
| Total (Category) | 935 (47.3%) | 1,040 (52.7%) |
| Total (Overall) | 2,247 (53.0%) | 1,995 (47.0%) |
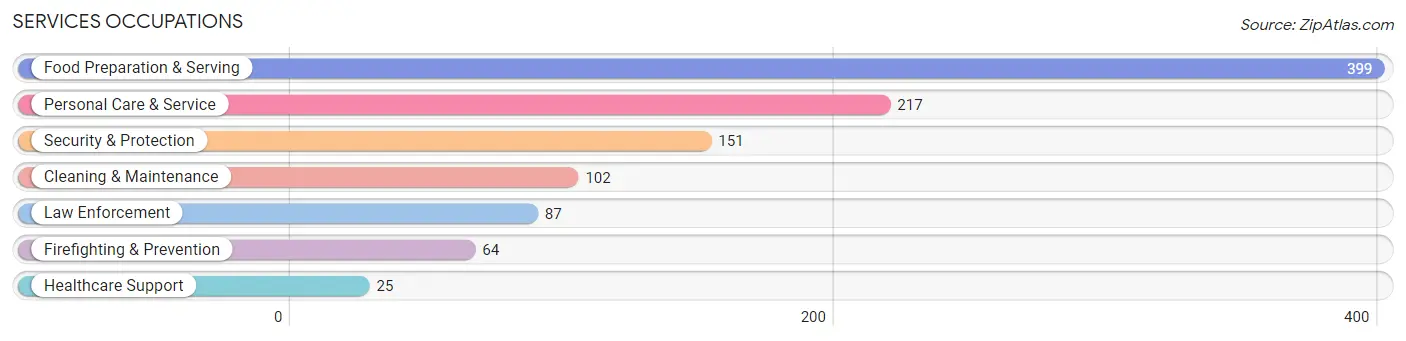
Services Occupations
The most common Services occupations in Northfield are Food Preparation & Serving (399 | 9.4%), Personal Care & Service (217 | 5.1%), Security & Protection (151 | 3.6%), Cleaning & Maintenance (102 | 2.4%), and Law Enforcement (87 | 2.1%).
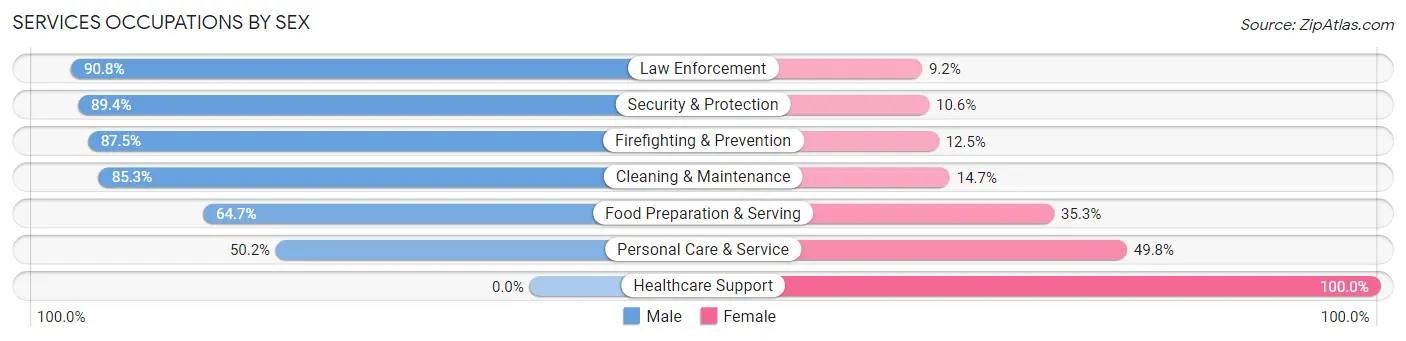
Services Occupations by Sex
Within the Services occupations in Northfield, the most male-oriented occupations are Law Enforcement (90.8%), Security & Protection (89.4%), and Firefighting & Prevention (87.5%), while the most female-oriented occupations are Healthcare Support (100.0%), Personal Care & Service (49.8%), and Food Preparation & Serving (35.3%).
| Occupation | Male | Female |
| Healthcare Support | 0 (0.0%) | 25 (100.0%) |
| Security & Protection | 135 (89.4%) | 16 (10.6%) |
| Firefighting & Prevention | 56 (87.5%) | 8 (12.5%) |
| Law Enforcement | 79 (90.8%) | 8 (9.2%) |
| Food Preparation & Serving | 258 (64.7%) | 141 (35.3%) |
| Cleaning & Maintenance | 87 (85.3%) | 15 (14.7%) |
| Personal Care & Service | 109 (50.2%) | 108 (49.8%) |
| Total (Category) | 589 (65.9%) | 305 (34.1%) |
| Total (Overall) | 2,247 (53.0%) | 1,995 (47.0%) |
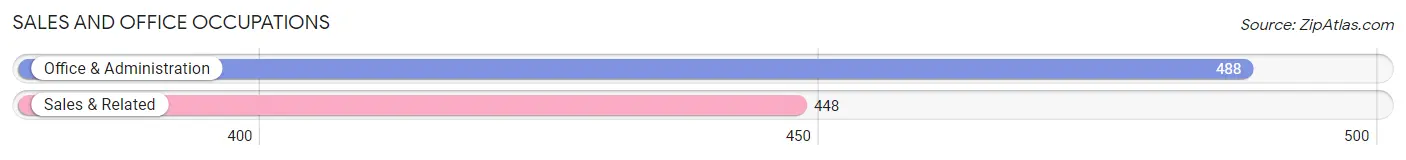
Sales and Office Occupations
The most common Sales and Office occupations in Northfield are Office & Administration (488 | 11.5%), and Sales & Related (448 | 10.6%).
Sales and Office Occupations by Sex
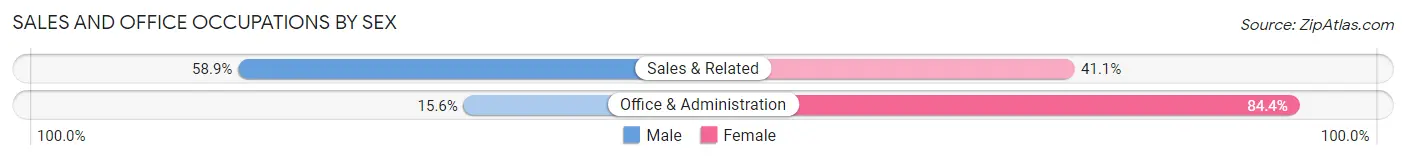
| Occupation | Male | Female |
| Sales & Related | 264 (58.9%) | 184 (41.1%) |
| Office & Administration | 76 (15.6%) | 412 (84.4%) |
| Total (Category) | 340 (36.3%) | 596 (63.7%) |
| Total (Overall) | 2,247 (53.0%) | 1,995 (47.0%) |
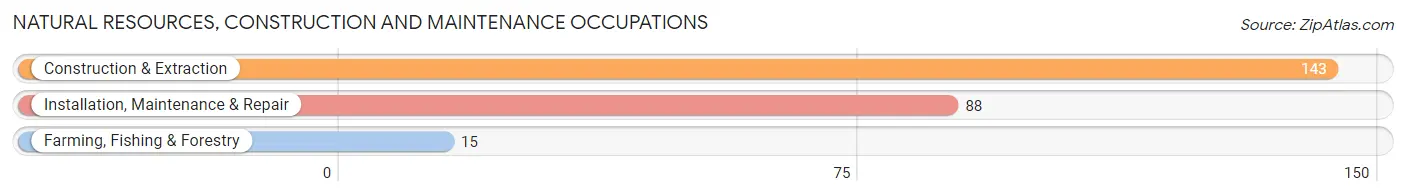
Natural Resources, Construction and Maintenance Occupations
The most common Natural Resources, Construction and Maintenance occupations in Northfield are Construction & Extraction (143 | 3.4%), Installation, Maintenance & Repair (88 | 2.1%), and Farming, Fishing & Forestry (15 | 0.4%).
Natural Resources, Construction and Maintenance Occupations by Sex
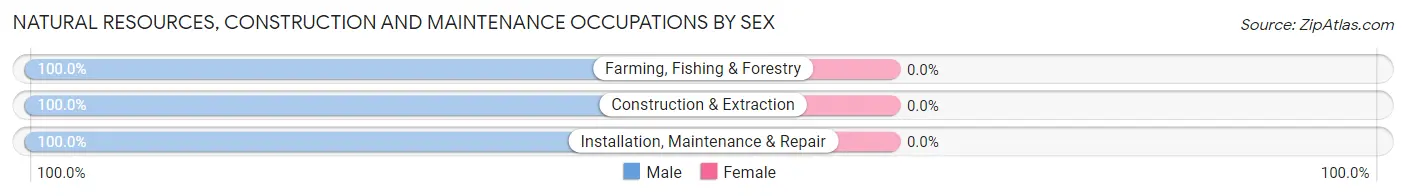
| Occupation | Male | Female |
| Farming, Fishing & Forestry | 15 (100.0%) | 0 (0.0%) |
| Construction & Extraction | 143 (100.0%) | 0 (0.0%) |
| Installation, Maintenance & Repair | 88 (100.0%) | 0 (0.0%) |
| Total (Category) | 246 (100.0%) | 0 (0.0%) |
| Total (Overall) | 2,247 (53.0%) | 1,995 (47.0%) |
Production, Transportation and Moving Occupations
The most common Production, Transportation and Moving occupations in Northfield are Transportation (70 | 1.7%), Material Moving (62 | 1.5%), and Production (59 | 1.4%).
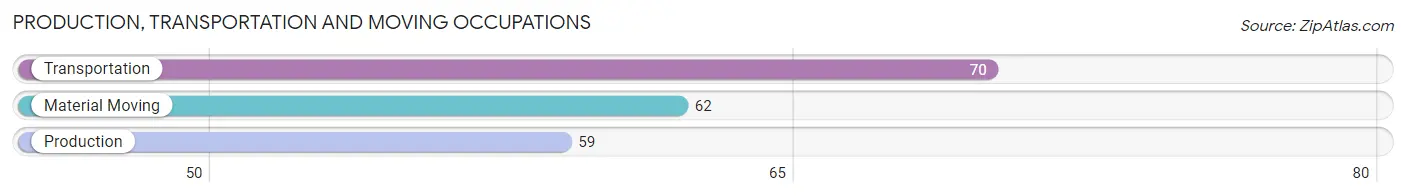
Production, Transportation and Moving Occupations by Sex
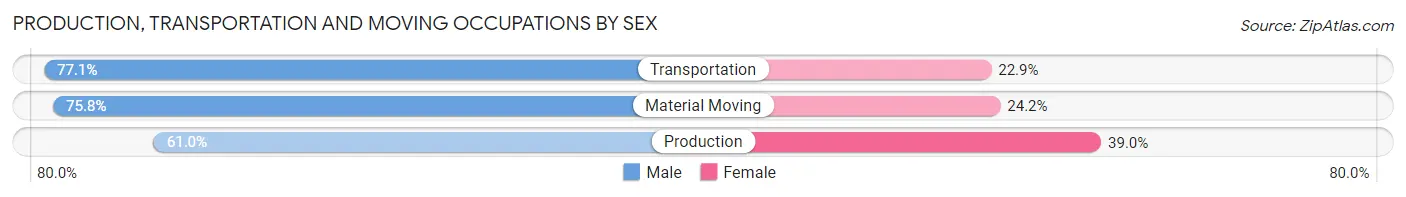
| Occupation | Male | Female |
| Production | 36 (61.0%) | 23 (39.0%) |
| Transportation | 54 (77.1%) | 16 (22.9%) |
| Material Moving | 47 (75.8%) | 15 (24.2%) |
| Total (Category) | 137 (71.7%) | 54 (28.3%) |
| Total (Overall) | 2,247 (53.0%) | 1,995 (47.0%) |
Employment Industries by Sex in Northfield
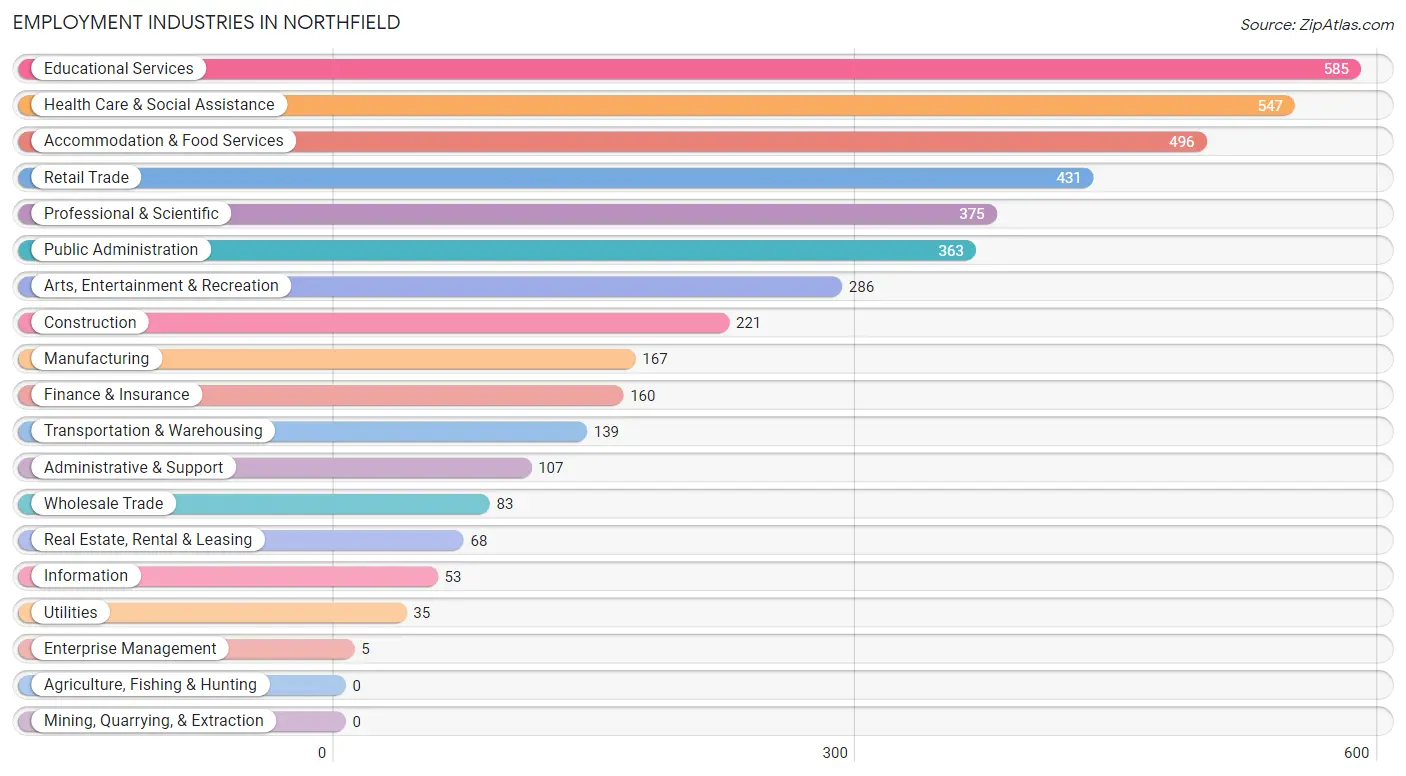
Employment Industries in Northfield
The major employment industries in Northfield include Educational Services (585 | 13.8%), Health Care & Social Assistance (547 | 12.9%), Accommodation & Food Services (496 | 11.7%), Retail Trade (431 | 10.2%), and Professional & Scientific (375 | 8.8%).
Employment Industries by Sex in Northfield
The Northfield industries that see more men than women are Wholesale Trade (100.0%), Utilities (100.0%), and Information (79.2%), whereas the industries that tend to have a higher number of women are Enterprise Management (100.0%), Health Care & Social Assistance (70.6%), and Educational Services (64.1%).

| Industry | Male | Female |
| Agriculture, Fishing & Hunting | 0 (0.0%) | 0 (0.0%) |
| Mining, Quarrying, & Extraction | 0 (0.0%) | 0 (0.0%) |
| Construction | 166 (75.1%) | 55 (24.9%) |
| Manufacturing | 126 (75.4%) | 41 (24.5%) |
| Wholesale Trade | 83 (100.0%) | 0 (0.0%) |
| Retail Trade | 195 (45.2%) | 236 (54.8%) |
| Transportation & Warehousing | 87 (62.6%) | 52 (37.4%) |
| Utilities | 35 (100.0%) | 0 (0.0%) |
| Information | 42 (79.2%) | 11 (20.7%) |
| Finance & Insurance | 62 (38.8%) | 98 (61.3%) |
| Real Estate, Rental & Leasing | 46 (67.6%) | 22 (32.4%) |
| Professional & Scientific | 197 (52.5%) | 178 (47.5%) |
| Enterprise Management | 0 (0.0%) | 5 (100.0%) |
| Administrative & Support | 64 (59.8%) | 43 (40.2%) |
| Educational Services | 210 (35.9%) | 375 (64.1%) |
| Health Care & Social Assistance | 161 (29.4%) | 386 (70.6%) |
| Arts, Entertainment & Recreation | 134 (46.9%) | 152 (53.1%) |
| Accommodation & Food Services | 343 (69.2%) | 153 (30.8%) |
| Public Administration | 193 (53.2%) | 170 (46.8%) |
| Total | 2,247 (53.0%) | 1,995 (47.0%) |
Education in Northfield
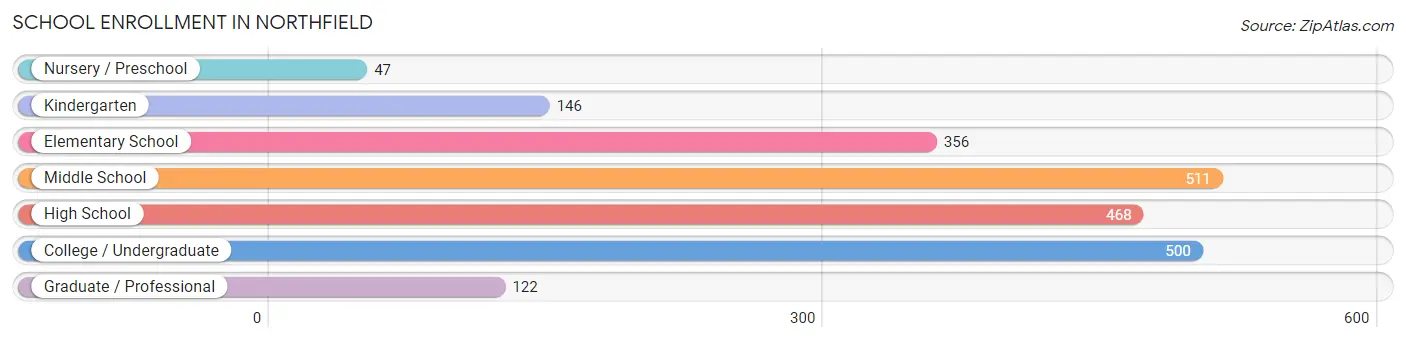
School Enrollment in Northfield
The most common levels of schooling among the 2,150 students in Northfield are middle school (511 | 23.8%), college / undergraduate (500 | 23.3%), and high school (468 | 21.8%).
| School Level | # Students | % Students |
| Nursery / Preschool | 47 | 2.2% |
| Kindergarten | 146 | 6.8% |
| Elementary School | 356 | 16.6% |
| Middle School | 511 | 23.8% |
| High School | 468 | 21.8% |
| College / Undergraduate | 500 | 23.3% |
| Graduate / Professional | 122 | 5.7% |
| Total | 2,150 | 100.0% |
School Enrollment by Age by Funding Source in Northfield
Out of a total of 2,150 students who are enrolled in schools in Northfield, 142 (6.6%) attend a private institution, while the remaining 2,008 (93.4%) are enrolled in public schools. The age group of 3 to 4 year olds has the highest likelihood of being enrolled in private schools, with 19 (100.0% in the age bracket) enrolled. Conversely, the age group of 10 to 14 year olds has the lowest likelihood of being enrolled in a private school, with 606 (99.0% in the age bracket) attending a public institution.
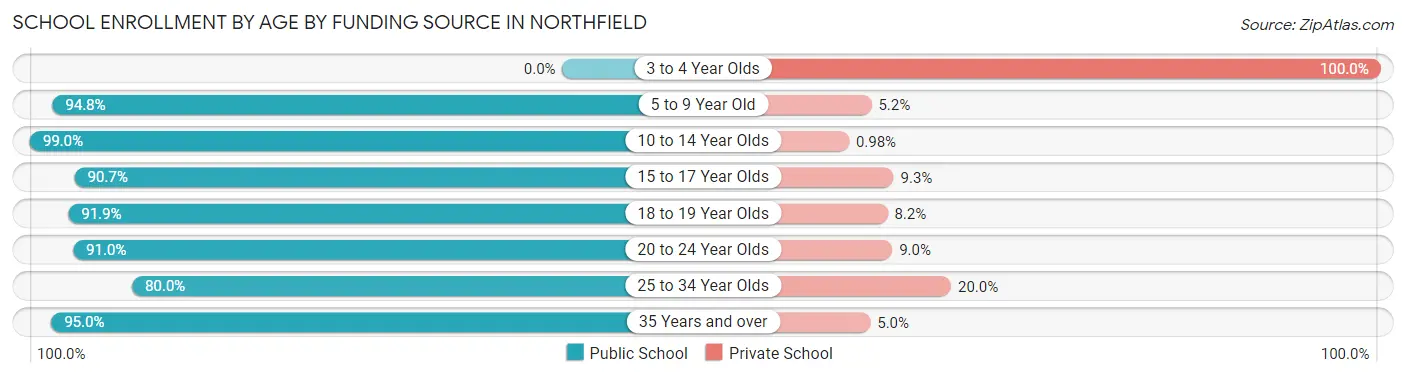
| Age Bracket | Public School | Private School |
| 3 to 4 Year Olds | 0 (0.0%) | 19 (100.0%) |
| 5 to 9 Year Old | 421 (94.8%) | 23 (5.2%) |
| 10 to 14 Year Olds | 606 (99.0%) | 6 (1.0%) |
| 15 to 17 Year Olds | 361 (90.7%) | 37 (9.3%) |
| 18 to 19 Year Olds | 124 (91.8%) | 11 (8.2%) |
| 20 to 24 Year Olds | 342 (91.0%) | 34 (9.0%) |
| 25 to 34 Year Olds | 20 (80.0%) | 5 (20.0%) |
| 35 Years and over | 134 (95.0%) | 7 (5.0%) |
| Total | 2,008 (93.4%) | 142 (6.6%) |
Educational Attainment by Field of Study in Northfield
Business (696 | 24.2%), education (456 | 15.9%), psychology (258 | 9.0%), liberal arts & history (185 | 6.4%), and literature & languages (179 | 6.2%) are the most common fields of study among 2,876 individuals in Northfield who have obtained a bachelor's degree or higher.
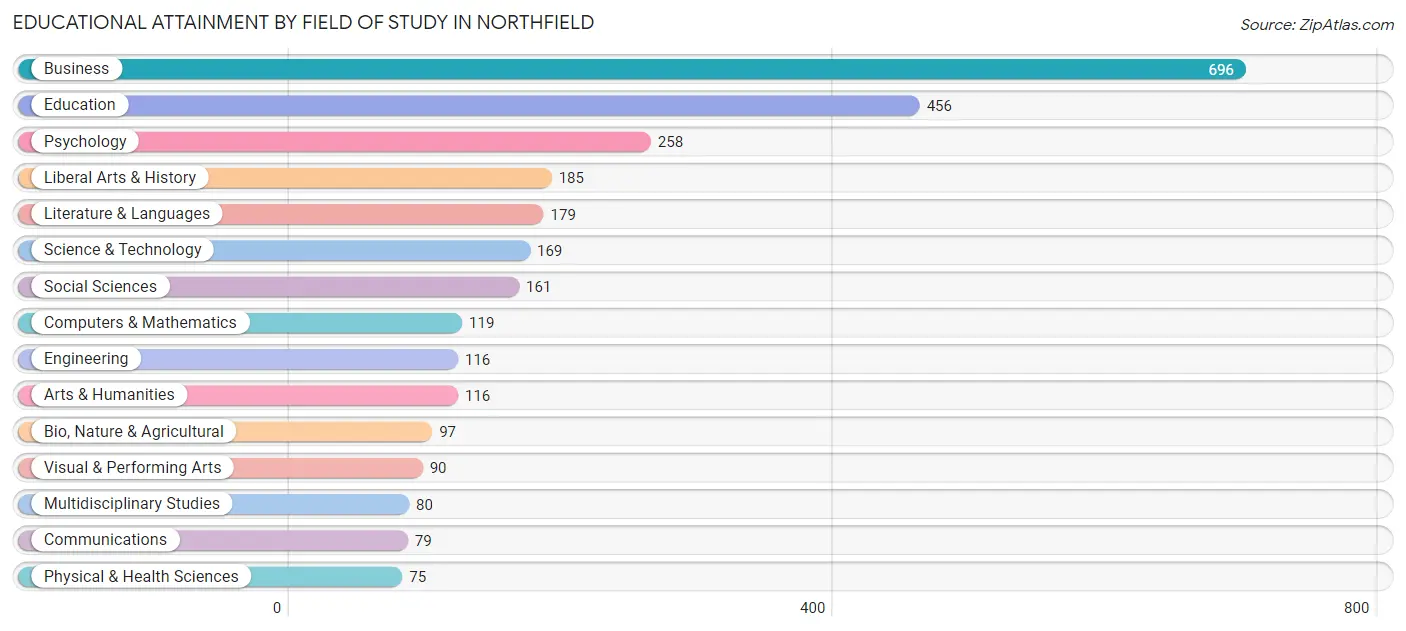
| Field of Study | # Graduates | % Graduates |
| Computers & Mathematics | 119 | 4.1% |
| Bio, Nature & Agricultural | 97 | 3.4% |
| Physical & Health Sciences | 75 | 2.6% |
| Psychology | 258 | 9.0% |
| Social Sciences | 161 | 5.6% |
| Engineering | 116 | 4.0% |
| Multidisciplinary Studies | 80 | 2.8% |
| Science & Technology | 169 | 5.9% |
| Business | 696 | 24.2% |
| Education | 456 | 15.9% |
| Literature & Languages | 179 | 6.2% |
| Liberal Arts & History | 185 | 6.4% |
| Visual & Performing Arts | 90 | 3.1% |
| Communications | 79 | 2.8% |
| Arts & Humanities | 116 | 4.0% |
| Total | 2,876 | 100.0% |
Transportation & Commute in Northfield
Vehicle Availability by Sex in Northfield
The most prevalent vehicle ownership categories in Northfield are males with 2 vehicles (895, accounting for 40.6%) and females with 2 vehicles (736, making up 45.6%).
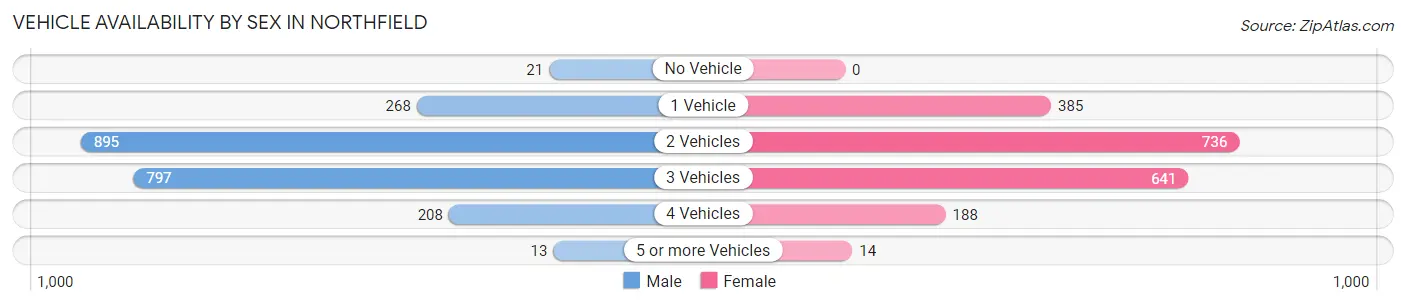
| Vehicles Available | Male | Female |
| No Vehicle | 21 (0.9%) | 0 (0.0%) |
| 1 Vehicle | 268 (12.2%) | 385 (19.6%) |
| 2 Vehicles | 895 (40.6%) | 736 (37.5%) |
| 3 Vehicles | 797 (36.2%) | 641 (32.6%) |
| 4 Vehicles | 208 (9.5%) | 188 (9.6%) |
| 5 or more Vehicles | 13 (0.6%) | 14 (0.7%) |
| Total | 2,202 (100.0%) | 1,964 (100.0%) |
Commute Time in Northfield
The most frequently occuring commute durations in Northfield are 20 to 24 minutes (889 commuters, 22.9%), 15 to 19 minutes (816 commuters, 21.0%), and 10 to 14 minutes (503 commuters, 13.0%).
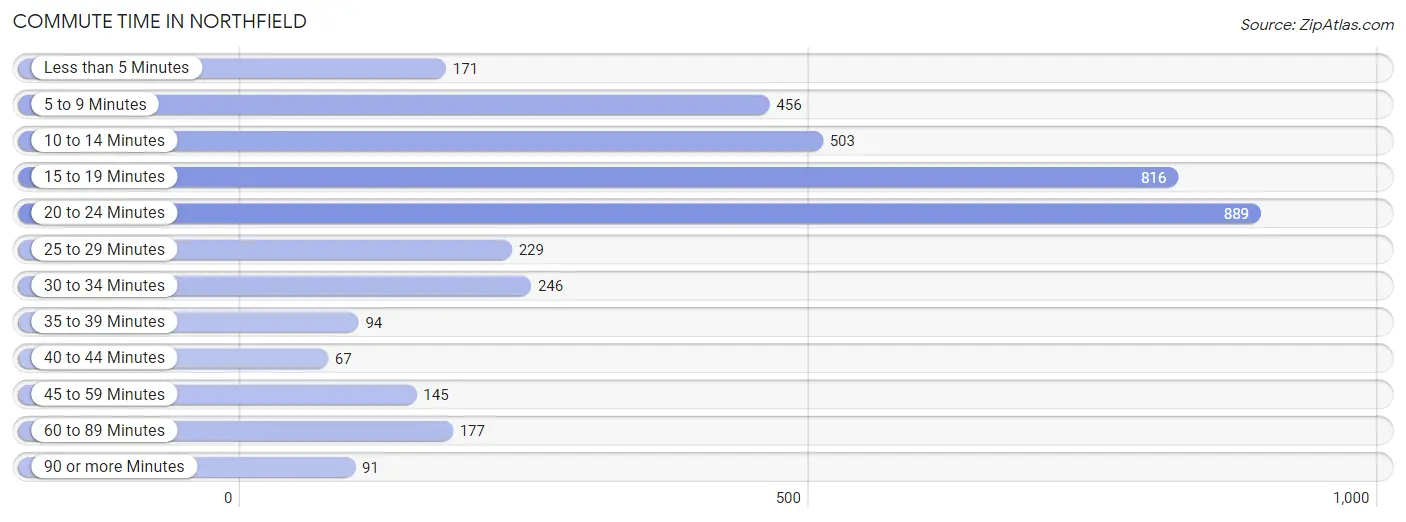
| Commute Time | # Commuters | % Commuters |
| Less than 5 Minutes | 171 | 4.4% |
| 5 to 9 Minutes | 456 | 11.7% |
| 10 to 14 Minutes | 503 | 13.0% |
| 15 to 19 Minutes | 816 | 21.0% |
| 20 to 24 Minutes | 889 | 22.9% |
| 25 to 29 Minutes | 229 | 5.9% |
| 30 to 34 Minutes | 246 | 6.3% |
| 35 to 39 Minutes | 94 | 2.4% |
| 40 to 44 Minutes | 67 | 1.7% |
| 45 to 59 Minutes | 145 | 3.7% |
| 60 to 89 Minutes | 177 | 4.6% |
| 90 or more Minutes | 91 | 2.3% |
Commute Time by Sex in Northfield
The most common commute times in Northfield are 15 to 19 minutes (490 commuters, 23.7%) for males and 20 to 24 minutes (492 commuters, 27.1%) for females.
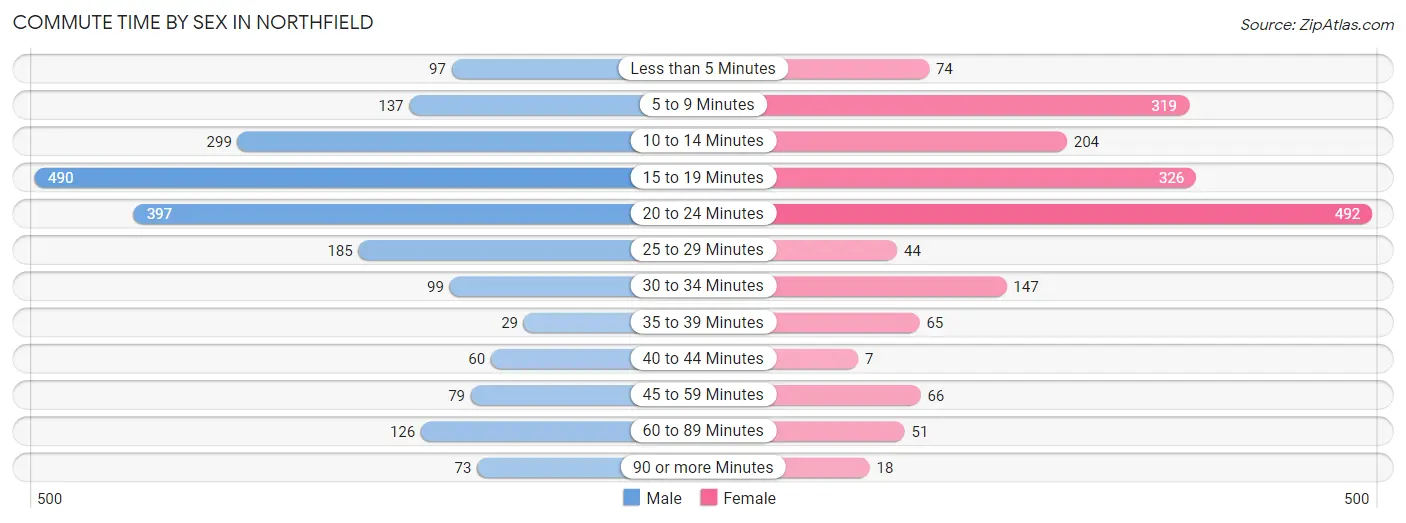
| Commute Time | Male | Female |
| Less than 5 Minutes | 97 (4.7%) | 74 (4.1%) |
| 5 to 9 Minutes | 137 (6.6%) | 319 (17.6%) |
| 10 to 14 Minutes | 299 (14.4%) | 204 (11.3%) |
| 15 to 19 Minutes | 490 (23.7%) | 326 (18.0%) |
| 20 to 24 Minutes | 397 (19.2%) | 492 (27.1%) |
| 25 to 29 Minutes | 185 (8.9%) | 44 (2.4%) |
| 30 to 34 Minutes | 99 (4.8%) | 147 (8.1%) |
| 35 to 39 Minutes | 29 (1.4%) | 65 (3.6%) |
| 40 to 44 Minutes | 60 (2.9%) | 7 (0.4%) |
| 45 to 59 Minutes | 79 (3.8%) | 66 (3.6%) |
| 60 to 89 Minutes | 126 (6.1%) | 51 (2.8%) |
| 90 or more Minutes | 73 (3.5%) | 18 (1.0%) |
Time of Departure to Work by Sex in Northfield
The most frequent times of departure to work in Northfield are 7:00 AM to 7:29 AM (351, 17.0%) for males and 7:30 AM to 7:59 AM (357, 19.7%) for females.
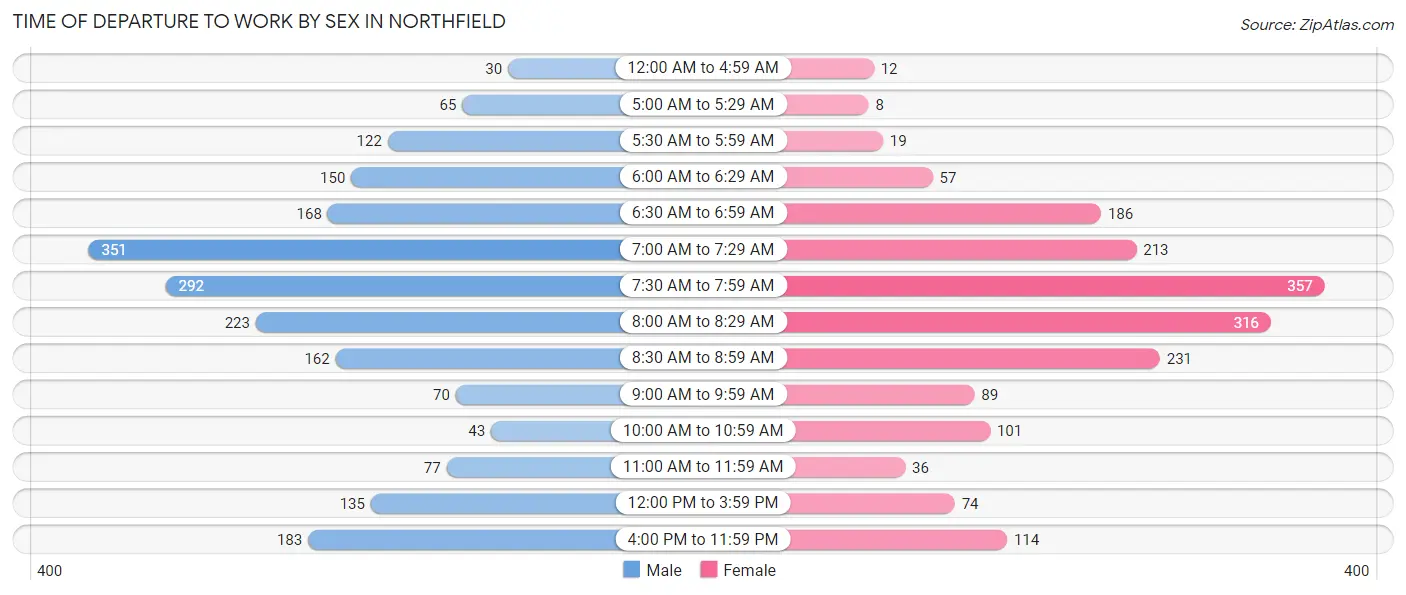
| Time of Departure | Male | Female |
| 12:00 AM to 4:59 AM | 30 (1.5%) | 12 (0.7%) |
| 5:00 AM to 5:29 AM | 65 (3.1%) | 8 (0.4%) |
| 5:30 AM to 5:59 AM | 122 (5.9%) | 19 (1.1%) |
| 6:00 AM to 6:29 AM | 150 (7.2%) | 57 (3.1%) |
| 6:30 AM to 6:59 AM | 168 (8.1%) | 186 (10.3%) |
| 7:00 AM to 7:29 AM | 351 (17.0%) | 213 (11.7%) |
| 7:30 AM to 7:59 AM | 292 (14.1%) | 357 (19.7%) |
| 8:00 AM to 8:29 AM | 223 (10.8%) | 316 (17.4%) |
| 8:30 AM to 8:59 AM | 162 (7.8%) | 231 (12.7%) |
| 9:00 AM to 9:59 AM | 70 (3.4%) | 89 (4.9%) |
| 10:00 AM to 10:59 AM | 43 (2.1%) | 101 (5.6%) |
| 11:00 AM to 11:59 AM | 77 (3.7%) | 36 (2.0%) |
| 12:00 PM to 3:59 PM | 135 (6.5%) | 74 (4.1%) |
| 4:00 PM to 11:59 PM | 183 (8.8%) | 114 (6.3%) |
| Total | 2,071 (100.0%) | 1,813 (100.0%) |
Housing Occupancy in Northfield
Occupancy by Ownership in Northfield
Of the total 3,159 dwellings in Northfield, owner-occupied units account for 2,783 (88.1%), while renter-occupied units make up 376 (11.9%).
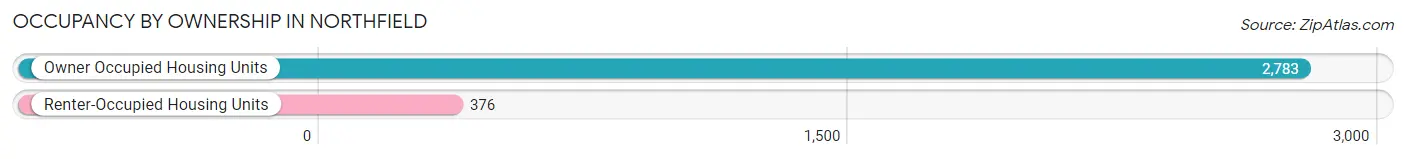
| Occupancy | # Housing Units | % Housing Units |
| Owner Occupied Housing Units | 2,783 | 88.1% |
| Renter-Occupied Housing Units | 376 | 11.9% |
| Total Occupied Housing Units | 3,159 | 100.0% |
Occupancy by Household Size in Northfield
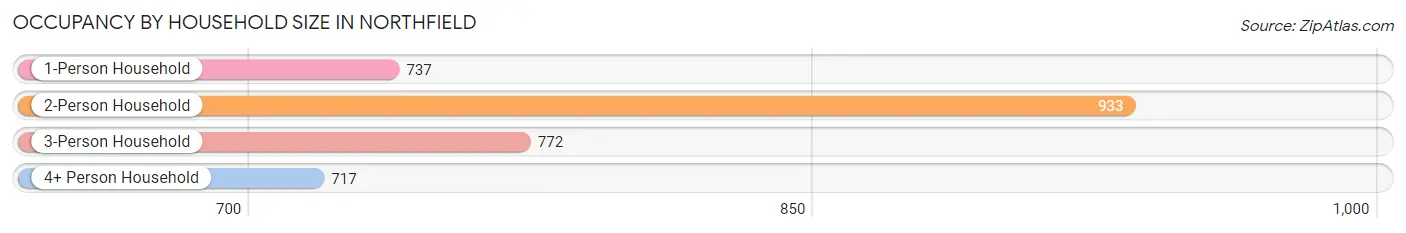
| Household Size | # Housing Units | % Housing Units |
| 1-Person Household | 737 | 23.3% |
| 2-Person Household | 933 | 29.5% |
| 3-Person Household | 772 | 24.4% |
| 4+ Person Household | 717 | 22.7% |
| Total Housing Units | 3,159 | 100.0% |
Occupancy by Ownership by Household Size in Northfield
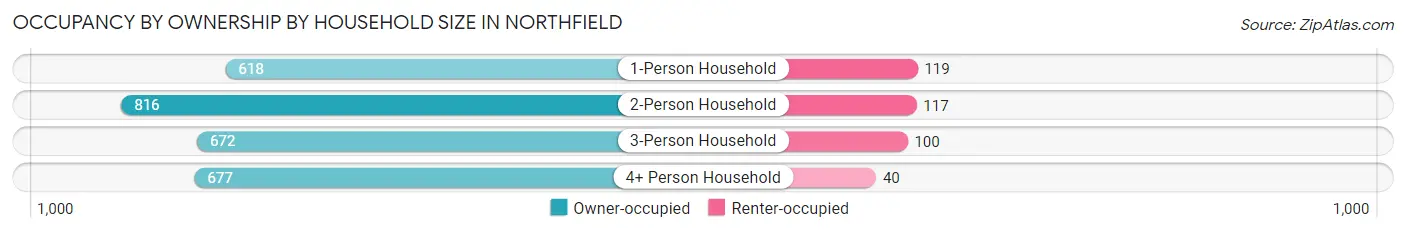
| Household Size | Owner-occupied | Renter-occupied |
| 1-Person Household | 618 (83.9%) | 119 (16.2%) |
| 2-Person Household | 816 (87.5%) | 117 (12.5%) |
| 3-Person Household | 672 (87.1%) | 100 (13.0%) |
| 4+ Person Household | 677 (94.4%) | 40 (5.6%) |
| Total Housing Units | 2,783 (88.1%) | 376 (11.9%) |
Occupancy by Educational Attainment in Northfield
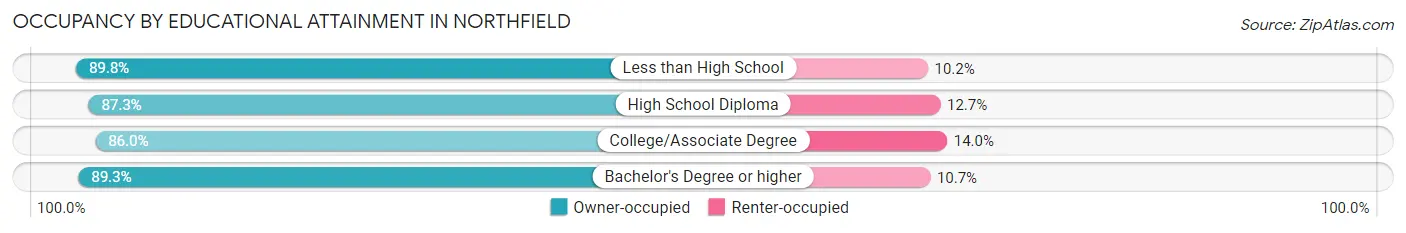
| Household Size | Owner-occupied | Renter-occupied |
| Less than High School | 141 (89.8%) | 16 (10.2%) |
| High School Diploma | 689 (87.3%) | 100 (12.7%) |
| College/Associate Degree | 620 (86.0%) | 101 (14.0%) |
| Bachelor's Degree or higher | 1,333 (89.3%) | 159 (10.7%) |
Occupancy by Age of Householder in Northfield
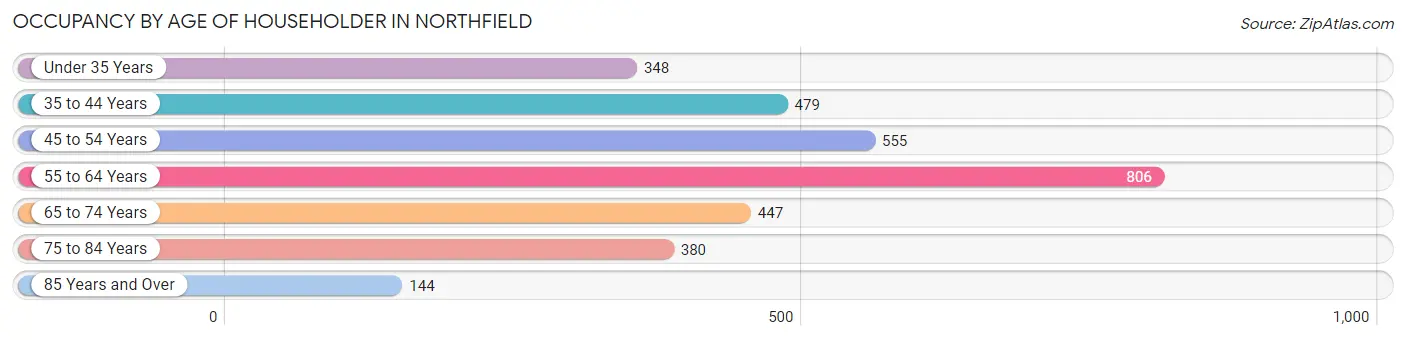
| Age Bracket | # Households | % Households |
| Under 35 Years | 348 | 11.0% |
| 35 to 44 Years | 479 | 15.2% |
| 45 to 54 Years | 555 | 17.6% |
| 55 to 64 Years | 806 | 25.5% |
| 65 to 74 Years | 447 | 14.1% |
| 75 to 84 Years | 380 | 12.0% |
| 85 Years and Over | 144 | 4.6% |
| Total | 3,159 | 100.0% |
Housing Finances in Northfield
Median Income by Occupancy in Northfield
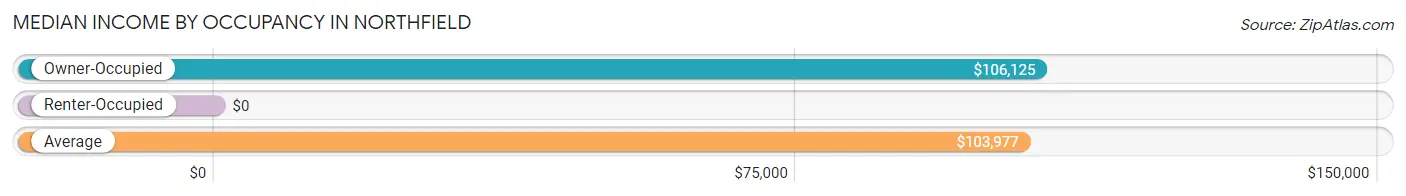
| Occupancy Type | # Households | Median Income |
| Owner-Occupied | 2,783 (88.1%) | $106,125 |
| Renter-Occupied | 376 (11.9%) | $0 |
| Average | 3,159 (100.0%) | $103,977 |
Occupancy by Householder Income Bracket in Northfield
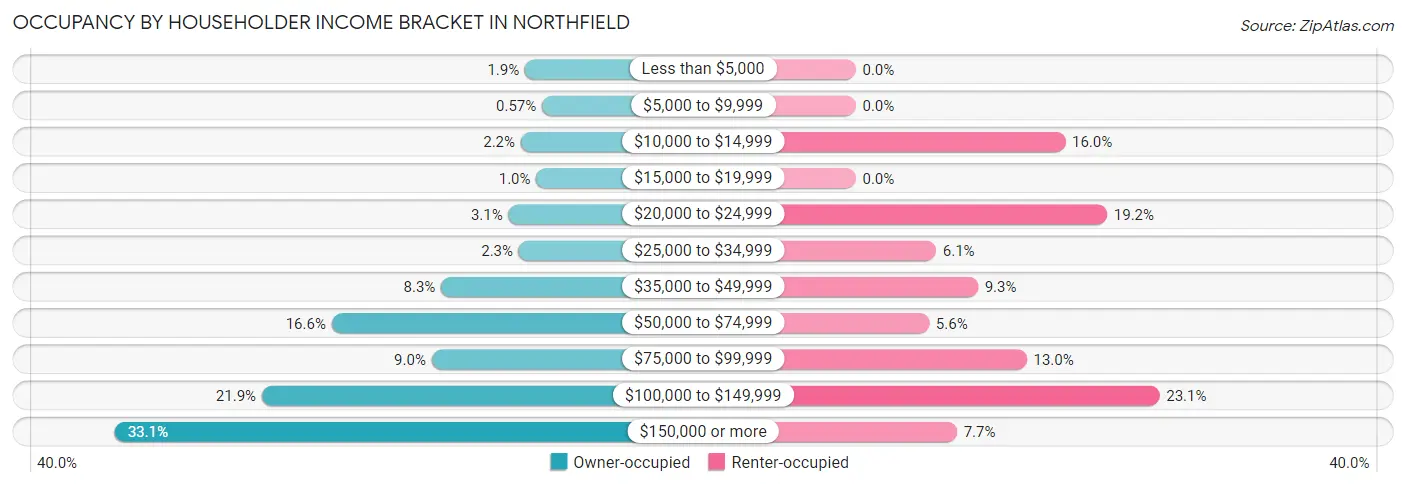
| Income Bracket | Owner-occupied | Renter-occupied |
| Less than $5,000 | 52 (1.9%) | 0 (0.0%) |
| $5,000 to $9,999 | 16 (0.6%) | 0 (0.0%) |
| $10,000 to $14,999 | 61 (2.2%) | 60 (16.0%) |
| $15,000 to $19,999 | 28 (1.0%) | 0 (0.0%) |
| $20,000 to $24,999 | 87 (3.1%) | 72 (19.2%) |
| $25,000 to $34,999 | 65 (2.3%) | 23 (6.1%) |
| $35,000 to $49,999 | 230 (8.3%) | 35 (9.3%) |
| $50,000 to $74,999 | 462 (16.6%) | 21 (5.6%) |
| $75,000 to $99,999 | 250 (9.0%) | 49 (13.0%) |
| $100,000 to $149,999 | 610 (21.9%) | 87 (23.1%) |
| $150,000 or more | 922 (33.1%) | 29 (7.7%) |
| Total | 2,783 (100.0%) | 376 (100.0%) |
Monthly Housing Cost Tiers in Northfield
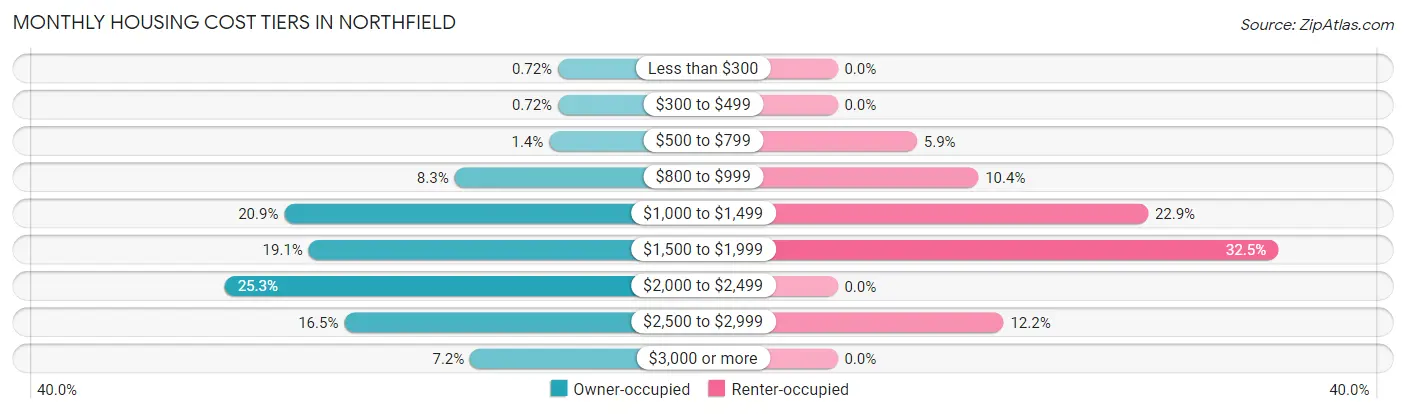
| Monthly Cost | Owner-occupied | Renter-occupied |
| Less than $300 | 20 (0.7%) | 0 (0.0%) |
| $300 to $499 | 20 (0.7%) | 0 (0.0%) |
| $500 to $799 | 38 (1.4%) | 22 (5.9%) |
| $800 to $999 | 232 (8.3%) | 39 (10.4%) |
| $1,000 to $1,499 | 581 (20.9%) | 86 (22.9%) |
| $1,500 to $1,999 | 531 (19.1%) | 122 (32.5%) |
| $2,000 to $2,499 | 703 (25.3%) | 0 (0.0%) |
| $2,500 to $2,999 | 458 (16.5%) | 46 (12.2%) |
| $3,000 or more | 200 (7.2%) | 0 (0.0%) |
| Total | 2,783 (100.0%) | 376 (100.0%) |
Physical Housing Characteristics in Northfield
Housing Structures in Northfield
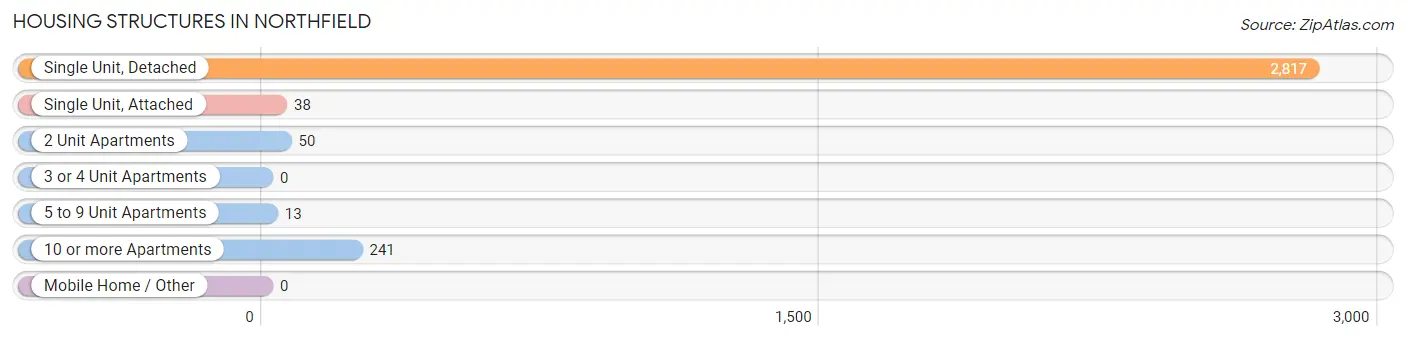
| Structure Type | # Housing Units | % Housing Units |
| Single Unit, Detached | 2,817 | 89.2% |
| Single Unit, Attached | 38 | 1.2% |
| 2 Unit Apartments | 50 | 1.6% |
| 3 or 4 Unit Apartments | 0 | 0.0% |
| 5 to 9 Unit Apartments | 13 | 0.4% |
| 10 or more Apartments | 241 | 7.6% |
| Mobile Home / Other | 0 | 0.0% |
| Total | 3,159 | 100.0% |
Housing Structures by Occupancy in Northfield
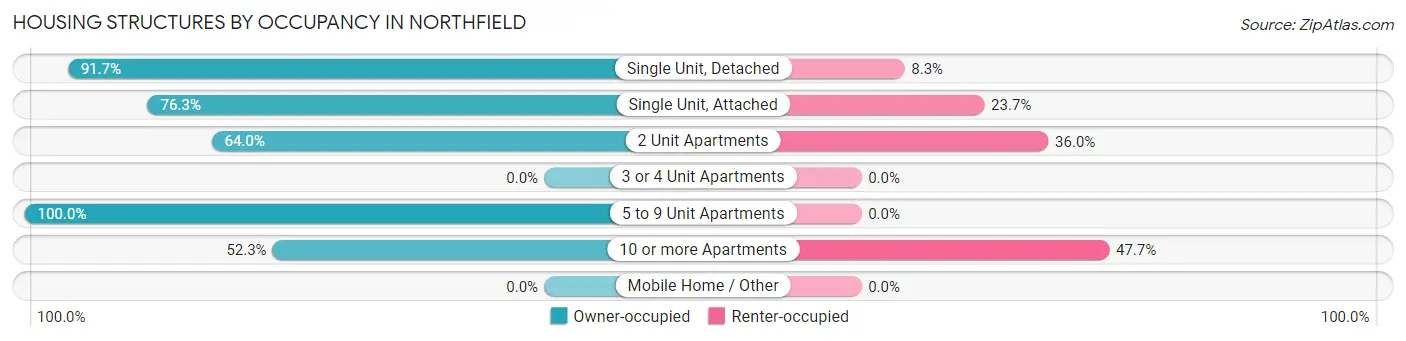
| Structure Type | Owner-occupied | Renter-occupied |
| Single Unit, Detached | 2,583 (91.7%) | 234 (8.3%) |
| Single Unit, Attached | 29 (76.3%) | 9 (23.7%) |
| 2 Unit Apartments | 32 (64.0%) | 18 (36.0%) |
| 3 or 4 Unit Apartments | 0 (0.0%) | 0 (0.0%) |
| 5 to 9 Unit Apartments | 13 (100.0%) | 0 (0.0%) |
| 10 or more Apartments | 126 (52.3%) | 115 (47.7%) |
| Mobile Home / Other | 0 (0.0%) | 0 (0.0%) |
| Total | 2,783 (88.1%) | 376 (11.9%) |
Housing Structures by Number of Rooms in Northfield
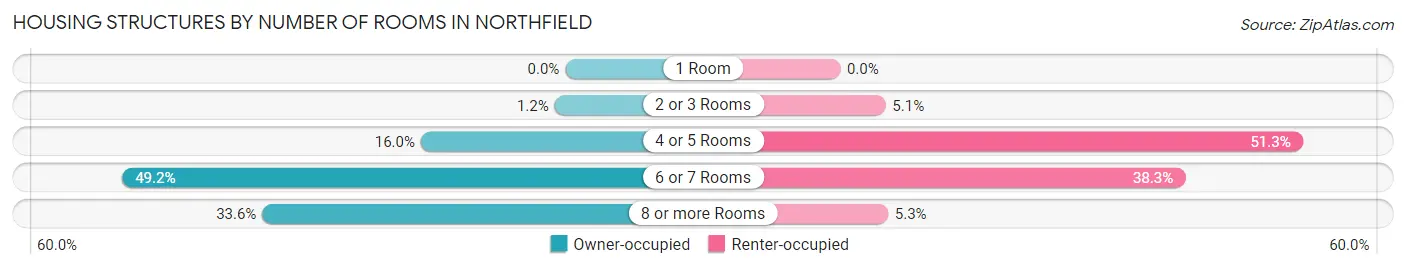
| Number of Rooms | Owner-occupied | Renter-occupied |
| 1 Room | 0 (0.0%) | 0 (0.0%) |
| 2 or 3 Rooms | 33 (1.2%) | 19 (5.1%) |
| 4 or 5 Rooms | 446 (16.0%) | 193 (51.3%) |
| 6 or 7 Rooms | 1,368 (49.2%) | 144 (38.3%) |
| 8 or more Rooms | 936 (33.6%) | 20 (5.3%) |
| Total | 2,783 (100.0%) | 376 (100.0%) |
Housing Structure by Heating Type in Northfield
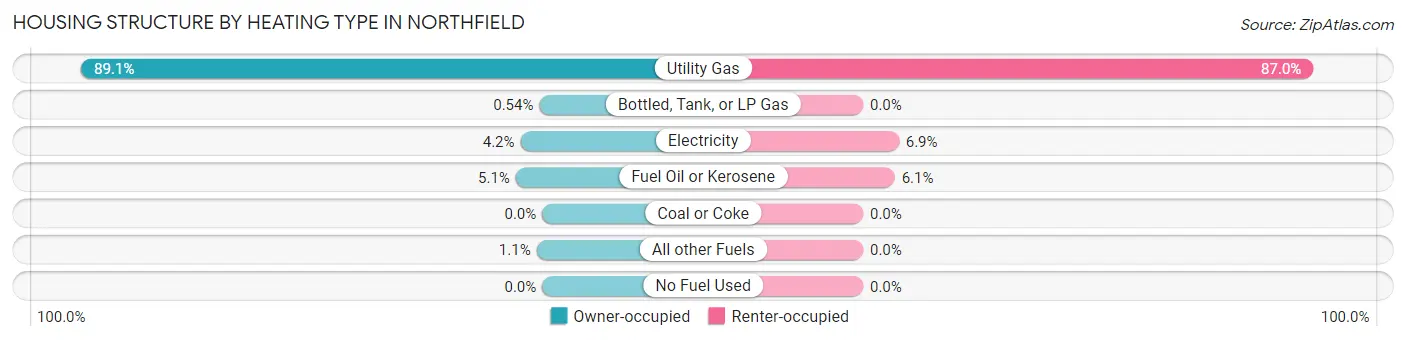
| Heating Type | Owner-occupied | Renter-occupied |
| Utility Gas | 2,479 (89.1%) | 327 (87.0%) |
| Bottled, Tank, or LP Gas | 15 (0.5%) | 0 (0.0%) |
| Electricity | 117 (4.2%) | 26 (6.9%) |
| Fuel Oil or Kerosene | 142 (5.1%) | 23 (6.1%) |
| Coal or Coke | 0 (0.0%) | 0 (0.0%) |
| All other Fuels | 30 (1.1%) | 0 (0.0%) |
| No Fuel Used | 0 (0.0%) | 0 (0.0%) |
| Total | 2,783 (100.0%) | 376 (100.0%) |
Household Vehicle Usage in Northfield
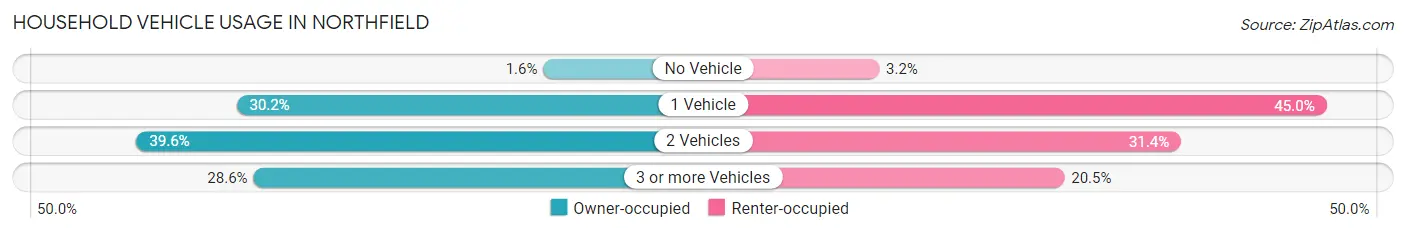
| Vehicles per Household | Owner-occupied | Renter-occupied |
| No Vehicle | 44 (1.6%) | 12 (3.2%) |
| 1 Vehicle | 841 (30.2%) | 169 (45.0%) |
| 2 Vehicles | 1,101 (39.6%) | 118 (31.4%) |
| 3 or more Vehicles | 797 (28.6%) | 77 (20.5%) |
| Total | 2,783 (100.0%) | 376 (100.0%) |
Real Estate & Mortgages in Northfield
Real Estate and Mortgage Overview in Northfield
| Characteristic | Without Mortgage | With Mortgage |
| Housing Units | 965 | 1,818 |
| Median Property Value | $270,500 | $245,300 |
| Median Household Income | $89,044 | $615 |
| Monthly Housing Costs | $1,210 | $188 |
| Real Estate Taxes | $8,487 | $51 |
Property Value by Mortgage Status in Northfield
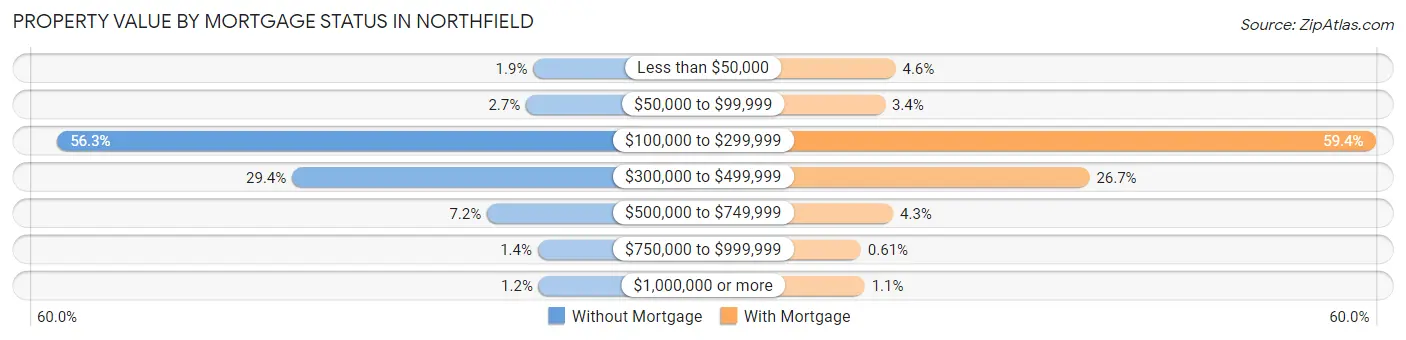
| Property Value | Without Mortgage | With Mortgage |
| Less than $50,000 | 18 (1.9%) | 83 (4.6%) |
| $50,000 to $99,999 | 26 (2.7%) | 61 (3.4%) |
| $100,000 to $299,999 | 543 (56.3%) | 1,080 (59.4%) |
| $300,000 to $499,999 | 284 (29.4%) | 486 (26.7%) |
| $500,000 to $749,999 | 69 (7.1%) | 78 (4.3%) |
| $750,000 to $999,999 | 13 (1.3%) | 11 (0.6%) |
| $1,000,000 or more | 12 (1.2%) | 19 (1.1%) |
| Total | 965 (100.0%) | 1,818 (100.0%) |
Household Income by Mortgage Status in Northfield
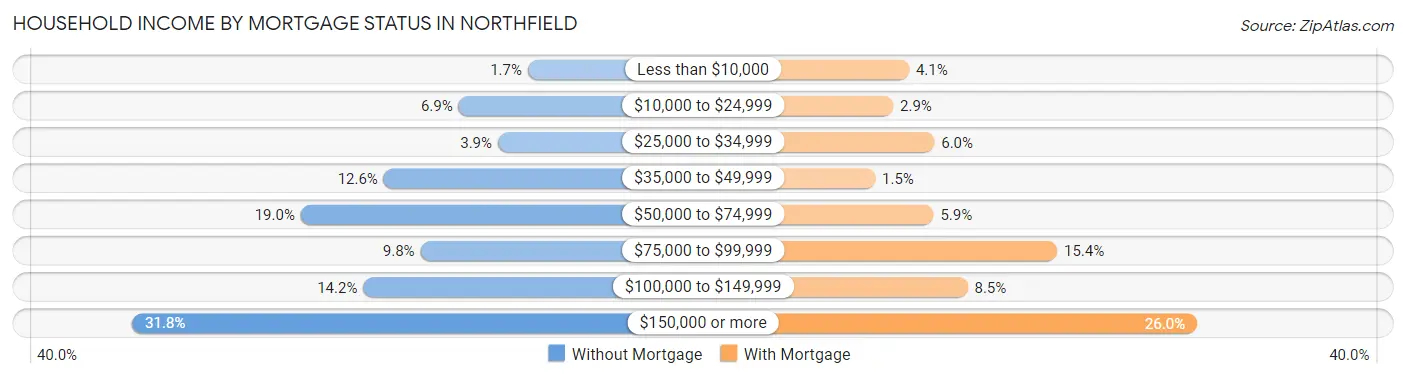
| Household Income | Without Mortgage | With Mortgage |
| Less than $10,000 | 16 (1.7%) | 74 (4.1%) |
| $10,000 to $24,999 | 67 (6.9%) | 52 (2.9%) |
| $25,000 to $34,999 | 38 (3.9%) | 109 (6.0%) |
| $35,000 to $49,999 | 122 (12.6%) | 27 (1.5%) |
| $50,000 to $74,999 | 183 (19.0%) | 108 (5.9%) |
| $75,000 to $99,999 | 95 (9.8%) | 279 (15.3%) |
| $100,000 to $149,999 | 137 (14.2%) | 155 (8.5%) |
| $150,000 or more | 307 (31.8%) | 473 (26.0%) |
| Total | 965 (100.0%) | 1,818 (100.0%) |
Property Value to Household Income Ratio in Northfield
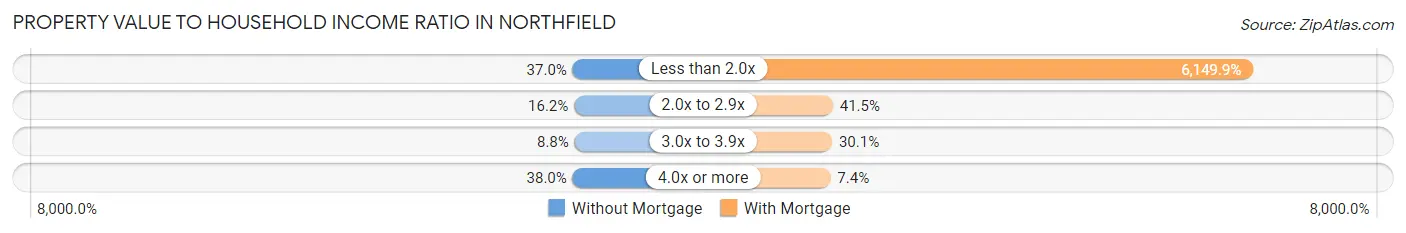
| Value-to-Income Ratio | Without Mortgage | With Mortgage |
| Less than 2.0x | 357 (37.0%) | 111,806 (6,149.9%) |
| 2.0x to 2.9x | 156 (16.2%) | 755 (41.5%) |
| 3.0x to 3.9x | 85 (8.8%) | 548 (30.1%) |
| 4.0x or more | 367 (38.0%) | 134 (7.4%) |
| Total | 965 (100.0%) | 1,818 (100.0%) |
Real Estate Taxes by Mortgage Status in Northfield
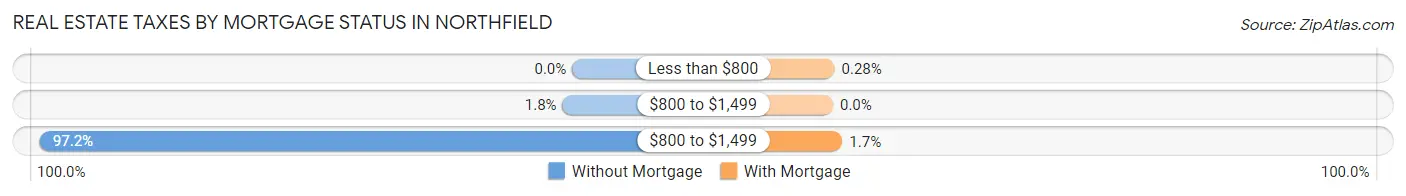
| Property Taxes | Without Mortgage | With Mortgage |
| Less than $800 | 0 (0.0%) | 5 (0.3%) |
| $800 to $1,499 | 17 (1.8%) | 0 (0.0%) |
| $800 to $1,499 | 938 (97.2%) | 31 (1.7%) |
| Total | 965 (100.0%) | 1,818 (100.0%) |
Health & Disability in Northfield
Health Insurance Coverage by Age in Northfield
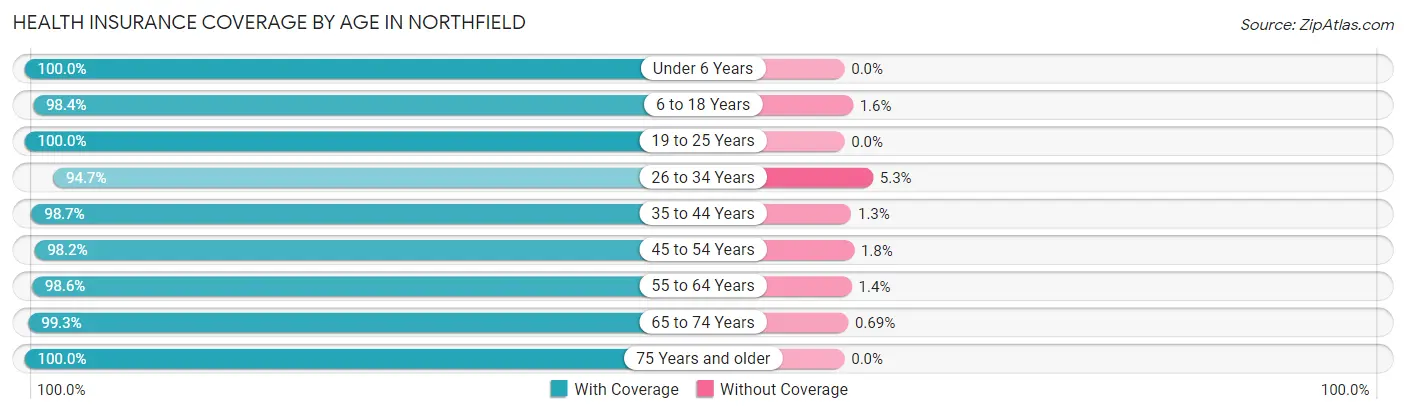
| Age Bracket | With Coverage | Without Coverage |
| Under 6 Years | 408 (100.0%) | 0 (0.0%) |
| 6 to 18 Years | 1,440 (98.4%) | 23 (1.6%) |
| 19 to 25 Years | 736 (100.0%) | 0 (0.0%) |
| 26 to 34 Years | 712 (94.7%) | 40 (5.3%) |
| 35 to 44 Years | 944 (98.7%) | 12 (1.3%) |
| 45 to 54 Years | 1,090 (98.2%) | 20 (1.8%) |
| 55 to 64 Years | 1,363 (98.6%) | 19 (1.4%) |
| 65 to 74 Years | 719 (99.3%) | 5 (0.7%) |
| 75 Years and older | 730 (100.0%) | 0 (0.0%) |
| Total | 8,142 (98.6%) | 119 (1.4%) |
Health Insurance Coverage by Citizenship Status in Northfield
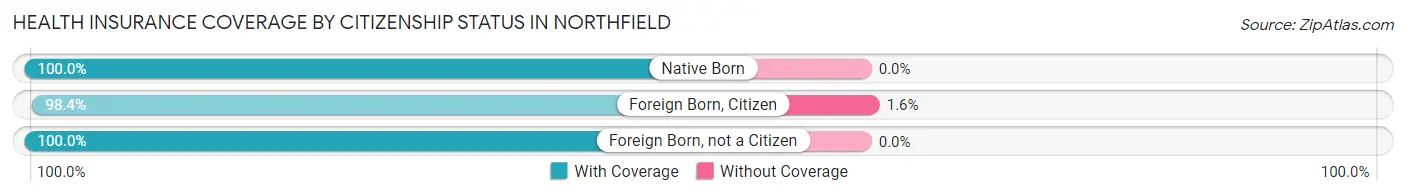
| Citizenship Status | With Coverage | Without Coverage |
| Native Born | 408 (100.0%) | 0 (0.0%) |
| Foreign Born, Citizen | 1,440 (98.4%) | 23 (1.6%) |
| Foreign Born, not a Citizen | 736 (100.0%) | 0 (0.0%) |
Health Insurance Coverage by Household Income in Northfield
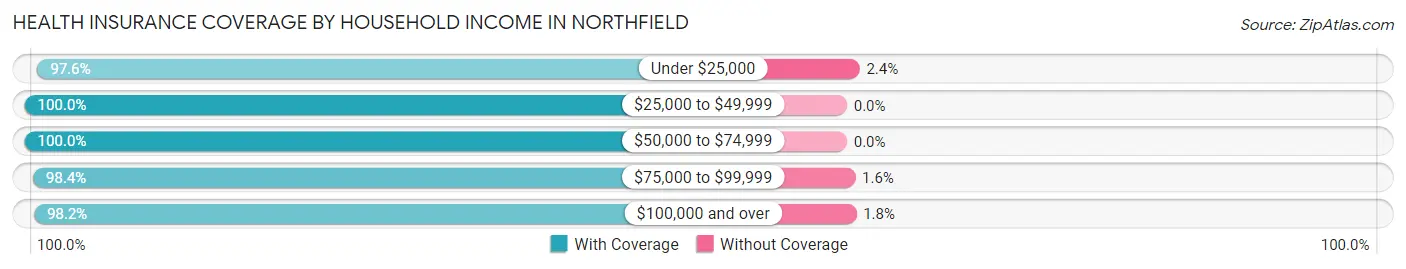
| Household Income | With Coverage | Without Coverage |
| Under $25,000 | 655 (97.6%) | 16 (2.4%) |
| $25,000 to $49,999 | 565 (100.0%) | 0 (0.0%) |
| $50,000 to $74,999 | 1,075 (100.0%) | 0 (0.0%) |
| $75,000 to $99,999 | 755 (98.4%) | 12 (1.6%) |
| $100,000 and over | 5,090 (98.2%) | 91 (1.8%) |
Public vs Private Health Insurance Coverage by Age in Northfield
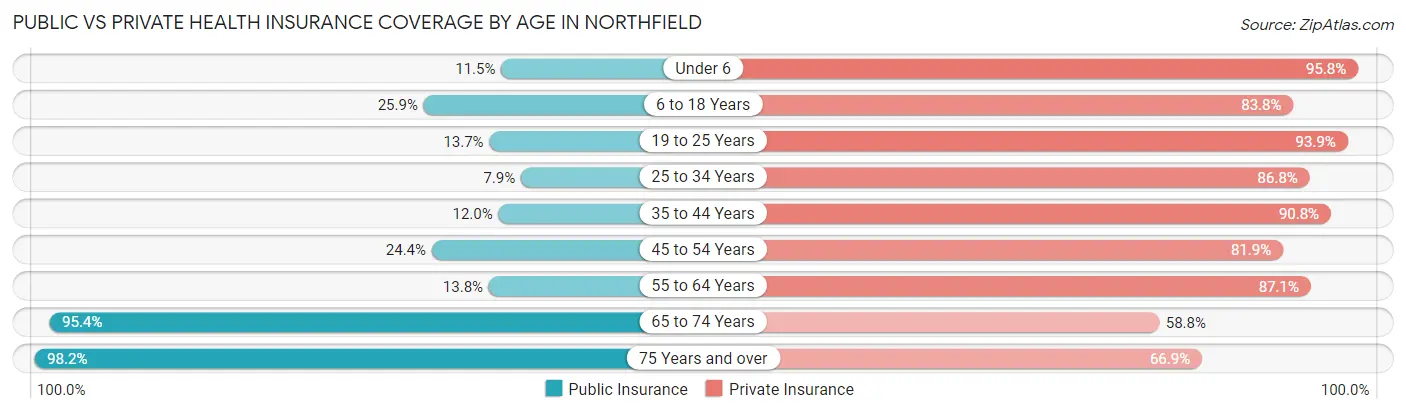
| Age Bracket | Public Insurance | Private Insurance |
| Under 6 | 47 (11.5%) | 391 (95.8%) |
| 6 to 18 Years | 379 (25.9%) | 1,226 (83.8%) |
| 19 to 25 Years | 101 (13.7%) | 691 (93.9%) |
| 25 to 34 Years | 59 (7.9%) | 653 (86.8%) |
| 35 to 44 Years | 115 (12.0%) | 868 (90.8%) |
| 45 to 54 Years | 271 (24.4%) | 909 (81.9%) |
| 55 to 64 Years | 191 (13.8%) | 1,203 (87.1%) |
| 65 to 74 Years | 691 (95.4%) | 426 (58.8%) |
| 75 Years and over | 717 (98.2%) | 488 (66.8%) |
| Total | 2,571 (31.1%) | 6,855 (83.0%) |
Disability Status by Sex by Age in Northfield
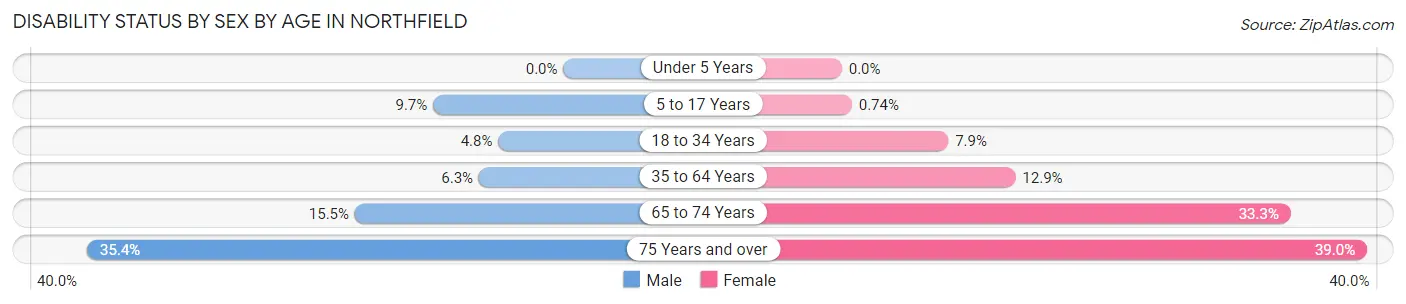
| Age Bracket | Male | Female |
| Under 5 Years | 0 (0.0%) | 0 (0.0%) |
| 5 to 17 Years | 67 (9.7%) | 6 (0.7%) |
| 18 to 34 Years | 50 (4.8%) | 44 (7.9%) |
| 35 to 64 Years | 97 (6.3%) | 245 (12.9%) |
| 65 to 74 Years | 61 (15.5%) | 110 (33.3%) |
| 75 Years and over | 104 (35.4%) | 170 (39.0%) |
Disability Class by Sex by Age in Northfield
Disability Class: Hearing Difficulty
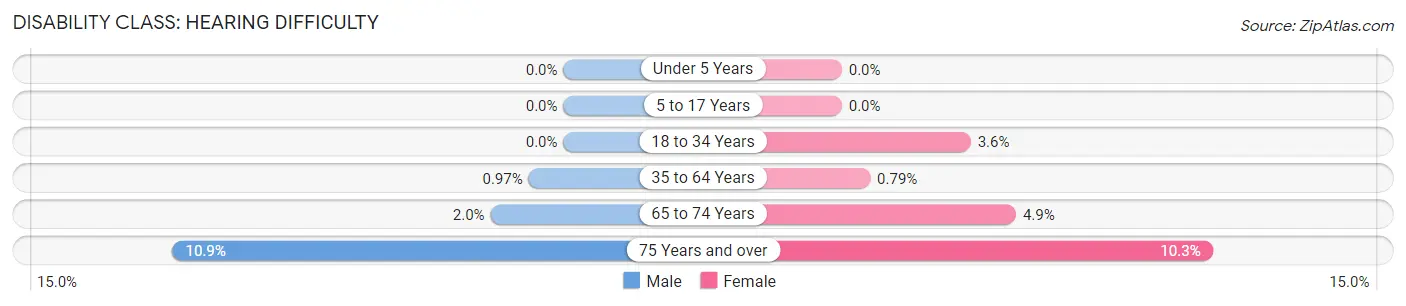
| Age Bracket | Male | Female |
| Under 5 Years | 0 (0.0%) | 0 (0.0%) |
| 5 to 17 Years | 0 (0.0%) | 0 (0.0%) |
| 18 to 34 Years | 0 (0.0%) | 20 (3.6%) |
| 35 to 64 Years | 15 (1.0%) | 15 (0.8%) |
| 65 to 74 Years | 8 (2.0%) | 16 (4.9%) |
| 75 Years and over | 32 (10.9%) | 45 (10.3%) |
Disability Class: Vision Difficulty
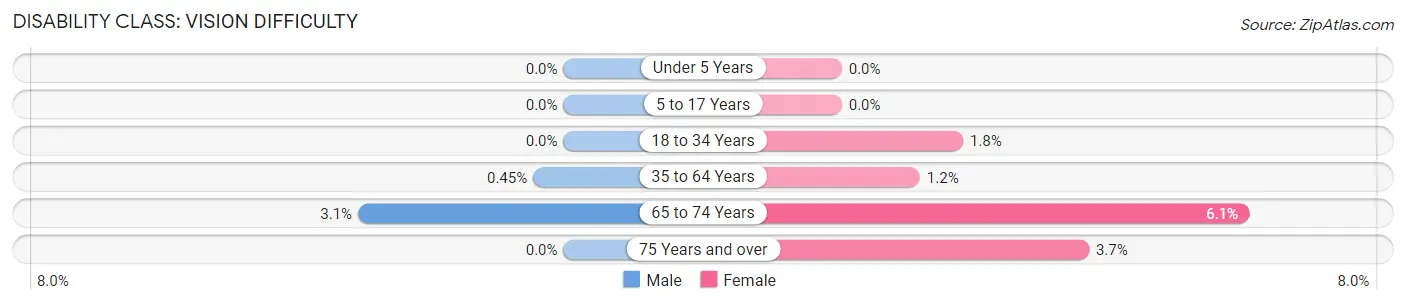
| Age Bracket | Male | Female |
| Under 5 Years | 0 (0.0%) | 0 (0.0%) |
| 5 to 17 Years | 0 (0.0%) | 0 (0.0%) |
| 18 to 34 Years | 0 (0.0%) | 10 (1.8%) |
| 35 to 64 Years | 7 (0.4%) | 22 (1.2%) |
| 65 to 74 Years | 12 (3.0%) | 20 (6.1%) |
| 75 Years and over | 0 (0.0%) | 16 (3.7%) |
Disability Class: Cognitive Difficulty
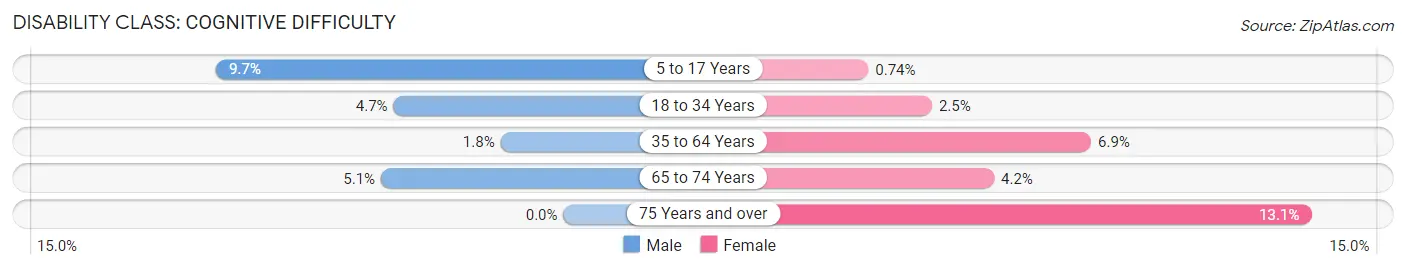
| Age Bracket | Male | Female |
| 5 to 17 Years | 67 (9.7%) | 6 (0.7%) |
| 18 to 34 Years | 49 (4.7%) | 14 (2.5%) |
| 35 to 64 Years | 27 (1.8%) | 132 (6.9%) |
| 65 to 74 Years | 20 (5.1%) | 14 (4.2%) |
| 75 Years and over | 0 (0.0%) | 57 (13.1%) |
Disability Class: Ambulatory Difficulty
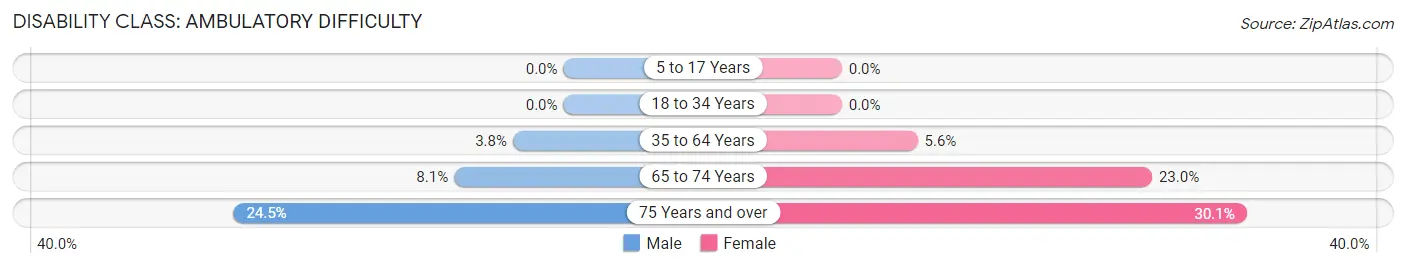
| Age Bracket | Male | Female |
| 5 to 17 Years | 0 (0.0%) | 0 (0.0%) |
| 18 to 34 Years | 0 (0.0%) | 0 (0.0%) |
| 35 to 64 Years | 58 (3.7%) | 107 (5.6%) |
| 65 to 74 Years | 32 (8.1%) | 76 (23.0%) |
| 75 Years and over | 72 (24.5%) | 131 (30.0%) |
Disability Class: Self-Care Difficulty
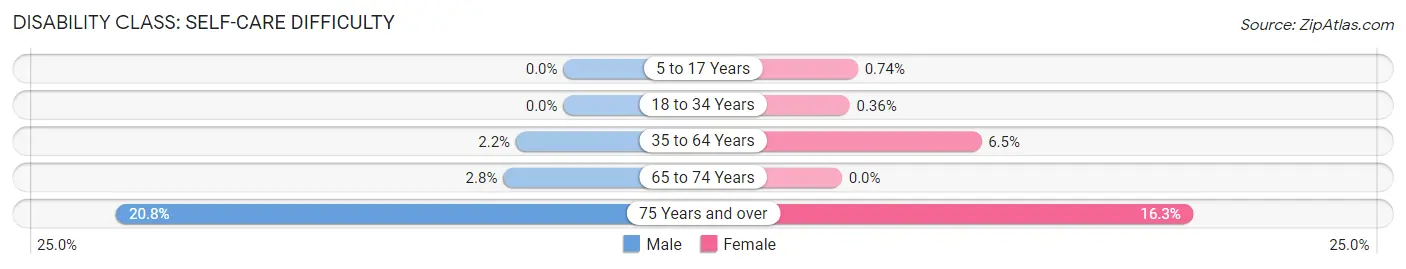
| Age Bracket | Male | Female |
| 5 to 17 Years | 0 (0.0%) | 6 (0.7%) |
| 18 to 34 Years | 0 (0.0%) | 2 (0.4%) |
| 35 to 64 Years | 34 (2.2%) | 123 (6.5%) |
| 65 to 74 Years | 11 (2.8%) | 0 (0.0%) |
| 75 Years and over | 61 (20.7%) | 71 (16.3%) |
Technology Access in Northfield
Computing Device Access in Northfield
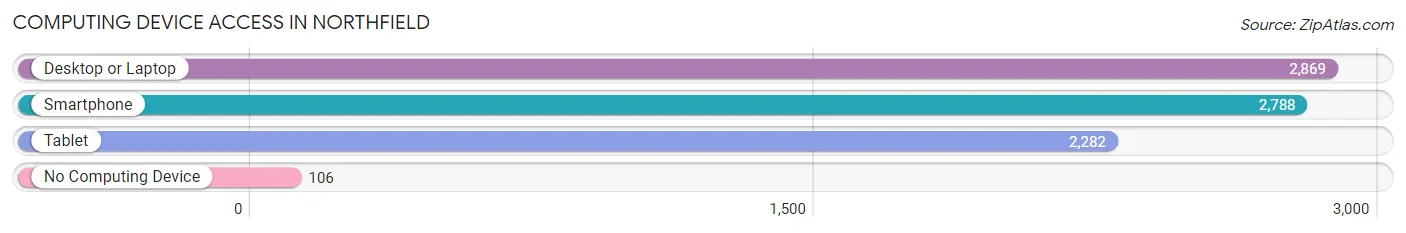
| Device Type | # Households | % Households |
| Desktop or Laptop | 2,869 | 90.8% |
| Smartphone | 2,788 | 88.3% |
| Tablet | 2,282 | 72.2% |
| No Computing Device | 106 | 3.4% |
| Total | 3,159 | 100.0% |
Internet Access in Northfield
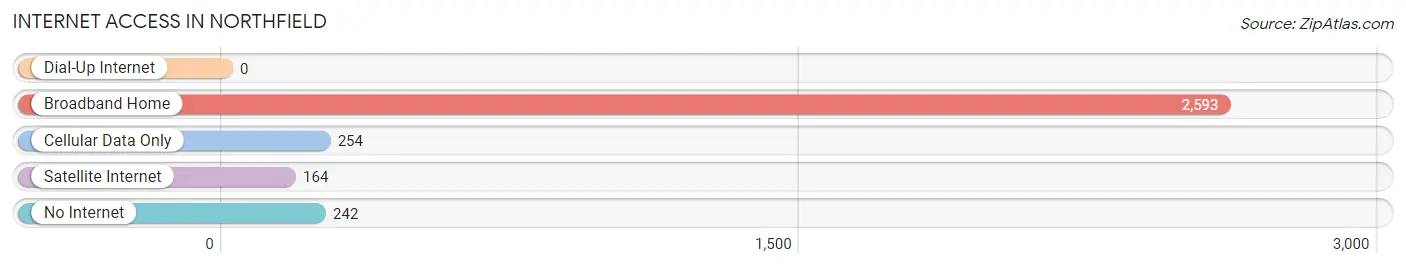
| Internet Type | # Households | % Households |
| Dial-Up Internet | 0 | 0.0% |
| Broadband Home | 2,593 | 82.1% |
| Cellular Data Only | 254 | 8.0% |
| Satellite Internet | 164 | 5.2% |
| No Internet | 242 | 7.7% |
| Total | 3,159 | 100.0% |
Northfield Summary
Northfield is a small borough located in Atlantic County, New Jersey. It is situated on the Atlantic City Expressway, just south of Atlantic City. The borough has a population of approximately 5,000 people and covers an area of 1.3 square miles.
Geography
Northfield is located in the Atlantic Coastal Plain region of New Jersey. It is situated on the Atlantic City Expressway, just south of Atlantic City. The borough is bordered by Egg Harbor Township to the north, Linwood to the east, and Pleasantville to the south. The borough is located on the Atlantic Ocean, and is home to several beaches, including Northfield Beach, which is located on the northern end of the borough.
The borough is located in a humid subtropical climate zone, with hot, humid summers and mild winters. The average annual temperature is around 60 degrees Fahrenheit, with an average high of around 80 degrees in the summer and an average low of around 40 degrees in the winter.
History
Northfield was originally inhabited by the Lenni Lenape Native Americans. The area was first settled by Europeans in the late 17th century, and was incorporated as a borough in 1885. The borough was named after Northfield, Massachusetts, which was the hometown of one of the original settlers.
The borough was a popular summer resort destination in the late 19th and early 20th centuries, and was home to several large hotels. The borough was also home to a large amusement park, which operated from the late 19th century until the mid-20th century.
Economy
Northfield’s economy is largely based on tourism and hospitality. The borough is home to several hotels, restaurants, and other tourist attractions. The borough is also home to several retail stores, including a Walmart Supercenter.
The borough is also home to several manufacturing companies, including a glass manufacturing plant and a plastics manufacturing plant. The borough is also home to several medical facilities, including a hospital and several medical offices.
Demographics
As of the 2010 census, the population of Northfield was 5,039. The racial makeup of the borough was 79.3% White, 11.2% African American, 0.3% Native American, 2.2% Asian, and 6.9% from other races. Hispanic or Latino of any race were 11.2% of the population.
The median household income in Northfield was $50,945, and the median family income was $60,945. The per capita income was $25,945. About 8.3% of families and 10.2% of the population were below the poverty line, including 14.2% of those under age 18 and 8.2% of those age 65 or over.
Northfield is a small borough with a rich history and a diverse population. The borough is home to several tourist attractions, manufacturing companies, and medical facilities, and is a popular summer resort destination. The borough has a humid subtropical climate, with hot, humid summers and mild winters. The population of Northfield is largely white, with a significant African American and Hispanic population. The median household income in Northfield is slightly above the national average, and the per capita income is slightly below the national average.
Common Questions
What is Per Capita Income in Northfield?
Per Capita income in Northfield is $51,741.
What is the Median Family Income in Northfield?
Median Family Income in Northfield is $116,641.
What is the Median Household income in Northfield?
Median Household Income in Northfield is $103,977.
What is Income or Wage Gap in Northfield?
Income or Wage Gap in Northfield is 29.3%.
Women in Northfield earn 70.7 cents for every dollar earned by a man.
What is Inequality or Gini Index in Northfield?
Inequality or Gini Index in Northfield is 0.47.
What is the Total Population of Northfield?
Total Population of Northfield is 8,432.
What is the Total Male Population of Northfield?
Total Male Population of Northfield is 4,187.
What is the Total Female Population of Northfield?
Total Female Population of Northfield is 4,245.
What is the Ratio of Males per 100 Females in Northfield?
There are 98.63 Males per 100 Females in Northfield.
What is the Ratio of Females per 100 Males in Northfield?
There are 101.39 Females per 100 Males in Northfield.
What is the Median Population Age in Northfield?
Median Population Age in Northfield is 44.2 Years.
What is the Average Family Size in Northfield
Average Family Size in Northfield is 3.2 People.
What is the Average Household Size in Northfield
Average Household Size in Northfield is 2.6 People.
How Large is the Labor Force in Northfield?
There are 4,516 People in the Labor Forcein in Northfield.
What is the Percentage of People in the Labor Force in Northfield?
65.1% of People are in the Labor Force in Northfield.
What is the Unemployment Rate in Northfield?
Unemployment Rate in Northfield is 5.8%.