Port Republic, NJ Map & Demographics
Port Republic Map
Port Republic Overview
$66,869
PER CAPITA INCOME
$168,750
AVG FAMILY INCOME
$128,611
AVG HOUSEHOLD INCOME
0.45
INEQUALITY / GINI INDEX
980
TOTAL POPULATION
454
MALE POPULATION
526
FEMALE POPULATION
86.31
MALES / 100 FEMALES
115.86
FEMALES / 100 MALES
54.6
MEDIAN AGE
2.5
AVG FAMILY SIZE
2.2
AVG HOUSEHOLD SIZE
519
LABOR FORCE [ PEOPLE ]
59.5%
PERCENT IN LABOR FORCE
4.8%
UNEMPLOYMENT RATE
Port Republic Zip Codes
Port Republic Area Codes
Income in Port Republic
Income Overview in Port Republic
Per Capita Income in Port Republic is $66,869, while median incomes of families and households are $168,750 and $128,611 respectively.
| Characteristic | Number | Measure |
| Per Capita Income | 980 | $66,869 |
| Median Family Income | 349 | $168,750 |
| Mean Family Income | 349 | $236,921 |
| Median Household Income | 434 | $128,611 |
| Mean Household Income | 434 | $205,014 |
| Income Deficit | 349 | $0 |
| Wage / Income Gap (%) | 980 | 0.00% |
| Wage / Income Gap ($) | 980 | 100.00¢ per $1 |
| Gini / Inequality Index | 980 | 0.45 |
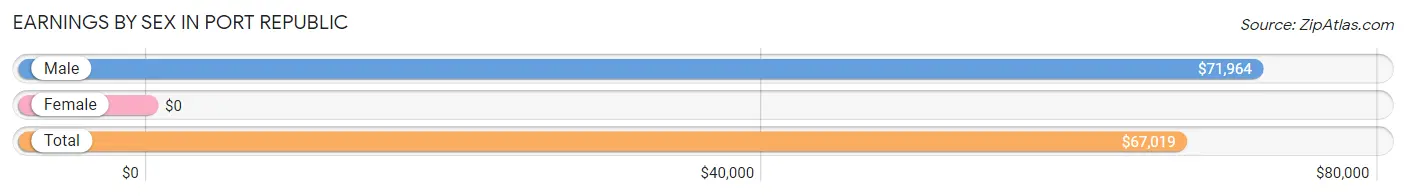
Earnings by Sex in Port Republic
| Sex | Number | Average Earnings |
| Male | 273 (49.7%) | $71,964 |
| Female | 276 (50.3%) | $0 |
| Total | 549 (100.0%) | $67,019 |
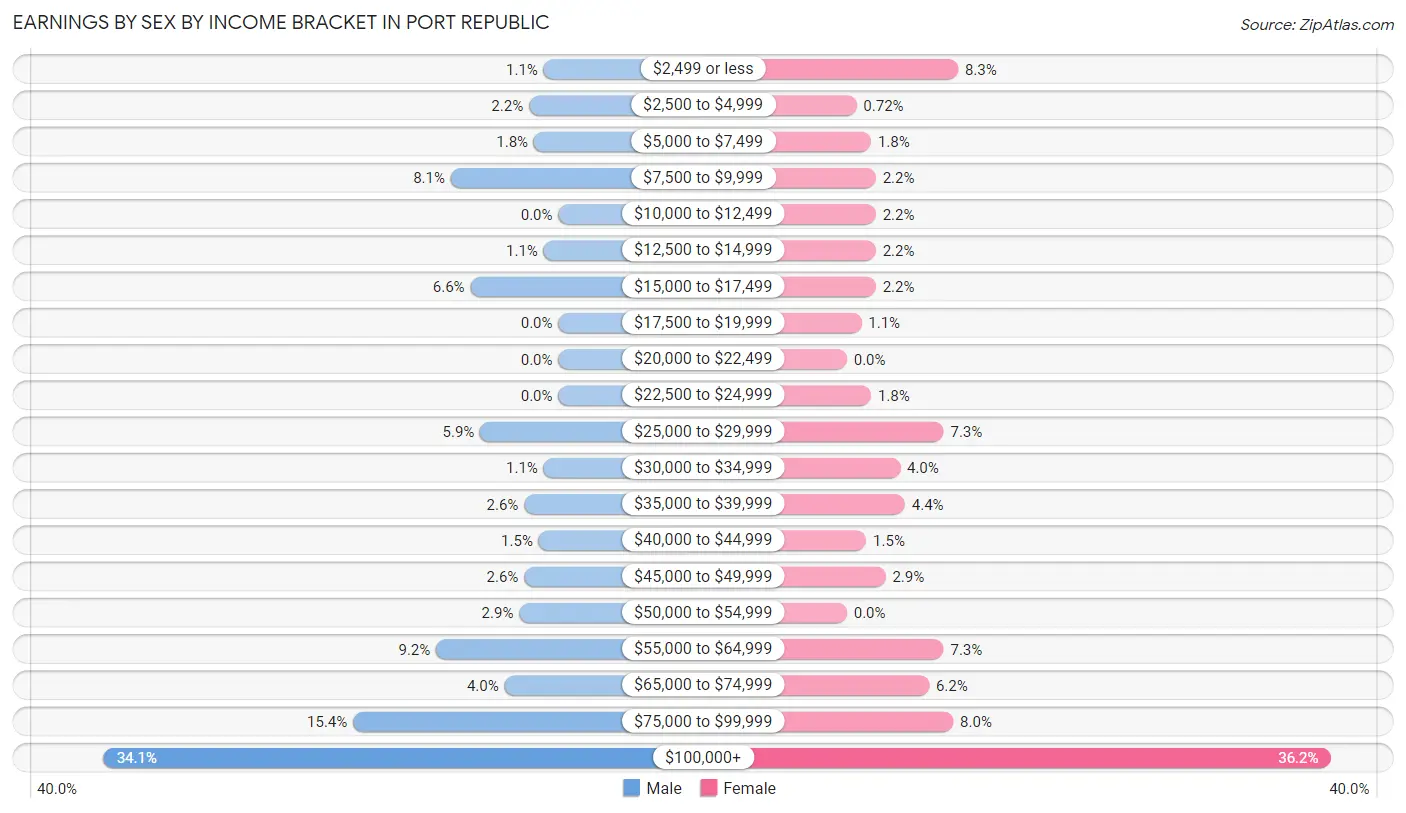
Earnings by Sex by Income Bracket in Port Republic
The most common earnings brackets in Port Republic are $100,000+ for men (93 | 34.1%) and $100,000+ for women (100 | 36.2%).
| Income | Male | Female |
| $2,499 or less | 3 (1.1%) | 23 (8.3%) |
| $2,500 to $4,999 | 6 (2.2%) | 2 (0.7%) |
| $5,000 to $7,499 | 5 (1.8%) | 5 (1.8%) |
| $7,500 to $9,999 | 22 (8.1%) | 6 (2.2%) |
| $10,000 to $12,499 | 0 (0.0%) | 6 (2.2%) |
| $12,500 to $14,999 | 3 (1.1%) | 6 (2.2%) |
| $15,000 to $17,499 | 18 (6.6%) | 6 (2.2%) |
| $17,500 to $19,999 | 0 (0.0%) | 3 (1.1%) |
| $20,000 to $22,499 | 0 (0.0%) | 0 (0.0%) |
| $22,500 to $24,999 | 0 (0.0%) | 5 (1.8%) |
| $25,000 to $29,999 | 16 (5.9%) | 20 (7.2%) |
| $30,000 to $34,999 | 3 (1.1%) | 11 (4.0%) |
| $35,000 to $39,999 | 7 (2.6%) | 12 (4.3%) |
| $40,000 to $44,999 | 4 (1.5%) | 4 (1.5%) |
| $45,000 to $49,999 | 7 (2.6%) | 8 (2.9%) |
| $50,000 to $54,999 | 8 (2.9%) | 0 (0.0%) |
| $55,000 to $64,999 | 25 (9.2%) | 20 (7.2%) |
| $65,000 to $74,999 | 11 (4.0%) | 17 (6.2%) |
| $75,000 to $99,999 | 42 (15.4%) | 22 (8.0%) |
| $100,000+ | 93 (34.1%) | 100 (36.2%) |
| Total | 273 (100.0%) | 276 (100.0%) |
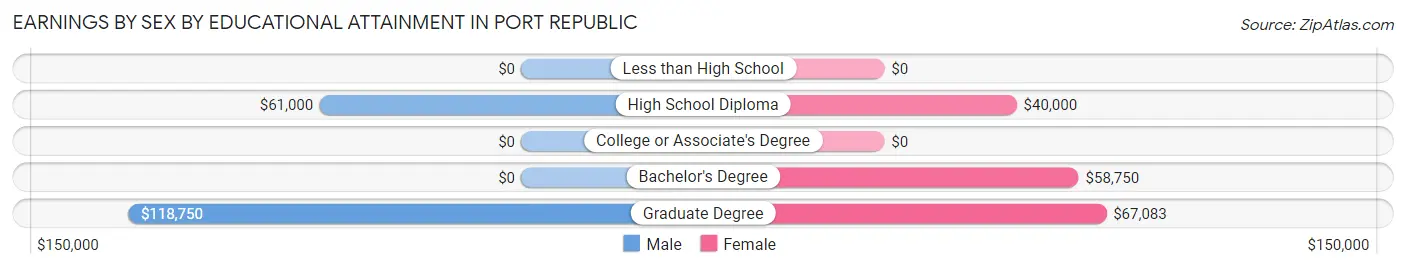
Earnings by Sex by Educational Attainment in Port Republic
| Educational Attainment | Male Income | Female Income |
| Less than High School | - | - |
| High School Diploma | $61,000 | $40,000 |
| College or Associate's Degree | - | - |
| Bachelor's Degree | - | - |
| Graduate Degree | $118,750 | $67,083 |
| Total | $78,750 | $0 |
Family Income in Port Republic
Family Income Brackets in Port Republic
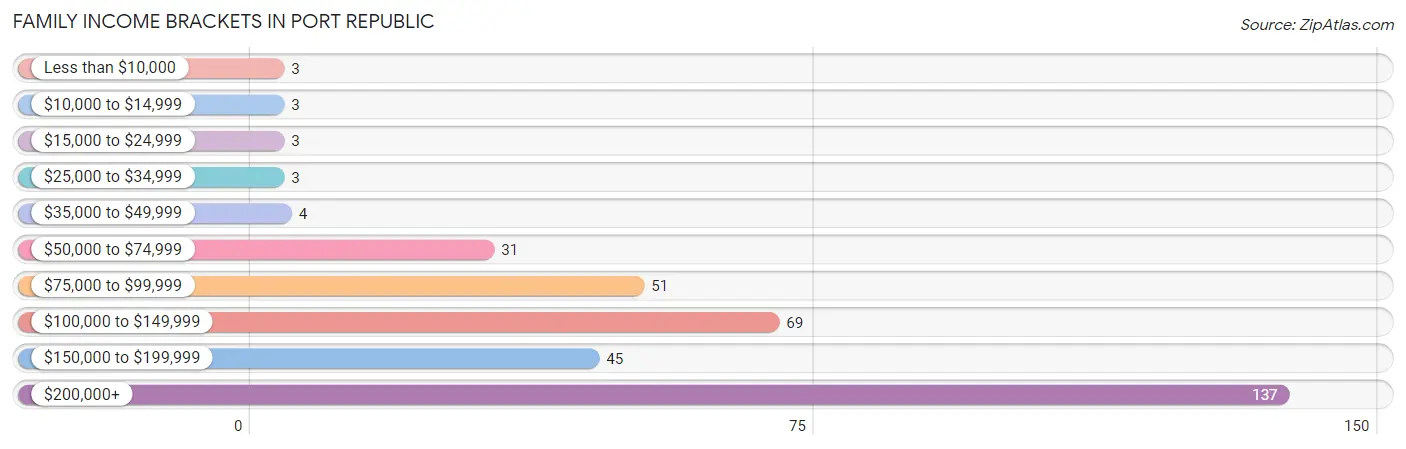
According to the Port Republic family income data, there are 137 families falling into the $200,000+ income range, which is the most common income bracket and makes up 39.3% of all families. Conversely, the less than $10,000 income bracket is the least frequent group with only 3 families (0.9%) belonging to this category.
| Income Bracket | # Families | % Families |
| Less than $10,000 | 3 | 0.9% |
| $10,000 to $14,999 | 3 | 0.9% |
| $15,000 to $24,999 | 3 | 0.9% |
| $25,000 to $34,999 | 3 | 0.9% |
| $35,000 to $49,999 | 4 | 1.1% |
| $50,000 to $74,999 | 31 | 8.9% |
| $75,000 to $99,999 | 51 | 14.6% |
| $100,000 to $149,999 | 69 | 19.8% |
| $150,000 to $199,999 | 45 | 12.9% |
| $200,000+ | 137 | 39.3% |
Family Income by Famaliy Size in Port Republic
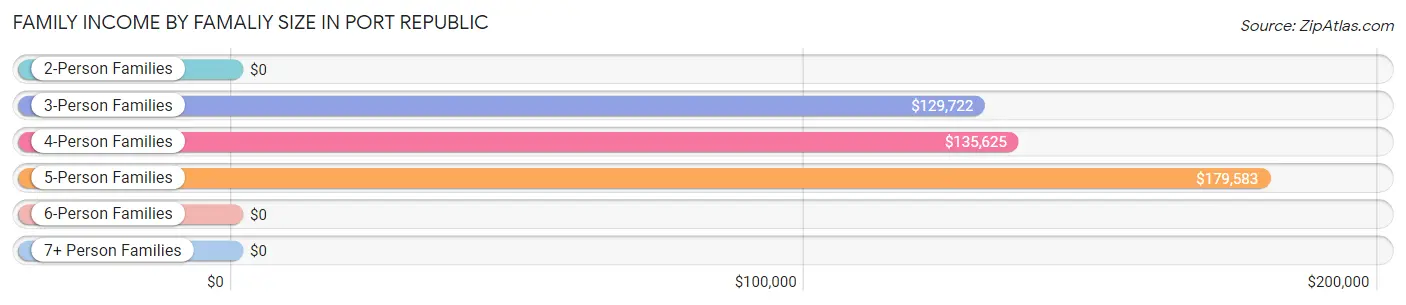
5-person families (29 | 8.3%) account for the highest median family income in Port Republic with $179,583 per family, while 3-person families (90 | 25.8%) have the highest median income of $43,241 per family member.
| Income Bracket | # Families | Median Income |
| 2-Person Families | 203 (58.2%) | $0 |
| 3-Person Families | 90 (25.8%) | $129,722 |
| 4-Person Families | 27 (7.7%) | $135,625 |
| 5-Person Families | 29 (8.3%) | $179,583 |
| 6-Person Families | 0 (0.0%) | $0 |
| 7+ Person Families | 0 (0.0%) | $0 |
| Total | 349 (100.0%) | $168,750 |
Family Income by Number of Earners in Port Republic
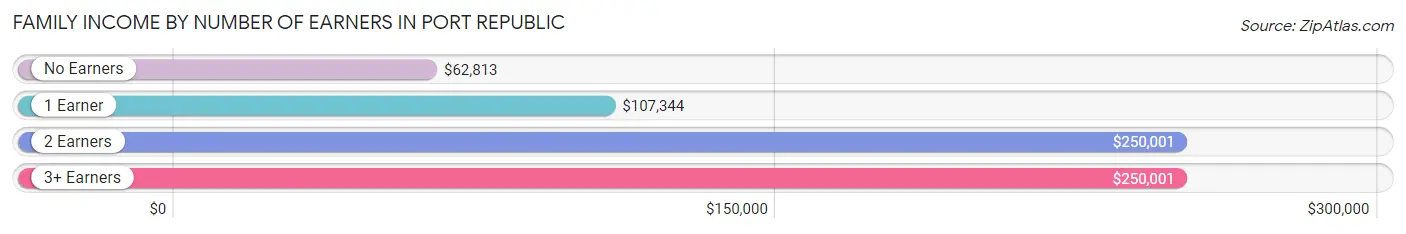
The median family income in Port Republic is $168,750, with families comprising 2 earners (201) having the highest median family income of $250,001, while families with no earners (44) have the lowest median family income of $62,813, accounting for 57.6% and 12.6% of families, respectively.
| Number of Earners | # Families | Median Income |
| No Earners | 44 (12.6%) | $62,813 |
| 1 Earner | 83 (23.8%) | $107,344 |
| 2 Earners | 201 (57.6%) | $250,001 |
| 3+ Earners | 21 (6.0%) | $250,001 |
| Total | 349 (100.0%) | $168,750 |
Household Income in Port Republic
Household Income Brackets in Port Republic
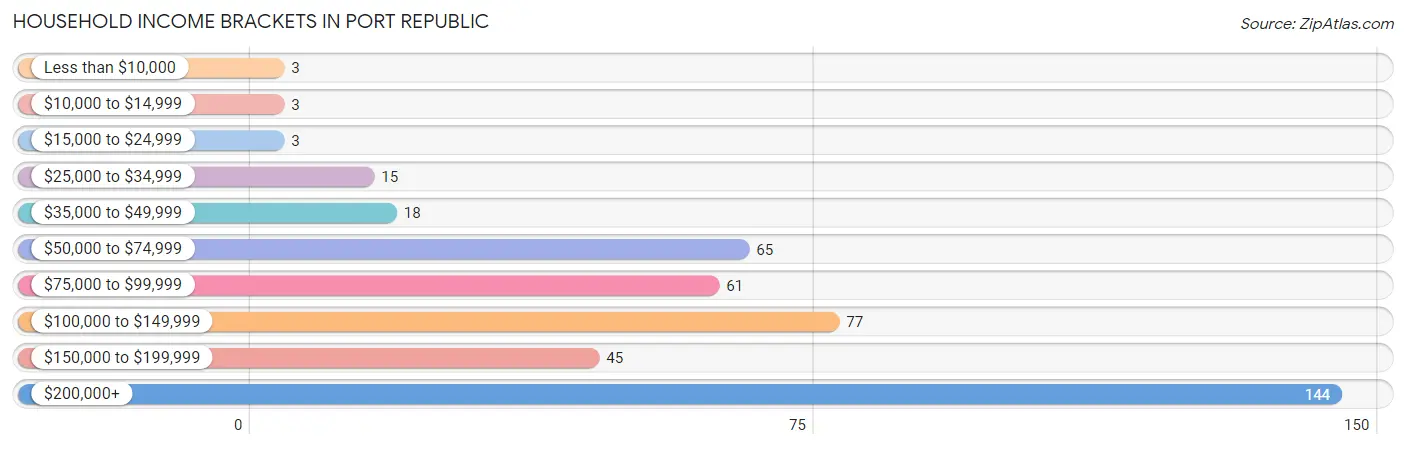
With 144 households falling in the category, the $200,000+ income range is the most frequent in Port Republic, accounting for 33.2% of all households. In contrast, only 3 households (0.7%) fall into the less than $10,000 income bracket, making it the least populous group.
| Income Bracket | # Households | % Households |
| Less than $10,000 | 3 | 0.7% |
| $10,000 to $14,999 | 3 | 0.7% |
| $15,000 to $24,999 | 3 | 0.7% |
| $25,000 to $34,999 | 15 | 3.5% |
| $35,000 to $49,999 | 18 | 4.1% |
| $50,000 to $74,999 | 65 | 15.0% |
| $75,000 to $99,999 | 61 | 14.1% |
| $100,000 to $149,999 | 77 | 17.7% |
| $150,000 to $199,999 | 45 | 10.4% |
| $200,000+ | 144 | 33.2% |
Household Income by Householder Age in Port Republic
The median household income in Port Republic is $128,611, with the highest median household income of $250,001 found in the 45 to 64 years age bracket for the primary householder. A total of 196 households (45.2%) fall into this category.
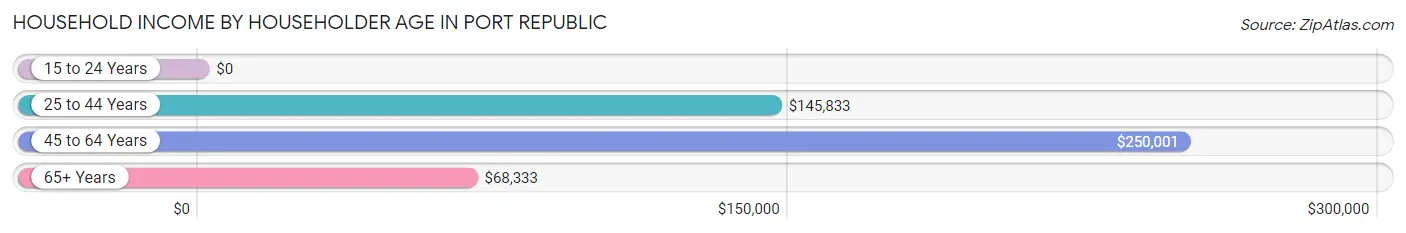
| Income Bracket | # Households | Median Income |
| 15 to 24 Years | 0 (0.0%) | $0 |
| 25 to 44 Years | 64 (14.7%) | $145,833 |
| 45 to 64 Years | 196 (45.2%) | $250,001 |
| 65+ Years | 174 (40.1%) | $68,333 |
| Total | 434 (100.0%) | $128,611 |
Poverty in Port Republic
Income Below Poverty by Sex and Age in Port Republic
With 2.0% poverty level for males and 3.0% for females among the residents of Port Republic, 65 to 74 year old males and 18 to 24 year old females are the most vulnerable to poverty, with 6 males (7.6%) and 5 females (29.4%) in their respective age groups living below the poverty level.
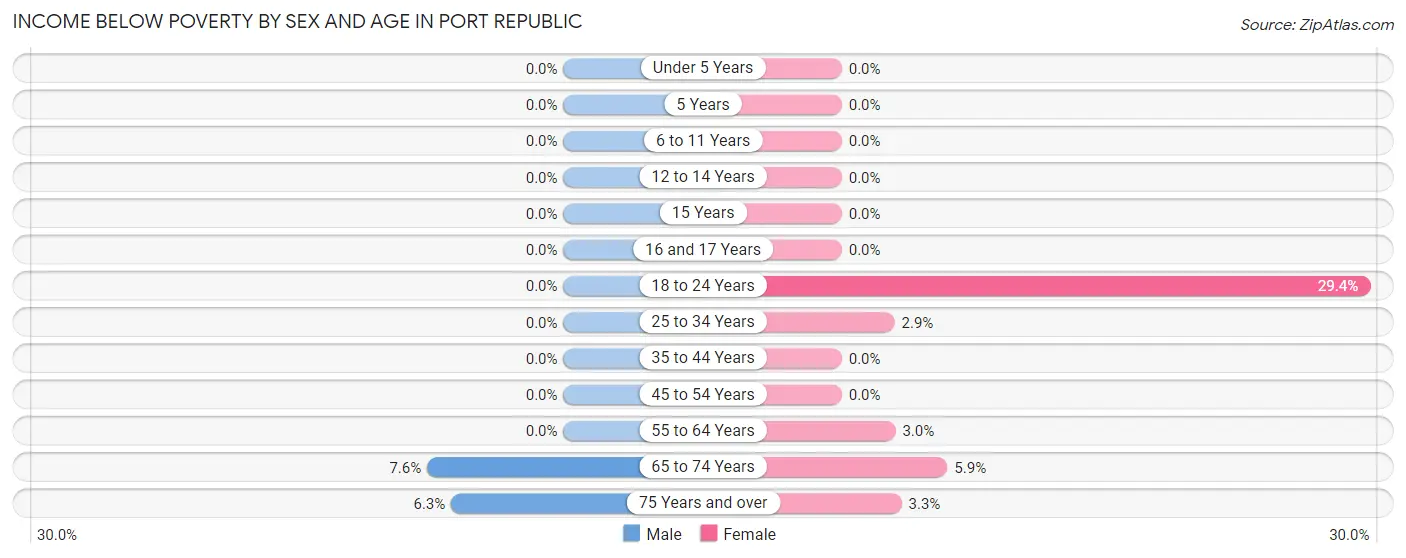
| Age Bracket | Male | Female |
| Under 5 Years | 0 (0.0%) | 0 (0.0%) |
| 5 Years | 0 (0.0%) | 0 (0.0%) |
| 6 to 11 Years | 0 (0.0%) | 0 (0.0%) |
| 12 to 14 Years | 0 (0.0%) | 0 (0.0%) |
| 15 Years | 0 (0.0%) | 0 (0.0%) |
| 16 and 17 Years | 0 (0.0%) | 0 (0.0%) |
| 18 to 24 Years | 0 (0.0%) | 5 (29.4%) |
| 25 to 34 Years | 0 (0.0%) | 1 (2.9%) |
| 35 to 44 Years | 0 (0.0%) | 0 (0.0%) |
| 45 to 54 Years | 0 (0.0%) | 0 (0.0%) |
| 55 to 64 Years | 0 (0.0%) | 2 (3.0%) |
| 65 to 74 Years | 6 (7.6%) | 6 (5.9%) |
| 75 Years and over | 3 (6.2%) | 2 (3.3%) |
| Total | 9 (2.0%) | 16 (3.0%) |
Income Above Poverty by Sex and Age in Port Republic
According to the poverty statistics in Port Republic, males aged under 5 years and females aged under 5 years are the age groups that are most secure financially, with 100.0% of males and 100.0% of females in these age groups living above the poverty line.
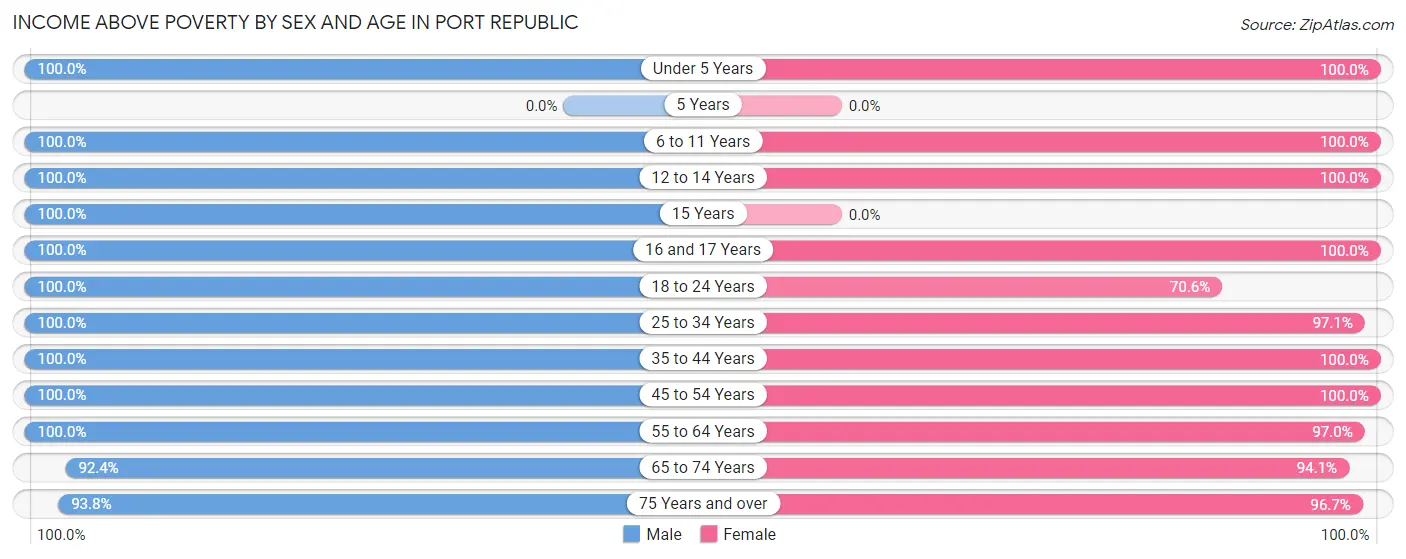
| Age Bracket | Male | Female |
| Under 5 Years | 15 (100.0%) | 12 (100.0%) |
| 5 Years | 0 (0.0%) | 0 (0.0%) |
| 6 to 11 Years | 31 (100.0%) | 28 (100.0%) |
| 12 to 14 Years | 6 (100.0%) | 4 (100.0%) |
| 15 Years | 11 (100.0%) | 0 (0.0%) |
| 16 and 17 Years | 3 (100.0%) | 11 (100.0%) |
| 18 to 24 Years | 25 (100.0%) | 12 (70.6%) |
| 25 to 34 Years | 48 (100.0%) | 33 (97.1%) |
| 35 to 44 Years | 36 (100.0%) | 42 (100.0%) |
| 45 to 54 Years | 67 (100.0%) | 149 (100.0%) |
| 55 to 64 Years | 85 (100.0%) | 65 (97.0%) |
| 65 to 74 Years | 73 (92.4%) | 96 (94.1%) |
| 75 Years and over | 45 (93.8%) | 58 (96.7%) |
| Total | 445 (98.0%) | 510 (97.0%) |
Income Below Poverty Among Married-Couple Families in Port Republic
The poverty statistics for married-couple families in Port Republic show that 2.0% or 6 of the total 305 families live below the poverty line. Families with no children have the highest poverty rate of 2.6%, comprising of 6 families. On the other hand, families with 1 or 2 children have the lowest poverty rate of 0.0%, which includes 0 families.
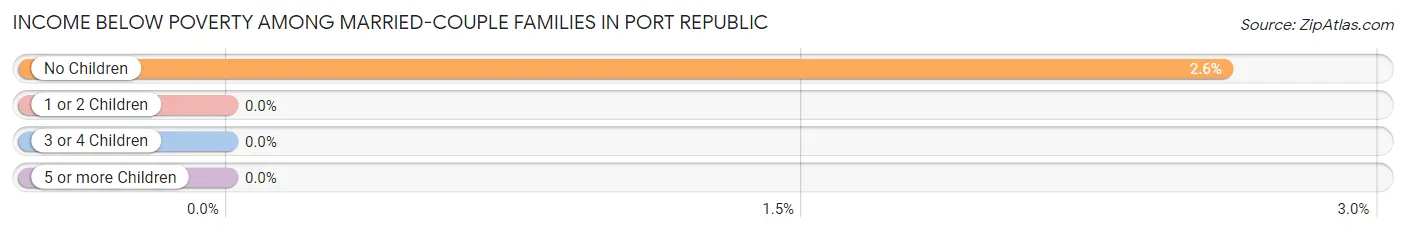
| Children | Above Poverty | Below Poverty |
| No Children | 225 (97.4%) | 6 (2.6%) |
| 1 or 2 Children | 62 (100.0%) | 0 (0.0%) |
| 3 or 4 Children | 12 (100.0%) | 0 (0.0%) |
| 5 or more Children | 0 (0.0%) | 0 (0.0%) |
| Total | 299 (98.0%) | 6 (2.0%) |
Income Below Poverty Among Single-Parent Households in Port Republic
| Children | Single Father | Single Mother |
| No Children | 0 (0.0%) | 0 (0.0%) |
| 1 or 2 Children | 0 (0.0%) | 0 (0.0%) |
| 3 or 4 Children | 0 (0.0%) | 0 (0.0%) |
| 5 or more Children | 0 (0.0%) | 0 (0.0%) |
| Total | 0 (0.0%) | 0 (0.0%) |
Income Below Poverty Among Married-Couple vs Single-Parent Households in Port Republic
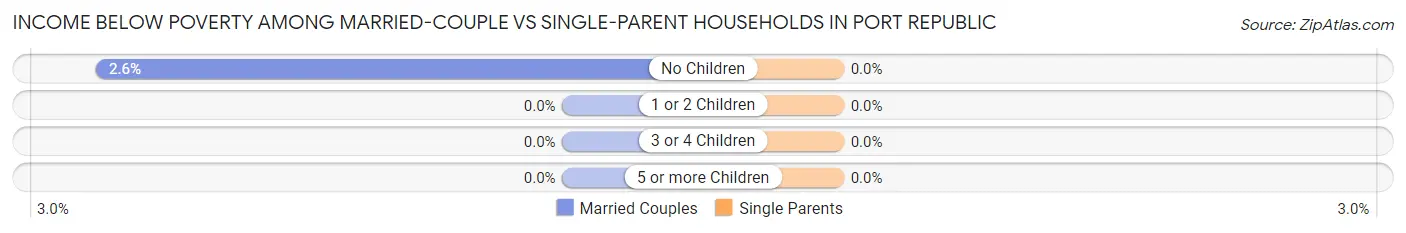
| Children | Married-Couple Families | Single-Parent Households |
| No Children | 6 (2.6%) | 0 (0.0%) |
| 1 or 2 Children | 0 (0.0%) | 0 (0.0%) |
| 3 or 4 Children | 0 (0.0%) | 0 (0.0%) |
| 5 or more Children | 0 (0.0%) | 0 (0.0%) |
| Total | 6 (2.0%) | 0 (0.0%) |
Race in Port Republic
The most populous races in Port Republic are White / Caucasian (935 | 95.4%), Two or more Races (34 | 3.5%), and Asian (11 | 1.1%).
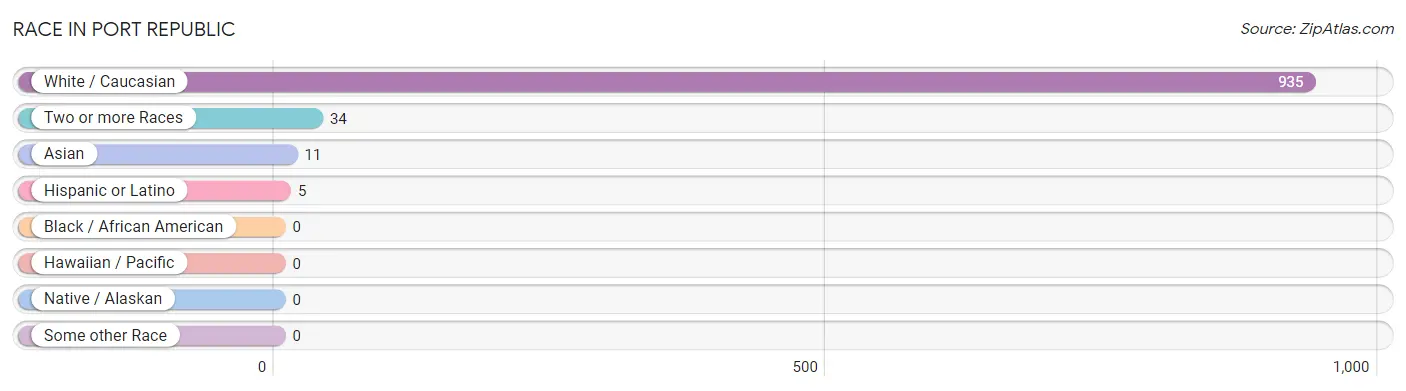
| Race | # Population | % Population |
| Asian | 11 | 1.1% |
| Black / African American | 0 | 0.0% |
| Hawaiian / Pacific | 0 | 0.0% |
| Hispanic or Latino | 5 | 0.5% |
| Native / Alaskan | 0 | 0.0% |
| White / Caucasian | 935 | 95.4% |
| Two or more Races | 34 | 3.5% |
| Some other Race | 0 | 0.0% |
| Total | 980 | 100.0% |
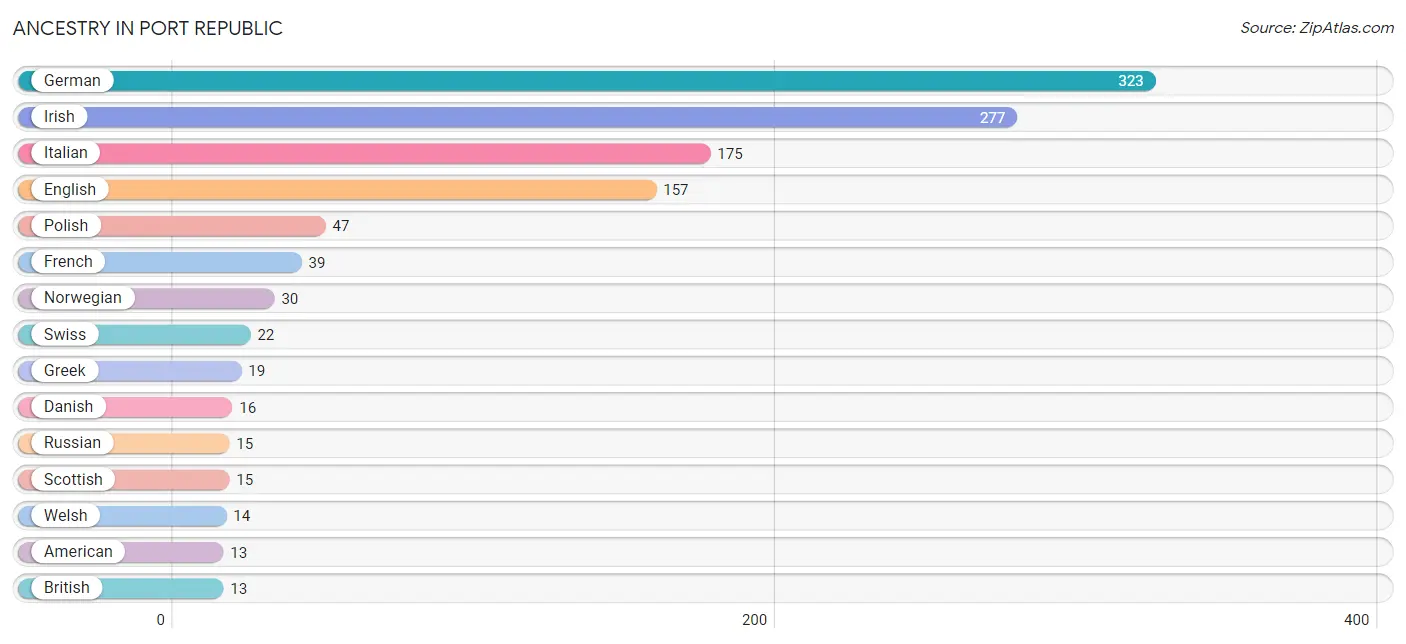
Ancestry in Port Republic
The most populous ancestries reported in Port Republic are German (323 | 33.0%), Irish (277 | 28.3%), Italian (175 | 17.9%), English (157 | 16.0%), and Polish (47 | 4.8%), together accounting for 99.9% of all Port Republic residents.
| Ancestry | # Population | % Population |
| American | 13 | 1.3% |
| British | 13 | 1.3% |
| Burmese | 5 | 0.5% |
| Canadian | 13 | 1.3% |
| Cherokee | 2 | 0.2% |
| Danish | 16 | 1.6% |
| Dominican | 2 | 0.2% |
| Dutch | 13 | 1.3% |
| English | 157 | 16.0% |
| European | 13 | 1.3% |
| French | 39 | 4.0% |
| French Canadian | 2 | 0.2% |
| German | 323 | 33.0% |
| Greek | 19 | 1.9% |
| Hungarian | 3 | 0.3% |
| Irish | 277 | 28.3% |
| Italian | 175 | 17.9% |
| Korean | 11 | 1.1% |
| Lithuanian | 4 | 0.4% |
| Norwegian | 30 | 3.1% |
| Polish | 47 | 4.8% |
| Portuguese | 11 | 1.1% |
| Russian | 15 | 1.5% |
| Scandinavian | 12 | 1.2% |
| Scotch-Irish | 7 | 0.7% |
| Scottish | 15 | 1.5% |
| Spanish | 3 | 0.3% |
| Sri Lankan | 3 | 0.3% |
| Swedish | 5 | 0.5% |
| Swiss | 22 | 2.2% |
| Ukrainian | 5 | 0.5% |
| Welsh | 14 | 1.4% | View All 32 Rows |
Immigrants in Port Republic
The most numerous immigrant groups reported in Port Republic came from Europe (95 | 9.7%), Western Europe (95 | 9.7%), Germany (84 | 8.6%), Switzerland (11 | 1.1%), and Asia (8 | 0.8%), together accounting for 29.9% of all Port Republic residents.
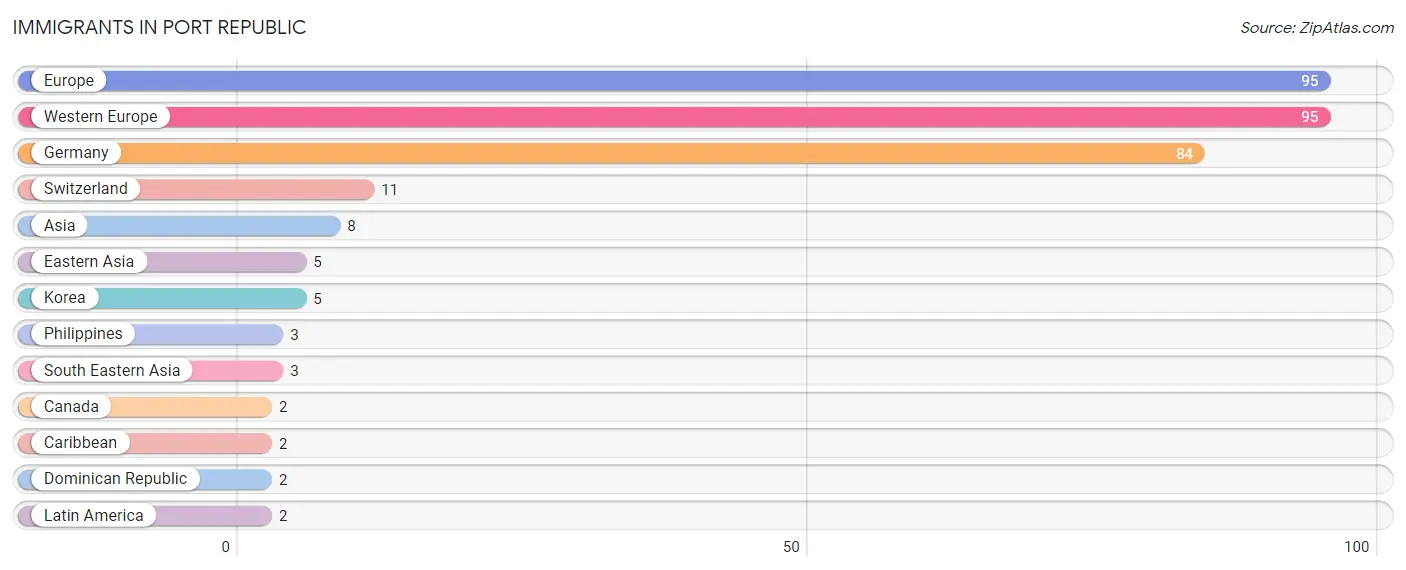
| Immigration Origin | # Population | % Population |
| Asia | 8 | 0.8% |
| Canada | 2 | 0.2% |
| Caribbean | 2 | 0.2% |
| Dominican Republic | 2 | 0.2% |
| Eastern Asia | 5 | 0.5% |
| Europe | 95 | 9.7% |
| Germany | 84 | 8.6% |
| Korea | 5 | 0.5% |
| Latin America | 2 | 0.2% |
| Philippines | 3 | 0.3% |
| South Eastern Asia | 3 | 0.3% |
| Switzerland | 11 | 1.1% |
| Western Europe | 95 | 9.7% | View All 13 Rows |
Sex and Age in Port Republic
Sex and Age in Port Republic
The most populous age groups in Port Republic are 55 to 59 Years (54 | 11.9%) for men and 50 to 54 Years (123 | 23.4%) for women.
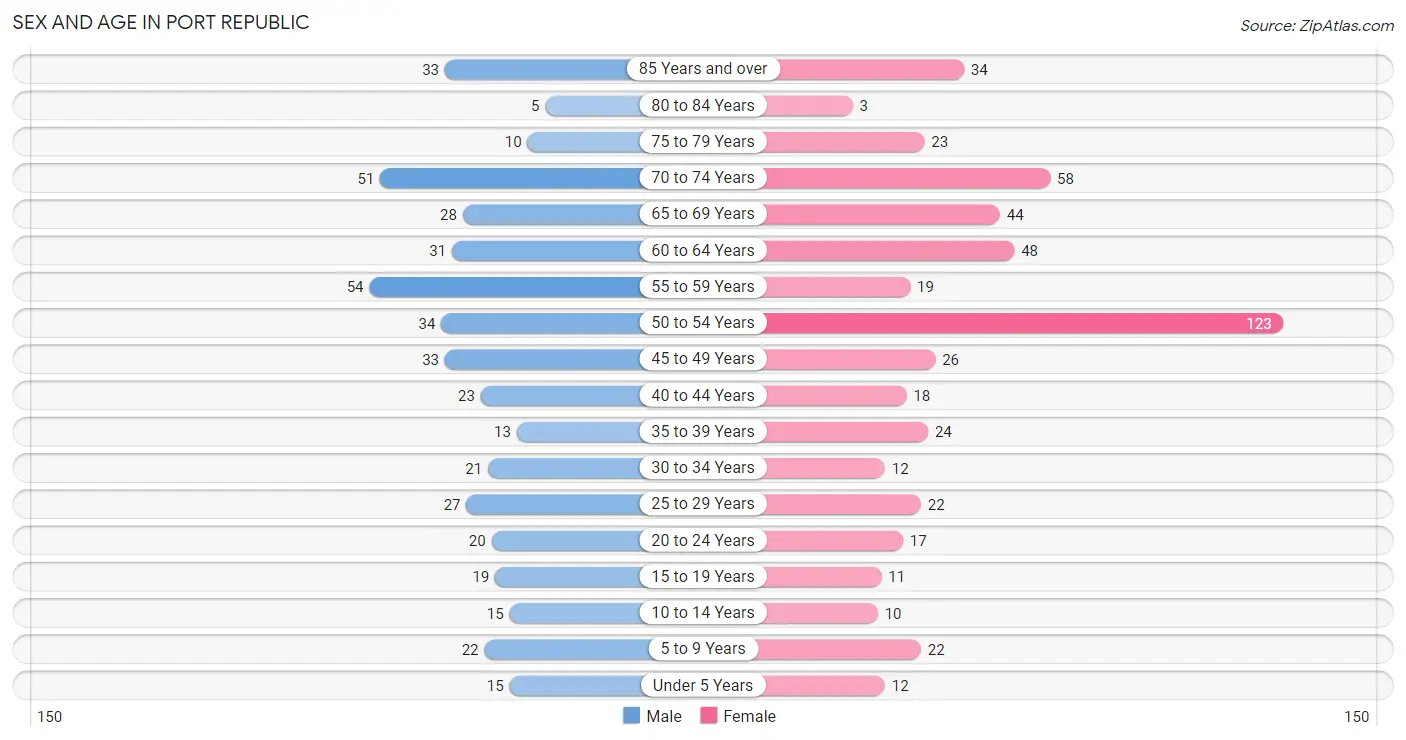
| Age Bracket | Male | Female |
| Under 5 Years | 15 (3.3%) | 12 (2.3%) |
| 5 to 9 Years | 22 (4.9%) | 22 (4.2%) |
| 10 to 14 Years | 15 (3.3%) | 10 (1.9%) |
| 15 to 19 Years | 19 (4.2%) | 11 (2.1%) |
| 20 to 24 Years | 20 (4.4%) | 17 (3.2%) |
| 25 to 29 Years | 27 (5.9%) | 22 (4.2%) |
| 30 to 34 Years | 21 (4.6%) | 12 (2.3%) |
| 35 to 39 Years | 13 (2.9%) | 24 (4.6%) |
| 40 to 44 Years | 23 (5.1%) | 18 (3.4%) |
| 45 to 49 Years | 33 (7.3%) | 26 (4.9%) |
| 50 to 54 Years | 34 (7.5%) | 123 (23.4%) |
| 55 to 59 Years | 54 (11.9%) | 19 (3.6%) |
| 60 to 64 Years | 31 (6.8%) | 48 (9.1%) |
| 65 to 69 Years | 28 (6.2%) | 44 (8.4%) |
| 70 to 74 Years | 51 (11.2%) | 58 (11.0%) |
| 75 to 79 Years | 10 (2.2%) | 23 (4.4%) |
| 80 to 84 Years | 5 (1.1%) | 3 (0.6%) |
| 85 Years and over | 33 (7.3%) | 34 (6.5%) |
| Total | 454 (100.0%) | 526 (100.0%) |
Families and Households in Port Republic
Median Family Size in Port Republic
The median family size in Port Republic is 2.46 persons per family, with single female/mother families (20 | 5.7%) accounting for the largest median family size of 3.55 persons per family. On the other hand, married-couple families (305 | 87.4%) represent the smallest median family size with 2.33 persons per family.
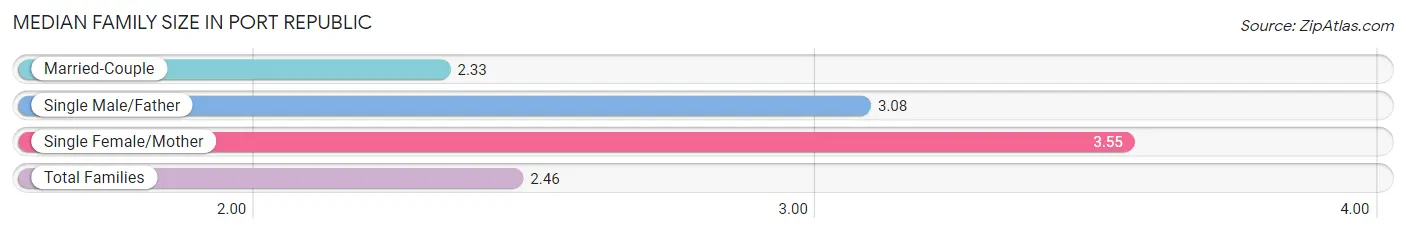
| Family Type | # Families | Family Size |
| Married-Couple | 305 (87.4%) | 2.33 |
| Single Male/Father | 24 (6.9%) | 3.08 |
| Single Female/Mother | 20 (5.7%) | 3.55 |
| Total Families | 349 (100.0%) | 2.46 |
Median Household Size in Port Republic
The median household size in Port Republic is 2.24 persons per household, with single female/mother households (20 | 4.6%) accounting for the largest median household size of 3.65 persons per household. non-family households (85 | 19.6%) represent the smallest median household size with 1.25 persons per household.
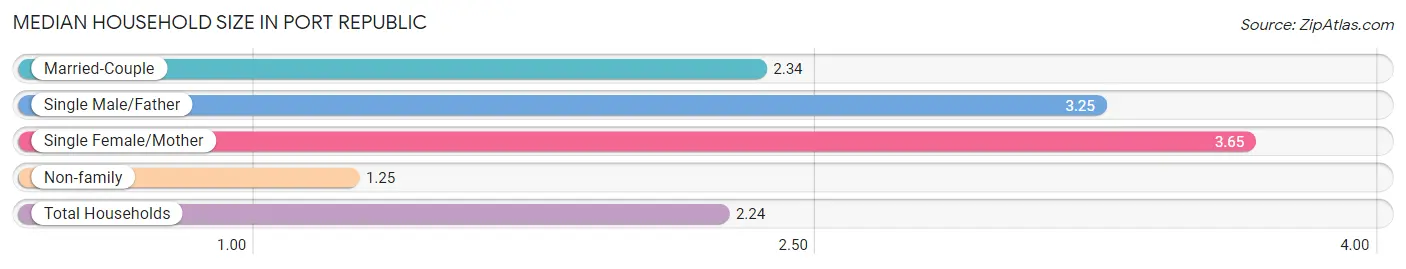
| Household Type | # Households | Household Size |
| Married-Couple | 305 (70.3%) | 2.34 |
| Single Male/Father | 24 (5.5%) | 3.25 |
| Single Female/Mother | 20 (4.6%) | 3.65 |
| Non-family | 85 (19.6%) | 1.25 |
| Total Households | 434 (100.0%) | 2.24 |
Household Size by Marriage Status in Port Republic
Out of a total of 434 households in Port Republic, 349 (80.4%) are family households, while 85 (19.6%) are nonfamily households. The most numerous type of family households are 2-person households, comprising 197, and the most common type of nonfamily households are 1-person households, comprising 66.
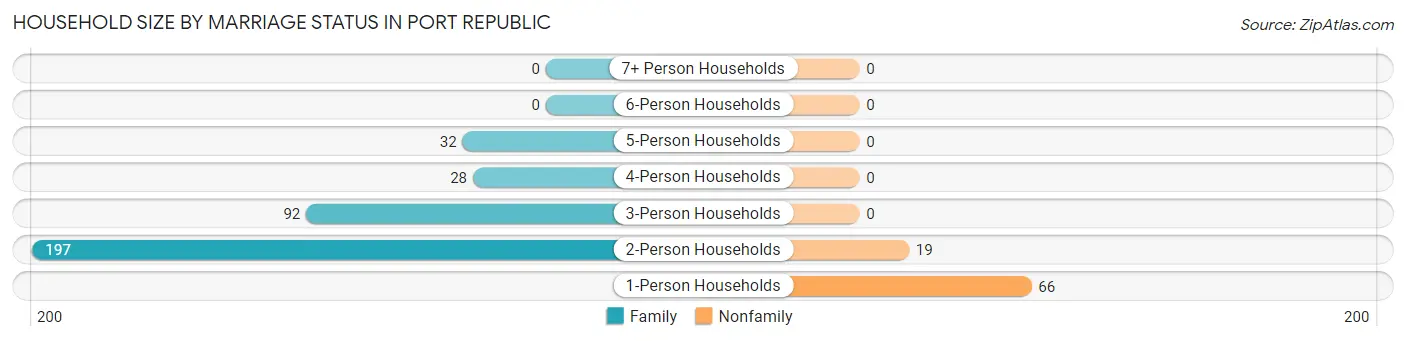
| Household Size | Family Households | Nonfamily Households |
| 1-Person Households | - | 66 (15.2%) |
| 2-Person Households | 197 (45.4%) | 19 (4.4%) |
| 3-Person Households | 92 (21.2%) | 0 (0.0%) |
| 4-Person Households | 28 (6.5%) | 0 (0.0%) |
| 5-Person Households | 32 (7.4%) | 0 (0.0%) |
| 6-Person Households | 0 (0.0%) | 0 (0.0%) |
| 7+ Person Households | 0 (0.0%) | 0 (0.0%) |
| Total | 349 (80.4%) | 85 (19.6%) |
Female Fertility in Port Republic
Fertility by Age in Port Republic
Average fertility rate in Port Republic is 44.0 births per 1,000 women. Women in the age bracket of 35 to 50 years have the highest fertility rate with 80.0 births per 1,000 women. Women in the age bracket of 35 to 50 years acount for 100.0% of all women with births.
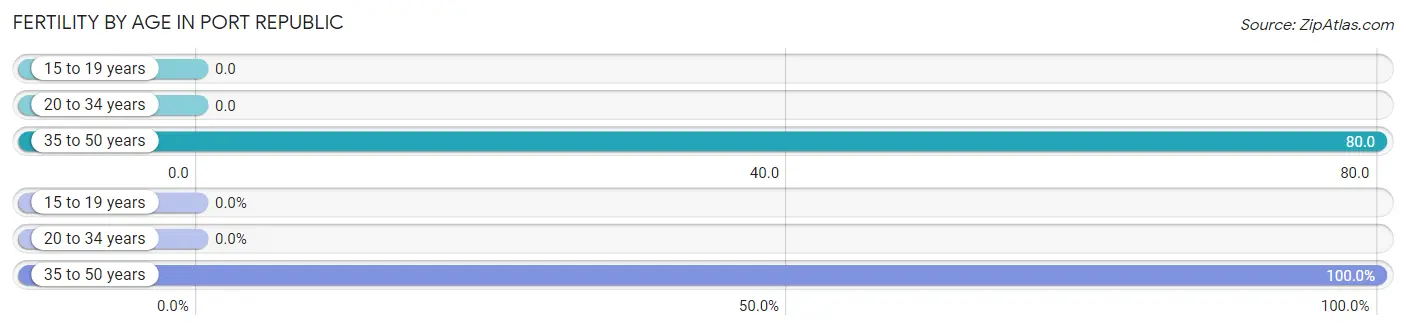
| Age Bracket | Women with Births | Births / 1,000 Women |
| 15 to 19 years | 0 (0.0%) | 0.0 |
| 20 to 34 years | 0 (0.0%) | 0.0 |
| 35 to 50 years | 6 (100.0%) | 80.0 |
| Total | 6 (100.0%) | 44.0 |
Fertility by Age by Marriage Status in Port Republic
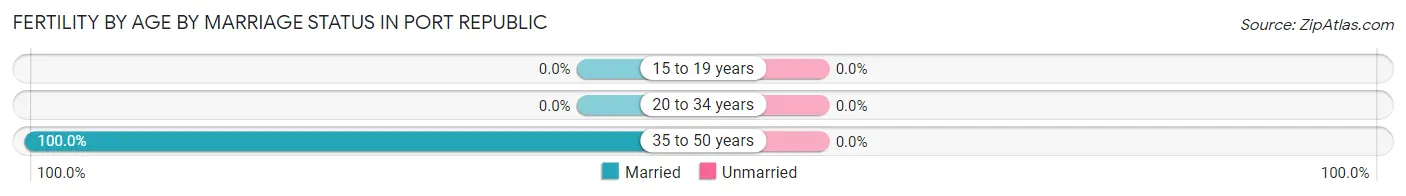
| Age Bracket | Married | Unmarried |
| 15 to 19 years | 0 (0.0%) | 0 (0.0%) |
| 20 to 34 years | 0 (0.0%) | 0 (0.0%) |
| 35 to 50 years | 6 (100.0%) | 0 (0.0%) |
| Total | 6 (100.0%) | 0 (0.0%) |
Fertility by Education in Port Republic
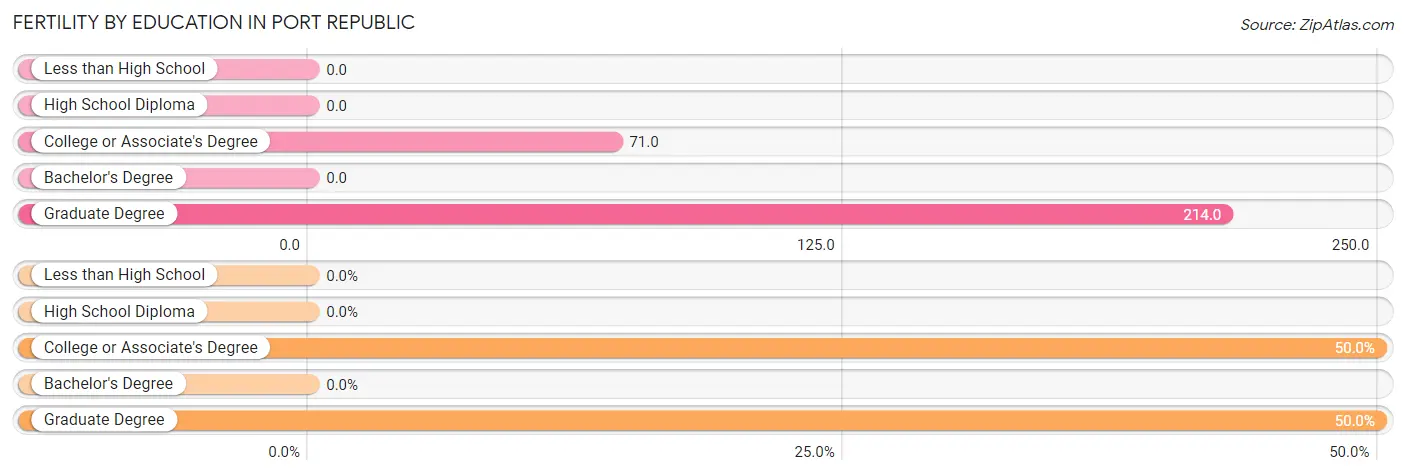
| Educational Attainment | Women with Births | Births / 1,000 Women |
| Less than High School | 0 (0.0%) | 0.0 |
| High School Diploma | 0 (0.0%) | 0.0 |
| College or Associate's Degree | 3 (50.0%) | 71.0 |
| Bachelor's Degree | 0 (0.0%) | 0.0 |
| Graduate Degree | 3 (50.0%) | 214.0 |
| Total | 6 (100.0%) | 44.0 |
Fertility by Education by Marriage Status in Port Republic
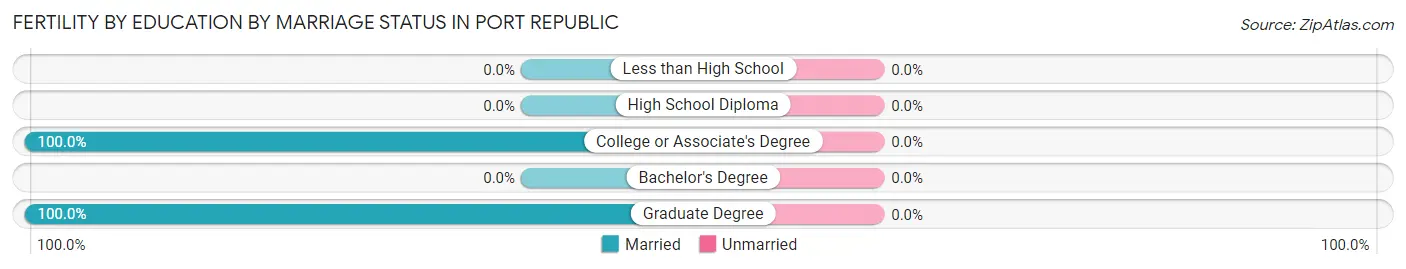
| Educational Attainment | Married | Unmarried |
| Less than High School | 0 (0.0%) | 0 (0.0%) |
| High School Diploma | 0 (0.0%) | 0 (0.0%) |
| College or Associate's Degree | 3 (100.0%) | 0 (0.0%) |
| Bachelor's Degree | 0 (0.0%) | 0 (0.0%) |
| Graduate Degree | 3 (100.0%) | 0 (0.0%) |
| Total | 6 (100.0%) | 0 (0.0%) |
Employment Characteristics in Port Republic
Employment by Class of Employer in Port Republic
Among the 488 employed individuals in Port Republic, private company employees (313 | 64.1%), local government employees (35 | 7.2%), and self-employed (not incorporated) (33 | 6.8%) make up the most common classes of employment.
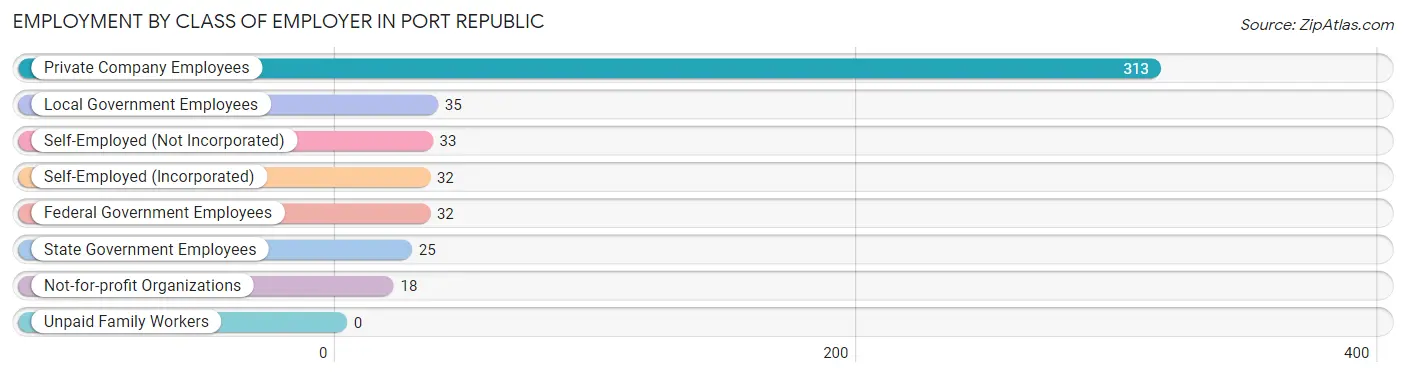
| Employer Class | # Employees | % Employees |
| Private Company Employees | 313 | 64.1% |
| Self-Employed (Incorporated) | 32 | 6.6% |
| Self-Employed (Not Incorporated) | 33 | 6.8% |
| Not-for-profit Organizations | 18 | 3.7% |
| Local Government Employees | 35 | 7.2% |
| State Government Employees | 25 | 5.1% |
| Federal Government Employees | 32 | 6.6% |
| Unpaid Family Workers | 0 | 0.0% |
| Total | 488 | 100.0% |
Employment Status by Age in Port Republic
According to the labor force statistics for Port Republic, out of the total population over 16 years of age (873), 59.5% or 519 individuals are in the labor force, with 4.8% or 25 of them unemployed. The age group with the highest labor force participation rate is 25 to 29 years, with 100.0% or 49 individuals in the labor force. Within the labor force, the 25 to 29 years age range has the highest percentage of unemployed individuals, with 26.5% or 13 of them being unemployed.
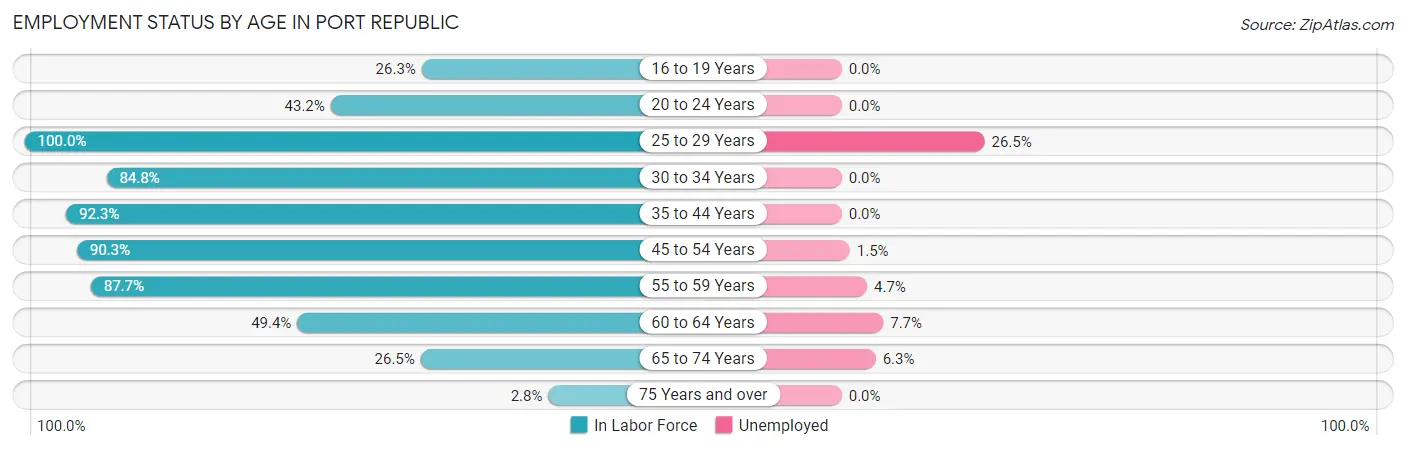
| Age Bracket | In Labor Force | Unemployed |
| 16 to 19 Years | 5 (26.3%) | 0 (0.0%) |
| 20 to 24 Years | 16 (43.2%) | 0 (0.0%) |
| 25 to 29 Years | 49 (100.0%) | 13 (26.5%) |
| 30 to 34 Years | 28 (84.8%) | 0 (0.0%) |
| 35 to 44 Years | 72 (92.3%) | 0 (0.0%) |
| 45 to 54 Years | 195 (90.3%) | 3 (1.5%) |
| 55 to 59 Years | 64 (87.7%) | 3 (4.7%) |
| 60 to 64 Years | 39 (49.4%) | 3 (7.7%) |
| 65 to 74 Years | 48 (26.5%) | 3 (6.3%) |
| 75 Years and over | 3 (2.8%) | 0 (0.0%) |
| Total | 519 (59.5%) | 25 (4.8%) |
Employment Status by Educational Attainment in Port Republic
According to labor force statistics for Port Republic, 84.7% of individuals (447) out of the total population between 25 and 64 years of age (528) are in the labor force, with 5.0% or 22 of them being unemployed. The group with the highest labor force participation rate are those with the educational attainment of college / associate degree, with 96.8% or 184 individuals in the labor force. Within the labor force, individuals with high school diploma education have the highest percentage of unemployment, with 7.4% or 7 of them being unemployed.
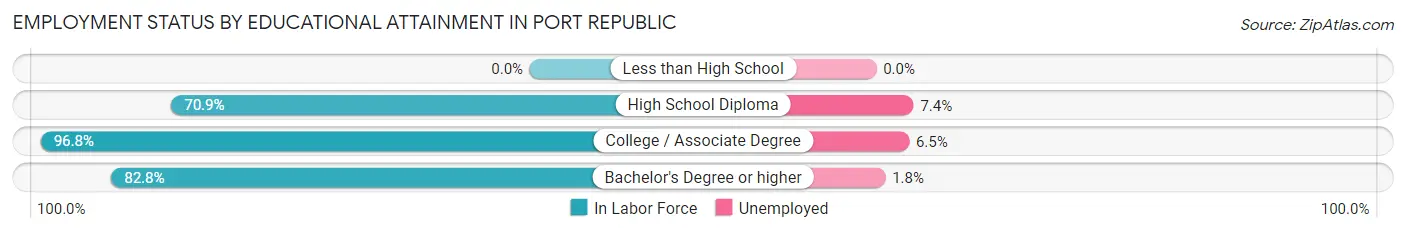
| Educational Attainment | In Labor Force | Unemployed |
| Less than High School | 0 (0.0%) | 0 (0.0%) |
| High School Diploma | 95 (70.9%) | 10 (7.4%) |
| College / Associate Degree | 184 (96.8%) | 12 (6.5%) |
| Bachelor's Degree or higher | 168 (82.8%) | 4 (1.8%) |
| Total | 447 (84.7%) | 26 (5.0%) |
Employment Occupations by Sex in Port Republic
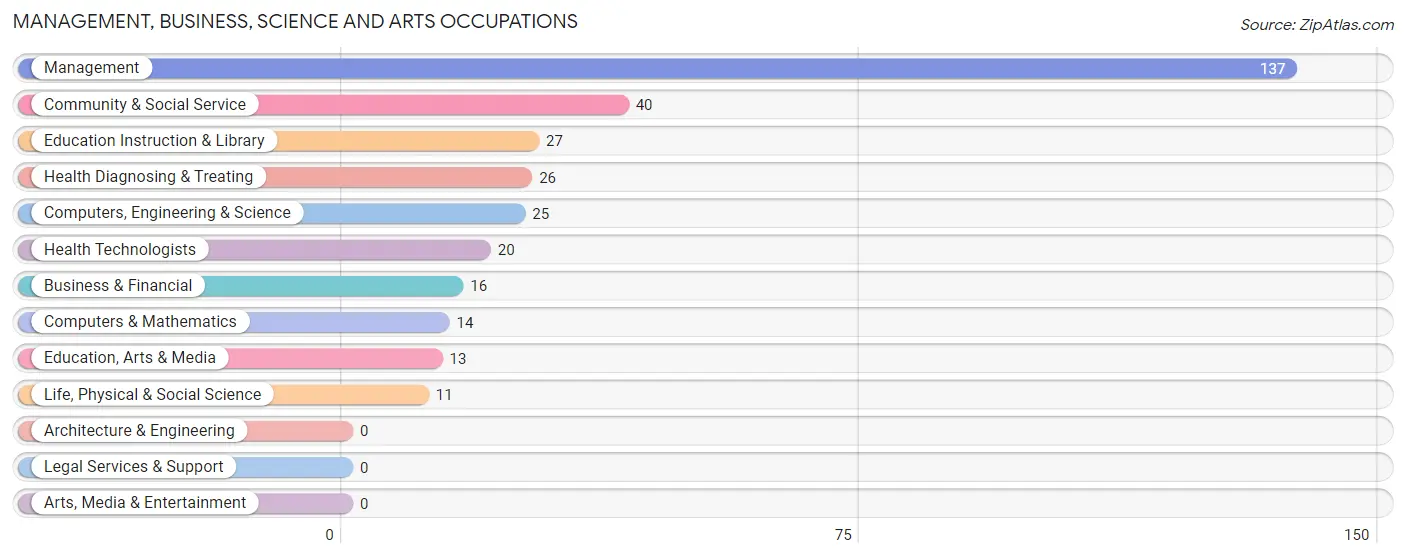
Management, Business, Science and Arts Occupations
The most common Management, Business, Science and Arts occupations in Port Republic are Management (137 | 27.9%), Community & Social Service (40 | 8.2%), Education Instruction & Library (27 | 5.5%), Health Diagnosing & Treating (26 | 5.3%), and Computers, Engineering & Science (25 | 5.1%).
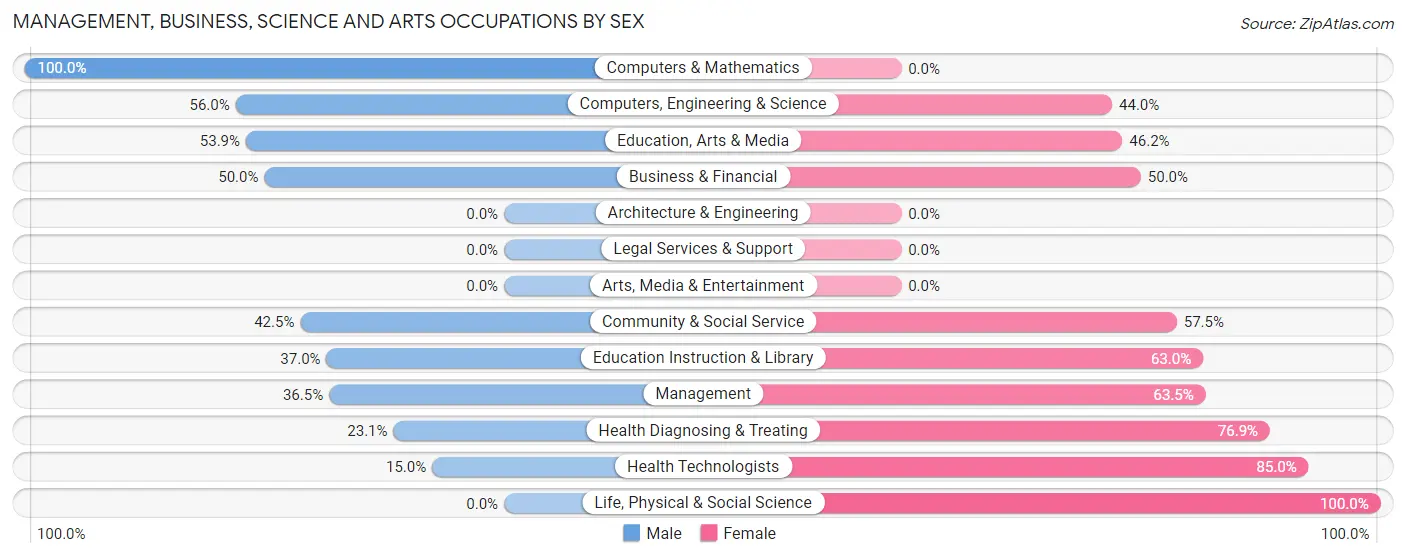
Management, Business, Science and Arts Occupations by Sex
Within the Management, Business, Science and Arts occupations in Port Republic, the most male-oriented occupations are Computers & Mathematics (100.0%), Computers, Engineering & Science (56.0%), and Education, Arts & Media (53.8%), while the most female-oriented occupations are Life, Physical & Social Science (100.0%), Health Technologists (85.0%), and Health Diagnosing & Treating (76.9%).
| Occupation | Male | Female |
| Management | 50 (36.5%) | 87 (63.5%) |
| Business & Financial | 8 (50.0%) | 8 (50.0%) |
| Computers, Engineering & Science | 14 (56.0%) | 11 (44.0%) |
| Computers & Mathematics | 14 (100.0%) | 0 (0.0%) |
| Architecture & Engineering | 0 (0.0%) | 0 (0.0%) |
| Life, Physical & Social Science | 0 (0.0%) | 11 (100.0%) |
| Community & Social Service | 17 (42.5%) | 23 (57.5%) |
| Education, Arts & Media | 7 (53.8%) | 6 (46.2%) |
| Legal Services & Support | 0 (0.0%) | 0 (0.0%) |
| Education Instruction & Library | 10 (37.0%) | 17 (63.0%) |
| Arts, Media & Entertainment | 0 (0.0%) | 0 (0.0%) |
| Health Diagnosing & Treating | 6 (23.1%) | 20 (76.9%) |
| Health Technologists | 3 (15.0%) | 17 (85.0%) |
| Total (Category) | 95 (38.9%) | 149 (61.1%) |
| Total (Overall) | 243 (49.5%) | 248 (50.5%) |
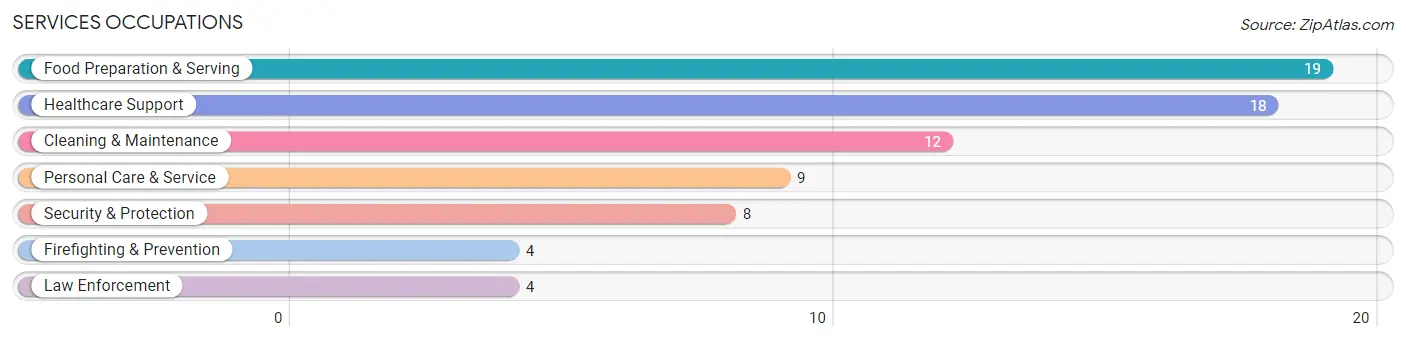
Services Occupations
The most common Services occupations in Port Republic are Food Preparation & Serving (19 | 3.9%), Healthcare Support (18 | 3.7%), Cleaning & Maintenance (12 | 2.4%), Personal Care & Service (9 | 1.8%), and Security & Protection (8 | 1.6%).
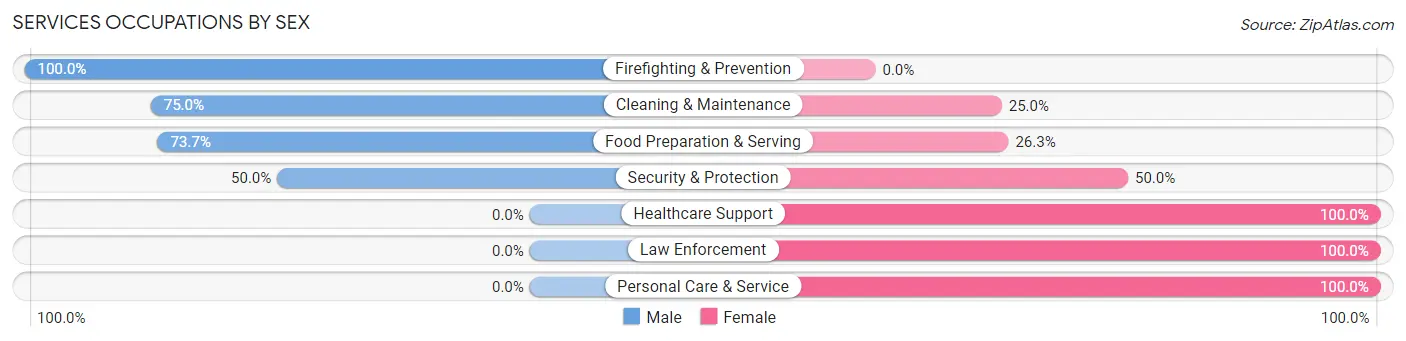
Services Occupations by Sex
Within the Services occupations in Port Republic, the most male-oriented occupations are Firefighting & Prevention (100.0%), Cleaning & Maintenance (75.0%), and Food Preparation & Serving (73.7%), while the most female-oriented occupations are Healthcare Support (100.0%), Law Enforcement (100.0%), and Personal Care & Service (100.0%).
| Occupation | Male | Female |
| Healthcare Support | 0 (0.0%) | 18 (100.0%) |
| Security & Protection | 4 (50.0%) | 4 (50.0%) |
| Firefighting & Prevention | 4 (100.0%) | 0 (0.0%) |
| Law Enforcement | 0 (0.0%) | 4 (100.0%) |
| Food Preparation & Serving | 14 (73.7%) | 5 (26.3%) |
| Cleaning & Maintenance | 9 (75.0%) | 3 (25.0%) |
| Personal Care & Service | 0 (0.0%) | 9 (100.0%) |
| Total (Category) | 27 (40.9%) | 39 (59.1%) |
| Total (Overall) | 243 (49.5%) | 248 (50.5%) |
Sales and Office Occupations
The most common Sales and Office occupations in Port Republic are Sales & Related (48 | 9.8%), and Office & Administration (43 | 8.8%).
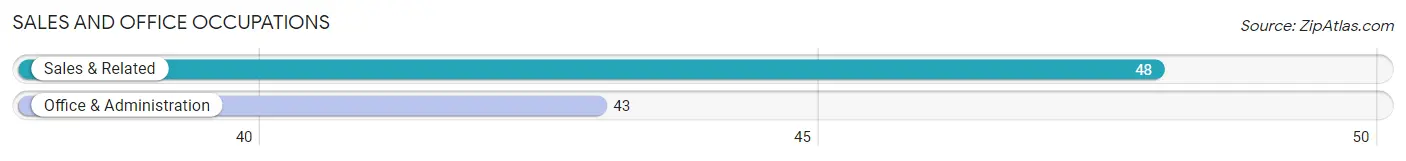
Sales and Office Occupations by Sex
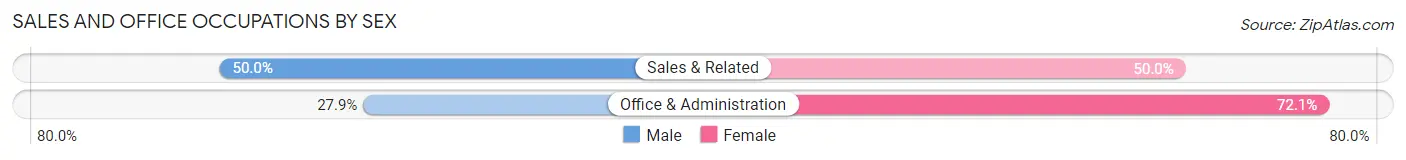
| Occupation | Male | Female |
| Sales & Related | 24 (50.0%) | 24 (50.0%) |
| Office & Administration | 12 (27.9%) | 31 (72.1%) |
| Total (Category) | 36 (39.6%) | 55 (60.4%) |
| Total (Overall) | 243 (49.5%) | 248 (50.5%) |
Natural Resources, Construction and Maintenance Occupations
The most common Natural Resources, Construction and Maintenance occupations in Port Republic are Construction & Extraction (38 | 7.7%), and Installation, Maintenance & Repair (30 | 6.1%).
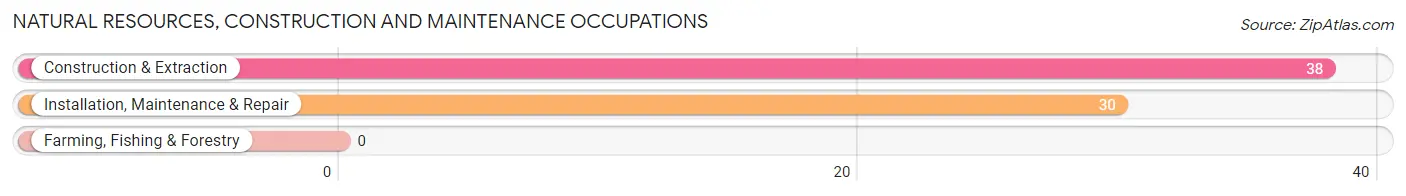
Natural Resources, Construction and Maintenance Occupations by Sex

| Occupation | Male | Female |
| Farming, Fishing & Forestry | 0 (0.0%) | 0 (0.0%) |
| Construction & Extraction | 38 (100.0%) | 0 (0.0%) |
| Installation, Maintenance & Repair | 30 (100.0%) | 0 (0.0%) |
| Total (Category) | 68 (100.0%) | 0 (0.0%) |
| Total (Overall) | 243 (49.5%) | 248 (50.5%) |
Production, Transportation and Moving Occupations
The most common Production, Transportation and Moving occupations in Port Republic are Production (13 | 2.6%), Material Moving (8 | 1.6%), and Transportation (1 | 0.2%).
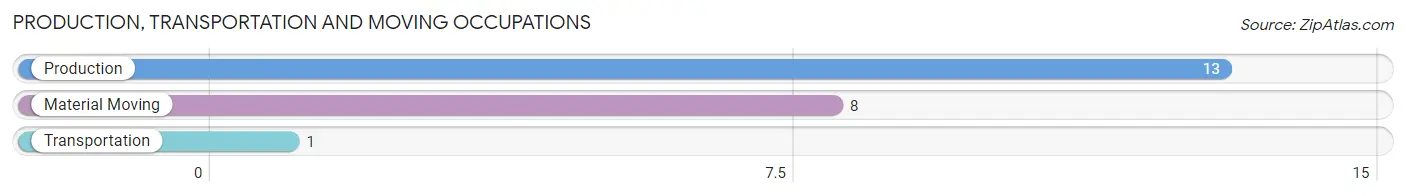
Production, Transportation and Moving Occupations by Sex
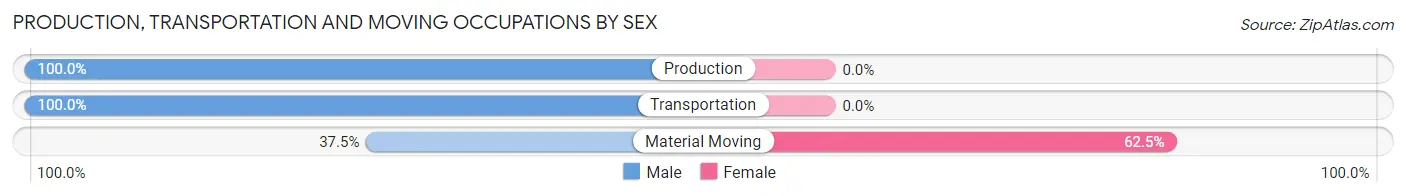
| Occupation | Male | Female |
| Production | 13 (100.0%) | 0 (0.0%) |
| Transportation | 1 (100.0%) | 0 (0.0%) |
| Material Moving | 3 (37.5%) | 5 (62.5%) |
| Total (Category) | 17 (77.3%) | 5 (22.7%) |
| Total (Overall) | 243 (49.5%) | 248 (50.5%) |
Employment Industries by Sex in Port Republic
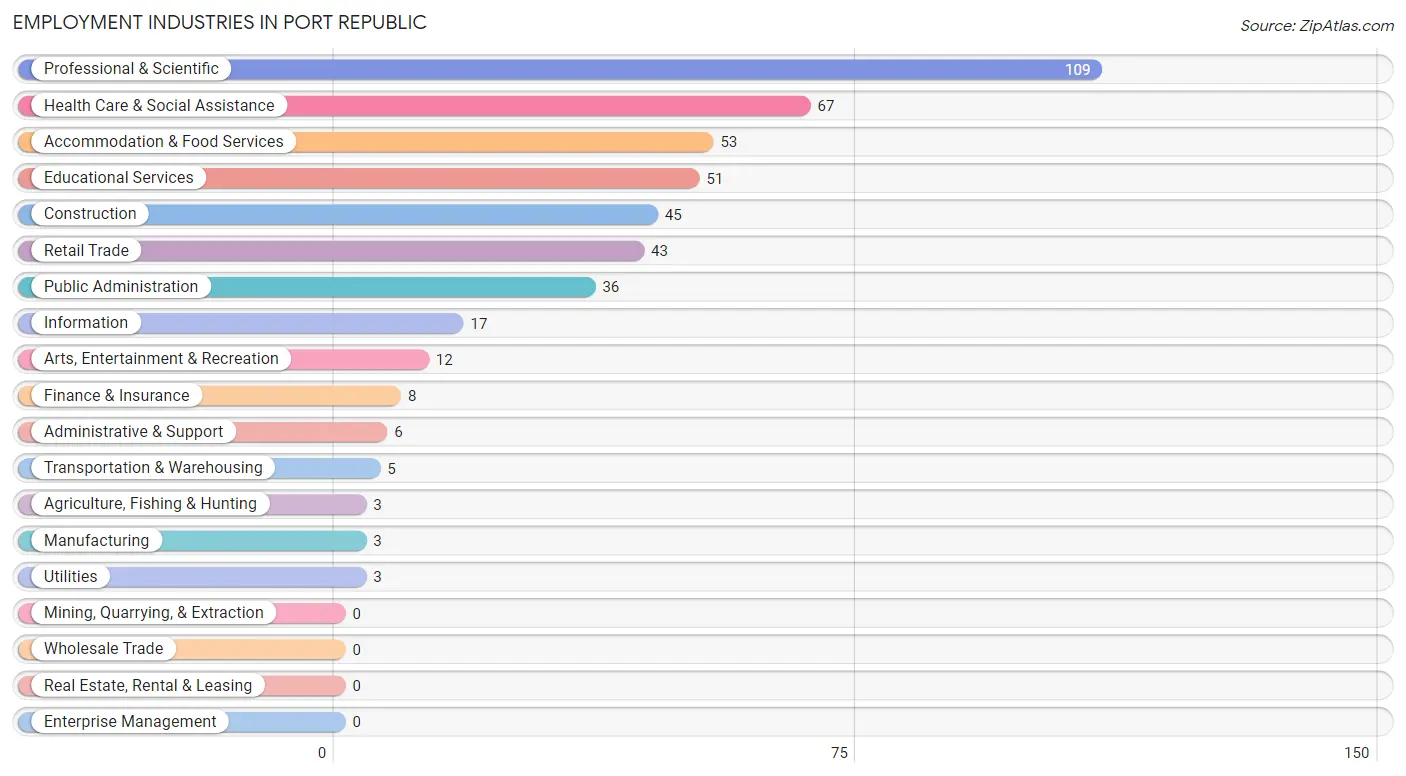
Employment Industries in Port Republic
The major employment industries in Port Republic include Professional & Scientific (109 | 22.2%), Health Care & Social Assistance (67 | 13.7%), Accommodation & Food Services (53 | 10.8%), Educational Services (51 | 10.4%), and Construction (45 | 9.2%).
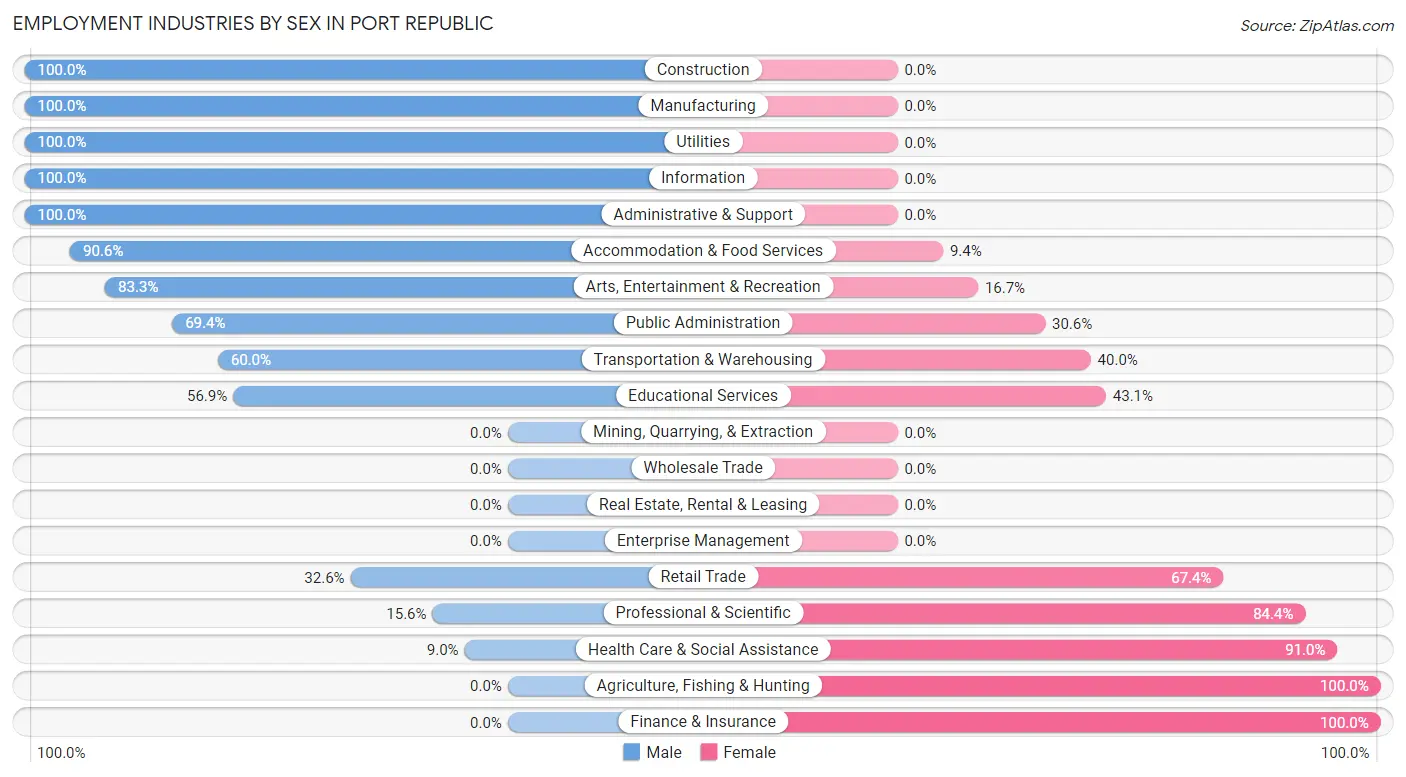
Employment Industries by Sex in Port Republic
The Port Republic industries that see more men than women are Construction (100.0%), Manufacturing (100.0%), and Utilities (100.0%), whereas the industries that tend to have a higher number of women are Agriculture, Fishing & Hunting (100.0%), Finance & Insurance (100.0%), and Health Care & Social Assistance (91.0%).
| Industry | Male | Female |
| Agriculture, Fishing & Hunting | 0 (0.0%) | 3 (100.0%) |
| Mining, Quarrying, & Extraction | 0 (0.0%) | 0 (0.0%) |
| Construction | 45 (100.0%) | 0 (0.0%) |
| Manufacturing | 3 (100.0%) | 0 (0.0%) |
| Wholesale Trade | 0 (0.0%) | 0 (0.0%) |
| Retail Trade | 14 (32.6%) | 29 (67.4%) |
| Transportation & Warehousing | 3 (60.0%) | 2 (40.0%) |
| Utilities | 3 (100.0%) | 0 (0.0%) |
| Information | 17 (100.0%) | 0 (0.0%) |
| Finance & Insurance | 0 (0.0%) | 8 (100.0%) |
| Real Estate, Rental & Leasing | 0 (0.0%) | 0 (0.0%) |
| Professional & Scientific | 17 (15.6%) | 92 (84.4%) |
| Enterprise Management | 0 (0.0%) | 0 (0.0%) |
| Administrative & Support | 6 (100.0%) | 0 (0.0%) |
| Educational Services | 29 (56.9%) | 22 (43.1%) |
| Health Care & Social Assistance | 6 (9.0%) | 61 (91.0%) |
| Arts, Entertainment & Recreation | 10 (83.3%) | 2 (16.7%) |
| Accommodation & Food Services | 48 (90.6%) | 5 (9.4%) |
| Public Administration | 25 (69.4%) | 11 (30.6%) |
| Total | 243 (49.5%) | 248 (50.5%) |
Education in Port Republic
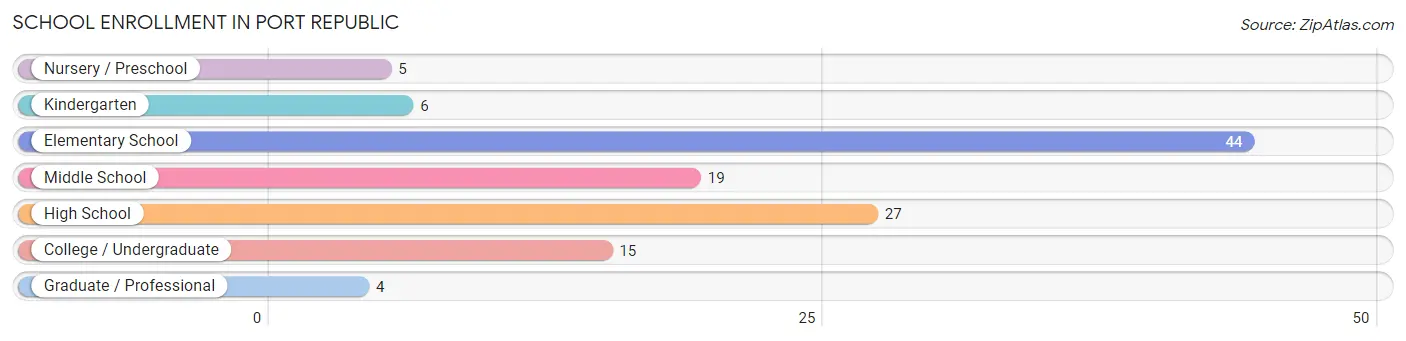
School Enrollment in Port Republic
The most common levels of schooling among the 120 students in Port Republic are elementary school (44 | 36.7%), high school (27 | 22.5%), and middle school (19 | 15.8%).
| School Level | # Students | % Students |
| Nursery / Preschool | 5 | 4.2% |
| Kindergarten | 6 | 5.0% |
| Elementary School | 44 | 36.7% |
| Middle School | 19 | 15.8% |
| High School | 27 | 22.5% |
| College / Undergraduate | 15 | 12.5% |
| Graduate / Professional | 4 | 3.3% |
| Total | 120 | 100.0% |
School Enrollment by Age by Funding Source in Port Republic
Out of a total of 120 students who are enrolled in schools in Port Republic, 44 (36.7%) attend a private institution, while the remaining 76 (63.3%) are enrolled in public schools. The age group of 15 to 17 year olds has the highest likelihood of being enrolled in private schools, with 22 (100.0% in the age bracket) enrolled. Conversely, the age group of 25 to 34 year olds has the lowest likelihood of being enrolled in a private school, with 8 (100.0% in the age bracket) attending a public institution.
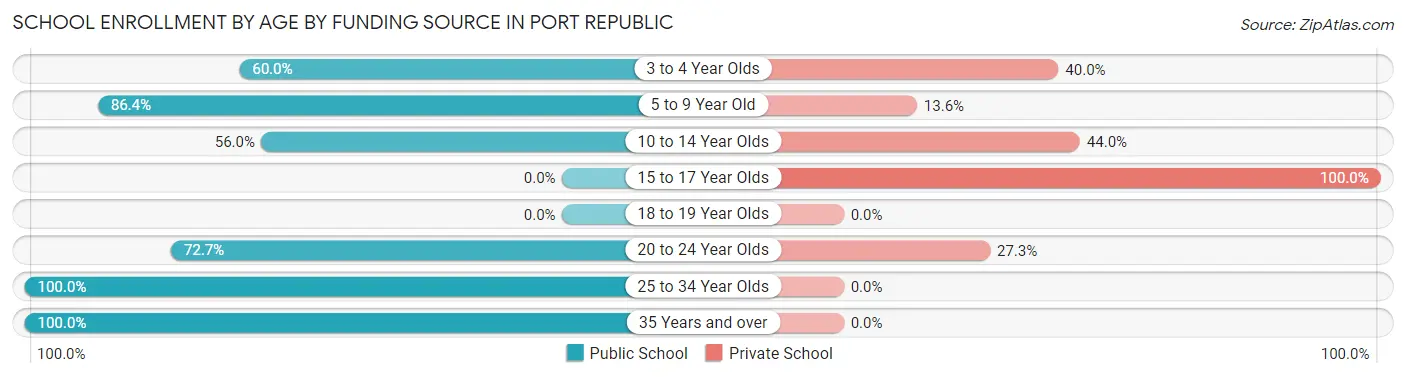
| Age Bracket | Public School | Private School |
| 3 to 4 Year Olds | 3 (60.0%) | 2 (40.0%) |
| 5 to 9 Year Old | 38 (86.4%) | 6 (13.6%) |
| 10 to 14 Year Olds | 14 (56.0%) | 11 (44.0%) |
| 15 to 17 Year Olds | 0 (0.0%) | 22 (100.0%) |
| 18 to 19 Year Olds | 0 (0.0%) | 0 (0.0%) |
| 20 to 24 Year Olds | 8 (72.7%) | 3 (27.3%) |
| 25 to 34 Year Olds | 8 (100.0%) | 0 (0.0%) |
| 35 Years and over | 5 (100.0%) | 0 (0.0%) |
| Total | 76 (63.3%) | 44 (36.7%) |
Educational Attainment by Field of Study in Port Republic
Business (66 | 21.8%), education (61 | 20.2%), computers & mathematics (32 | 10.6%), literature & languages (29 | 9.6%), and psychology (24 | 8.0%) are the most common fields of study among 302 individuals in Port Republic who have obtained a bachelor's degree or higher.
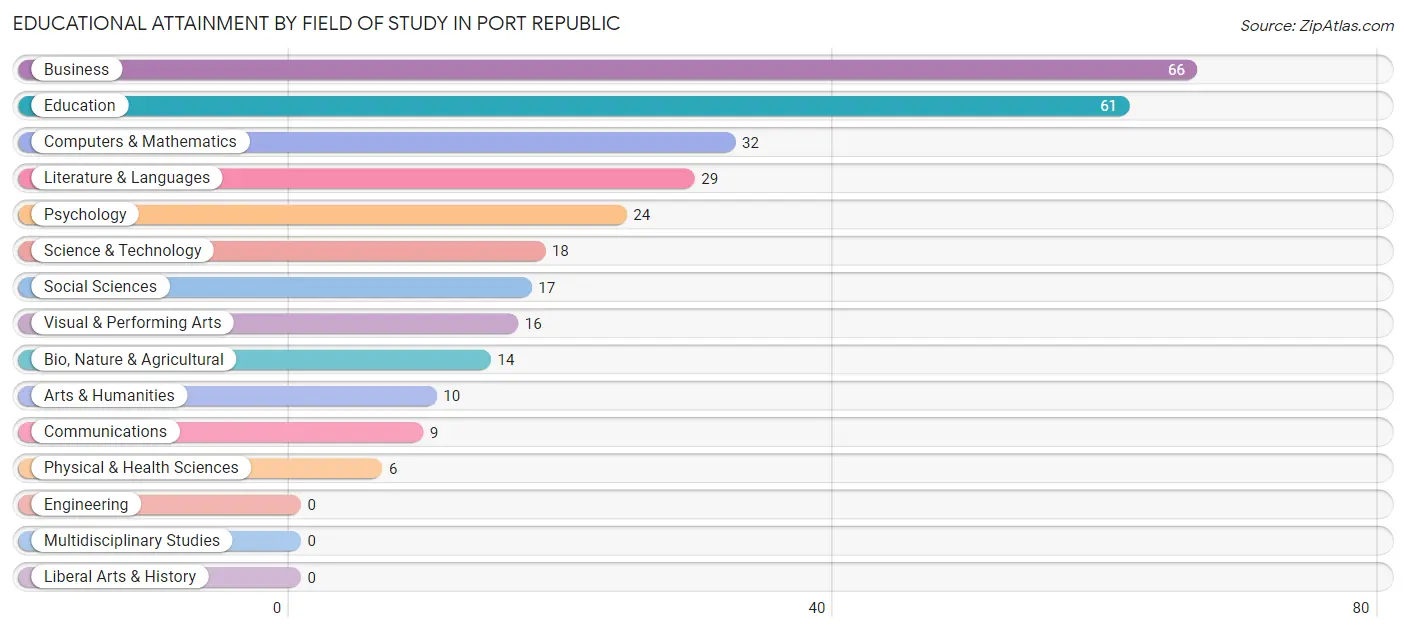
| Field of Study | # Graduates | % Graduates |
| Computers & Mathematics | 32 | 10.6% |
| Bio, Nature & Agricultural | 14 | 4.6% |
| Physical & Health Sciences | 6 | 2.0% |
| Psychology | 24 | 8.0% |
| Social Sciences | 17 | 5.6% |
| Engineering | 0 | 0.0% |
| Multidisciplinary Studies | 0 | 0.0% |
| Science & Technology | 18 | 6.0% |
| Business | 66 | 21.8% |
| Education | 61 | 20.2% |
| Literature & Languages | 29 | 9.6% |
| Liberal Arts & History | 0 | 0.0% |
| Visual & Performing Arts | 16 | 5.3% |
| Communications | 9 | 3.0% |
| Arts & Humanities | 10 | 3.3% |
| Total | 302 | 100.0% |
Transportation & Commute in Port Republic
Vehicle Availability by Sex in Port Republic
The most prevalent vehicle ownership categories in Port Republic are males with 3 vehicles (99, accounting for 40.2%) and females with 3 vehicles (139, making up 40.9%).
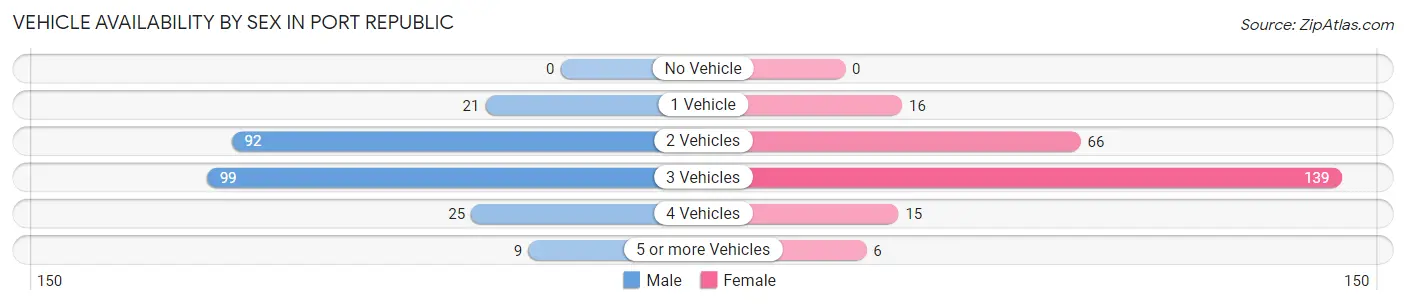
| Vehicles Available | Male | Female |
| No Vehicle | 0 (0.0%) | 0 (0.0%) |
| 1 Vehicle | 21 (8.5%) | 16 (6.6%) |
| 2 Vehicles | 92 (37.4%) | 66 (27.3%) |
| 3 Vehicles | 99 (40.2%) | 139 (57.4%) |
| 4 Vehicles | 25 (10.2%) | 15 (6.2%) |
| 5 or more Vehicles | 9 (3.7%) | 6 (2.5%) |
| Total | 246 (100.0%) | 242 (100.0%) |
Commute Time in Port Republic
The most frequently occuring commute durations in Port Republic are 30 to 34 minutes (190 commuters, 41.5%), 20 to 24 minutes (90 commuters, 19.7%), and 15 to 19 minutes (62 commuters, 13.5%).
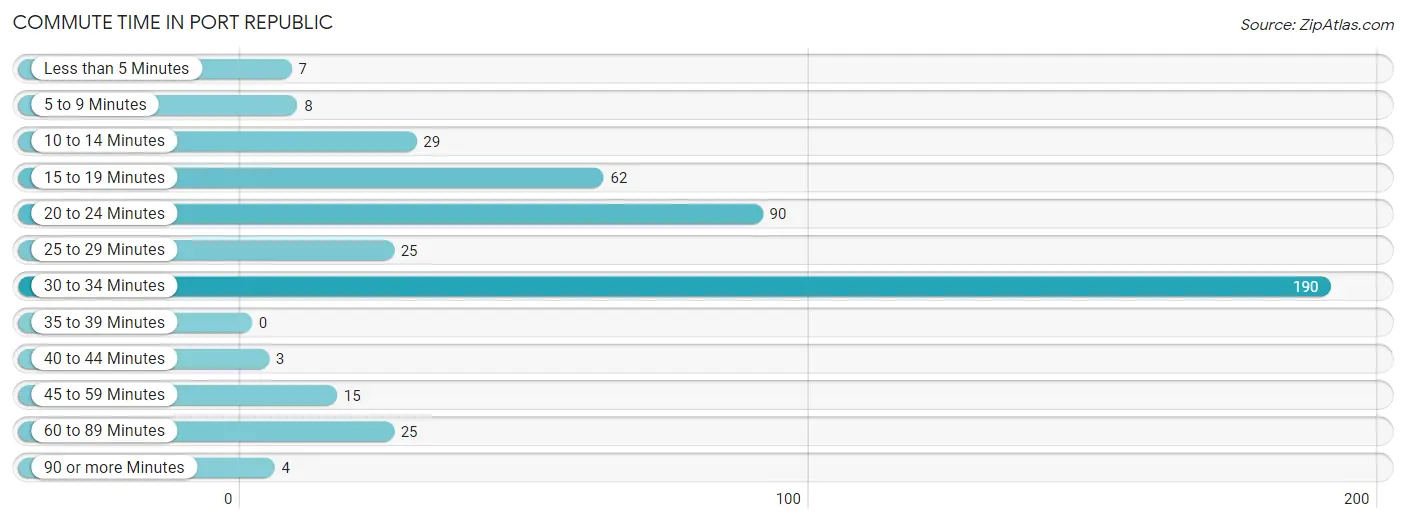
| Commute Time | # Commuters | % Commuters |
| Less than 5 Minutes | 7 | 1.5% |
| 5 to 9 Minutes | 8 | 1.8% |
| 10 to 14 Minutes | 29 | 6.3% |
| 15 to 19 Minutes | 62 | 13.5% |
| 20 to 24 Minutes | 90 | 19.7% |
| 25 to 29 Minutes | 25 | 5.5% |
| 30 to 34 Minutes | 190 | 41.5% |
| 35 to 39 Minutes | 0 | 0.0% |
| 40 to 44 Minutes | 3 | 0.7% |
| 45 to 59 Minutes | 15 | 3.3% |
| 60 to 89 Minutes | 25 | 5.5% |
| 90 or more Minutes | 4 | 0.9% |
Commute Time by Sex in Port Republic
The most common commute times in Port Republic are 30 to 34 minutes (78 commuters, 35.3%) for males and 30 to 34 minutes (112 commuters, 47.3%) for females.
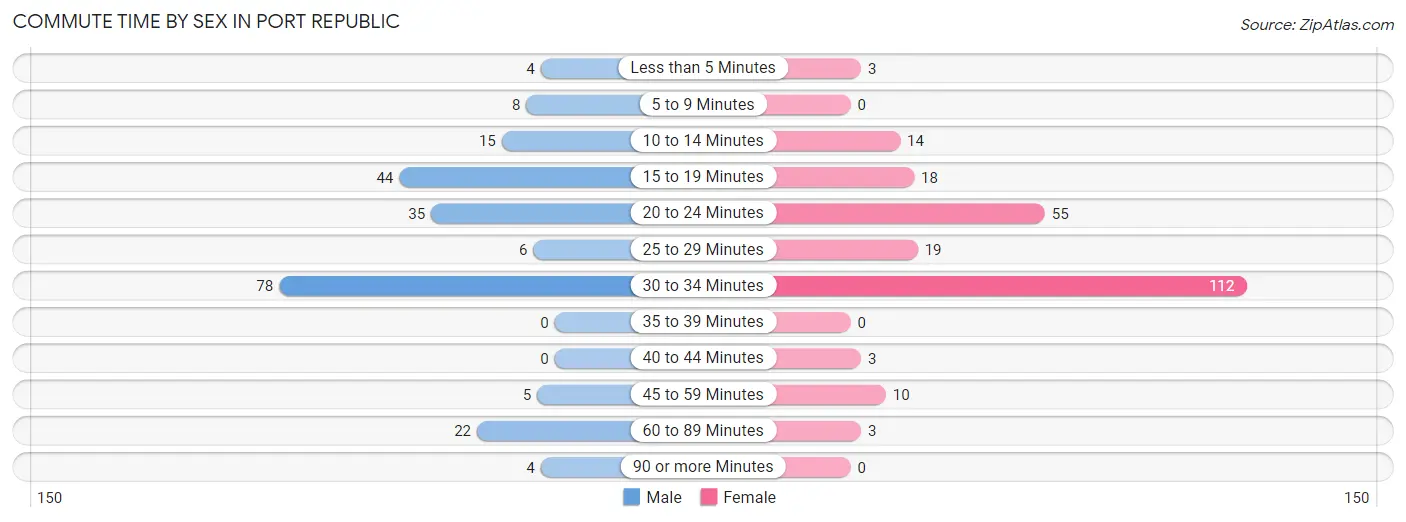
| Commute Time | Male | Female |
| Less than 5 Minutes | 4 (1.8%) | 3 (1.3%) |
| 5 to 9 Minutes | 8 (3.6%) | 0 (0.0%) |
| 10 to 14 Minutes | 15 (6.8%) | 14 (5.9%) |
| 15 to 19 Minutes | 44 (19.9%) | 18 (7.6%) |
| 20 to 24 Minutes | 35 (15.8%) | 55 (23.2%) |
| 25 to 29 Minutes | 6 (2.7%) | 19 (8.0%) |
| 30 to 34 Minutes | 78 (35.3%) | 112 (47.3%) |
| 35 to 39 Minutes | 0 (0.0%) | 0 (0.0%) |
| 40 to 44 Minutes | 0 (0.0%) | 3 (1.3%) |
| 45 to 59 Minutes | 5 (2.3%) | 10 (4.2%) |
| 60 to 89 Minutes | 22 (10.0%) | 3 (1.3%) |
| 90 or more Minutes | 4 (1.8%) | 0 (0.0%) |
Time of Departure to Work by Sex in Port Republic
The most frequent times of departure to work in Port Republic are 8:00 AM to 8:29 AM (44, 19.9%) for males and 8:30 AM to 8:59 AM (120, 50.6%) for females.
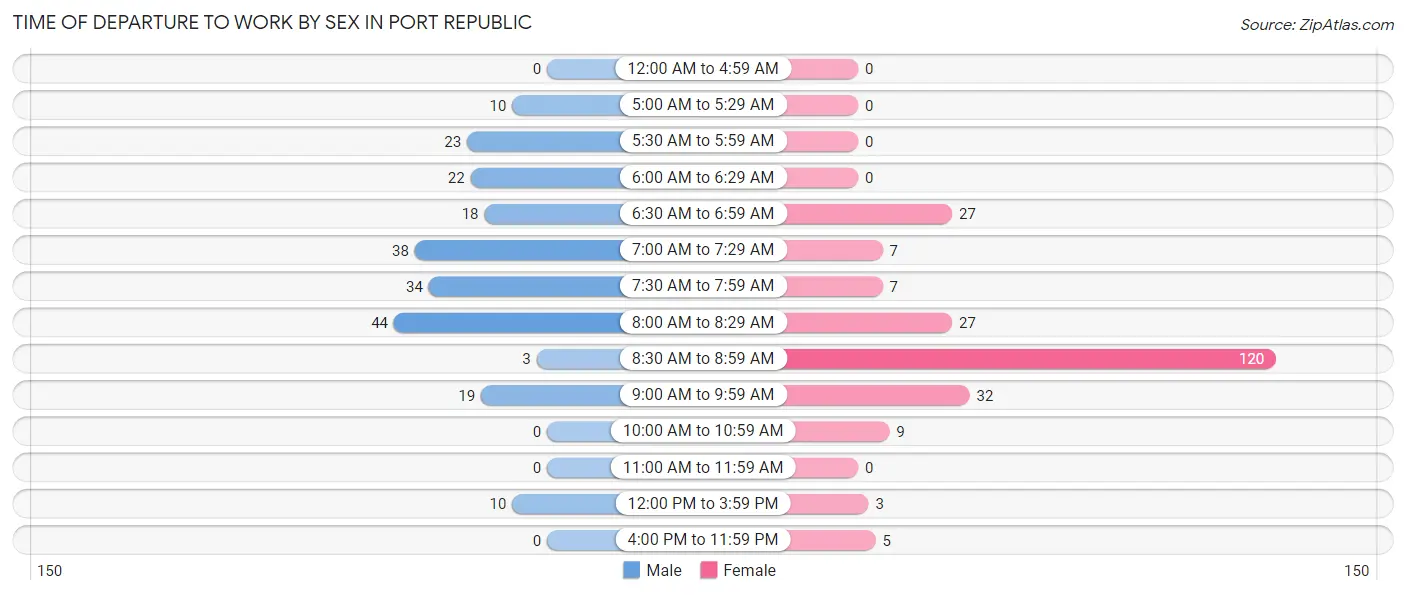
| Time of Departure | Male | Female |
| 12:00 AM to 4:59 AM | 0 (0.0%) | 0 (0.0%) |
| 5:00 AM to 5:29 AM | 10 (4.5%) | 0 (0.0%) |
| 5:30 AM to 5:59 AM | 23 (10.4%) | 0 (0.0%) |
| 6:00 AM to 6:29 AM | 22 (10.0%) | 0 (0.0%) |
| 6:30 AM to 6:59 AM | 18 (8.1%) | 27 (11.4%) |
| 7:00 AM to 7:29 AM | 38 (17.2%) | 7 (2.9%) |
| 7:30 AM to 7:59 AM | 34 (15.4%) | 7 (2.9%) |
| 8:00 AM to 8:29 AM | 44 (19.9%) | 27 (11.4%) |
| 8:30 AM to 8:59 AM | 3 (1.4%) | 120 (50.6%) |
| 9:00 AM to 9:59 AM | 19 (8.6%) | 32 (13.5%) |
| 10:00 AM to 10:59 AM | 0 (0.0%) | 9 (3.8%) |
| 11:00 AM to 11:59 AM | 0 (0.0%) | 0 (0.0%) |
| 12:00 PM to 3:59 PM | 10 (4.5%) | 3 (1.3%) |
| 4:00 PM to 11:59 PM | 0 (0.0%) | 5 (2.1%) |
| Total | 221 (100.0%) | 237 (100.0%) |
Housing Occupancy in Port Republic
Occupancy by Ownership in Port Republic
Of the total 434 dwellings in Port Republic, owner-occupied units account for 423 (97.5%), while renter-occupied units make up 11 (2.5%).
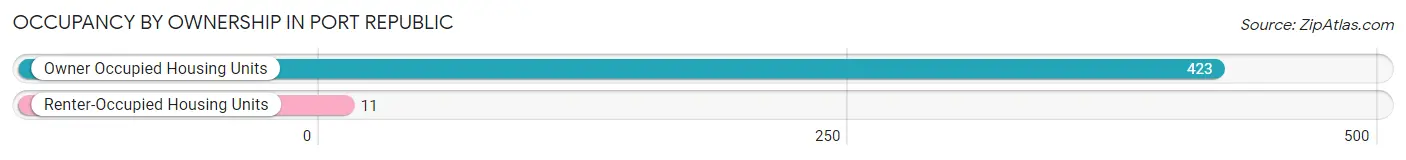
| Occupancy | # Housing Units | % Housing Units |
| Owner Occupied Housing Units | 423 | 97.5% |
| Renter-Occupied Housing Units | 11 | 2.5% |
| Total Occupied Housing Units | 434 | 100.0% |
Occupancy by Household Size in Port Republic
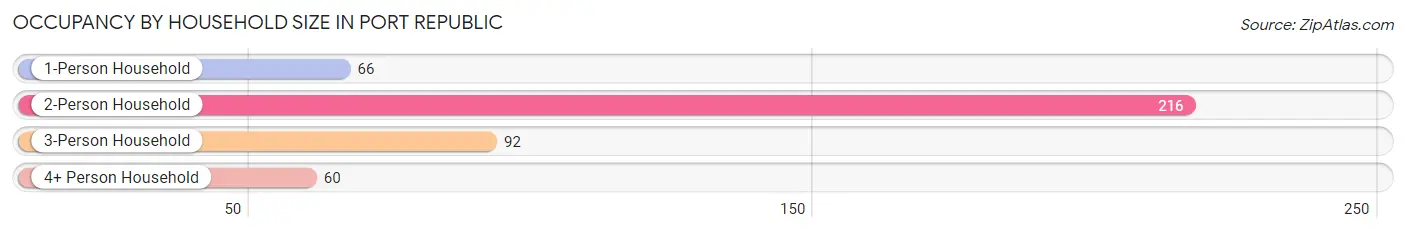
| Household Size | # Housing Units | % Housing Units |
| 1-Person Household | 66 | 15.2% |
| 2-Person Household | 216 | 49.8% |
| 3-Person Household | 92 | 21.2% |
| 4+ Person Household | 60 | 13.8% |
| Total Housing Units | 434 | 100.0% |
Occupancy by Ownership by Household Size in Port Republic
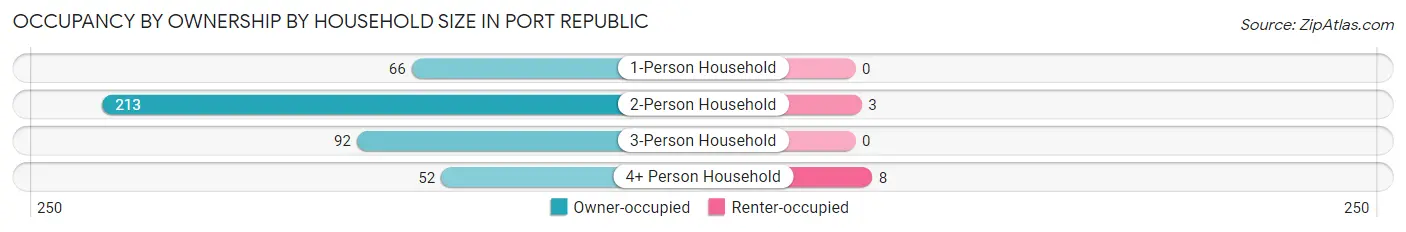
| Household Size | Owner-occupied | Renter-occupied |
| 1-Person Household | 66 (100.0%) | 0 (0.0%) |
| 2-Person Household | 213 (98.6%) | 3 (1.4%) |
| 3-Person Household | 92 (100.0%) | 0 (0.0%) |
| 4+ Person Household | 52 (86.7%) | 8 (13.3%) |
| Total Housing Units | 423 (97.5%) | 11 (2.5%) |
Occupancy by Educational Attainment in Port Republic
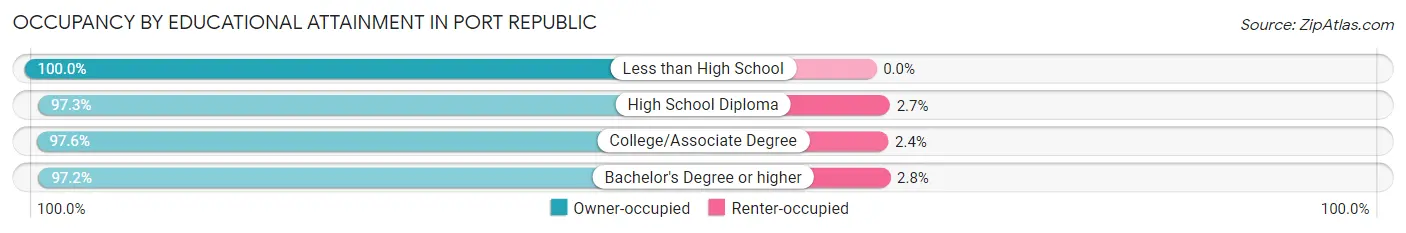
| Household Size | Owner-occupied | Renter-occupied |
| Less than High School | 8 (100.0%) | 0 (0.0%) |
| High School Diploma | 109 (97.3%) | 3 (2.7%) |
| College/Associate Degree | 165 (97.6%) | 4 (2.4%) |
| Bachelor's Degree or higher | 141 (97.2%) | 4 (2.8%) |
Occupancy by Age of Householder in Port Republic
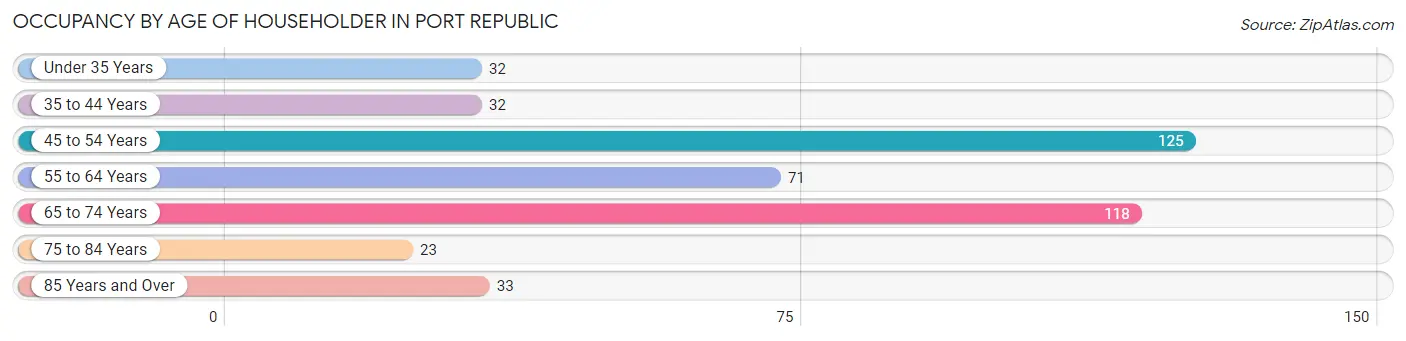
| Age Bracket | # Households | % Households |
| Under 35 Years | 32 | 7.4% |
| 35 to 44 Years | 32 | 7.4% |
| 45 to 54 Years | 125 | 28.8% |
| 55 to 64 Years | 71 | 16.4% |
| 65 to 74 Years | 118 | 27.2% |
| 75 to 84 Years | 23 | 5.3% |
| 85 Years and Over | 33 | 7.6% |
| Total | 434 | 100.0% |
Housing Finances in Port Republic
Median Income by Occupancy in Port Republic
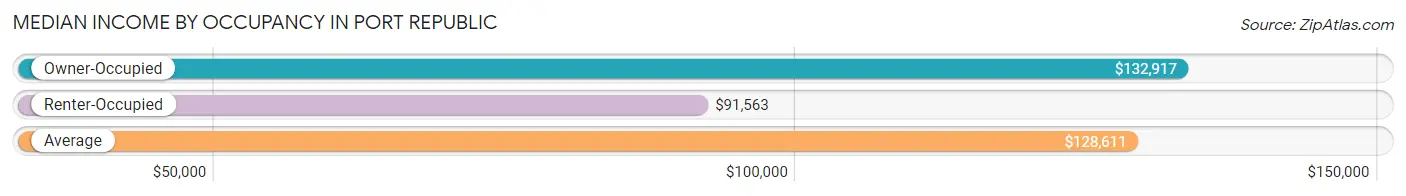
| Occupancy Type | # Households | Median Income |
| Owner-Occupied | 423 (97.5%) | $132,917 |
| Renter-Occupied | 11 (2.5%) | $91,563 |
| Average | 434 (100.0%) | $128,611 |
Occupancy by Householder Income Bracket in Port Republic
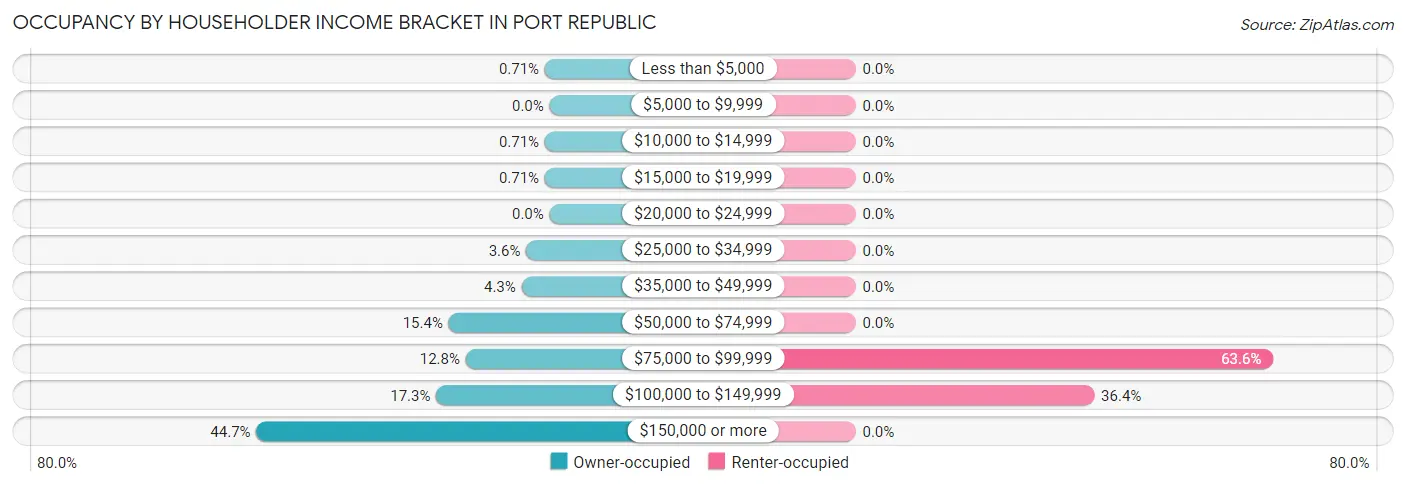
| Income Bracket | Owner-occupied | Renter-occupied |
| Less than $5,000 | 3 (0.7%) | 0 (0.0%) |
| $5,000 to $9,999 | 0 (0.0%) | 0 (0.0%) |
| $10,000 to $14,999 | 3 (0.7%) | 0 (0.0%) |
| $15,000 to $19,999 | 3 (0.7%) | 0 (0.0%) |
| $20,000 to $24,999 | 0 (0.0%) | 0 (0.0%) |
| $25,000 to $34,999 | 15 (3.5%) | 0 (0.0%) |
| $35,000 to $49,999 | 18 (4.3%) | 0 (0.0%) |
| $50,000 to $74,999 | 65 (15.4%) | 0 (0.0%) |
| $75,000 to $99,999 | 54 (12.8%) | 7 (63.6%) |
| $100,000 to $149,999 | 73 (17.3%) | 4 (36.4%) |
| $150,000 or more | 189 (44.7%) | 0 (0.0%) |
| Total | 423 (100.0%) | 11 (100.0%) |
Monthly Housing Cost Tiers in Port Republic
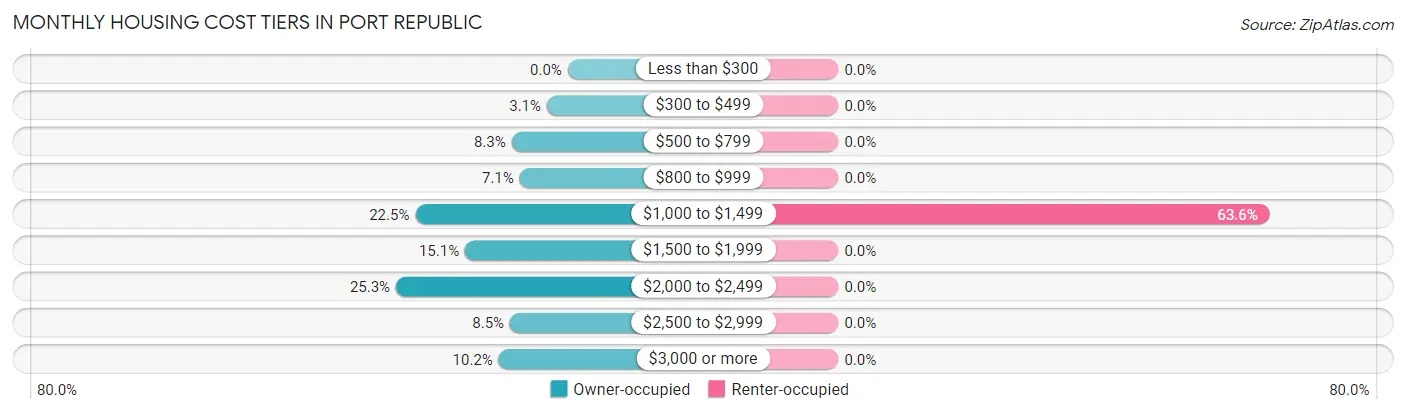
| Monthly Cost | Owner-occupied | Renter-occupied |
| Less than $300 | 0 (0.0%) | 0 (0.0%) |
| $300 to $499 | 13 (3.1%) | 0 (0.0%) |
| $500 to $799 | 35 (8.3%) | 0 (0.0%) |
| $800 to $999 | 30 (7.1%) | 0 (0.0%) |
| $1,000 to $1,499 | 95 (22.5%) | 7 (63.6%) |
| $1,500 to $1,999 | 64 (15.1%) | 0 (0.0%) |
| $2,000 to $2,499 | 107 (25.3%) | 0 (0.0%) |
| $2,500 to $2,999 | 36 (8.5%) | 0 (0.0%) |
| $3,000 or more | 43 (10.2%) | 0 (0.0%) |
| Total | 423 (100.0%) | 11 (100.0%) |
Physical Housing Characteristics in Port Republic
Housing Structures in Port Republic
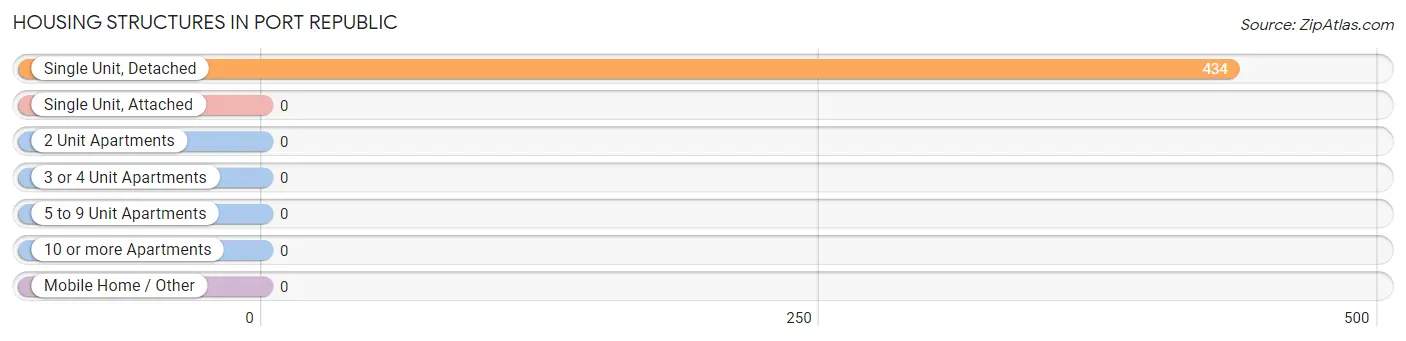
| Structure Type | # Housing Units | % Housing Units |
| Single Unit, Detached | 434 | 100.0% |
| Single Unit, Attached | 0 | 0.0% |
| 2 Unit Apartments | 0 | 0.0% |
| 3 or 4 Unit Apartments | 0 | 0.0% |
| 5 to 9 Unit Apartments | 0 | 0.0% |
| 10 or more Apartments | 0 | 0.0% |
| Mobile Home / Other | 0 | 0.0% |
| Total | 434 | 100.0% |
Housing Structures by Occupancy in Port Republic
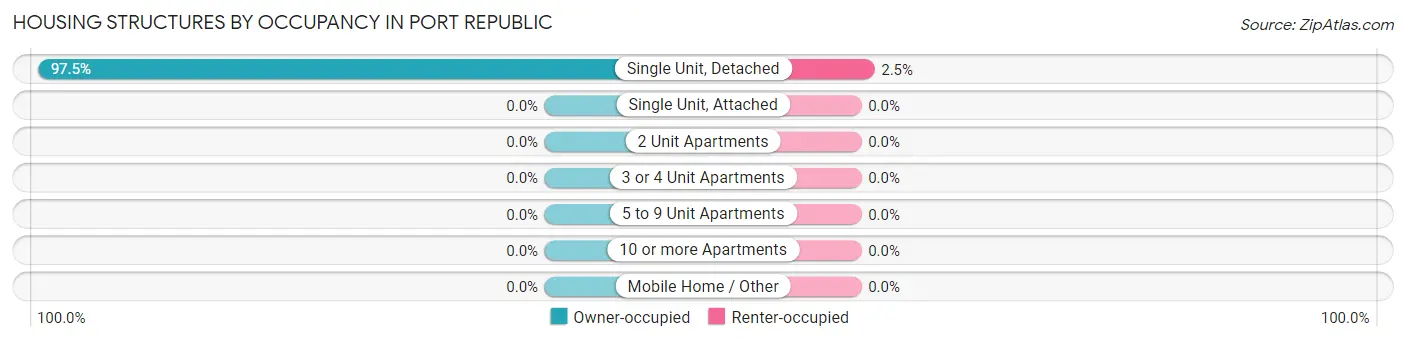
| Structure Type | Owner-occupied | Renter-occupied |
| Single Unit, Detached | 423 (97.5%) | 11 (2.5%) |
| Single Unit, Attached | 0 (0.0%) | 0 (0.0%) |
| 2 Unit Apartments | 0 (0.0%) | 0 (0.0%) |
| 3 or 4 Unit Apartments | 0 (0.0%) | 0 (0.0%) |
| 5 to 9 Unit Apartments | 0 (0.0%) | 0 (0.0%) |
| 10 or more Apartments | 0 (0.0%) | 0 (0.0%) |
| Mobile Home / Other | 0 (0.0%) | 0 (0.0%) |
| Total | 423 (97.5%) | 11 (2.5%) |
Housing Structures by Number of Rooms in Port Republic
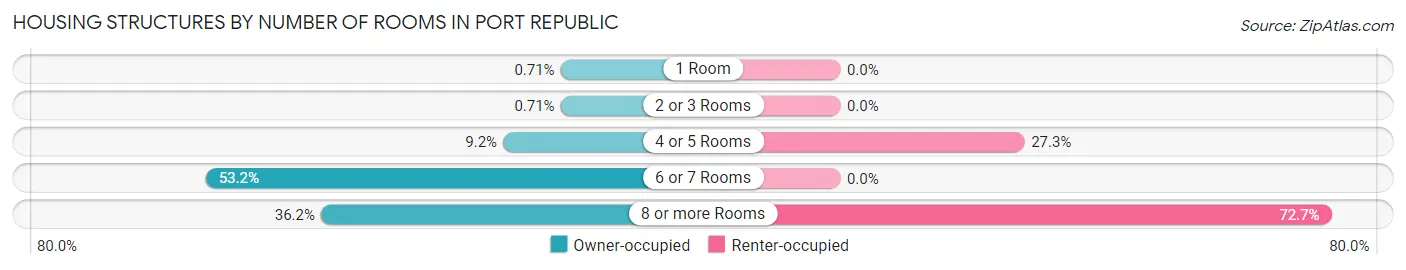
| Number of Rooms | Owner-occupied | Renter-occupied |
| 1 Room | 3 (0.7%) | 0 (0.0%) |
| 2 or 3 Rooms | 3 (0.7%) | 0 (0.0%) |
| 4 or 5 Rooms | 39 (9.2%) | 3 (27.3%) |
| 6 or 7 Rooms | 225 (53.2%) | 0 (0.0%) |
| 8 or more Rooms | 153 (36.2%) | 8 (72.7%) |
| Total | 423 (100.0%) | 11 (100.0%) |
Housing Structure by Heating Type in Port Republic
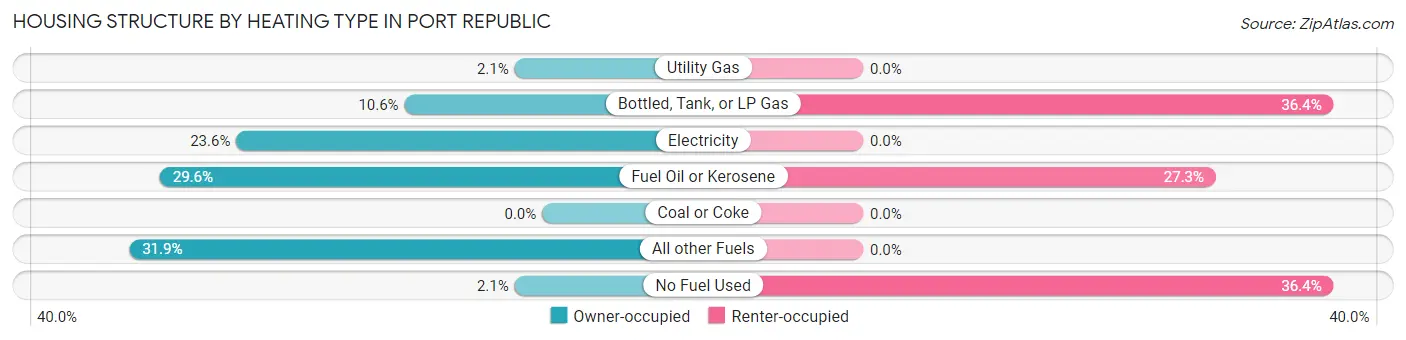
| Heating Type | Owner-occupied | Renter-occupied |
| Utility Gas | 9 (2.1%) | 0 (0.0%) |
| Bottled, Tank, or LP Gas | 45 (10.6%) | 4 (36.4%) |
| Electricity | 100 (23.6%) | 0 (0.0%) |
| Fuel Oil or Kerosene | 125 (29.5%) | 3 (27.3%) |
| Coal or Coke | 0 (0.0%) | 0 (0.0%) |
| All other Fuels | 135 (31.9%) | 0 (0.0%) |
| No Fuel Used | 9 (2.1%) | 4 (36.4%) |
| Total | 423 (100.0%) | 11 (100.0%) |
Household Vehicle Usage in Port Republic
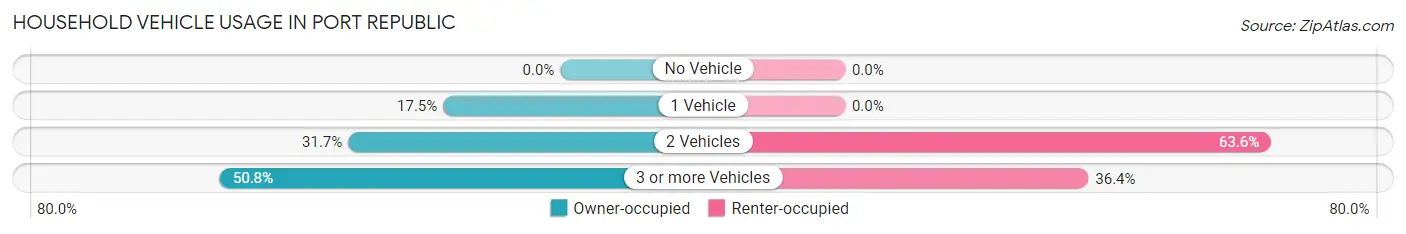
| Vehicles per Household | Owner-occupied | Renter-occupied |
| No Vehicle | 0 (0.0%) | 0 (0.0%) |
| 1 Vehicle | 74 (17.5%) | 0 (0.0%) |
| 2 Vehicles | 134 (31.7%) | 7 (63.6%) |
| 3 or more Vehicles | 215 (50.8%) | 4 (36.4%) |
| Total | 423 (100.0%) | 11 (100.0%) |
Real Estate & Mortgages in Port Republic
Real Estate and Mortgage Overview in Port Republic
| Characteristic | Without Mortgage | With Mortgage |
| Housing Units | 157 | 266 |
| Median Property Value | $277,600 | $444,000 |
| Median Household Income | $98,542 | $144 |
| Monthly Housing Costs | $1,003 | $43 |
| Real Estate Taxes | $6,368 | $0 |
Property Value by Mortgage Status in Port Republic
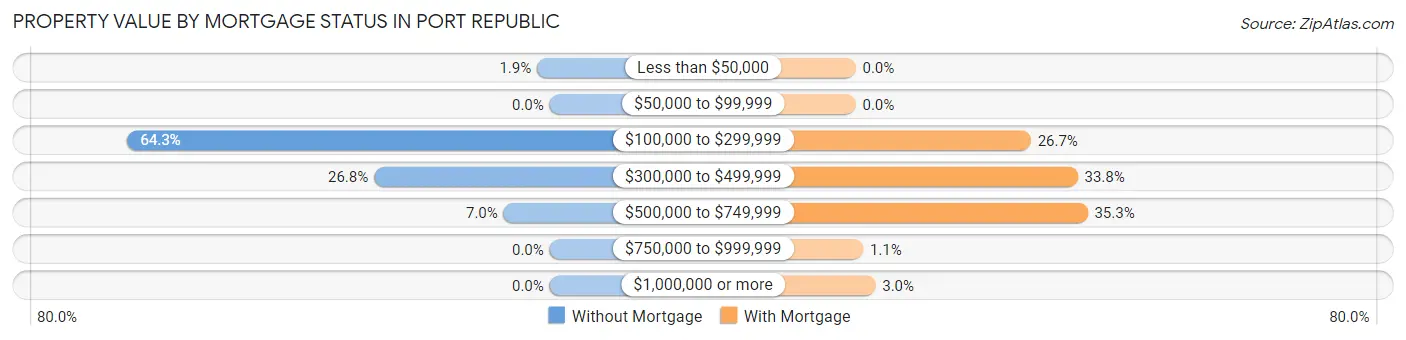
| Property Value | Without Mortgage | With Mortgage |
| Less than $50,000 | 3 (1.9%) | 0 (0.0%) |
| $50,000 to $99,999 | 0 (0.0%) | 0 (0.0%) |
| $100,000 to $299,999 | 101 (64.3%) | 71 (26.7%) |
| $300,000 to $499,999 | 42 (26.8%) | 90 (33.8%) |
| $500,000 to $749,999 | 11 (7.0%) | 94 (35.3%) |
| $750,000 to $999,999 | 0 (0.0%) | 3 (1.1%) |
| $1,000,000 or more | 0 (0.0%) | 8 (3.0%) |
| Total | 157 (100.0%) | 266 (100.0%) |
Household Income by Mortgage Status in Port Republic
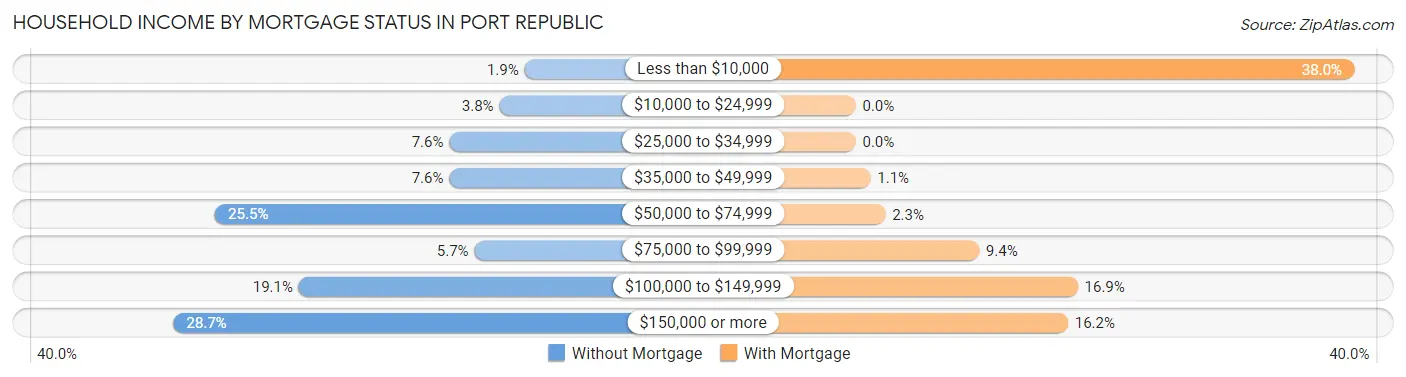
| Household Income | Without Mortgage | With Mortgage |
| Less than $10,000 | 3 (1.9%) | 101 (38.0%) |
| $10,000 to $24,999 | 6 (3.8%) | 0 (0.0%) |
| $25,000 to $34,999 | 12 (7.6%) | 0 (0.0%) |
| $35,000 to $49,999 | 12 (7.6%) | 3 (1.1%) |
| $50,000 to $74,999 | 40 (25.5%) | 6 (2.3%) |
| $75,000 to $99,999 | 9 (5.7%) | 25 (9.4%) |
| $100,000 to $149,999 | 30 (19.1%) | 45 (16.9%) |
| $150,000 or more | 45 (28.7%) | 43 (16.2%) |
| Total | 157 (100.0%) | 266 (100.0%) |
Property Value to Household Income Ratio in Port Republic
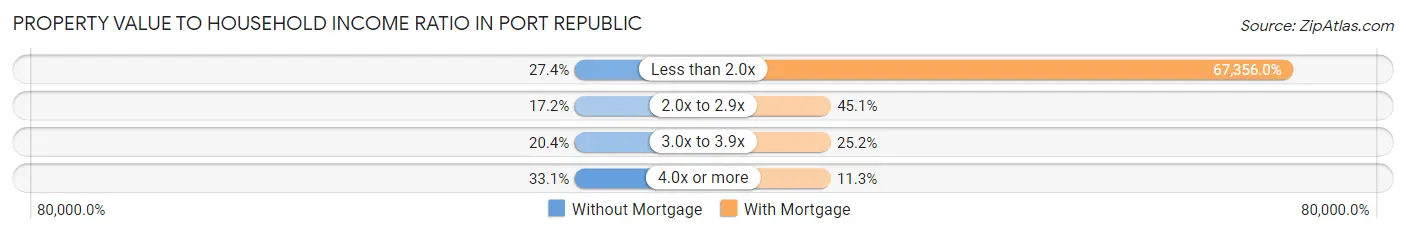
| Value-to-Income Ratio | Without Mortgage | With Mortgage |
| Less than 2.0x | 43 (27.4%) | 179,167 (67,356.0%) |
| 2.0x to 2.9x | 27 (17.2%) | 120 (45.1%) |
| 3.0x to 3.9x | 32 (20.4%) | 67 (25.2%) |
| 4.0x or more | 52 (33.1%) | 30 (11.3%) |
| Total | 157 (100.0%) | 266 (100.0%) |
Real Estate Taxes by Mortgage Status in Port Republic
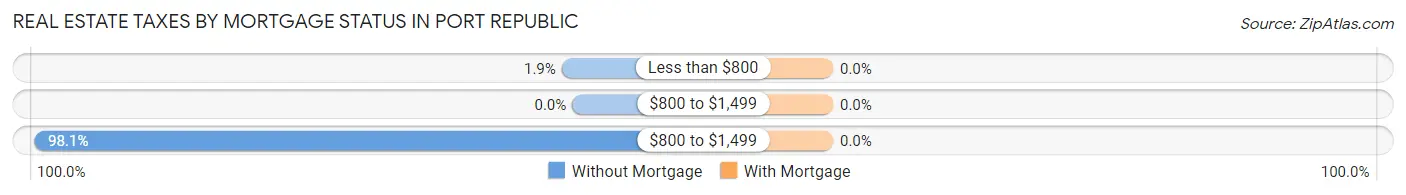
| Property Taxes | Without Mortgage | With Mortgage |
| Less than $800 | 3 (1.9%) | 0 (0.0%) |
| $800 to $1,499 | 0 (0.0%) | 0 (0.0%) |
| $800 to $1,499 | 154 (98.1%) | 0 (0.0%) |
| Total | 157 (100.0%) | 266 (100.0%) |
Health & Disability in Port Republic
Health Insurance Coverage by Age in Port Republic
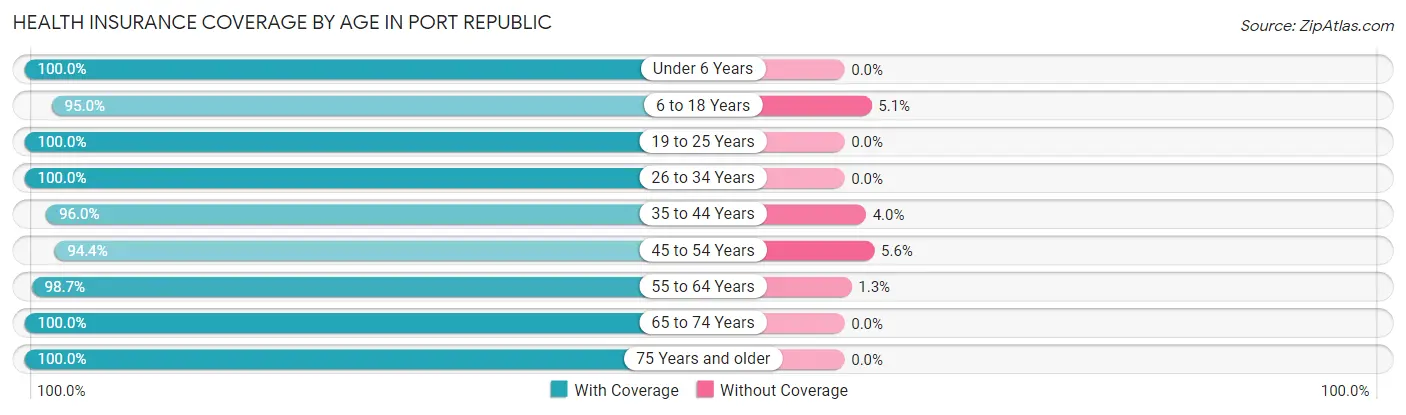
| Age Bracket | With Coverage | Without Coverage |
| Under 6 Years | 27 (100.0%) | 0 (0.0%) |
| 6 to 18 Years | 94 (95.0%) | 5 (5.1%) |
| 19 to 25 Years | 40 (100.0%) | 0 (0.0%) |
| 26 to 34 Years | 79 (100.0%) | 0 (0.0%) |
| 35 to 44 Years | 72 (96.0%) | 3 (4.0%) |
| 45 to 54 Years | 204 (94.4%) | 12 (5.6%) |
| 55 to 64 Years | 150 (98.7%) | 2 (1.3%) |
| 65 to 74 Years | 181 (100.0%) | 0 (0.0%) |
| 75 Years and older | 108 (100.0%) | 0 (0.0%) |
| Total | 955 (97.8%) | 22 (2.2%) |
Health Insurance Coverage by Citizenship Status in Port Republic
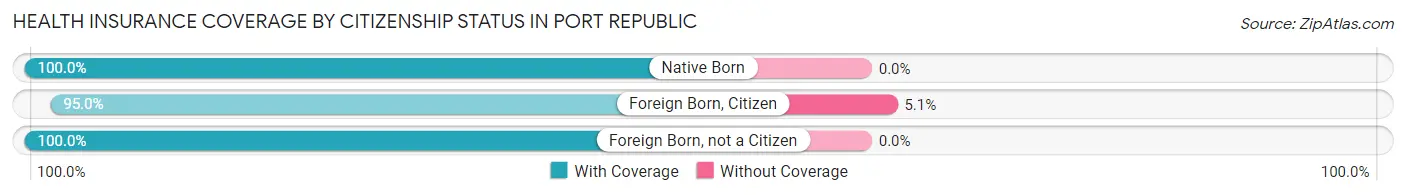
| Citizenship Status | With Coverage | Without Coverage |
| Native Born | 27 (100.0%) | 0 (0.0%) |
| Foreign Born, Citizen | 94 (95.0%) | 5 (5.1%) |
| Foreign Born, not a Citizen | 40 (100.0%) | 0 (0.0%) |
Health Insurance Coverage by Household Income in Port Republic
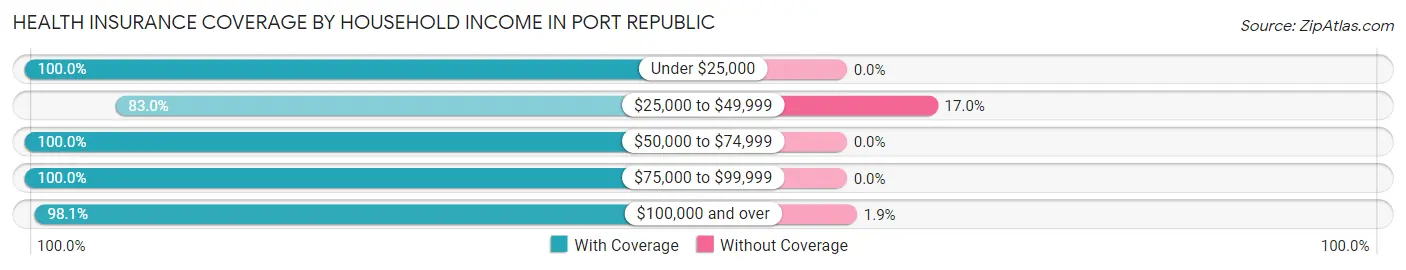
| Household Income | With Coverage | Without Coverage |
| Under $25,000 | 17 (100.0%) | 0 (0.0%) |
| $25,000 to $49,999 | 39 (83.0%) | 8 (17.0%) |
| $50,000 to $74,999 | 111 (100.0%) | 0 (0.0%) |
| $75,000 to $99,999 | 155 (100.0%) | 0 (0.0%) |
| $100,000 and over | 627 (98.1%) | 12 (1.9%) |
Public vs Private Health Insurance Coverage by Age in Port Republic
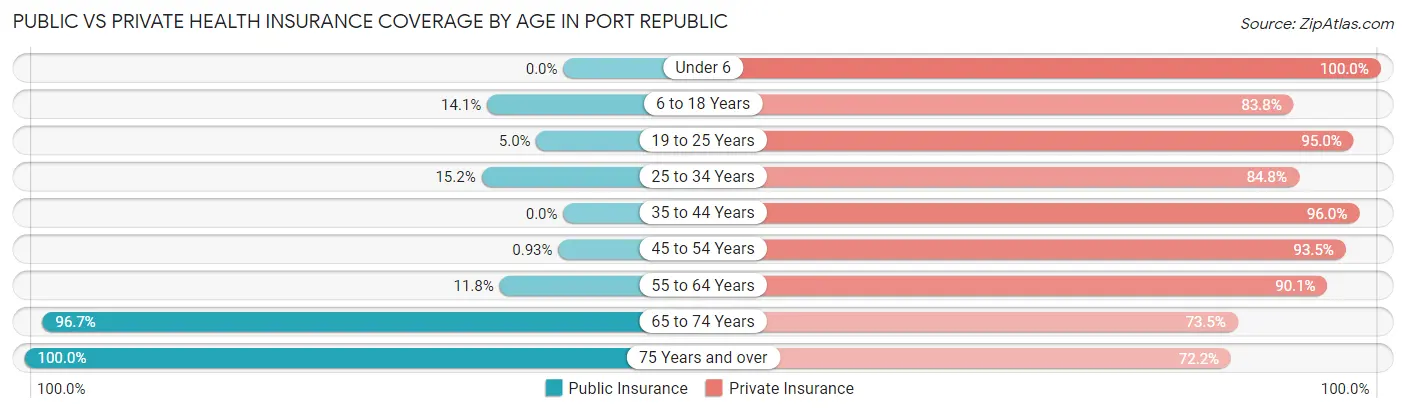
| Age Bracket | Public Insurance | Private Insurance |
| Under 6 | 0 (0.0%) | 27 (100.0%) |
| 6 to 18 Years | 14 (14.1%) | 83 (83.8%) |
| 19 to 25 Years | 2 (5.0%) | 38 (95.0%) |
| 25 to 34 Years | 12 (15.2%) | 67 (84.8%) |
| 35 to 44 Years | 0 (0.0%) | 72 (96.0%) |
| 45 to 54 Years | 2 (0.9%) | 202 (93.5%) |
| 55 to 64 Years | 18 (11.8%) | 137 (90.1%) |
| 65 to 74 Years | 175 (96.7%) | 133 (73.5%) |
| 75 Years and over | 108 (100.0%) | 78 (72.2%) |
| Total | 331 (33.9%) | 837 (85.7%) |
Disability Status by Sex by Age in Port Republic
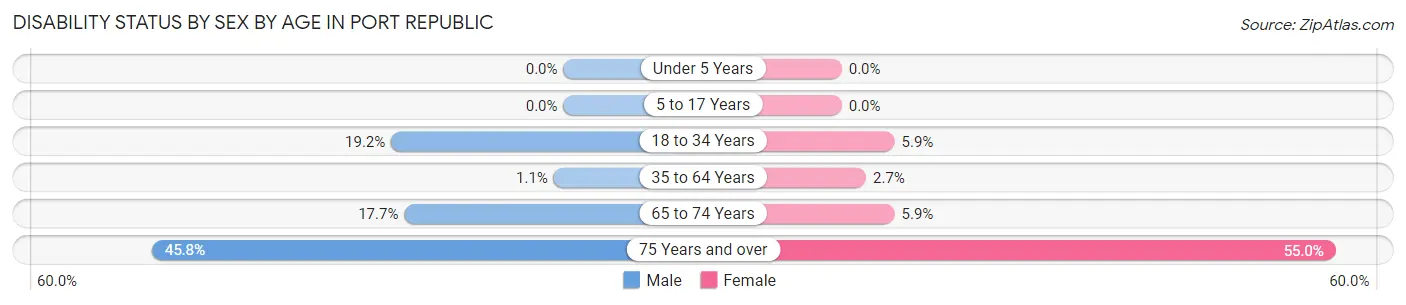
| Age Bracket | Male | Female |
| Under 5 Years | 0 (0.0%) | 0 (0.0%) |
| 5 to 17 Years | 0 (0.0%) | 0 (0.0%) |
| 18 to 34 Years | 14 (19.2%) | 3 (5.9%) |
| 35 to 64 Years | 2 (1.1%) | 7 (2.7%) |
| 65 to 74 Years | 14 (17.7%) | 6 (5.9%) |
| 75 Years and over | 22 (45.8%) | 33 (55.0%) |
Disability Class by Sex by Age in Port Republic
Disability Class: Hearing Difficulty
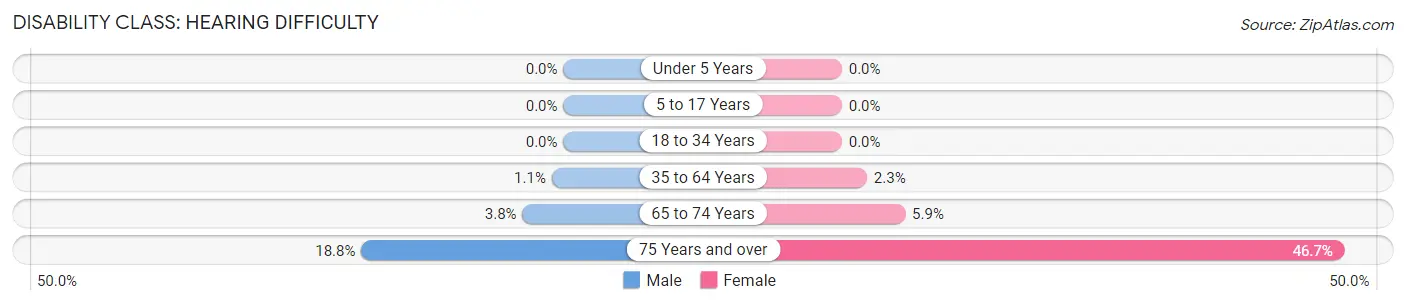
| Age Bracket | Male | Female |
| Under 5 Years | 0 (0.0%) | 0 (0.0%) |
| 5 to 17 Years | 0 (0.0%) | 0 (0.0%) |
| 18 to 34 Years | 0 (0.0%) | 0 (0.0%) |
| 35 to 64 Years | 2 (1.1%) | 6 (2.3%) |
| 65 to 74 Years | 3 (3.8%) | 6 (5.9%) |
| 75 Years and over | 9 (18.8%) | 28 (46.7%) |
Disability Class: Vision Difficulty
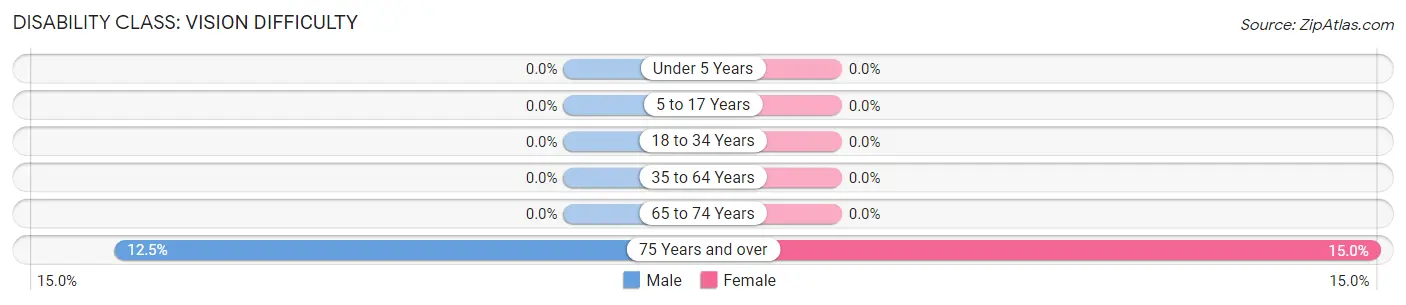
| Age Bracket | Male | Female |
| Under 5 Years | 0 (0.0%) | 0 (0.0%) |
| 5 to 17 Years | 0 (0.0%) | 0 (0.0%) |
| 18 to 34 Years | 0 (0.0%) | 0 (0.0%) |
| 35 to 64 Years | 0 (0.0%) | 0 (0.0%) |
| 65 to 74 Years | 0 (0.0%) | 0 (0.0%) |
| 75 Years and over | 6 (12.5%) | 9 (15.0%) |
Disability Class: Cognitive Difficulty
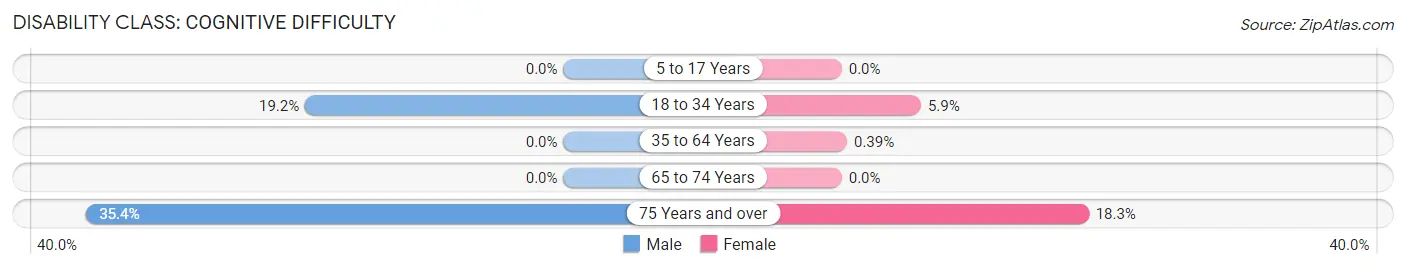
| Age Bracket | Male | Female |
| 5 to 17 Years | 0 (0.0%) | 0 (0.0%) |
| 18 to 34 Years | 14 (19.2%) | 3 (5.9%) |
| 35 to 64 Years | 0 (0.0%) | 1 (0.4%) |
| 65 to 74 Years | 0 (0.0%) | 0 (0.0%) |
| 75 Years and over | 17 (35.4%) | 11 (18.3%) |
Disability Class: Ambulatory Difficulty
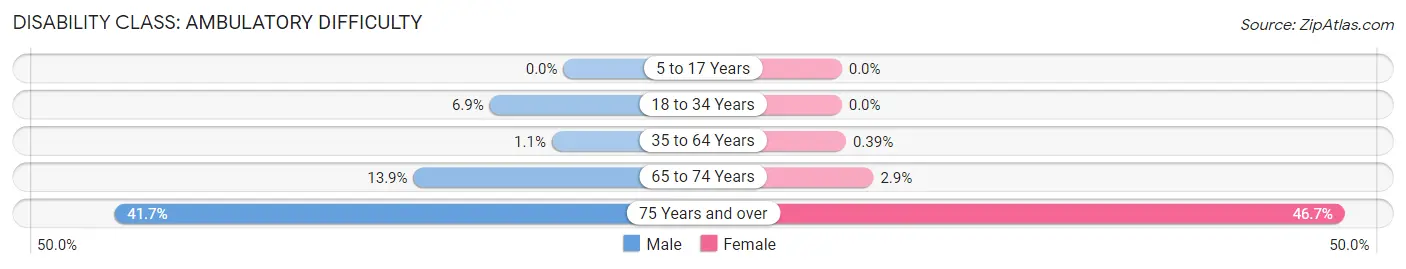
| Age Bracket | Male | Female |
| 5 to 17 Years | 0 (0.0%) | 0 (0.0%) |
| 18 to 34 Years | 5 (6.9%) | 0 (0.0%) |
| 35 to 64 Years | 2 (1.1%) | 1 (0.4%) |
| 65 to 74 Years | 11 (13.9%) | 3 (2.9%) |
| 75 Years and over | 20 (41.7%) | 28 (46.7%) |
Disability Class: Self-Care Difficulty
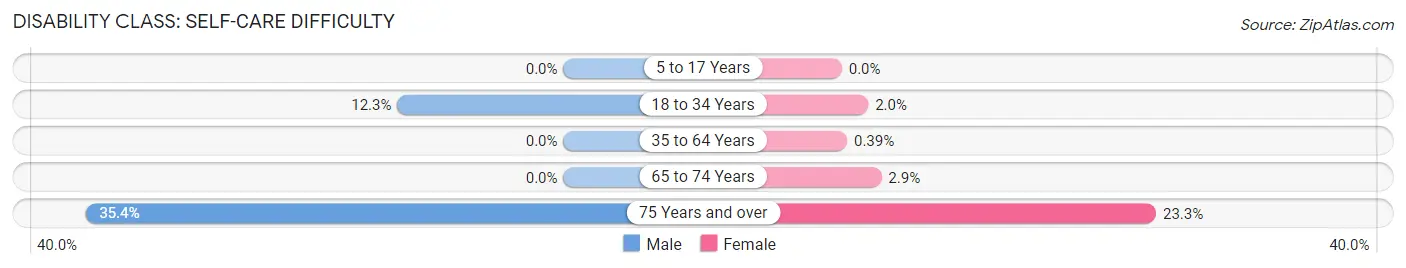
| Age Bracket | Male | Female |
| 5 to 17 Years | 0 (0.0%) | 0 (0.0%) |
| 18 to 34 Years | 9 (12.3%) | 1 (2.0%) |
| 35 to 64 Years | 0 (0.0%) | 1 (0.4%) |
| 65 to 74 Years | 0 (0.0%) | 3 (2.9%) |
| 75 Years and over | 17 (35.4%) | 14 (23.3%) |
Technology Access in Port Republic
Computing Device Access in Port Republic
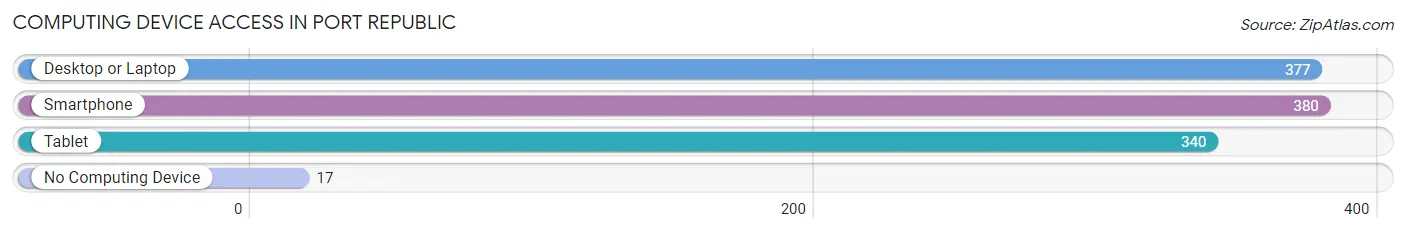
| Device Type | # Households | % Households |
| Desktop or Laptop | 377 | 86.9% |
| Smartphone | 380 | 87.6% |
| Tablet | 340 | 78.3% |
| No Computing Device | 17 | 3.9% |
| Total | 434 | 100.0% |
Internet Access in Port Republic
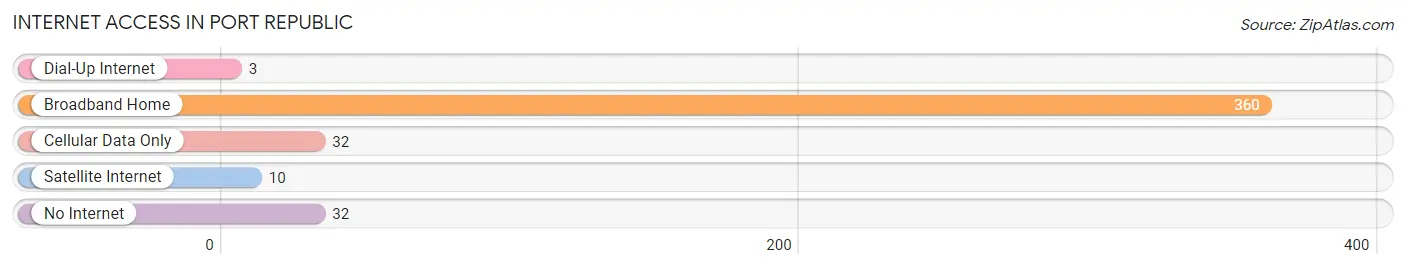
| Internet Type | # Households | % Households |
| Dial-Up Internet | 3 | 0.7% |
| Broadband Home | 360 | 83.0% |
| Cellular Data Only | 32 | 7.4% |
| Satellite Internet | 10 | 2.3% |
| No Internet | 32 | 7.4% |
| Total | 434 | 100.0% |
Port Republic Summary
Introduction
Port Republic is a small borough located in Atlantic County, New Jersey. It is situated on the Mullica River, which is a tributary of the Great Egg Harbor River. The borough is located in the heart of the Pine Barrens, a unique and ecologically diverse region of New Jersey. The population of Port Republic was 1,845 as of the 2010 census.
History
Port Republic was first settled in the early 1700s by English and Dutch settlers. The area was originally known as “Port Republic” due to its location at the mouth of the Mullica River. The town was officially incorporated in 1864.
In the late 1800s, the town was a popular destination for vacationers from Philadelphia and New York City. The town was known for its beautiful beaches, fishing, and hunting.
In the early 1900s, the town began to experience a decline in population as people moved away to larger cities. The town was also affected by the Great Depression and World War II.
In the 1950s, the town began to experience a resurgence in population as people moved back to the area. The town was also affected by the development of the Garden State Parkway, which brought more people to the area.
Geography
Port Republic is located in Atlantic County, New Jersey. It is situated on the Mullica River, which is a tributary of the Great Egg Harbor River. The borough is located in the heart of the Pine Barrens, a unique and ecologically diverse region of New Jersey.
The borough is bordered by Galloway Township to the north, Hamilton Township to the east, Egg Harbor Township to the south, and Mullica Township to the west.
The borough has a total area of 2.2 square miles, all of which is land. The borough is located approximately 10 miles from Atlantic City and 40 miles from Philadelphia.
Economy
Port Republic’s economy is largely based on tourism and recreation. The town is home to several popular beaches, fishing spots, and hunting grounds. The town is also home to several small businesses, including restaurants, shops, and marinas.
The town is also home to several large employers, including the Atlantic County Utilities Authority, the Atlantic County Park System, and the Atlantic County Vocational Technical School.
Demographics
As of the 2010 census, the population of Port Republic was 1,845. The racial makeup of the borough was 94.3% White, 2.2% African American, 0.7% Asian, 0.3% Native American, and 2.5% from other races.
The median household income in the borough was $50,972, and the median family income was $60,972. The per capita income in the borough was $25,972.
Conclusion
Port Republic is a small borough located in Atlantic County, New Jersey. It is situated on the Mullica River, which is a tributary of the Great Egg Harbor River. The borough is located in the heart of the Pine Barrens, a unique and ecologically diverse region of New Jersey. The population of Port Republic was 1,845 as of the 2010 census. The town’s economy is largely based on tourism and recreation, and it is home to several large employers. The racial makeup of the borough was 94.3% White, 2.2% African American, 0.7% Asian, 0.3% Native American, and 2.5% from other races. The median household income in the borough was $50,972, and the median family income was $60,972. The per capita income in the borough was $25,972.
Common Questions
What is Per Capita Income in Port Republic?
Per Capita income in Port Republic is $66,869.
What is the Median Family Income in Port Republic?
Median Family Income in Port Republic is $168,750.
What is the Median Household income in Port Republic?
Median Household Income in Port Republic is $128,611.
What is Inequality or Gini Index in Port Republic?
Inequality or Gini Index in Port Republic is 0.45.
What is the Total Population of Port Republic?
Total Population of Port Republic is 980.
What is the Total Male Population of Port Republic?
Total Male Population of Port Republic is 454.
What is the Total Female Population of Port Republic?
Total Female Population of Port Republic is 526.
What is the Ratio of Males per 100 Females in Port Republic?
There are 86.31 Males per 100 Females in Port Republic.
What is the Ratio of Females per 100 Males in Port Republic?
There are 115.86 Females per 100 Males in Port Republic.
What is the Median Population Age in Port Republic?
Median Population Age in Port Republic is 54.6 Years.
What is the Average Family Size in Port Republic
Average Family Size in Port Republic is 2.5 People.
What is the Average Household Size in Port Republic
Average Household Size in Port Republic is 2.2 People.
How Large is the Labor Force in Port Republic?
There are 519 People in the Labor Forcein in Port Republic.
What is the Percentage of People in the Labor Force in Port Republic?
59.5% of People are in the Labor Force in Port Republic.
What is the Unemployment Rate in Port Republic?
Unemployment Rate in Port Republic is 4.8%.