Alloway, NJ Map & Demographics
Alloway Map
Alloway Overview
$56,008
PER CAPITA INCOME
$133,750
AVG FAMILY INCOME
$129,961
AVG HOUSEHOLD INCOME
30.7%
WAGE / INCOME GAP [ % ]
69.3¢/ $1
WAGE / INCOME GAP [ $ ]
0.29
INEQUALITY / GINI INDEX
1,428
TOTAL POPULATION
653
MALE POPULATION
775
FEMALE POPULATION
84.26
MALES / 100 FEMALES
118.68
FEMALES / 100 MALES
50.9
MEDIAN AGE
2.7
AVG FAMILY SIZE
2.7
AVG HOUSEHOLD SIZE
807
LABOR FORCE [ PEOPLE ]
63.4%
PERCENT IN LABOR FORCE
8.7%
UNEMPLOYMENT RATE
Alloway Zip Codes
Alloway Area Codes
Income in Alloway
Income Overview in Alloway
Per Capita Income in Alloway is $56,008, while median incomes of families and households are $133,750 and $129,961 respectively.
| Characteristic | Number | Measure |
| Per Capita Income | 1,428 | $56,008 |
| Median Family Income | 450 | $133,750 |
| Mean Family Income | 450 | $149,599 |
| Median Household Income | 517 | $129,961 |
| Mean Household Income | 517 | $143,601 |
| Income Deficit | 450 | $0 |
| Wage / Income Gap (%) | 1,428 | 30.69% |
| Wage / Income Gap ($) | 1,428 | 69.31¢ per $1 |
| Gini / Inequality Index | 1,428 | 0.29 |
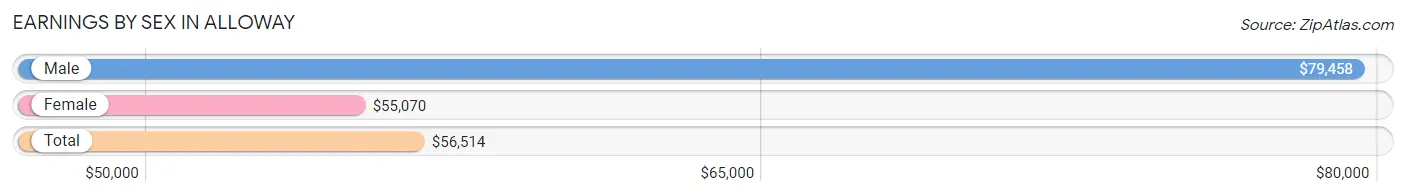
Earnings by Sex in Alloway
Average Earnings in Alloway are $56,514, $79,458 for men and $55,070 for women, a difference of 30.7%.
| Sex | Number | Average Earnings |
| Male | 375 (46.0%) | $79,458 |
| Female | 441 (54.0%) | $55,070 |
| Total | 816 (100.0%) | $56,514 |
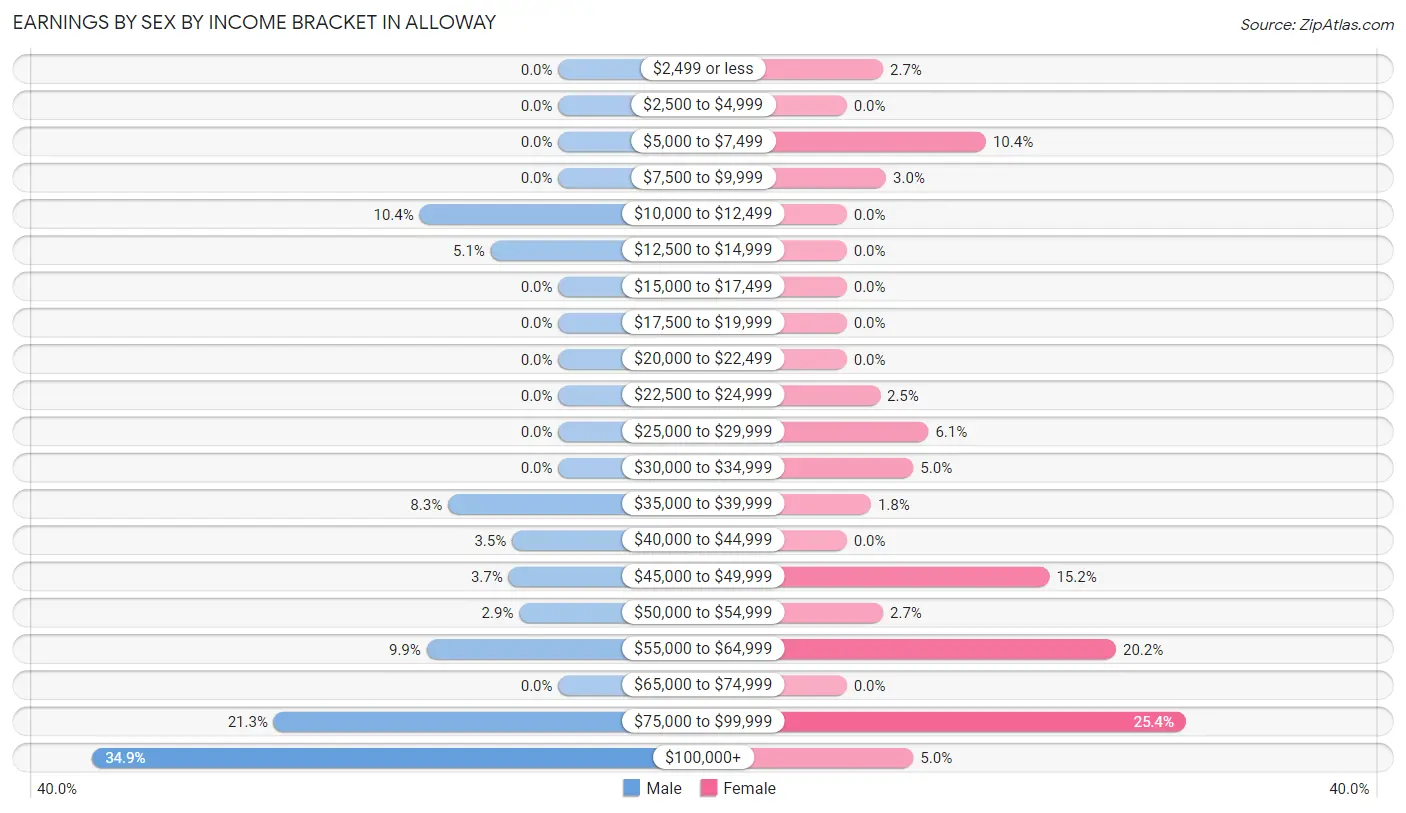
Earnings by Sex by Income Bracket in Alloway
The most common earnings brackets in Alloway are $100,000+ for men (131 | 34.9%) and $75,000 to $99,999 for women (112 | 25.4%).
| Income | Male | Female |
| $2,499 or less | 0 (0.0%) | 12 (2.7%) |
| $2,500 to $4,999 | 0 (0.0%) | 0 (0.0%) |
| $5,000 to $7,499 | 0 (0.0%) | 46 (10.4%) |
| $7,500 to $9,999 | 0 (0.0%) | 13 (2.9%) |
| $10,000 to $12,499 | 39 (10.4%) | 0 (0.0%) |
| $12,500 to $14,999 | 19 (5.1%) | 0 (0.0%) |
| $15,000 to $17,499 | 0 (0.0%) | 0 (0.0%) |
| $17,500 to $19,999 | 0 (0.0%) | 0 (0.0%) |
| $20,000 to $22,499 | 0 (0.0%) | 0 (0.0%) |
| $22,500 to $24,999 | 0 (0.0%) | 11 (2.5%) |
| $25,000 to $29,999 | 0 (0.0%) | 27 (6.1%) |
| $30,000 to $34,999 | 0 (0.0%) | 22 (5.0%) |
| $35,000 to $39,999 | 31 (8.3%) | 8 (1.8%) |
| $40,000 to $44,999 | 13 (3.5%) | 0 (0.0%) |
| $45,000 to $49,999 | 14 (3.7%) | 67 (15.2%) |
| $50,000 to $54,999 | 11 (2.9%) | 12 (2.7%) |
| $55,000 to $64,999 | 37 (9.9%) | 89 (20.2%) |
| $65,000 to $74,999 | 0 (0.0%) | 0 (0.0%) |
| $75,000 to $99,999 | 80 (21.3%) | 112 (25.4%) |
| $100,000+ | 131 (34.9%) | 22 (5.0%) |
| Total | 375 (100.0%) | 441 (100.0%) |
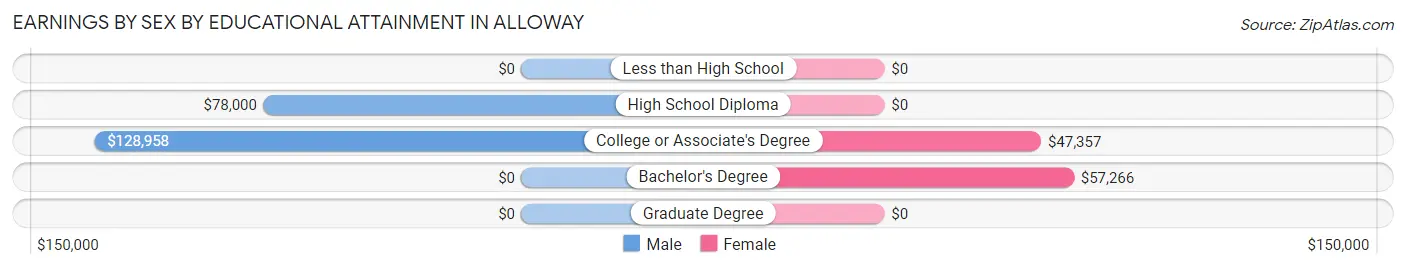
Earnings by Sex by Educational Attainment in Alloway
Average earnings in Alloway are $88,542 for men and $55,758 for women, a difference of 37.0%. Men with an educational attainment of college or associate's degree enjoy the highest average annual earnings of $128,958, while those with high school diploma education earn the least with $78,000. Women with an educational attainment of bachelor's degree earn the most with the average annual earnings of $57,266, while those with college or associate's degree education have the smallest earnings of $47,357.
| Educational Attainment | Male Income | Female Income |
| Less than High School | - | - |
| High School Diploma | $78,000 | $0 |
| College or Associate's Degree | $128,958 | $47,357 |
| Bachelor's Degree | - | - |
| Graduate Degree | - | - |
| Total | $88,542 | $55,758 |
Family Income in Alloway
Family Income Brackets in Alloway
According to the Alloway family income data, there are 112 families falling into the $100,000 to $149,999 income range, which is the most common income bracket and makes up 24.9% of all families.
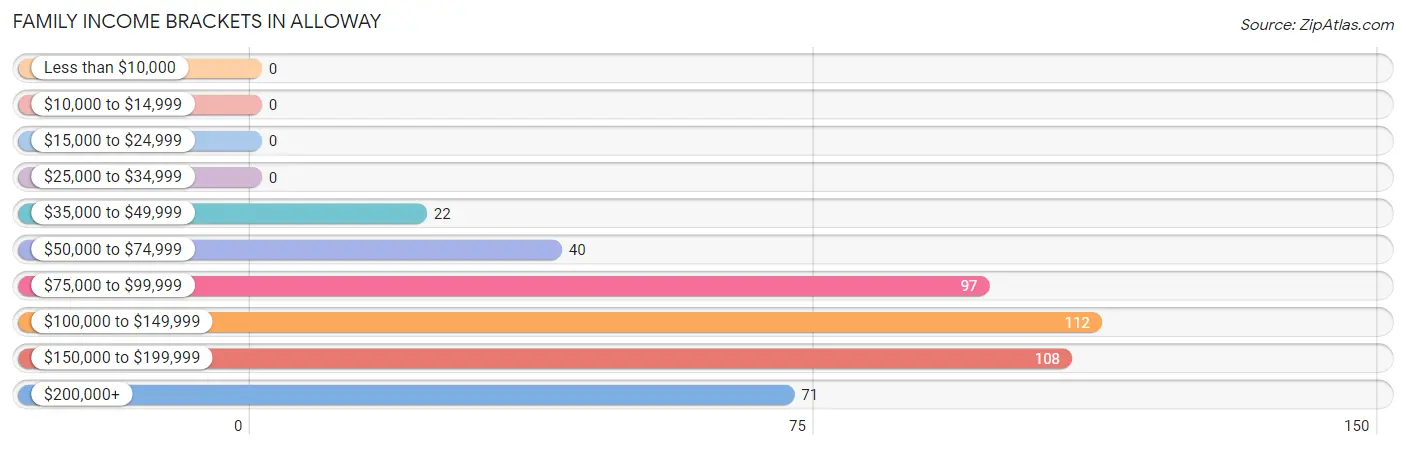
| Income Bracket | # Families | % Families |
| Less than $10,000 | 0 | 0.0% |
| $10,000 to $14,999 | 0 | 0.0% |
| $15,000 to $24,999 | 0 | 0.0% |
| $25,000 to $34,999 | 0 | 0.0% |
| $35,000 to $49,999 | 22 | 4.9% |
| $50,000 to $74,999 | 40 | 8.9% |
| $75,000 to $99,999 | 97 | 21.6% |
| $100,000 to $149,999 | 112 | 24.9% |
| $150,000 to $199,999 | 108 | 24.0% |
| $200,000+ | 71 | 15.8% |
Family Income by Famaliy Size in Alloway
4-person families (126 | 28.0%) account for the highest median family income in Alloway with $137,237 per family, while 2-person families (259 | 57.6%) have the highest median income of $48,438 per family member.
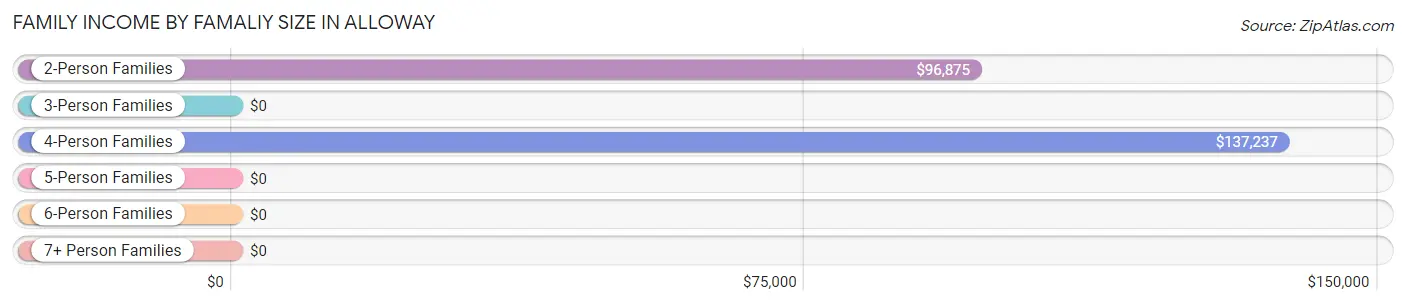
| Income Bracket | # Families | Median Income |
| 2-Person Families | 259 (57.6%) | $96,875 |
| 3-Person Families | 58 (12.9%) | $0 |
| 4-Person Families | 126 (28.0%) | $137,237 |
| 5-Person Families | 7 (1.6%) | $0 |
| 6-Person Families | 0 (0.0%) | $0 |
| 7+ Person Families | 0 (0.0%) | $0 |
| Total | 450 (100.0%) | $133,750 |
Family Income by Number of Earners in Alloway
The median family income in Alloway is $133,750, with families comprising 3+ earners (61) having the highest median family income of $187,179, while families with no earners (112) have the lowest median family income of $95,242, accounting for 13.6% and 24.9% of families, respectively.
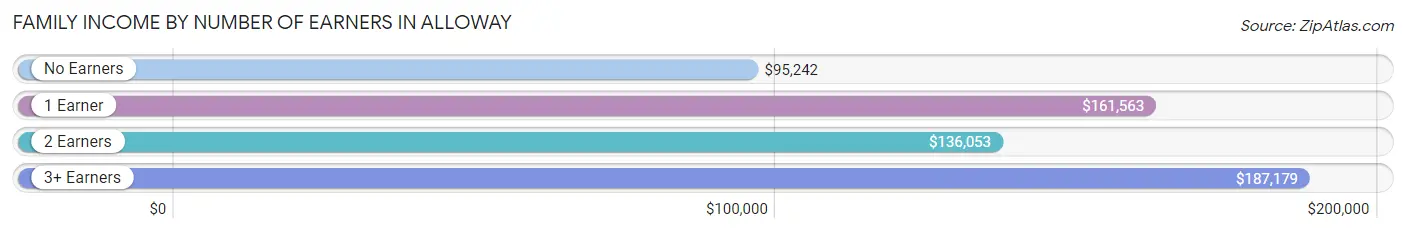
| Number of Earners | # Families | Median Income |
| No Earners | 112 (24.9%) | $95,242 |
| 1 Earner | 101 (22.4%) | $161,563 |
| 2 Earners | 176 (39.1%) | $136,053 |
| 3+ Earners | 61 (13.6%) | $187,179 |
| Total | 450 (100.0%) | $133,750 |
Household Income in Alloway
Household Income Brackets in Alloway
With 118 households falling in the category, the $150,000 to $199,999 income range is the most frequent in Alloway, accounting for 22.8% of all households.
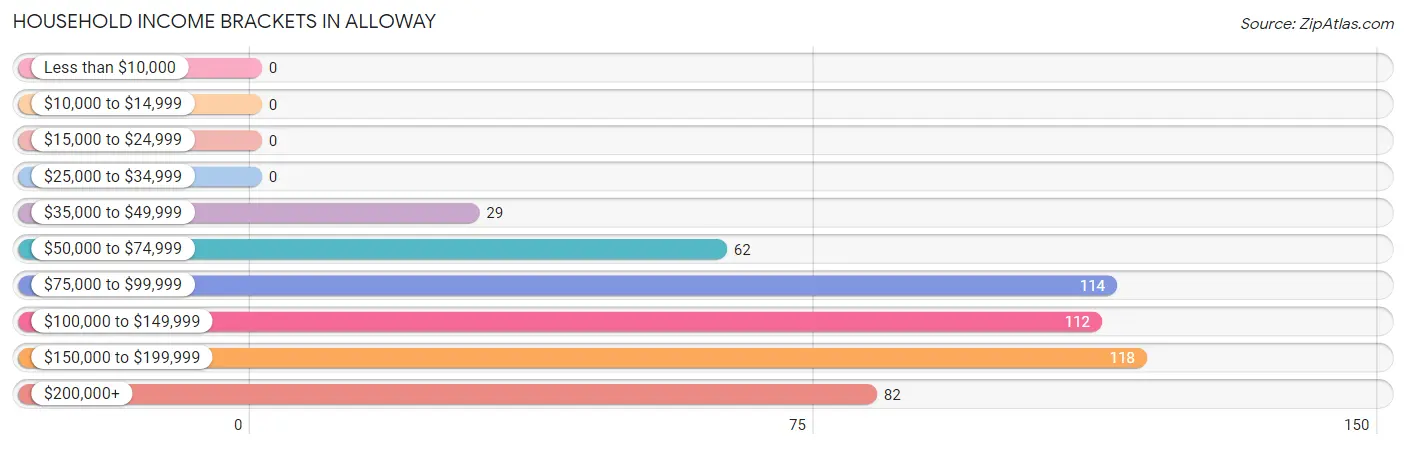
| Income Bracket | # Households | % Households |
| Less than $10,000 | 0 | 0.0% |
| $10,000 to $14,999 | 0 | 0.0% |
| $15,000 to $24,999 | 0 | 0.0% |
| $25,000 to $34,999 | 0 | 0.0% |
| $35,000 to $49,999 | 29 | 5.6% |
| $50,000 to $74,999 | 62 | 12.0% |
| $75,000 to $99,999 | 114 | 22.1% |
| $100,000 to $149,999 | 112 | 21.7% |
| $150,000 to $199,999 | 118 | 22.8% |
| $200,000+ | 82 | 15.9% |
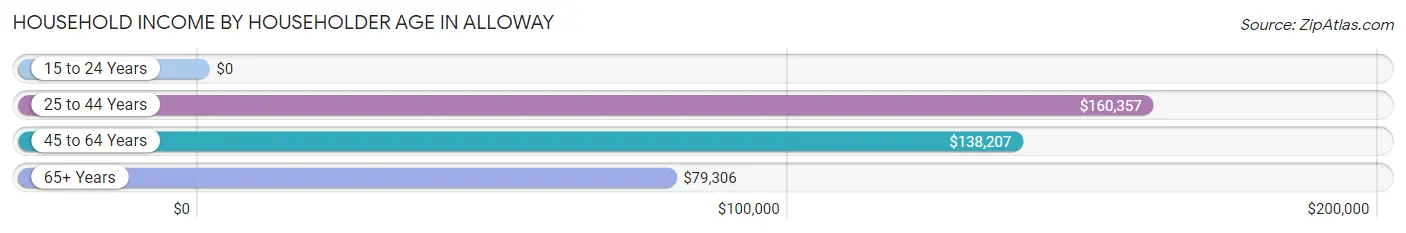
Household Income by Householder Age in Alloway
The median household income in Alloway is $129,961, with the highest median household income of $160,357 found in the 25 to 44 years age bracket for the primary householder. A total of 70 households (13.5%) fall into this category. Meanwhile, the 15 to 24 years age bracket for the primary householder has the lowest median household income of $0, with 11 households (2.1%) in this group.
| Income Bracket | # Households | Median Income |
| 15 to 24 Years | 11 (2.1%) | $0 |
| 25 to 44 Years | 70 (13.5%) | $160,357 |
| 45 to 64 Years | 317 (61.3%) | $138,207 |
| 65+ Years | 119 (23.0%) | $79,306 |
| Total | 517 (100.0%) | $129,961 |
Poverty in Alloway
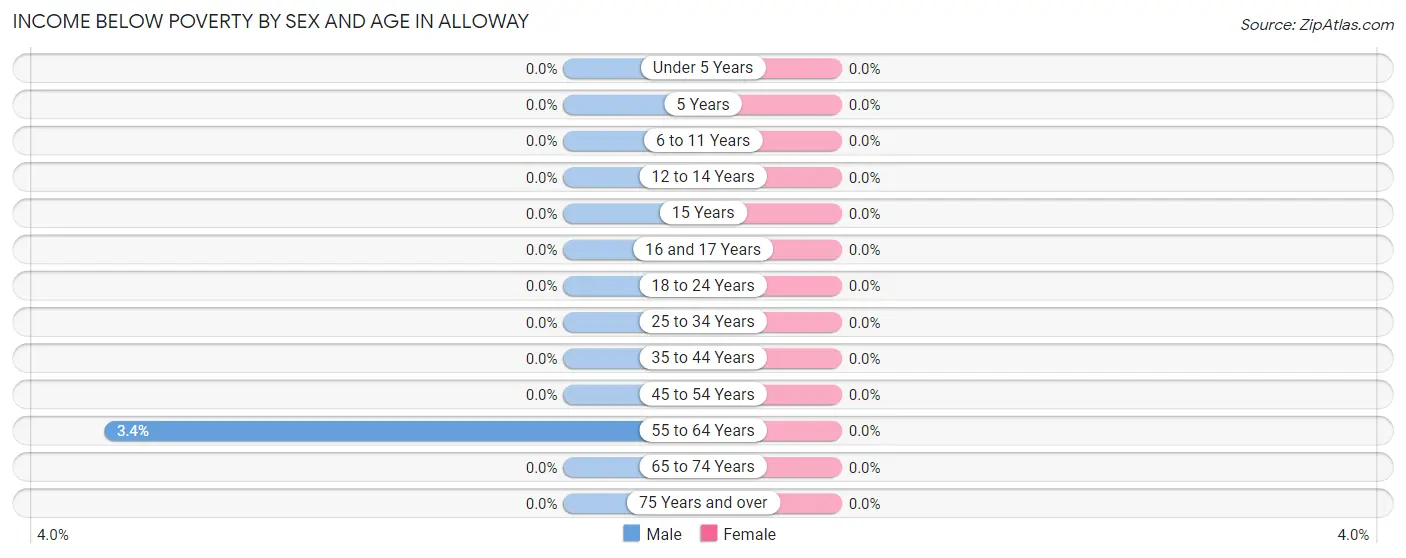
Income Below Poverty by Sex and Age in Alloway
| Age Bracket | Male | Female |
| Under 5 Years | 0 (0.0%) | 0 (0.0%) |
| 5 Years | 0 (0.0%) | 0 (0.0%) |
| 6 to 11 Years | 0 (0.0%) | 0 (0.0%) |
| 12 to 14 Years | 0 (0.0%) | 0 (0.0%) |
| 15 Years | 0 (0.0%) | 0 (0.0%) |
| 16 and 17 Years | 0 (0.0%) | 0 (0.0%) |
| 18 to 24 Years | 0 (0.0%) | 0 (0.0%) |
| 25 to 34 Years | 0 (0.0%) | 0 (0.0%) |
| 35 to 44 Years | 0 (0.0%) | 0 (0.0%) |
| 45 to 54 Years | 0 (0.0%) | 0 (0.0%) |
| 55 to 64 Years | 6 (3.4%) | 0 (0.0%) |
| 65 to 74 Years | 0 (0.0%) | 0 (0.0%) |
| 75 Years and over | 0 (0.0%) | 0 (0.0%) |
| Total | 6 (0.9%) | 0 (0.0%) |
Income Above Poverty by Sex and Age in Alloway
According to the poverty statistics in Alloway, males aged 6 to 11 years and females aged 6 to 11 years are the age groups that are most secure financially, with 100.0% of males and 100.0% of females in these age groups living above the poverty line.
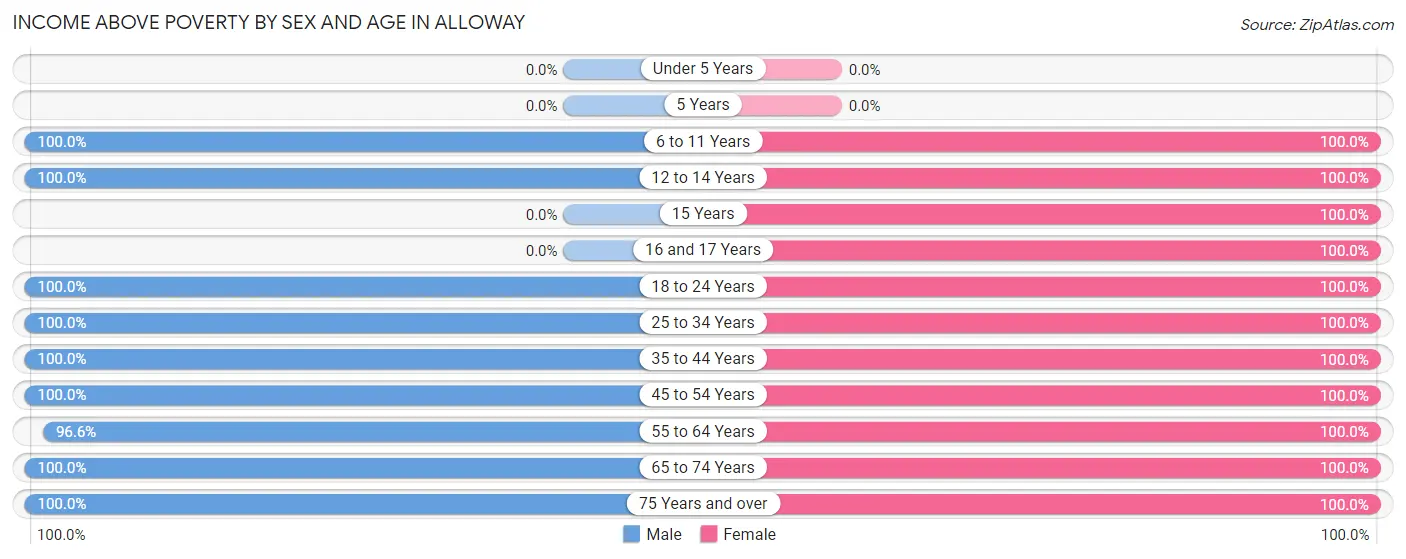
| Age Bracket | Male | Female |
| Under 5 Years | 0 (0.0%) | 0 (0.0%) |
| 5 Years | 0 (0.0%) | 0 (0.0%) |
| 6 to 11 Years | 27 (100.0%) | 58 (100.0%) |
| 12 to 14 Years | 30 (100.0%) | 21 (100.0%) |
| 15 Years | 0 (0.0%) | 13 (100.0%) |
| 16 and 17 Years | 0 (0.0%) | 91 (100.0%) |
| 18 to 24 Years | 82 (100.0%) | 33 (100.0%) |
| 25 to 34 Years | 11 (100.0%) | 110 (100.0%) |
| 35 to 44 Years | 70 (100.0%) | 8 (100.0%) |
| 45 to 54 Years | 132 (100.0%) | 181 (100.0%) |
| 55 to 64 Years | 170 (96.6%) | 85 (100.0%) |
| 65 to 74 Years | 53 (100.0%) | 126 (100.0%) |
| 75 Years and over | 55 (100.0%) | 46 (100.0%) |
| Total | 630 (99.1%) | 772 (100.0%) |
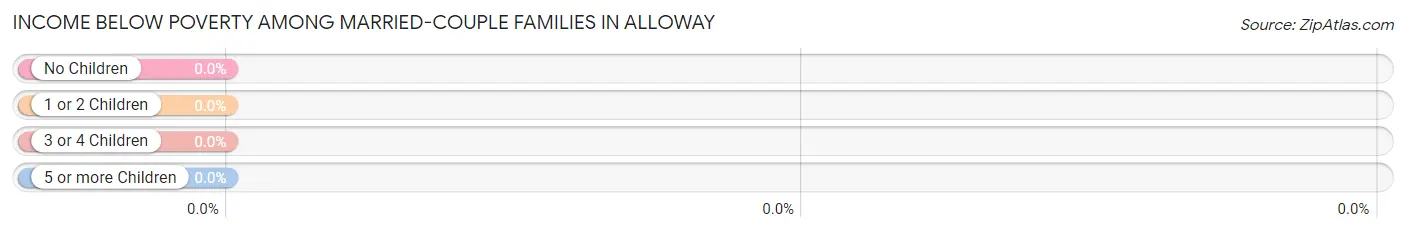
Income Below Poverty Among Married-Couple Families in Alloway
| Children | Above Poverty | Below Poverty |
| No Children | 277 (100.0%) | 0 (0.0%) |
| 1 or 2 Children | 120 (100.0%) | 0 (0.0%) |
| 3 or 4 Children | 7 (100.0%) | 0 (0.0%) |
| 5 or more Children | 0 (0.0%) | 0 (0.0%) |
| Total | 404 (100.0%) | 0 (0.0%) |
Income Below Poverty Among Single-Parent Households in Alloway
| Children | Single Father | Single Mother |
| No Children | 0 (0.0%) | 0 (0.0%) |
| 1 or 2 Children | 0 (0.0%) | 0 (0.0%) |
| 3 or 4 Children | 0 (0.0%) | 0 (0.0%) |
| 5 or more Children | 0 (0.0%) | 0 (0.0%) |
| Total | 0 (0.0%) | 0 (0.0%) |
Income Below Poverty Among Married-Couple vs Single-Parent Households in Alloway
| Children | Married-Couple Families | Single-Parent Households |
| No Children | 0 (0.0%) | 0 (0.0%) |
| 1 or 2 Children | 0 (0.0%) | 0 (0.0%) |
| 3 or 4 Children | 0 (0.0%) | 0 (0.0%) |
| 5 or more Children | 0 (0.0%) | 0 (0.0%) |
| Total | 0 (0.0%) | 0 (0.0%) |
Race in Alloway
The most populous races in Alloway are White / Caucasian (1,352 | 94.7%), Two or more Races (39 | 2.7%), and Black / African American (24 | 1.7%).
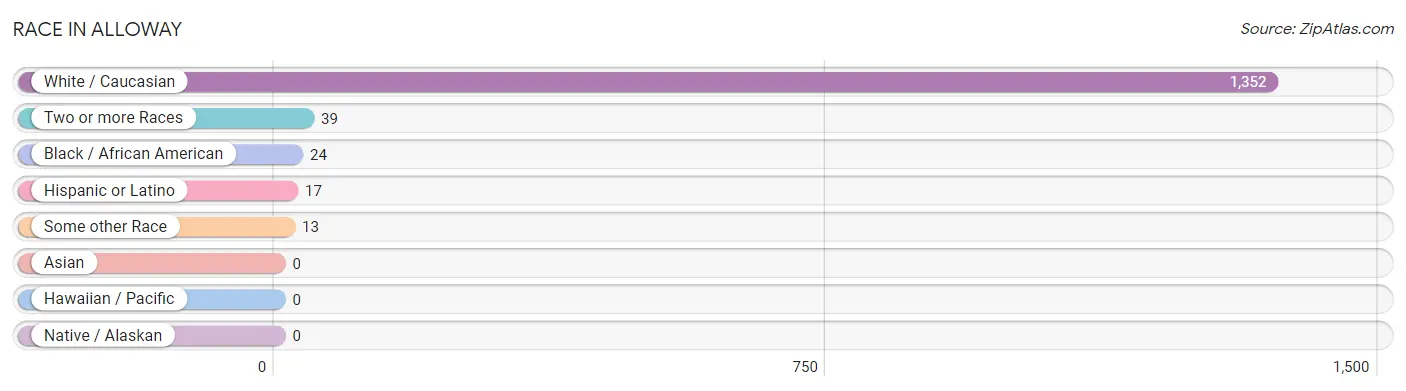
| Race | # Population | % Population |
| Asian | 0 | 0.0% |
| Black / African American | 24 | 1.7% |
| Hawaiian / Pacific | 0 | 0.0% |
| Hispanic or Latino | 17 | 1.2% |
| Native / Alaskan | 0 | 0.0% |
| White / Caucasian | 1,352 | 94.7% |
| Two or more Races | 39 | 2.7% |
| Some other Race | 13 | 0.9% |
| Total | 1,428 | 100.0% |
Ancestry in Alloway
The most populous ancestries reported in Alloway are Irish (400 | 28.0%), German (388 | 27.2%), Italian (371 | 26.0%), English (240 | 16.8%), and Polish (92 | 6.4%), together accounting for 104.4% of all Alloway residents.
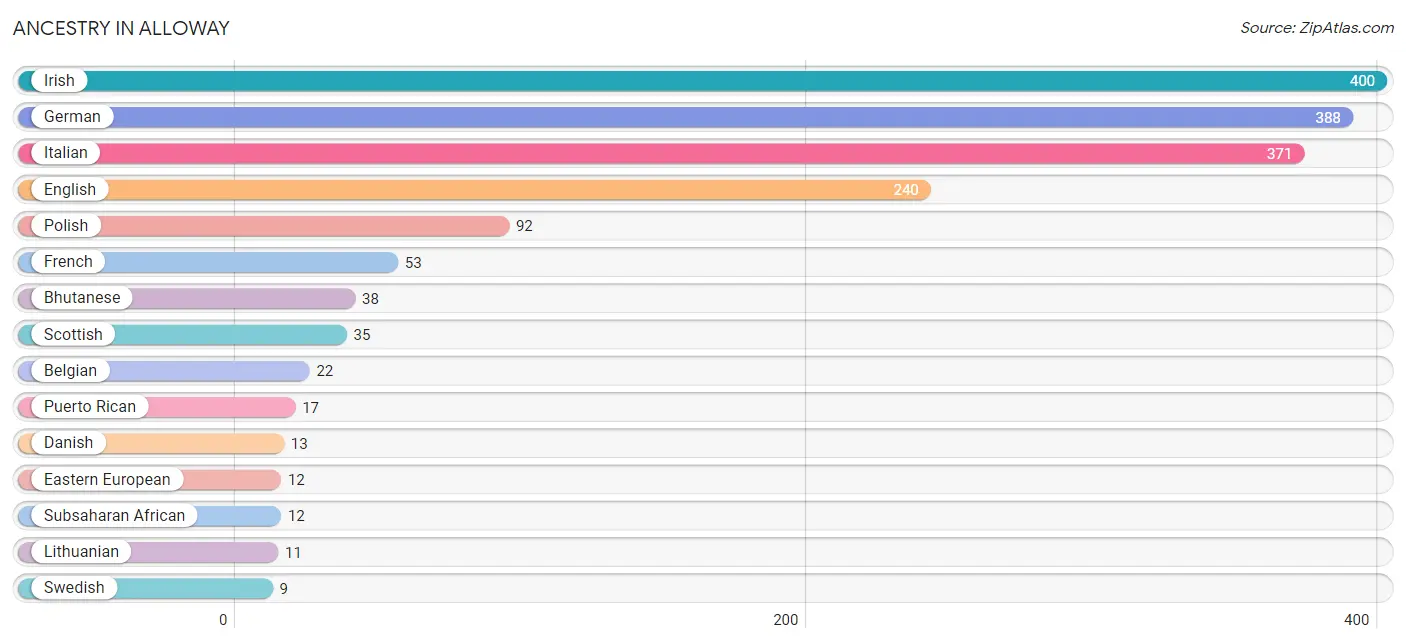
| Ancestry | # Population | % Population |
| Belgian | 22 | 1.5% |
| Bhutanese | 38 | 2.7% |
| British | 6 | 0.4% |
| Danish | 13 | 0.9% |
| Eastern European | 12 | 0.8% |
| English | 240 | 16.8% |
| French | 53 | 3.7% |
| German | 388 | 27.2% |
| Irish | 400 | 28.0% |
| Israeli | 3 | 0.2% |
| Italian | 371 | 26.0% |
| Lithuanian | 11 | 0.8% |
| Polish | 92 | 6.4% |
| Puerto Rican | 17 | 1.2% |
| Russian | 3 | 0.2% |
| Scottish | 35 | 2.5% |
| Subsaharan African | 12 | 0.8% |
| Swedish | 9 | 0.6% | View All 18 Rows |
Immigrants in Alloway
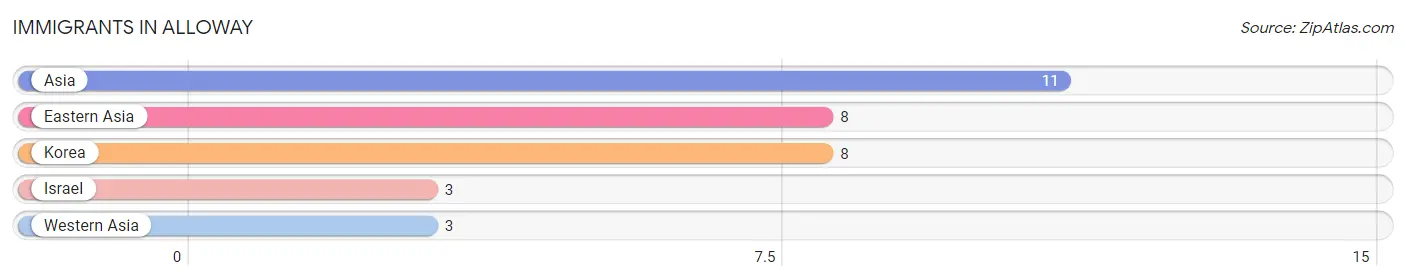
The most numerous immigrant groups reported in Alloway came from Asia (11 | 0.8%), Eastern Asia (8 | 0.6%), Korea (8 | 0.6%), Israel (3 | 0.2%), and Western Asia (3 | 0.2%), together accounting for 2.3% of all Alloway residents.
| Immigration Origin | # Population | % Population |
| Asia | 11 | 0.8% |
| Eastern Asia | 8 | 0.6% |
| Israel | 3 | 0.2% |
| Korea | 8 | 0.6% |
| Western Asia | 3 | 0.2% | View All 5 Rows |
Sex and Age in Alloway
Sex and Age in Alloway
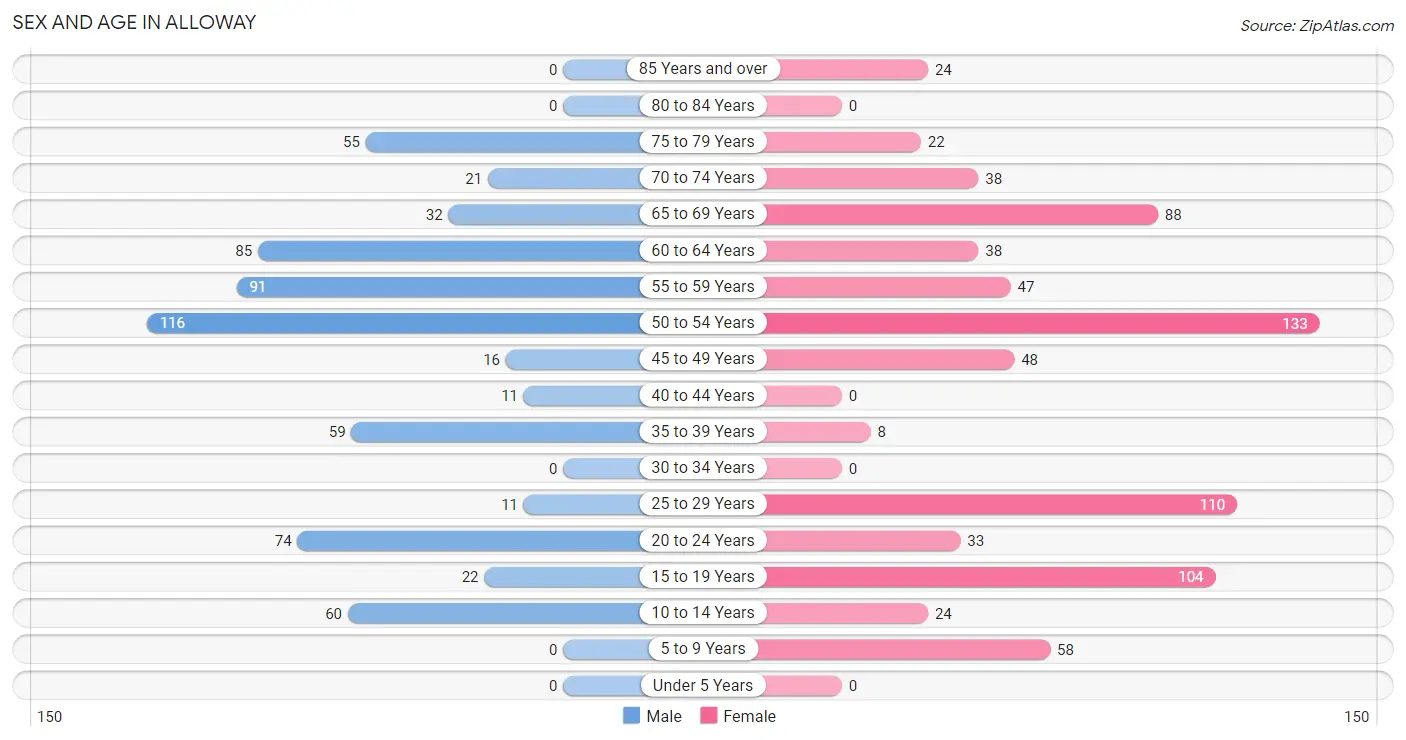
The most populous age groups in Alloway are 50 to 54 Years (116 | 17.8%) for men and 50 to 54 Years (133 | 17.2%) for women.
| Age Bracket | Male | Female |
| Under 5 Years | 0 (0.0%) | 0 (0.0%) |
| 5 to 9 Years | 0 (0.0%) | 58 (7.5%) |
| 10 to 14 Years | 60 (9.2%) | 24 (3.1%) |
| 15 to 19 Years | 22 (3.4%) | 104 (13.4%) |
| 20 to 24 Years | 74 (11.3%) | 33 (4.3%) |
| 25 to 29 Years | 11 (1.7%) | 110 (14.2%) |
| 30 to 34 Years | 0 (0.0%) | 0 (0.0%) |
| 35 to 39 Years | 59 (9.0%) | 8 (1.0%) |
| 40 to 44 Years | 11 (1.7%) | 0 (0.0%) |
| 45 to 49 Years | 16 (2.5%) | 48 (6.2%) |
| 50 to 54 Years | 116 (17.8%) | 133 (17.2%) |
| 55 to 59 Years | 91 (13.9%) | 47 (6.1%) |
| 60 to 64 Years | 85 (13.0%) | 38 (4.9%) |
| 65 to 69 Years | 32 (4.9%) | 88 (11.4%) |
| 70 to 74 Years | 21 (3.2%) | 38 (4.9%) |
| 75 to 79 Years | 55 (8.4%) | 22 (2.8%) |
| 80 to 84 Years | 0 (0.0%) | 0 (0.0%) |
| 85 Years and over | 0 (0.0%) | 24 (3.1%) |
| Total | 653 (100.0%) | 775 (100.0%) |
Families and Households in Alloway
Median Family Size in Alloway
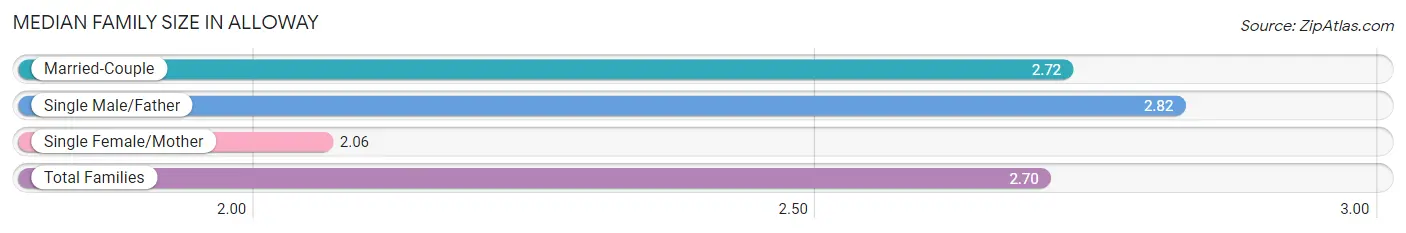
The median family size in Alloway is 2.70 persons per family, with single male/father families (28 | 6.2%) accounting for the largest median family size of 2.82 persons per family. On the other hand, single female/mother families (18 | 4.0%) represent the smallest median family size with 2.06 persons per family.
| Family Type | # Families | Family Size |
| Married-Couple | 404 (89.8%) | 2.72 |
| Single Male/Father | 28 (6.2%) | 2.82 |
| Single Female/Mother | 18 (4.0%) | 2.06 |
| Total Families | 450 (100.0%) | 2.70 |
Median Household Size in Alloway
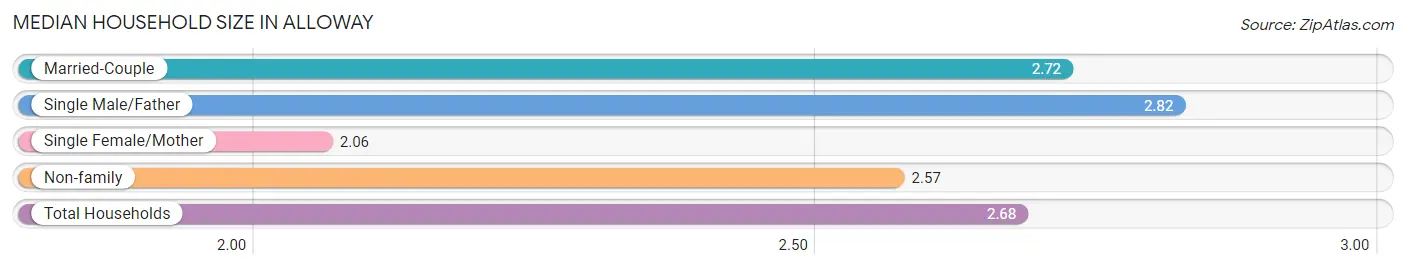
The median household size in Alloway is 2.68 persons per household, with single male/father households (28 | 5.4%) accounting for the largest median household size of 2.82 persons per household. single female/mother households (18 | 3.5%) represent the smallest median household size with 2.06 persons per household.
| Household Type | # Households | Household Size |
| Married-Couple | 404 (78.1%) | 2.72 |
| Single Male/Father | 28 (5.4%) | 2.82 |
| Single Female/Mother | 18 (3.5%) | 2.06 |
| Non-family | 67 (13.0%) | 2.57 |
| Total Households | 517 (100.0%) | 2.68 |
Household Size by Marriage Status in Alloway
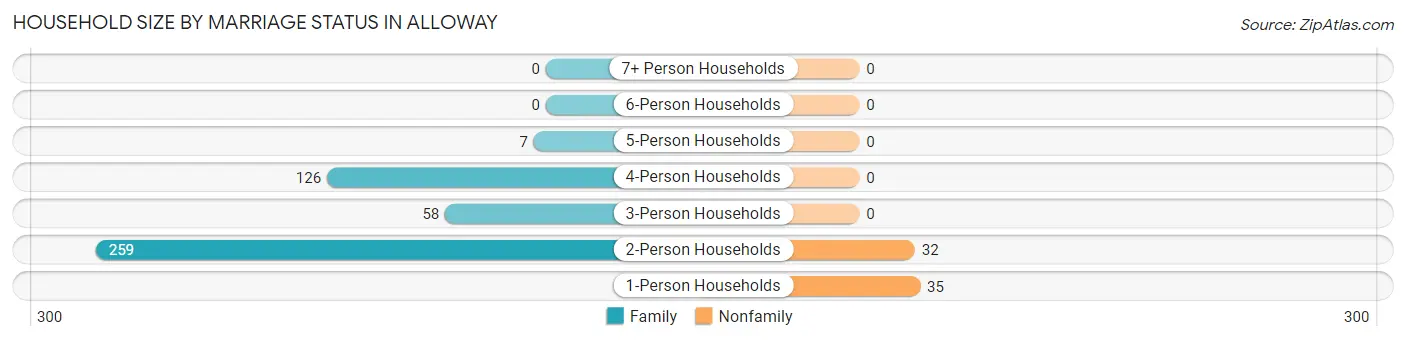
Out of a total of 517 households in Alloway, 450 (87.0%) are family households, while 67 (13.0%) are nonfamily households. The most numerous type of family households are 2-person households, comprising 259, and the most common type of nonfamily households are 1-person households, comprising 35.
| Household Size | Family Households | Nonfamily Households |
| 1-Person Households | - | 35 (6.8%) |
| 2-Person Households | 259 (50.1%) | 32 (6.2%) |
| 3-Person Households | 58 (11.2%) | 0 (0.0%) |
| 4-Person Households | 126 (24.4%) | 0 (0.0%) |
| 5-Person Households | 7 (1.3%) | 0 (0.0%) |
| 6-Person Households | 0 (0.0%) | 0 (0.0%) |
| 7+ Person Households | 0 (0.0%) | 0 (0.0%) |
| Total | 450 (87.0%) | 67 (13.0%) |
Female Fertility in Alloway
Fertility by Age in Alloway
| Age Bracket | Women with Births | Births / 1,000 Women |
| 15 to 19 years | 0 (0.0%) | 0.0 |
| 20 to 34 years | 0 (0.0%) | 0.0 |
| 35 to 50 years | 0 (0.0%) | 0.0 |
| Total | 0 (0.0%) | 0.0 |
Fertility by Age by Marriage Status in Alloway
| Age Bracket | Married | Unmarried |
| 15 to 19 years | 0 (0.0%) | 0 (0.0%) |
| 20 to 34 years | 0 (0.0%) | 0 (0.0%) |
| 35 to 50 years | 0 (0.0%) | 0 (0.0%) |
| Total | 0 (0.0%) | 0 (0.0%) |
Fertility by Education in Alloway
| Educational Attainment | Women with Births | Births / 1,000 Women |
| Less than High School | 0 (0.0%) | 0.0 |
| High School Diploma | 0 (0.0%) | 0.0 |
| College or Associate's Degree | 0 (0.0%) | 0.0 |
| Bachelor's Degree | 0 (0.0%) | 0.0 |
| Graduate Degree | 0 (0.0%) | 0.0 |
| Total | 0 (0.0%) | 0.0 |
Fertility by Education by Marriage Status in Alloway
| Educational Attainment | Married | Unmarried |
| Less than High School | 0 (0.0%) | 0 (0.0%) |
| High School Diploma | 0 (0.0%) | 0 (0.0%) |
| College or Associate's Degree | 0 (0.0%) | 0 (0.0%) |
| Bachelor's Degree | 0 (0.0%) | 0 (0.0%) |
| Graduate Degree | 0 (0.0%) | 0 (0.0%) |
| Total | 0 (0.0%) | 0 (0.0%) |
Employment Characteristics in Alloway
Employment by Class of Employer in Alloway
Among the 730 employed individuals in Alloway, private company employees (573 | 78.5%), not-for-profit organizations (57 | 7.8%), and state government employees (44 | 6.0%) make up the most common classes of employment.
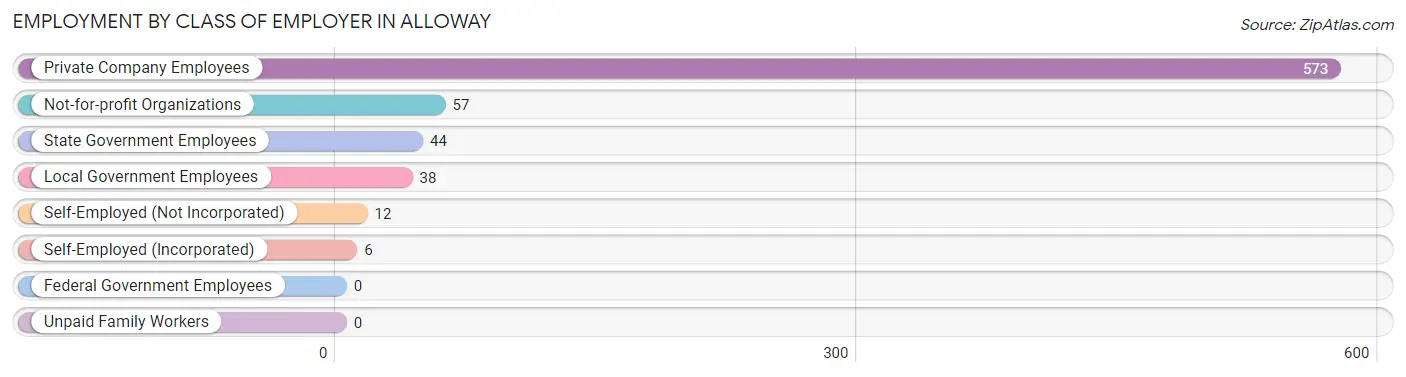
| Employer Class | # Employees | % Employees |
| Private Company Employees | 573 | 78.5% |
| Self-Employed (Incorporated) | 6 | 0.8% |
| Self-Employed (Not Incorporated) | 12 | 1.6% |
| Not-for-profit Organizations | 57 | 7.8% |
| Local Government Employees | 38 | 5.2% |
| State Government Employees | 44 | 6.0% |
| Federal Government Employees | 0 | 0.0% |
| Unpaid Family Workers | 0 | 0.0% |
| Total | 730 | 100.0% |
Employment Status by Age in Alloway
According to the labor force statistics for Alloway, out of the total population over 16 years of age (1,273), 63.4% or 807 individuals are in the labor force, with 8.7% or 70 of them unemployed. The age group with the highest labor force participation rate is 25 to 29 years, with 100.0% or 121 individuals in the labor force. Within the labor force, the 20 to 24 years age range has the highest percentage of unemployed individuals, with 25.9% or 22 of them being unemployed.
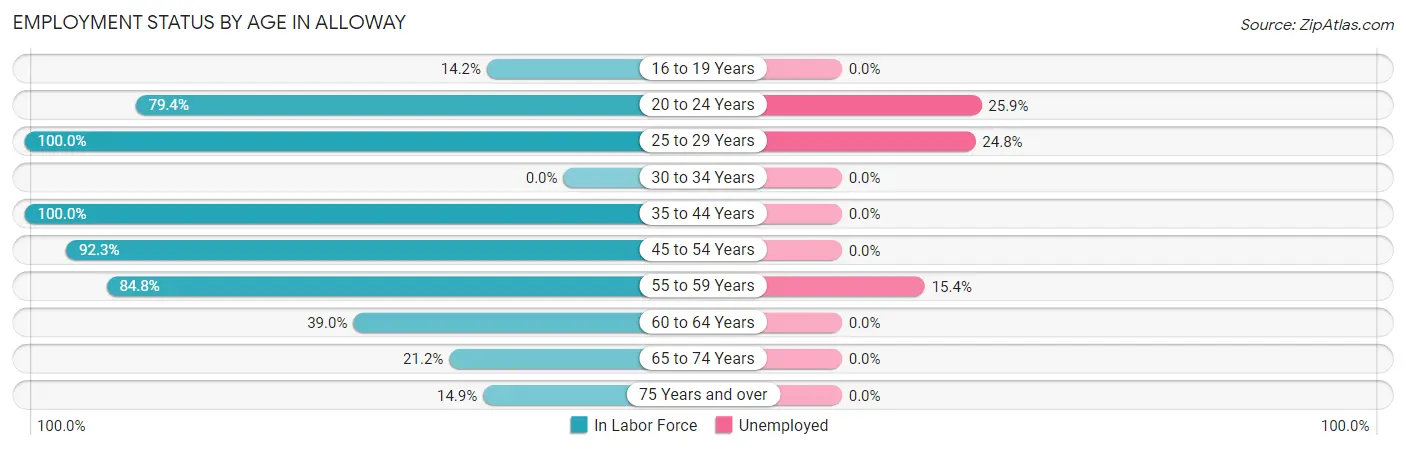
| Age Bracket | In Labor Force | Unemployed |
| 16 to 19 Years | 16 (14.2%) | 0 (0.0%) |
| 20 to 24 Years | 85 (79.4%) | 22 (25.9%) |
| 25 to 29 Years | 121 (100.0%) | 30 (24.8%) |
| 30 to 34 Years | 0 (0.0%) | 0 (0.0%) |
| 35 to 44 Years | 78 (100.0%) | 0 (0.0%) |
| 45 to 54 Years | 289 (92.3%) | 0 (0.0%) |
| 55 to 59 Years | 117 (84.8%) | 18 (15.4%) |
| 60 to 64 Years | 48 (39.0%) | 0 (0.0%) |
| 65 to 74 Years | 38 (21.2%) | 0 (0.0%) |
| 75 Years and over | 15 (14.9%) | 0 (0.0%) |
| Total | 807 (63.4%) | 70 (8.7%) |
Employment Status by Educational Attainment in Alloway
According to labor force statistics for Alloway, 84.5% of individuals (653) out of the total population between 25 and 64 years of age (773) are in the labor force, with 7.4% or 48 of them being unemployed. The group with the highest labor force participation rate are those with the educational attainment of bachelor's degree or higher, with 96.3% or 232 individuals in the labor force. Within the labor force, individuals with high school diploma education have the highest percentage of unemployment, with 30.0% or 48 of them being unemployed.
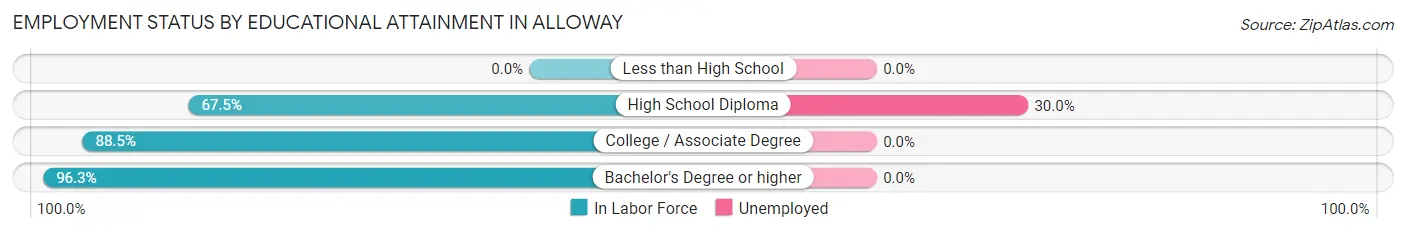
| Educational Attainment | In Labor Force | Unemployed |
| Less than High School | 0 (0.0%) | 0 (0.0%) |
| High School Diploma | 160 (67.5%) | 71 (30.0%) |
| College / Associate Degree | 261 (88.5%) | 0 (0.0%) |
| Bachelor's Degree or higher | 232 (96.3%) | 0 (0.0%) |
| Total | 653 (84.5%) | 57 (7.4%) |
Employment Occupations by Sex in Alloway
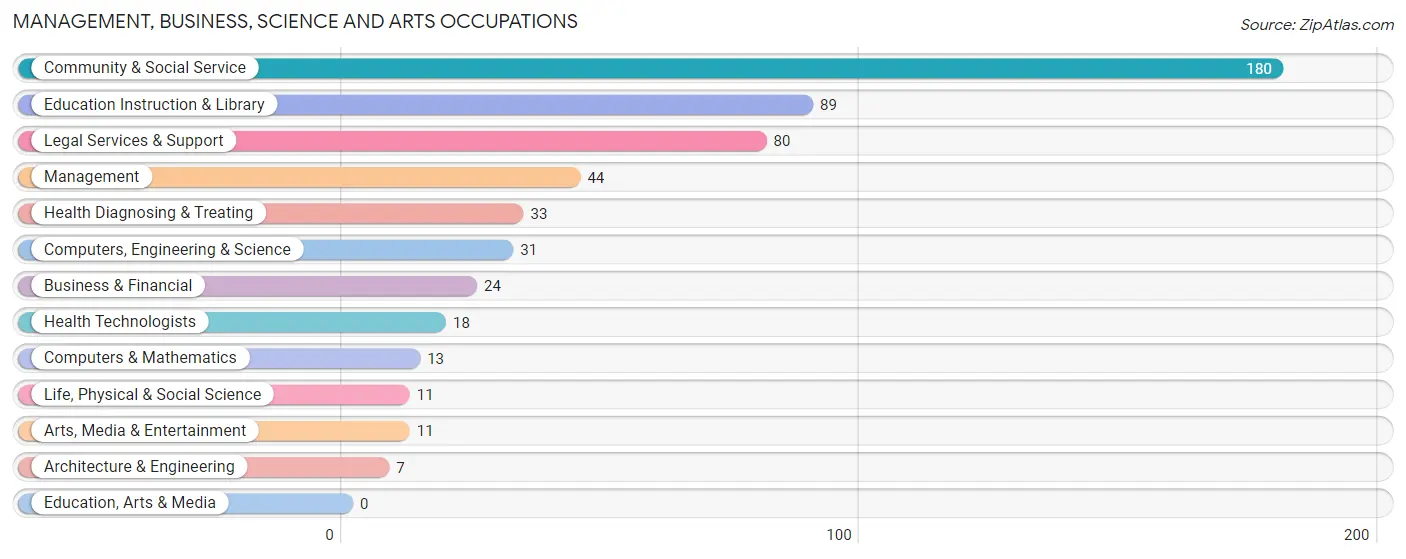
Management, Business, Science and Arts Occupations
The most common Management, Business, Science and Arts occupations in Alloway are Community & Social Service (180 | 24.4%), Education Instruction & Library (89 | 12.1%), Legal Services & Support (80 | 10.8%), Management (44 | 6.0%), and Health Diagnosing & Treating (33 | 4.5%).
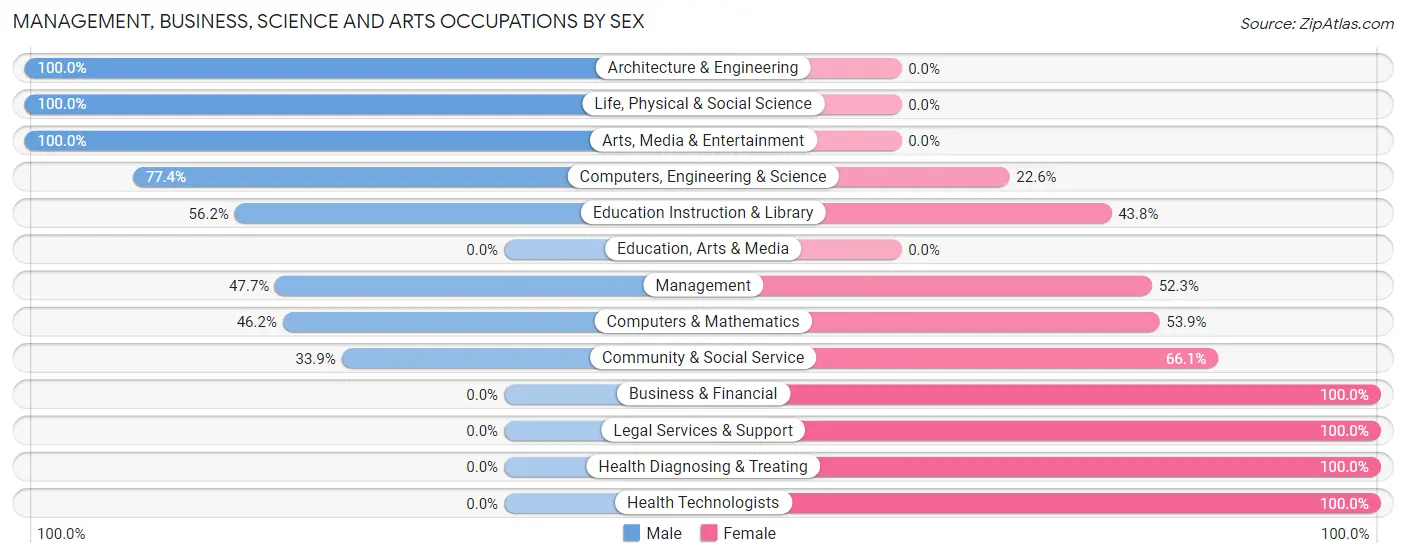
Management, Business, Science and Arts Occupations by Sex
Within the Management, Business, Science and Arts occupations in Alloway, the most male-oriented occupations are Architecture & Engineering (100.0%), Life, Physical & Social Science (100.0%), and Arts, Media & Entertainment (100.0%), while the most female-oriented occupations are Business & Financial (100.0%), Legal Services & Support (100.0%), and Health Diagnosing & Treating (100.0%).
| Occupation | Male | Female |
| Management | 21 (47.7%) | 23 (52.3%) |
| Business & Financial | 0 (0.0%) | 24 (100.0%) |
| Computers, Engineering & Science | 24 (77.4%) | 7 (22.6%) |
| Computers & Mathematics | 6 (46.2%) | 7 (53.8%) |
| Architecture & Engineering | 7 (100.0%) | 0 (0.0%) |
| Life, Physical & Social Science | 11 (100.0%) | 0 (0.0%) |
| Community & Social Service | 61 (33.9%) | 119 (66.1%) |
| Education, Arts & Media | 0 (0.0%) | 0 (0.0%) |
| Legal Services & Support | 0 (0.0%) | 80 (100.0%) |
| Education Instruction & Library | 50 (56.2%) | 39 (43.8%) |
| Arts, Media & Entertainment | 11 (100.0%) | 0 (0.0%) |
| Health Diagnosing & Treating | 0 (0.0%) | 33 (100.0%) |
| Health Technologists | 0 (0.0%) | 18 (100.0%) |
| Total (Category) | 106 (34.0%) | 206 (66.0%) |
| Total (Overall) | 369 (50.1%) | 368 (49.9%) |
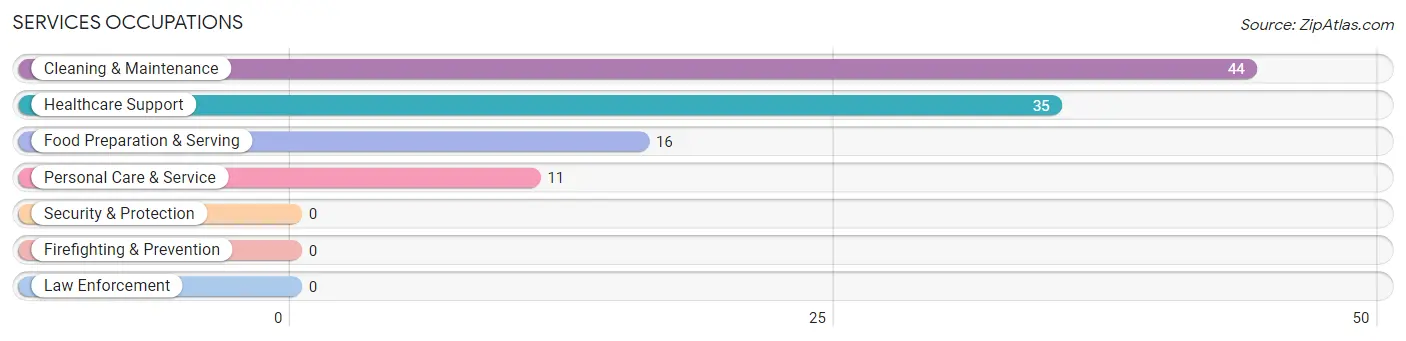
Services Occupations
The most common Services occupations in Alloway are Cleaning & Maintenance (44 | 6.0%), Healthcare Support (35 | 4.8%), Food Preparation & Serving (16 | 2.2%), and Personal Care & Service (11 | 1.5%).
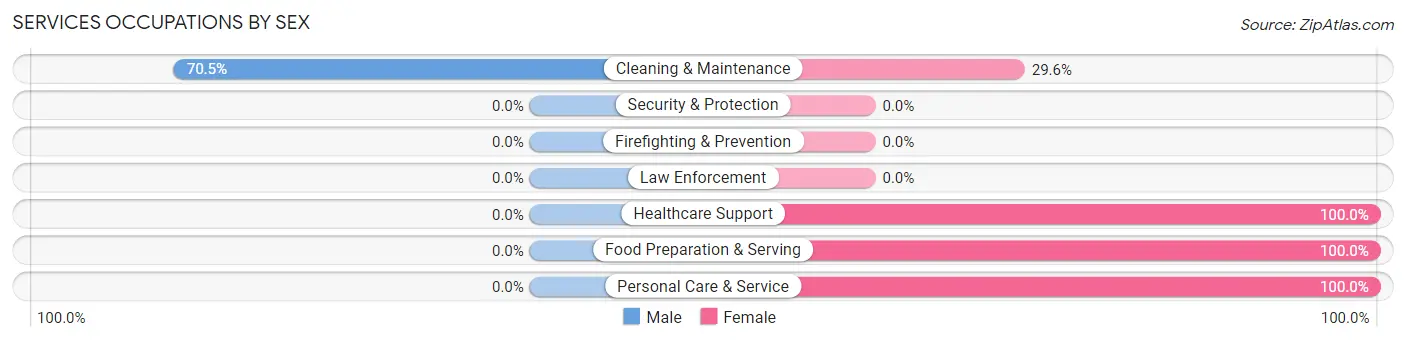
Services Occupations by Sex
| Occupation | Male | Female |
| Healthcare Support | 0 (0.0%) | 35 (100.0%) |
| Security & Protection | 0 (0.0%) | 0 (0.0%) |
| Firefighting & Prevention | 0 (0.0%) | 0 (0.0%) |
| Law Enforcement | 0 (0.0%) | 0 (0.0%) |
| Food Preparation & Serving | 0 (0.0%) | 16 (100.0%) |
| Cleaning & Maintenance | 31 (70.5%) | 13 (29.5%) |
| Personal Care & Service | 0 (0.0%) | 11 (100.0%) |
| Total (Category) | 31 (29.2%) | 75 (70.8%) |
| Total (Overall) | 369 (50.1%) | 368 (49.9%) |
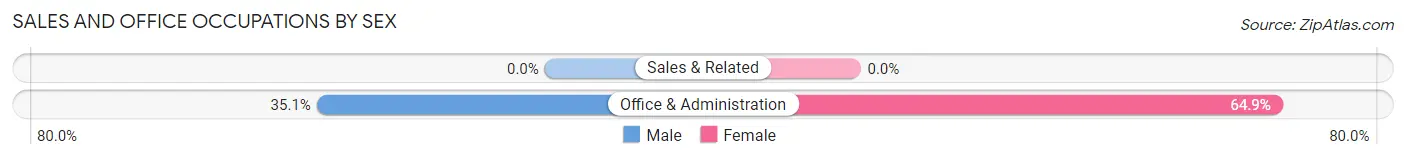
Sales and Office Occupations
The most common Sales and Office occupations in Alloway are , and Office & Administration (134 | 18.2%).
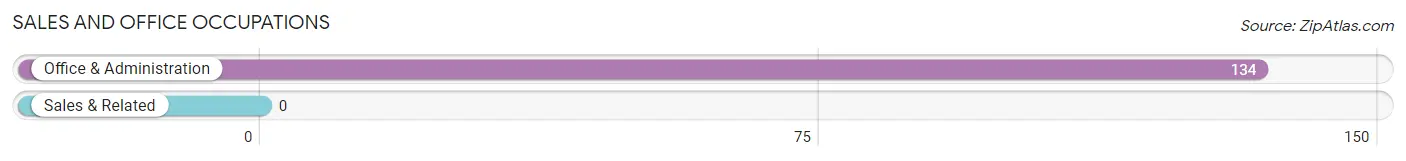
Sales and Office Occupations by Sex
| Occupation | Male | Female |
| Sales & Related | 0 (0.0%) | 0 (0.0%) |
| Office & Administration | 47 (35.1%) | 87 (64.9%) |
| Total (Category) | 47 (35.1%) | 87 (64.9%) |
| Total (Overall) | 369 (50.1%) | 368 (49.9%) |
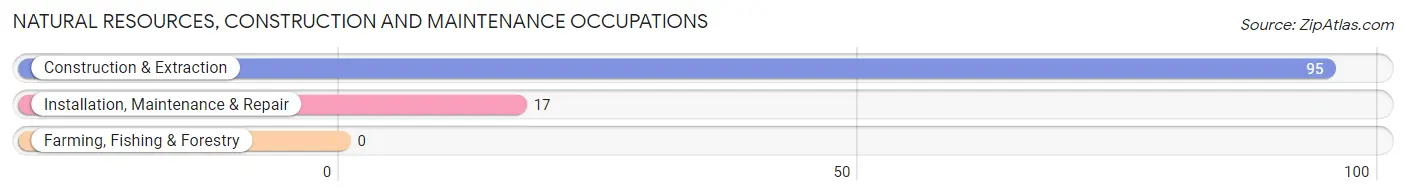
Natural Resources, Construction and Maintenance Occupations
The most common Natural Resources, Construction and Maintenance occupations in Alloway are Construction & Extraction (95 | 12.9%), and Installation, Maintenance & Repair (17 | 2.3%).
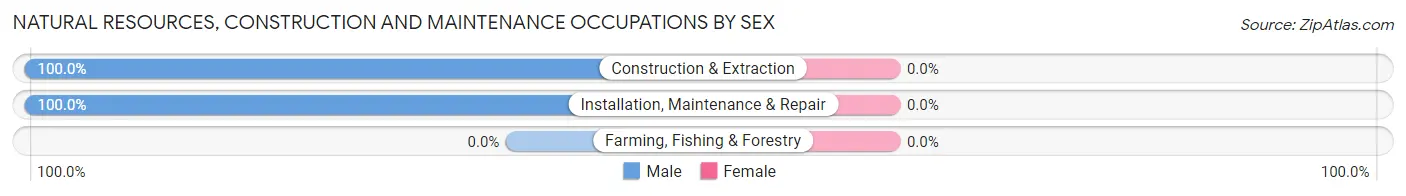
Natural Resources, Construction and Maintenance Occupations by Sex
| Occupation | Male | Female |
| Farming, Fishing & Forestry | 0 (0.0%) | 0 (0.0%) |
| Construction & Extraction | 95 (100.0%) | 0 (0.0%) |
| Installation, Maintenance & Repair | 17 (100.0%) | 0 (0.0%) |
| Total (Category) | 112 (100.0%) | 0 (0.0%) |
| Total (Overall) | 369 (50.1%) | 368 (49.9%) |
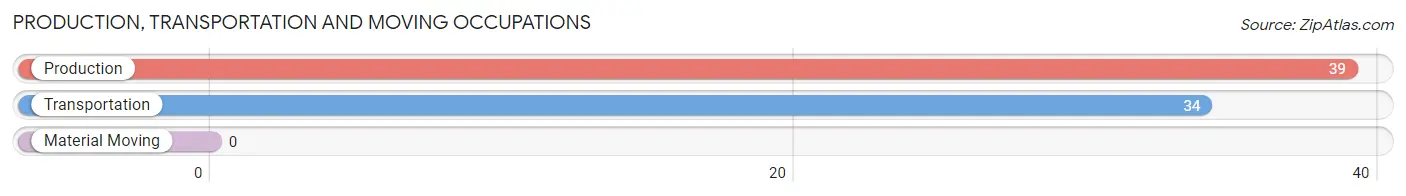
Production, Transportation and Moving Occupations
The most common Production, Transportation and Moving occupations in Alloway are Production (39 | 5.3%), and Transportation (34 | 4.6%).
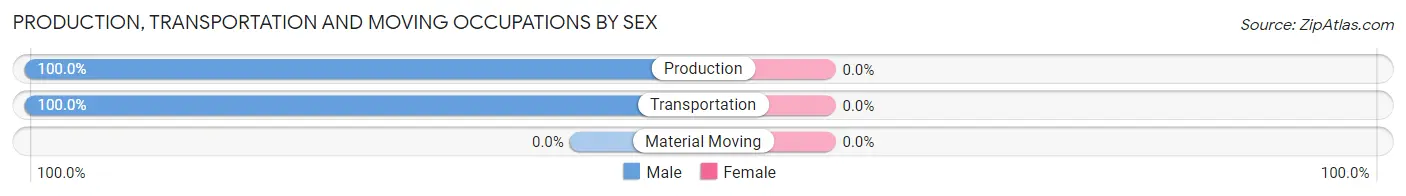
Production, Transportation and Moving Occupations by Sex
| Occupation | Male | Female |
| Production | 39 (100.0%) | 0 (0.0%) |
| Transportation | 34 (100.0%) | 0 (0.0%) |
| Material Moving | 0 (0.0%) | 0 (0.0%) |
| Total (Category) | 73 (100.0%) | 0 (0.0%) |
| Total (Overall) | 369 (50.1%) | 368 (49.9%) |
Employment Industries by Sex in Alloway
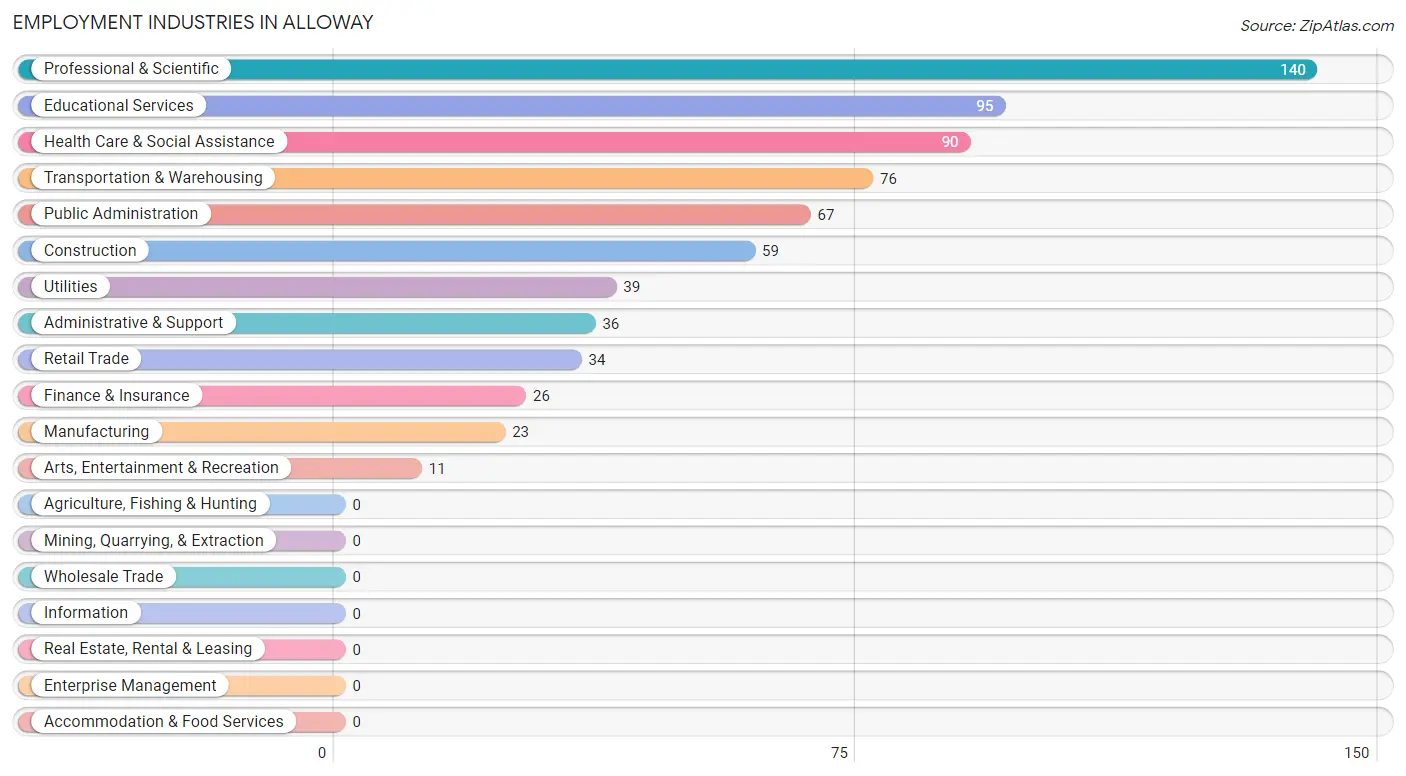
Employment Industries in Alloway
The major employment industries in Alloway include Professional & Scientific (140 | 19.0%), Educational Services (95 | 12.9%), Health Care & Social Assistance (90 | 12.2%), Transportation & Warehousing (76 | 10.3%), and Public Administration (67 | 9.1%).
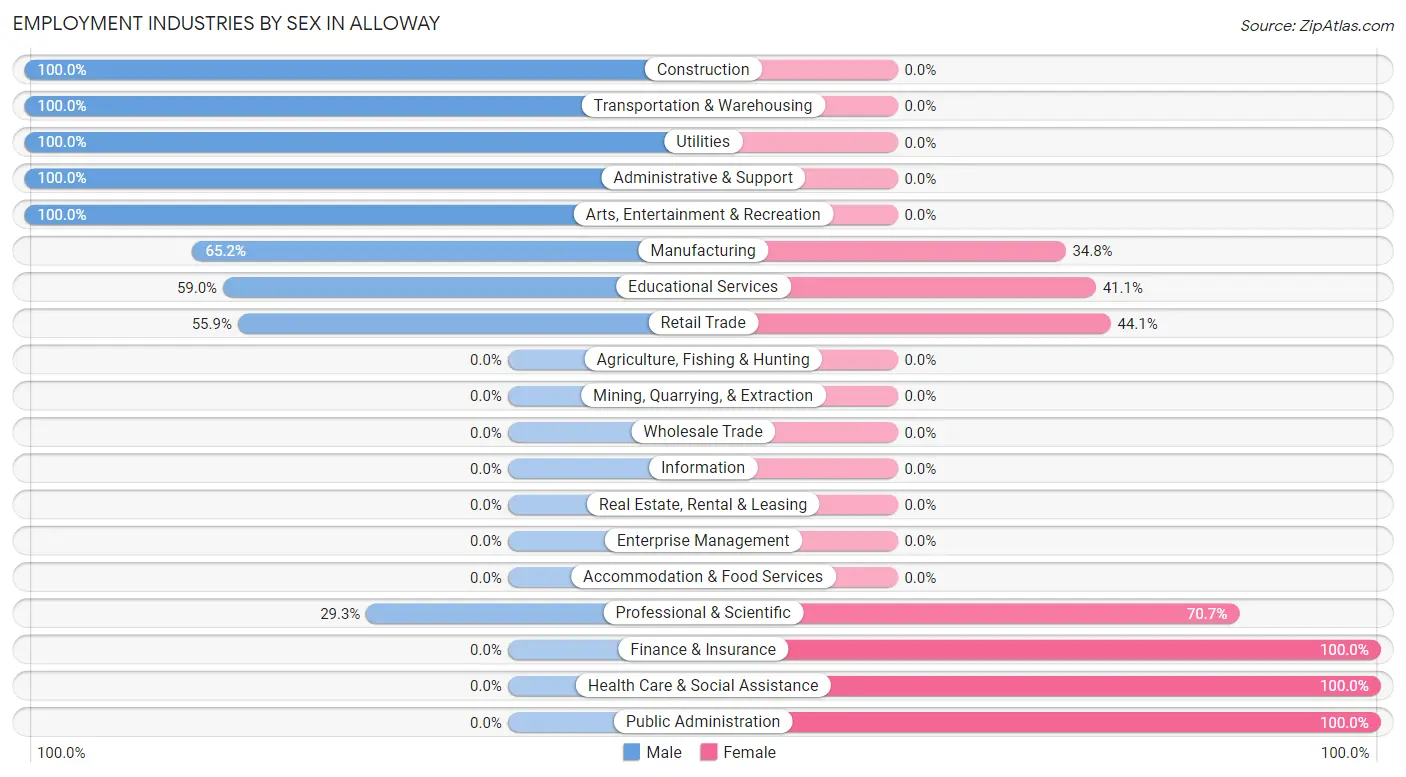
Employment Industries by Sex in Alloway
The Alloway industries that see more men than women are Construction (100.0%), Transportation & Warehousing (100.0%), and Utilities (100.0%), whereas the industries that tend to have a higher number of women are Finance & Insurance (100.0%), Health Care & Social Assistance (100.0%), and Public Administration (100.0%).
| Industry | Male | Female |
| Agriculture, Fishing & Hunting | 0 (0.0%) | 0 (0.0%) |
| Mining, Quarrying, & Extraction | 0 (0.0%) | 0 (0.0%) |
| Construction | 59 (100.0%) | 0 (0.0%) |
| Manufacturing | 15 (65.2%) | 8 (34.8%) |
| Wholesale Trade | 0 (0.0%) | 0 (0.0%) |
| Retail Trade | 19 (55.9%) | 15 (44.1%) |
| Transportation & Warehousing | 76 (100.0%) | 0 (0.0%) |
| Utilities | 39 (100.0%) | 0 (0.0%) |
| Information | 0 (0.0%) | 0 (0.0%) |
| Finance & Insurance | 0 (0.0%) | 26 (100.0%) |
| Real Estate, Rental & Leasing | 0 (0.0%) | 0 (0.0%) |
| Professional & Scientific | 41 (29.3%) | 99 (70.7%) |
| Enterprise Management | 0 (0.0%) | 0 (0.0%) |
| Administrative & Support | 36 (100.0%) | 0 (0.0%) |
| Educational Services | 56 (59.0%) | 39 (41.0%) |
| Health Care & Social Assistance | 0 (0.0%) | 90 (100.0%) |
| Arts, Entertainment & Recreation | 11 (100.0%) | 0 (0.0%) |
| Accommodation & Food Services | 0 (0.0%) | 0 (0.0%) |
| Public Administration | 0 (0.0%) | 67 (100.0%) |
| Total | 369 (50.1%) | 368 (49.9%) |
Education in Alloway
School Enrollment in Alloway
The most common levels of schooling among the 298 students in Alloway are high school (131 | 44.0%), middle school (71 | 23.8%), and elementary school (61 | 20.5%).
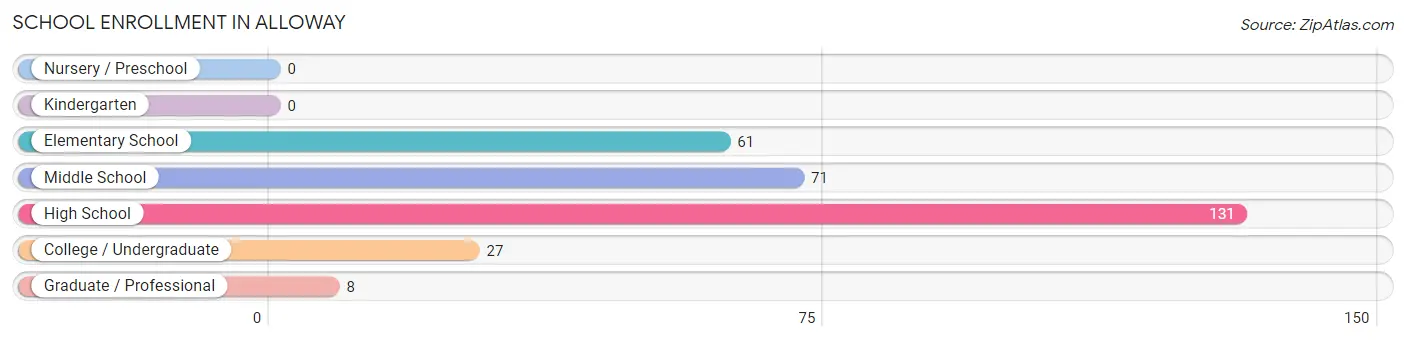
| School Level | # Students | % Students |
| Nursery / Preschool | 0 | 0.0% |
| Kindergarten | 0 | 0.0% |
| Elementary School | 61 | 20.5% |
| Middle School | 71 | 23.8% |
| High School | 131 | 44.0% |
| College / Undergraduate | 27 | 9.1% |
| Graduate / Professional | 8 | 2.7% |
| Total | 298 | 100.0% |
School Enrollment by Age by Funding Source in Alloway
Out of a total of 298 students who are enrolled in schools in Alloway, 12 (4.0%) attend a private institution, while the remaining 286 (96.0%) are enrolled in public schools. The age group of 35 years and over has the highest likelihood of being enrolled in private schools, with 8 (100.0% in the age bracket) enrolled. Conversely, the age group of 10 to 14 year olds has the lowest likelihood of being enrolled in a private school, with 84 (100.0% in the age bracket) attending a public institution.
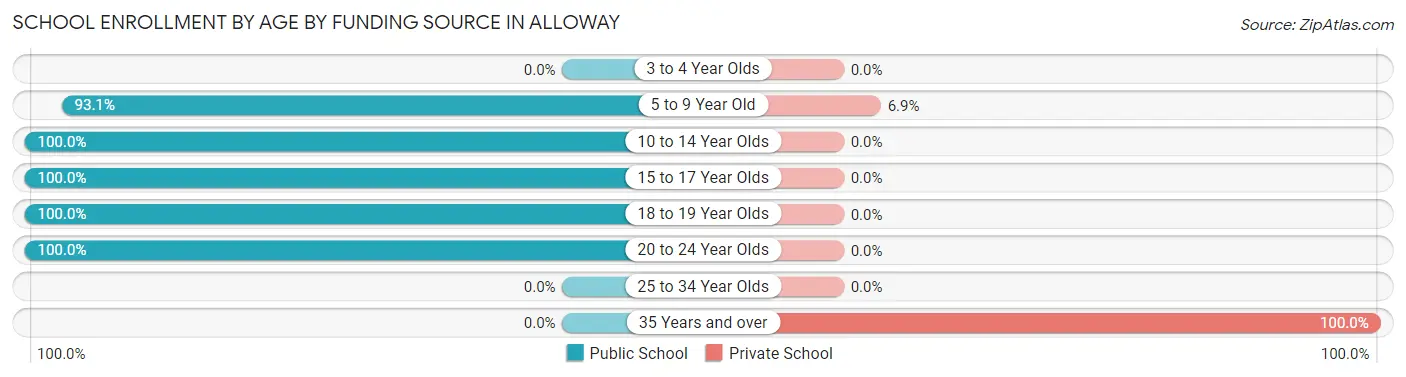
| Age Bracket | Public School | Private School |
| 3 to 4 Year Olds | 0 (0.0%) | 0 (0.0%) |
| 5 to 9 Year Old | 54 (93.1%) | 4 (6.9%) |
| 10 to 14 Year Olds | 84 (100.0%) | 0 (0.0%) |
| 15 to 17 Year Olds | 113 (100.0%) | 0 (0.0%) |
| 18 to 19 Year Olds | 13 (100.0%) | 0 (0.0%) |
| 20 to 24 Year Olds | 22 (100.0%) | 0 (0.0%) |
| 25 to 34 Year Olds | 0 (0.0%) | 0 (0.0%) |
| 35 Years and over | 0 (0.0%) | 8 (100.0%) |
| Total | 286 (96.0%) | 12 (4.0%) |
Educational Attainment by Field of Study in Alloway
Liberal arts & history (92 | 26.4%), education (58 | 16.6%), business (43 | 12.3%), social sciences (31 | 8.9%), and engineering (25 | 7.2%) are the most common fields of study among 349 individuals in Alloway who have obtained a bachelor's degree or higher.
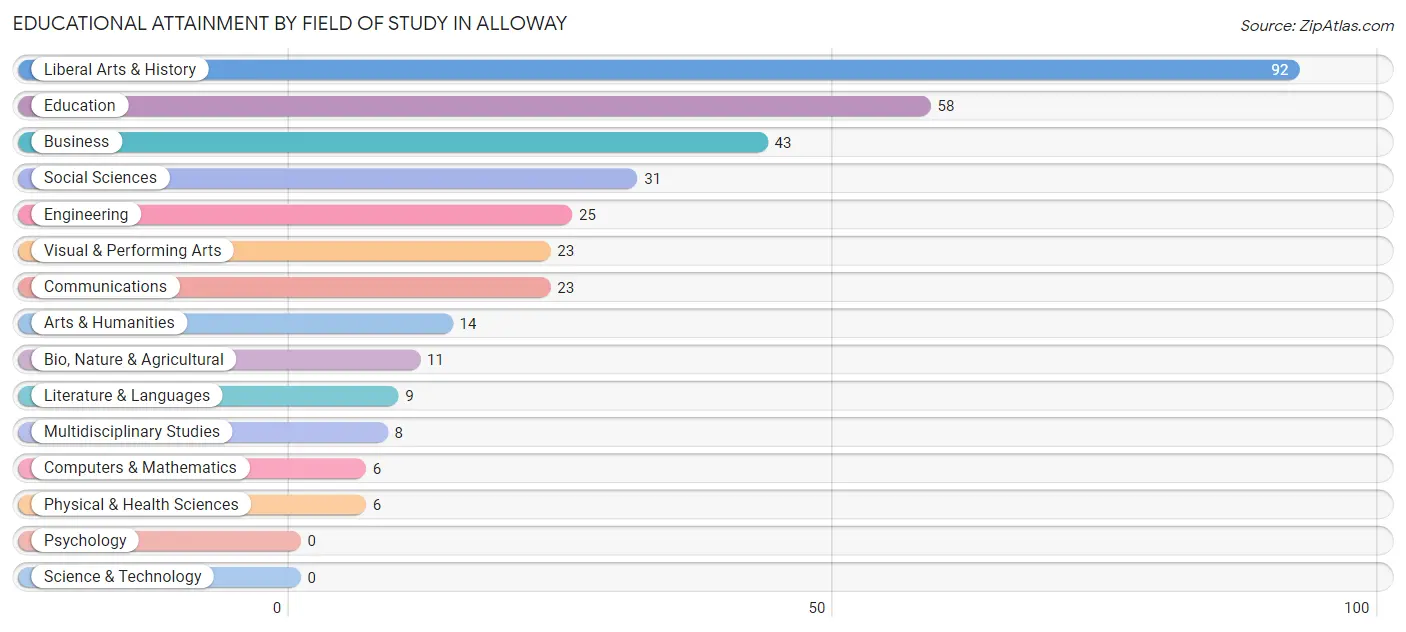
| Field of Study | # Graduates | % Graduates |
| Computers & Mathematics | 6 | 1.7% |
| Bio, Nature & Agricultural | 11 | 3.2% |
| Physical & Health Sciences | 6 | 1.7% |
| Psychology | 0 | 0.0% |
| Social Sciences | 31 | 8.9% |
| Engineering | 25 | 7.2% |
| Multidisciplinary Studies | 8 | 2.3% |
| Science & Technology | 0 | 0.0% |
| Business | 43 | 12.3% |
| Education | 58 | 16.6% |
| Literature & Languages | 9 | 2.6% |
| Liberal Arts & History | 92 | 26.4% |
| Visual & Performing Arts | 23 | 6.6% |
| Communications | 23 | 6.6% |
| Arts & Humanities | 14 | 4.0% |
| Total | 349 | 100.0% |
Transportation & Commute in Alloway
Vehicle Availability by Sex in Alloway
The most prevalent vehicle ownership categories in Alloway are males with 2 vehicles (148, accounting for 40.8%) and females with 2 vehicles (133, making up 41.0%).
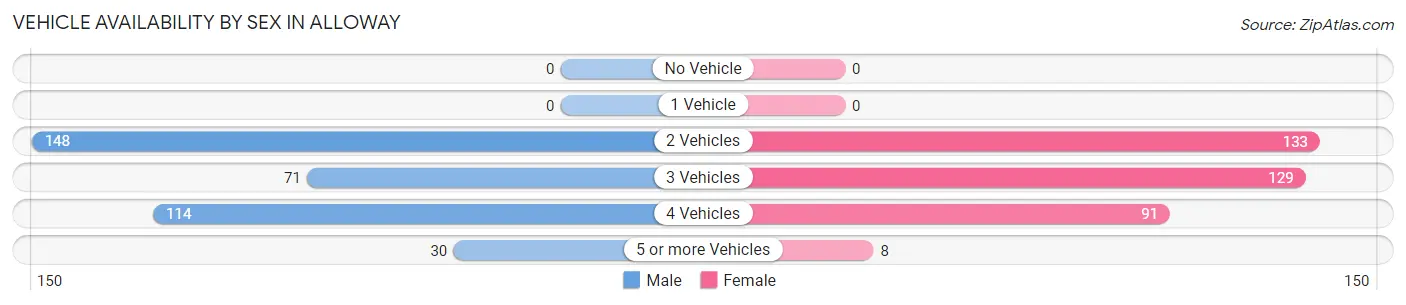
| Vehicles Available | Male | Female |
| No Vehicle | 0 (0.0%) | 0 (0.0%) |
| 1 Vehicle | 0 (0.0%) | 0 (0.0%) |
| 2 Vehicles | 148 (40.8%) | 133 (36.8%) |
| 3 Vehicles | 71 (19.6%) | 129 (35.7%) |
| 4 Vehicles | 114 (31.4%) | 91 (25.2%) |
| 5 or more Vehicles | 30 (8.3%) | 8 (2.2%) |
| Total | 363 (100.0%) | 361 (100.0%) |
Commute Time in Alloway
The most frequently occuring commute durations in Alloway are 60 to 89 minutes (289 commuters, 43.3%), 15 to 19 minutes (118 commuters, 17.7%), and 35 to 39 minutes (51 commuters, 7.6%).
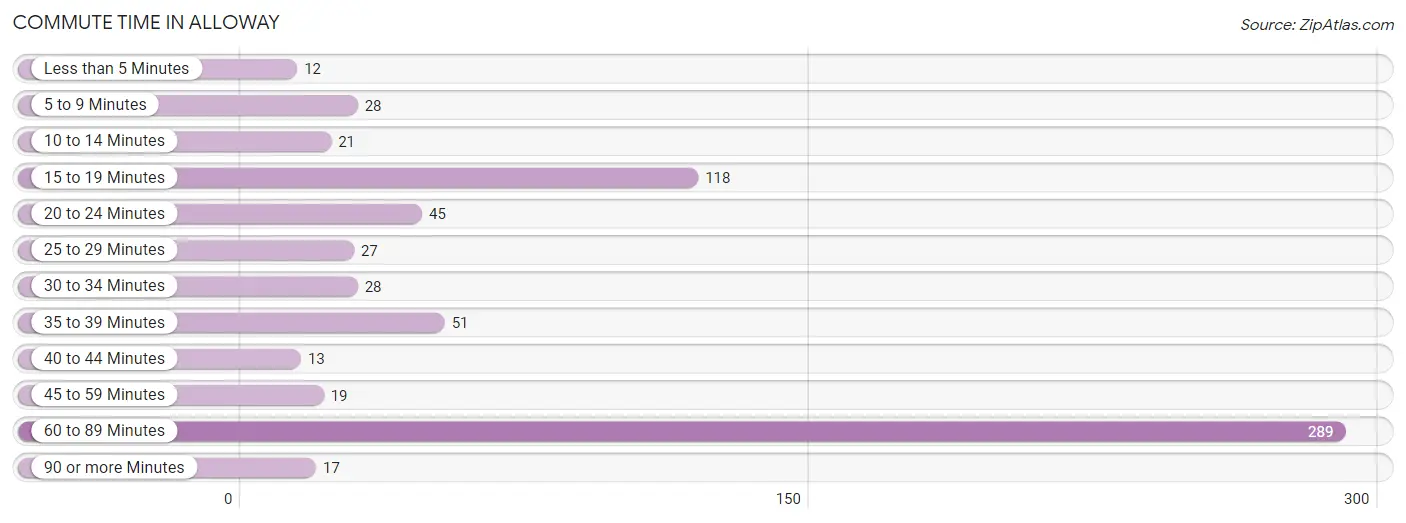
| Commute Time | # Commuters | % Commuters |
| Less than 5 Minutes | 12 | 1.8% |
| 5 to 9 Minutes | 28 | 4.2% |
| 10 to 14 Minutes | 21 | 3.1% |
| 15 to 19 Minutes | 118 | 17.7% |
| 20 to 24 Minutes | 45 | 6.7% |
| 25 to 29 Minutes | 27 | 4.0% |
| 30 to 34 Minutes | 28 | 4.2% |
| 35 to 39 Minutes | 51 | 7.6% |
| 40 to 44 Minutes | 13 | 1.9% |
| 45 to 59 Minutes | 19 | 2.8% |
| 60 to 89 Minutes | 289 | 43.3% |
| 90 or more Minutes | 17 | 2.5% |
Commute Time by Sex in Alloway
The most common commute times in Alloway are 60 to 89 minutes (148 commuters, 42.0%) for males and 60 to 89 minutes (141 commuters, 44.6%) for females.
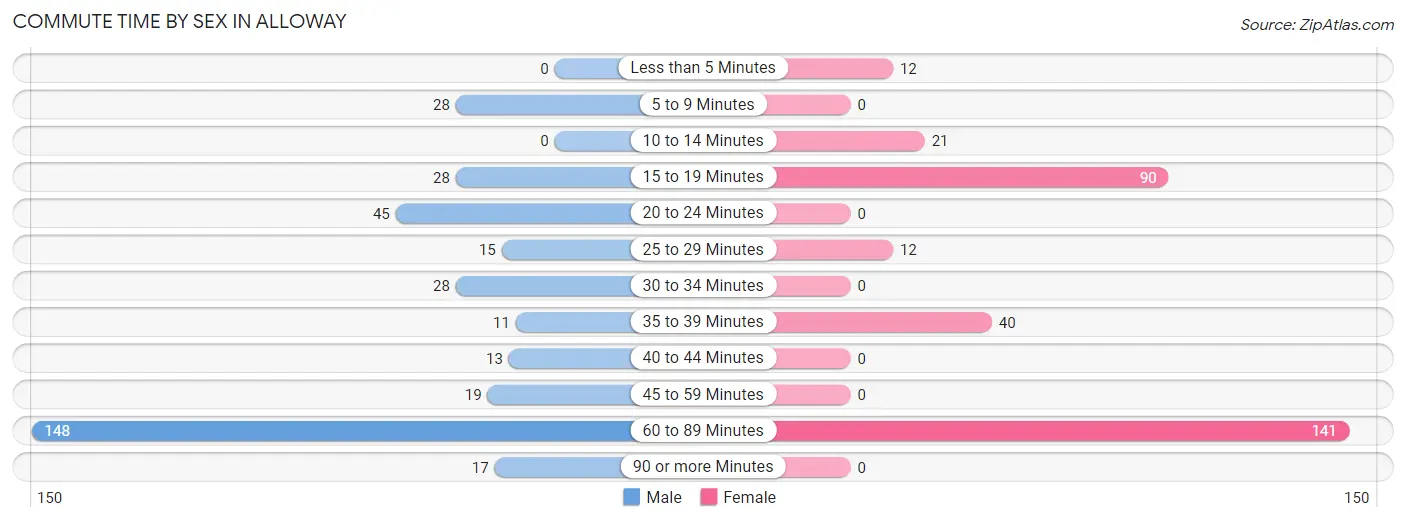
| Commute Time | Male | Female |
| Less than 5 Minutes | 0 (0.0%) | 12 (3.8%) |
| 5 to 9 Minutes | 28 (8.0%) | 0 (0.0%) |
| 10 to 14 Minutes | 0 (0.0%) | 21 (6.7%) |
| 15 to 19 Minutes | 28 (8.0%) | 90 (28.5%) |
| 20 to 24 Minutes | 45 (12.8%) | 0 (0.0%) |
| 25 to 29 Minutes | 15 (4.3%) | 12 (3.8%) |
| 30 to 34 Minutes | 28 (8.0%) | 0 (0.0%) |
| 35 to 39 Minutes | 11 (3.1%) | 40 (12.7%) |
| 40 to 44 Minutes | 13 (3.7%) | 0 (0.0%) |
| 45 to 59 Minutes | 19 (5.4%) | 0 (0.0%) |
| 60 to 89 Minutes | 148 (42.0%) | 141 (44.6%) |
| 90 or more Minutes | 17 (4.8%) | 0 (0.0%) |
Time of Departure to Work by Sex in Alloway
The most frequent times of departure to work in Alloway are 7:00 AM to 7:29 AM (93, 26.4%) for males and 7:00 AM to 7:29 AM (88, 27.9%) for females.
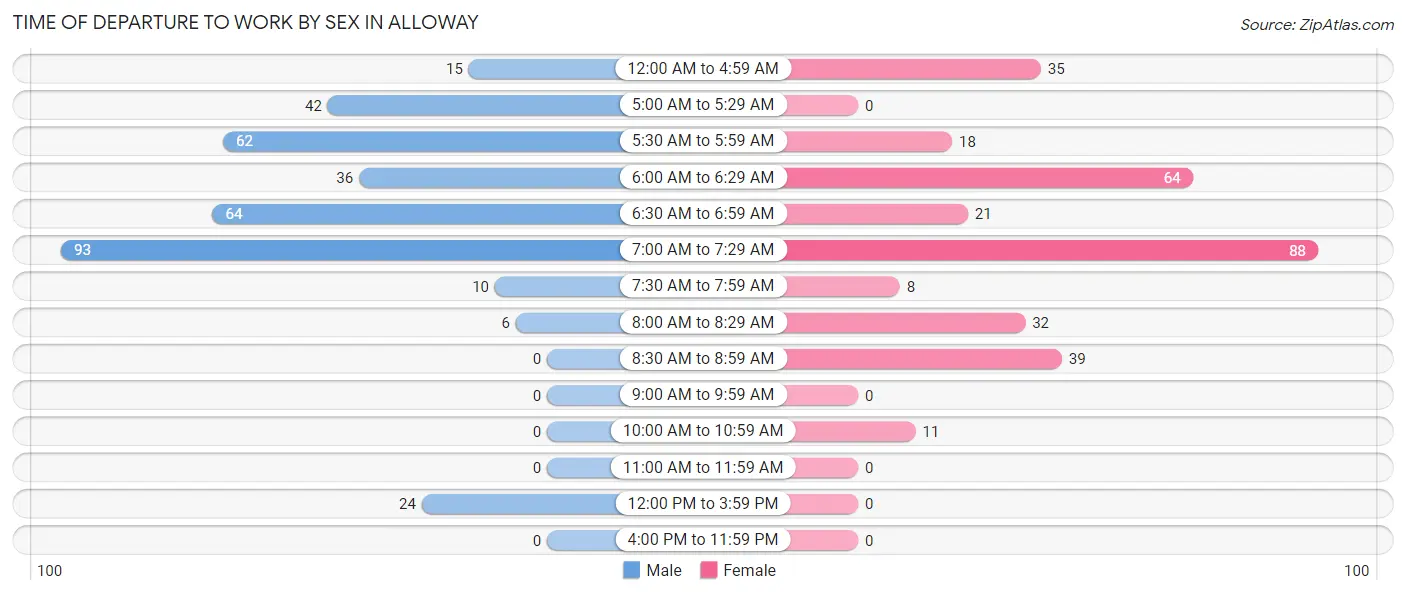
| Time of Departure | Male | Female |
| 12:00 AM to 4:59 AM | 15 (4.3%) | 35 (11.1%) |
| 5:00 AM to 5:29 AM | 42 (11.9%) | 0 (0.0%) |
| 5:30 AM to 5:59 AM | 62 (17.6%) | 18 (5.7%) |
| 6:00 AM to 6:29 AM | 36 (10.2%) | 64 (20.3%) |
| 6:30 AM to 6:59 AM | 64 (18.2%) | 21 (6.7%) |
| 7:00 AM to 7:29 AM | 93 (26.4%) | 88 (27.9%) |
| 7:30 AM to 7:59 AM | 10 (2.8%) | 8 (2.5%) |
| 8:00 AM to 8:29 AM | 6 (1.7%) | 32 (10.1%) |
| 8:30 AM to 8:59 AM | 0 (0.0%) | 39 (12.3%) |
| 9:00 AM to 9:59 AM | 0 (0.0%) | 0 (0.0%) |
| 10:00 AM to 10:59 AM | 0 (0.0%) | 11 (3.5%) |
| 11:00 AM to 11:59 AM | 0 (0.0%) | 0 (0.0%) |
| 12:00 PM to 3:59 PM | 24 (6.8%) | 0 (0.0%) |
| 4:00 PM to 11:59 PM | 0 (0.0%) | 0 (0.0%) |
| Total | 352 (100.0%) | 316 (100.0%) |
Housing Occupancy in Alloway
Occupancy by Ownership in Alloway
Of the total 517 dwellings in Alloway, owner-occupied units account for 463 (89.6%), while renter-occupied units make up 54 (10.4%).
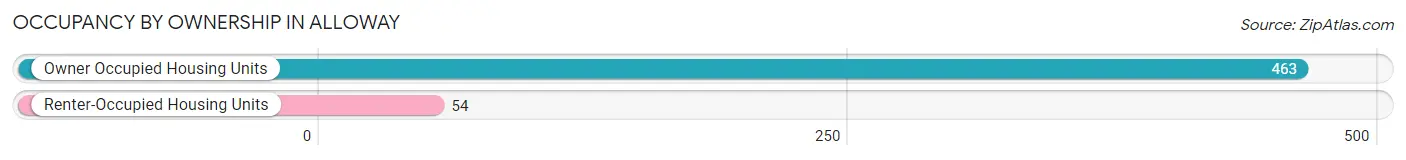
| Occupancy | # Housing Units | % Housing Units |
| Owner Occupied Housing Units | 463 | 89.6% |
| Renter-Occupied Housing Units | 54 | 10.4% |
| Total Occupied Housing Units | 517 | 100.0% |
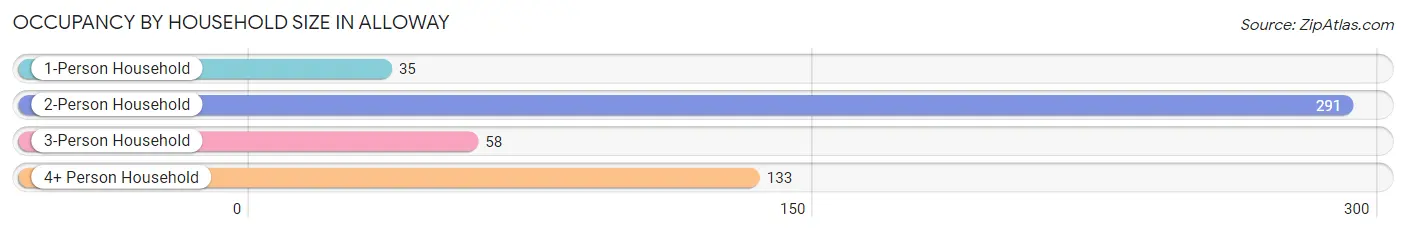
Occupancy by Household Size in Alloway
| Household Size | # Housing Units | % Housing Units |
| 1-Person Household | 35 | 6.8% |
| 2-Person Household | 291 | 56.3% |
| 3-Person Household | 58 | 11.2% |
| 4+ Person Household | 133 | 25.7% |
| Total Housing Units | 517 | 100.0% |
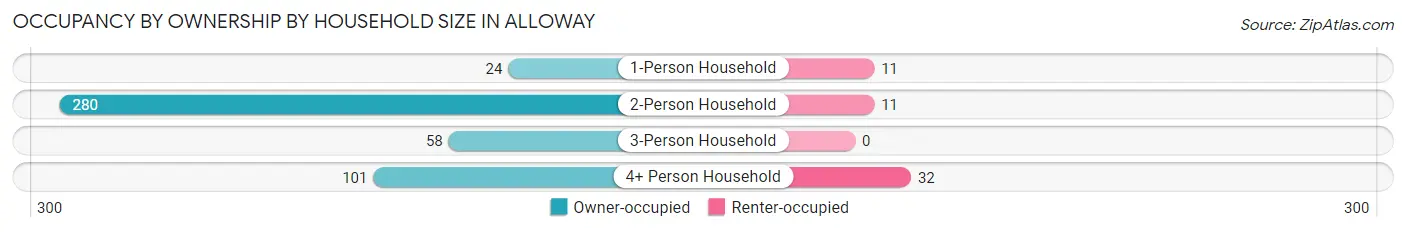
Occupancy by Ownership by Household Size in Alloway
| Household Size | Owner-occupied | Renter-occupied |
| 1-Person Household | 24 (68.6%) | 11 (31.4%) |
| 2-Person Household | 280 (96.2%) | 11 (3.8%) |
| 3-Person Household | 58 (100.0%) | 0 (0.0%) |
| 4+ Person Household | 101 (75.9%) | 32 (24.1%) |
| Total Housing Units | 463 (89.6%) | 54 (10.4%) |
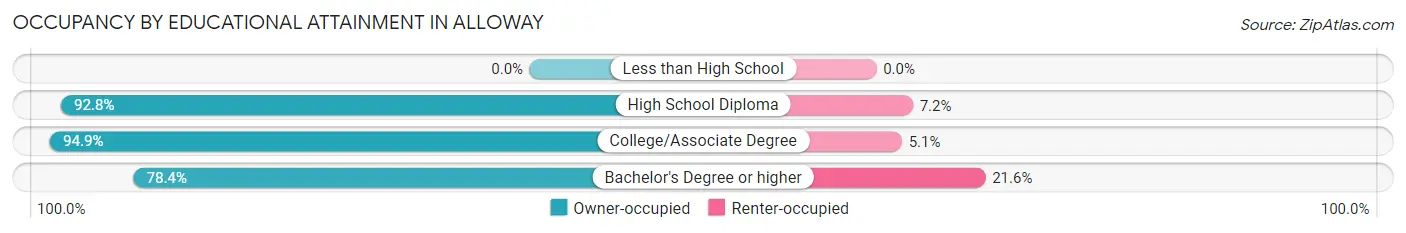
Occupancy by Educational Attainment in Alloway
| Household Size | Owner-occupied | Renter-occupied |
| Less than High School | 0 (0.0%) | 0 (0.0%) |
| High School Diploma | 141 (92.8%) | 11 (7.2%) |
| College/Associate Degree | 206 (94.9%) | 11 (5.1%) |
| Bachelor's Degree or higher | 116 (78.4%) | 32 (21.6%) |
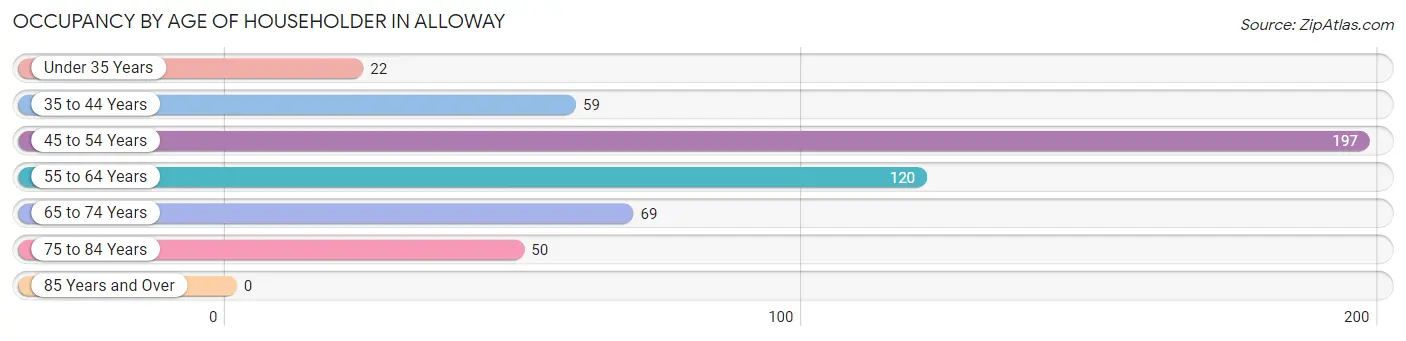
Occupancy by Age of Householder in Alloway
| Age Bracket | # Households | % Households |
| Under 35 Years | 22 | 4.3% |
| 35 to 44 Years | 59 | 11.4% |
| 45 to 54 Years | 197 | 38.1% |
| 55 to 64 Years | 120 | 23.2% |
| 65 to 74 Years | 69 | 13.4% |
| 75 to 84 Years | 50 | 9.7% |
| 85 Years and Over | 0 | 0.0% |
| Total | 517 | 100.0% |
Housing Finances in Alloway
Median Income by Occupancy in Alloway
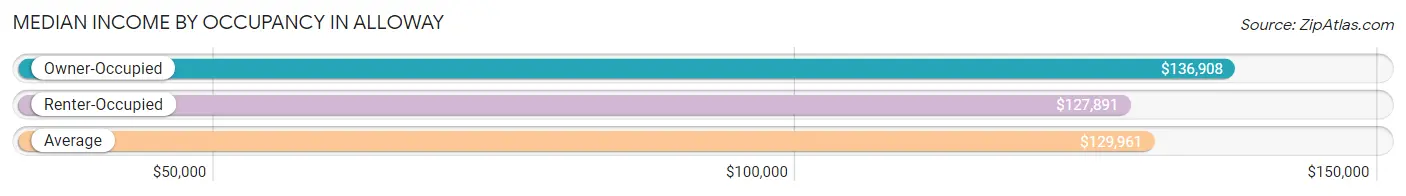
| Occupancy Type | # Households | Median Income |
| Owner-Occupied | 463 (89.6%) | $136,908 |
| Renter-Occupied | 54 (10.4%) | $127,891 |
| Average | 517 (100.0%) | $129,961 |
Occupancy by Householder Income Bracket in Alloway
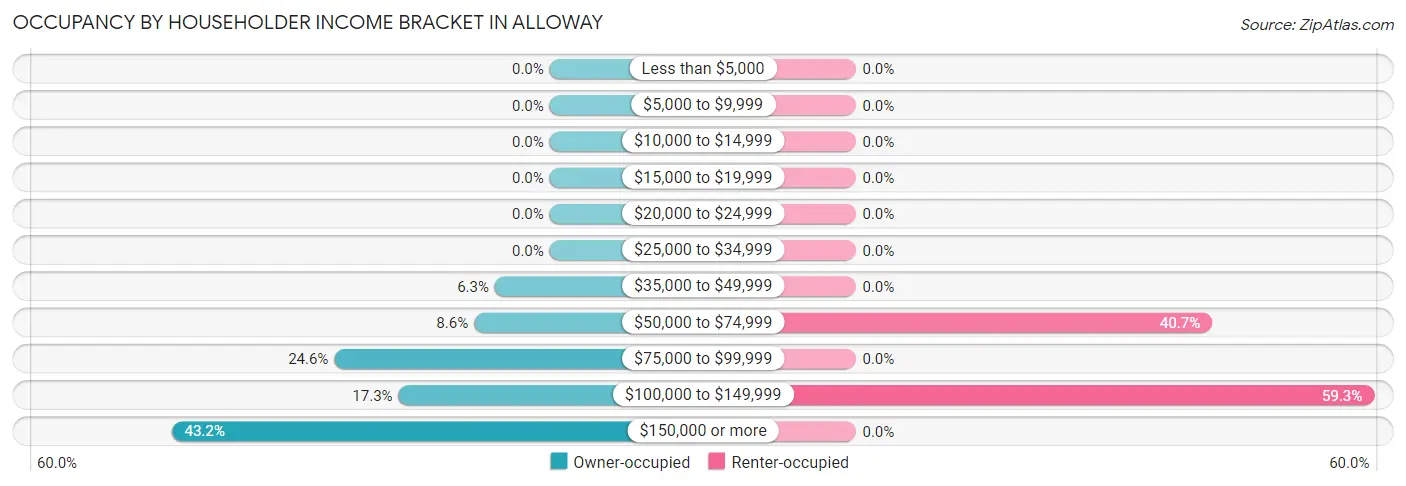
| Income Bracket | Owner-occupied | Renter-occupied |
| Less than $5,000 | 0 (0.0%) | 0 (0.0%) |
| $5,000 to $9,999 | 0 (0.0%) | 0 (0.0%) |
| $10,000 to $14,999 | 0 (0.0%) | 0 (0.0%) |
| $15,000 to $19,999 | 0 (0.0%) | 0 (0.0%) |
| $20,000 to $24,999 | 0 (0.0%) | 0 (0.0%) |
| $25,000 to $34,999 | 0 (0.0%) | 0 (0.0%) |
| $35,000 to $49,999 | 29 (6.3%) | 0 (0.0%) |
| $50,000 to $74,999 | 40 (8.6%) | 22 (40.7%) |
| $75,000 to $99,999 | 114 (24.6%) | 0 (0.0%) |
| $100,000 to $149,999 | 80 (17.3%) | 32 (59.3%) |
| $150,000 or more | 200 (43.2%) | 0 (0.0%) |
| Total | 463 (100.0%) | 54 (100.0%) |
Monthly Housing Cost Tiers in Alloway
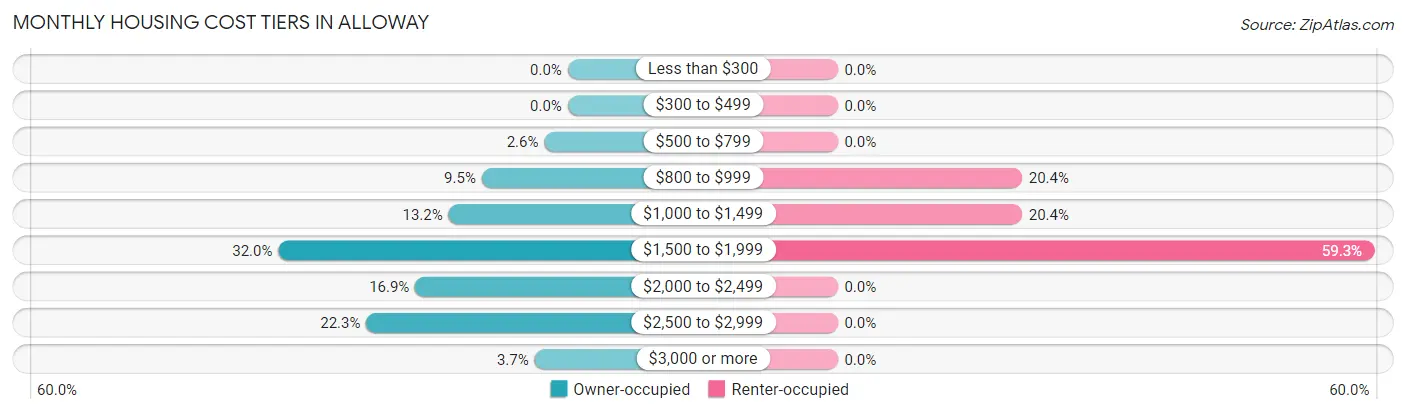
| Monthly Cost | Owner-occupied | Renter-occupied |
| Less than $300 | 0 (0.0%) | 0 (0.0%) |
| $300 to $499 | 0 (0.0%) | 0 (0.0%) |
| $500 to $799 | 12 (2.6%) | 0 (0.0%) |
| $800 to $999 | 44 (9.5%) | 11 (20.4%) |
| $1,000 to $1,499 | 61 (13.2%) | 11 (20.4%) |
| $1,500 to $1,999 | 148 (32.0%) | 32 (59.3%) |
| $2,000 to $2,499 | 78 (16.9%) | 0 (0.0%) |
| $2,500 to $2,999 | 103 (22.3%) | 0 (0.0%) |
| $3,000 or more | 17 (3.7%) | 0 (0.0%) |
| Total | 463 (100.0%) | 54 (100.0%) |
Physical Housing Characteristics in Alloway
Housing Structures in Alloway
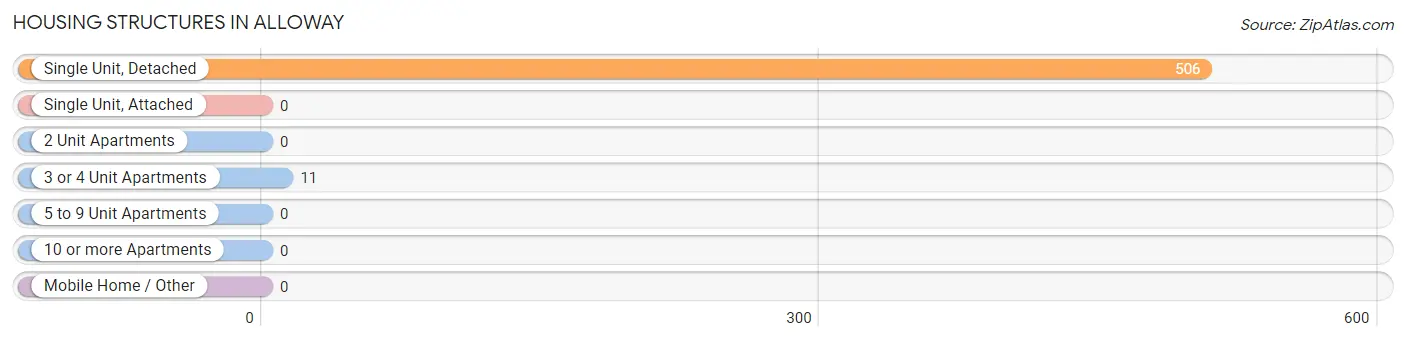
| Structure Type | # Housing Units | % Housing Units |
| Single Unit, Detached | 506 | 97.9% |
| Single Unit, Attached | 0 | 0.0% |
| 2 Unit Apartments | 0 | 0.0% |
| 3 or 4 Unit Apartments | 11 | 2.1% |
| 5 to 9 Unit Apartments | 0 | 0.0% |
| 10 or more Apartments | 0 | 0.0% |
| Mobile Home / Other | 0 | 0.0% |
| Total | 517 | 100.0% |
Housing Structures by Occupancy in Alloway
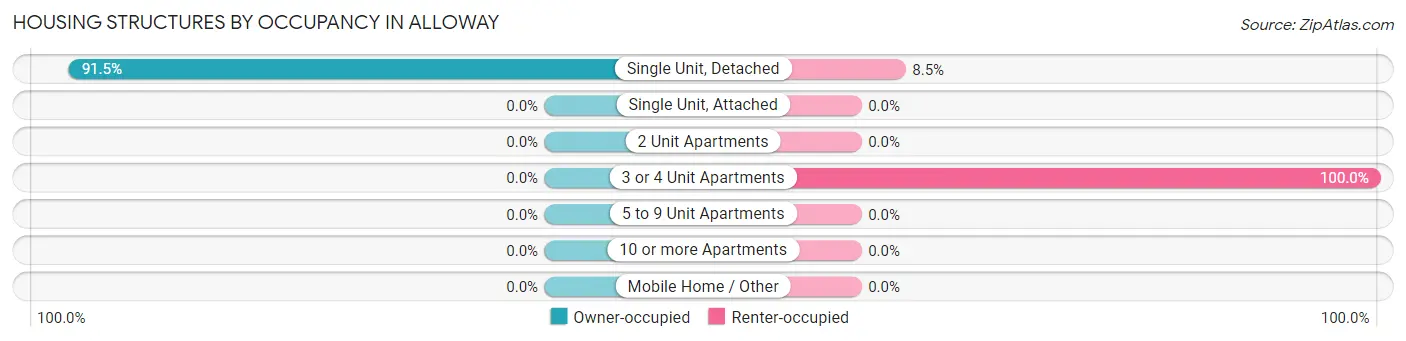
| Structure Type | Owner-occupied | Renter-occupied |
| Single Unit, Detached | 463 (91.5%) | 43 (8.5%) |
| Single Unit, Attached | 0 (0.0%) | 0 (0.0%) |
| 2 Unit Apartments | 0 (0.0%) | 0 (0.0%) |
| 3 or 4 Unit Apartments | 0 (0.0%) | 11 (100.0%) |
| 5 to 9 Unit Apartments | 0 (0.0%) | 0 (0.0%) |
| 10 or more Apartments | 0 (0.0%) | 0 (0.0%) |
| Mobile Home / Other | 0 (0.0%) | 0 (0.0%) |
| Total | 463 (89.6%) | 54 (10.4%) |
Housing Structures by Number of Rooms in Alloway
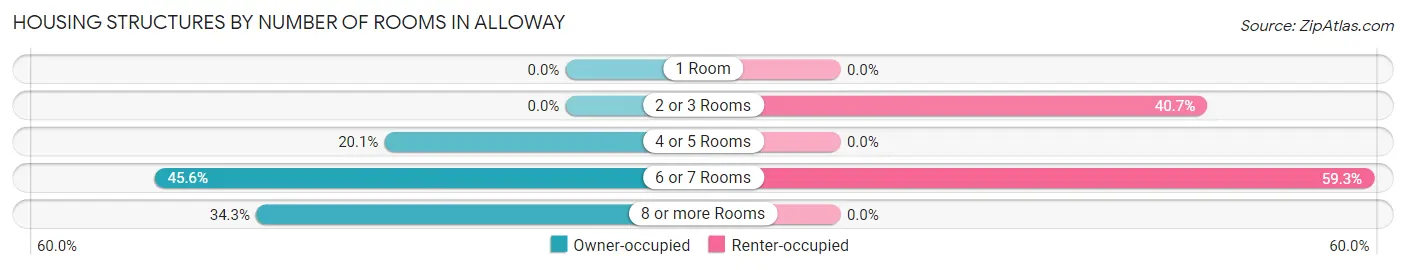
| Number of Rooms | Owner-occupied | Renter-occupied |
| 1 Room | 0 (0.0%) | 0 (0.0%) |
| 2 or 3 Rooms | 0 (0.0%) | 22 (40.7%) |
| 4 or 5 Rooms | 93 (20.1%) | 0 (0.0%) |
| 6 or 7 Rooms | 211 (45.6%) | 32 (59.3%) |
| 8 or more Rooms | 159 (34.3%) | 0 (0.0%) |
| Total | 463 (100.0%) | 54 (100.0%) |
Housing Structure by Heating Type in Alloway
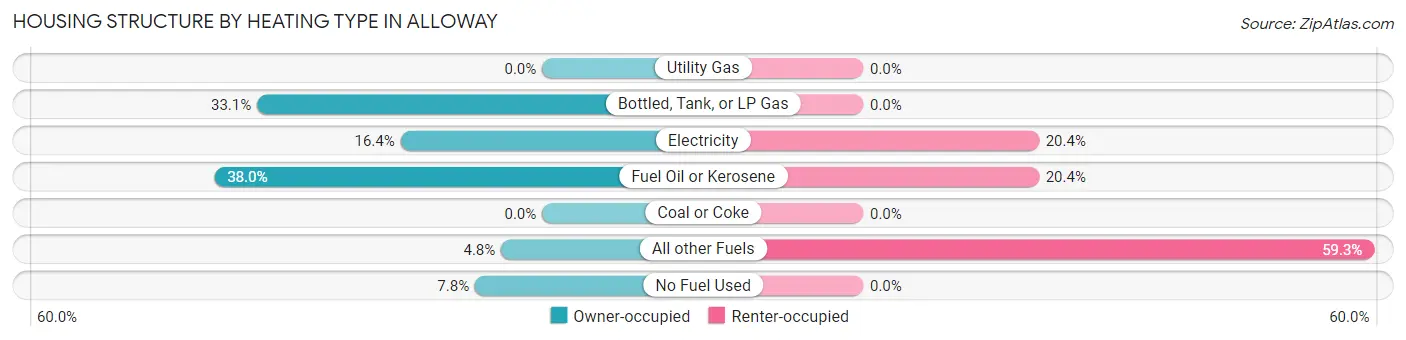
| Heating Type | Owner-occupied | Renter-occupied |
| Utility Gas | 0 (0.0%) | 0 (0.0%) |
| Bottled, Tank, or LP Gas | 153 (33.1%) | 0 (0.0%) |
| Electricity | 76 (16.4%) | 11 (20.4%) |
| Fuel Oil or Kerosene | 176 (38.0%) | 11 (20.4%) |
| Coal or Coke | 0 (0.0%) | 0 (0.0%) |
| All other Fuels | 22 (4.8%) | 32 (59.3%) |
| No Fuel Used | 36 (7.8%) | 0 (0.0%) |
| Total | 463 (100.0%) | 54 (100.0%) |
Household Vehicle Usage in Alloway
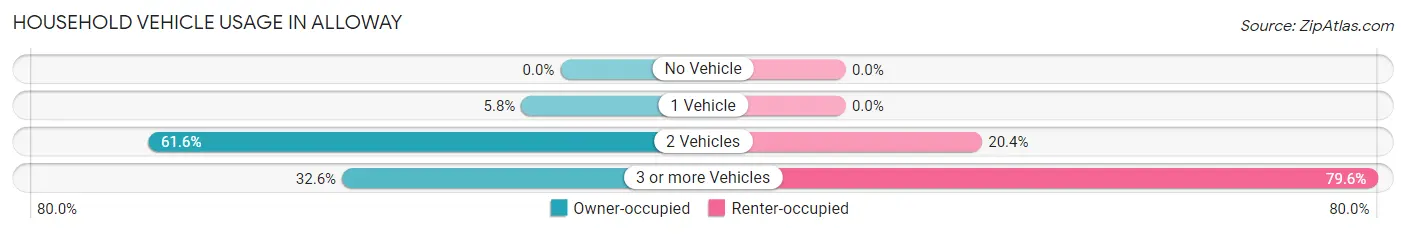
| Vehicles per Household | Owner-occupied | Renter-occupied |
| No Vehicle | 0 (0.0%) | 0 (0.0%) |
| 1 Vehicle | 27 (5.8%) | 0 (0.0%) |
| 2 Vehicles | 285 (61.6%) | 11 (20.4%) |
| 3 or more Vehicles | 151 (32.6%) | 43 (79.6%) |
| Total | 463 (100.0%) | 54 (100.0%) |
Real Estate & Mortgages in Alloway
Real Estate and Mortgage Overview in Alloway
| Characteristic | Without Mortgage | With Mortgage |
| Housing Units | 135 | 328 |
| Median Property Value | $271,300 | $315,900 |
| Median Household Income | $92,054 | $180 |
| Monthly Housing Costs | $1,082 | $17 |
| Real Estate Taxes | $6,891 | $0 |
Property Value by Mortgage Status in Alloway
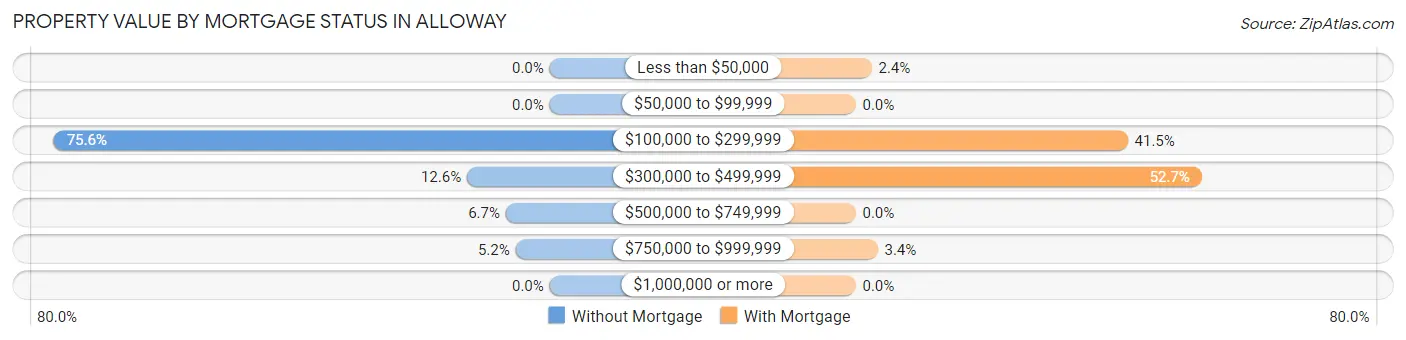
| Property Value | Without Mortgage | With Mortgage |
| Less than $50,000 | 0 (0.0%) | 8 (2.4%) |
| $50,000 to $99,999 | 0 (0.0%) | 0 (0.0%) |
| $100,000 to $299,999 | 102 (75.6%) | 136 (41.5%) |
| $300,000 to $499,999 | 17 (12.6%) | 173 (52.7%) |
| $500,000 to $749,999 | 9 (6.7%) | 0 (0.0%) |
| $750,000 to $999,999 | 7 (5.2%) | 11 (3.4%) |
| $1,000,000 or more | 0 (0.0%) | 0 (0.0%) |
| Total | 135 (100.0%) | 328 (100.0%) |
Household Income by Mortgage Status in Alloway
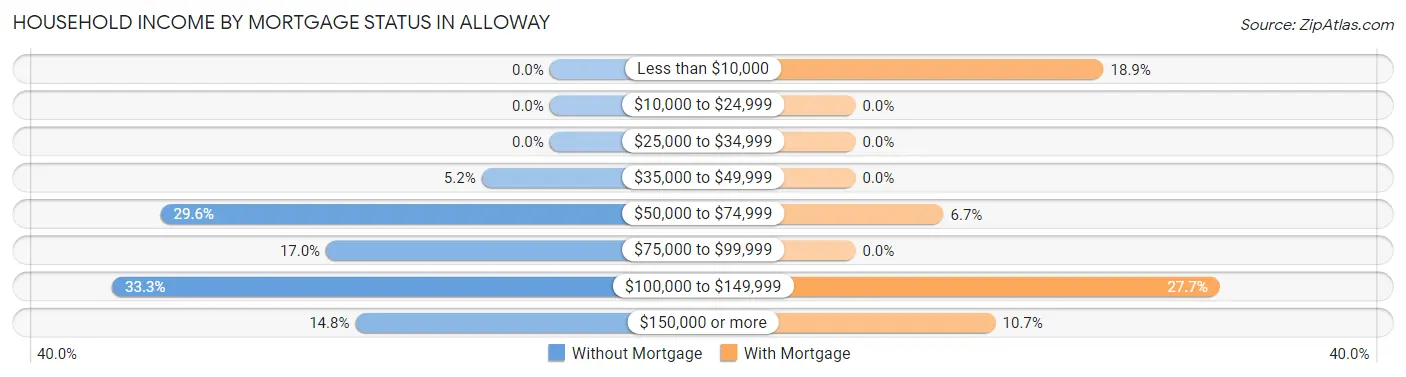
| Household Income | Without Mortgage | With Mortgage |
| Less than $10,000 | 0 (0.0%) | 62 (18.9%) |
| $10,000 to $24,999 | 0 (0.0%) | 0 (0.0%) |
| $25,000 to $34,999 | 0 (0.0%) | 0 (0.0%) |
| $35,000 to $49,999 | 7 (5.2%) | 0 (0.0%) |
| $50,000 to $74,999 | 40 (29.6%) | 22 (6.7%) |
| $75,000 to $99,999 | 23 (17.0%) | 0 (0.0%) |
| $100,000 to $149,999 | 45 (33.3%) | 91 (27.7%) |
| $150,000 or more | 20 (14.8%) | 35 (10.7%) |
| Total | 135 (100.0%) | 328 (100.0%) |
Property Value to Household Income Ratio in Alloway
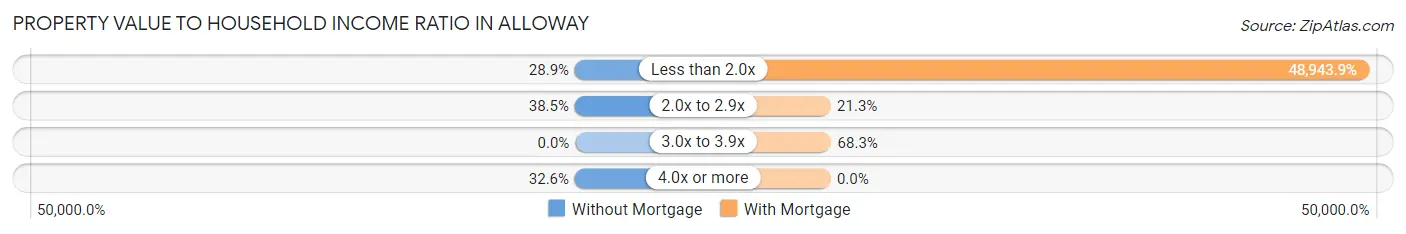
| Value-to-Income Ratio | Without Mortgage | With Mortgage |
| Less than 2.0x | 39 (28.9%) | 160,536 (48,943.9%) |
| 2.0x to 2.9x | 52 (38.5%) | 70 (21.3%) |
| 3.0x to 3.9x | 0 (0.0%) | 224 (68.3%) |
| 4.0x or more | 44 (32.6%) | 0 (0.0%) |
| Total | 135 (100.0%) | 328 (100.0%) |
Real Estate Taxes by Mortgage Status in Alloway
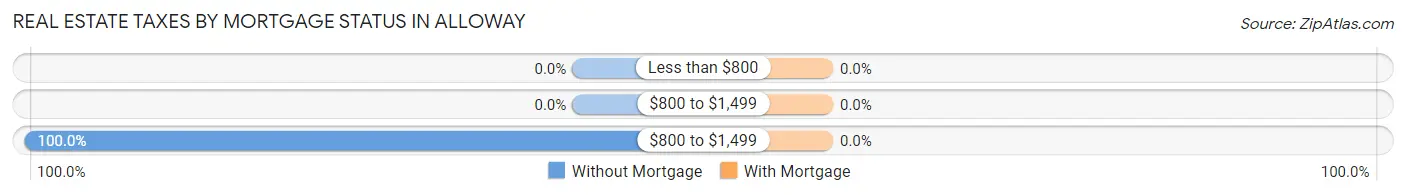
| Property Taxes | Without Mortgage | With Mortgage |
| Less than $800 | 0 (0.0%) | 0 (0.0%) |
| $800 to $1,499 | 0 (0.0%) | 0 (0.0%) |
| $800 to $1,499 | 135 (100.0%) | 0 (0.0%) |
| Total | 135 (100.0%) | 328 (100.0%) |
Health & Disability in Alloway
Health Insurance Coverage by Age in Alloway
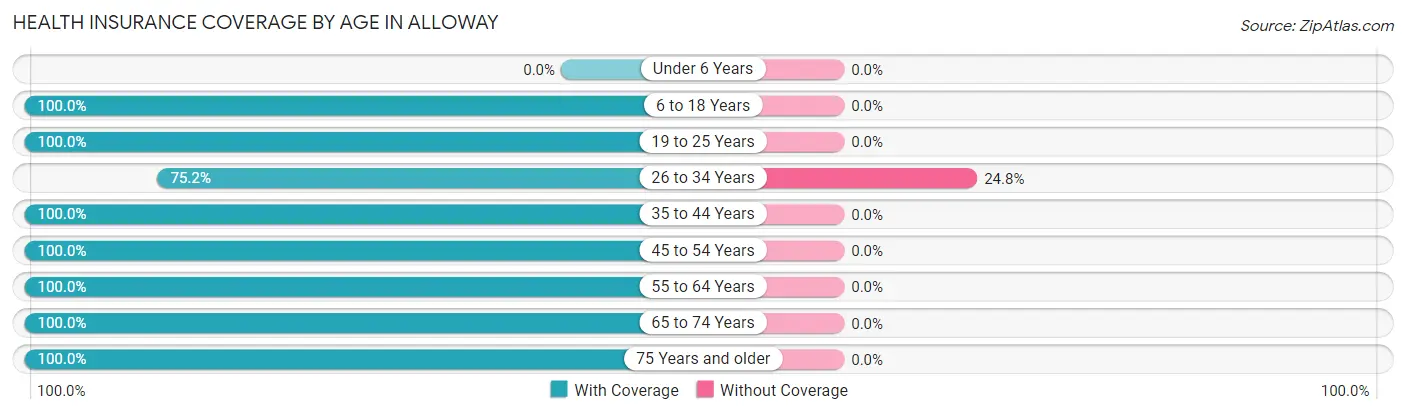
| Age Bracket | With Coverage | Without Coverage |
| Under 6 Years | 0 (0.0%) | 0 (0.0%) |
| 6 to 18 Years | 240 (100.0%) | 0 (0.0%) |
| 19 to 25 Years | 115 (100.0%) | 0 (0.0%) |
| 26 to 34 Years | 91 (75.2%) | 30 (24.8%) |
| 35 to 44 Years | 78 (100.0%) | 0 (0.0%) |
| 45 to 54 Years | 313 (100.0%) | 0 (0.0%) |
| 55 to 64 Years | 261 (100.0%) | 0 (0.0%) |
| 65 to 74 Years | 179 (100.0%) | 0 (0.0%) |
| 75 Years and older | 101 (100.0%) | 0 (0.0%) |
| Total | 1,378 (97.9%) | 30 (2.1%) |
Health Insurance Coverage by Citizenship Status in Alloway
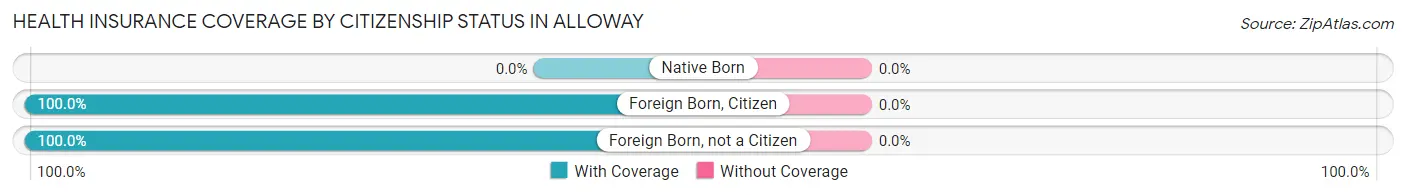
| Citizenship Status | With Coverage | Without Coverage |
| Native Born | 0 (0.0%) | 0 (0.0%) |
| Foreign Born, Citizen | 240 (100.0%) | 0 (0.0%) |
| Foreign Born, not a Citizen | 115 (100.0%) | 0 (0.0%) |
Health Insurance Coverage by Household Income in Alloway
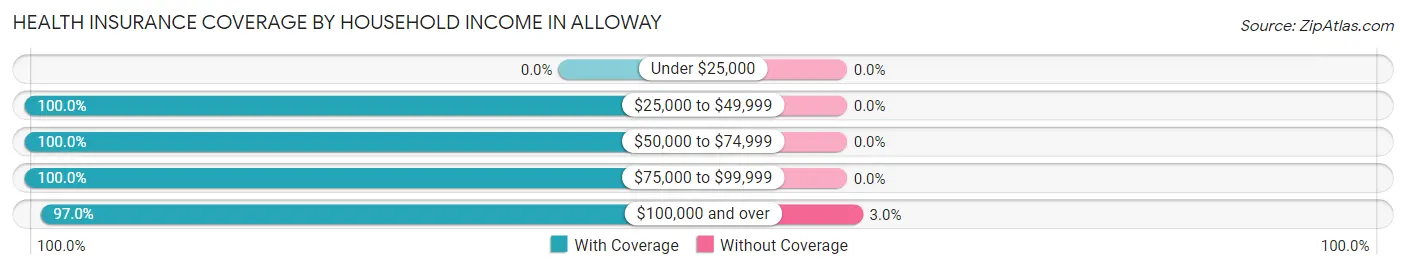
| Household Income | With Coverage | Without Coverage |
| Under $25,000 | 0 (0.0%) | 0 (0.0%) |
| $25,000 to $49,999 | 50 (100.0%) | 0 (0.0%) |
| $50,000 to $74,999 | 116 (100.0%) | 0 (0.0%) |
| $75,000 to $99,999 | 209 (100.0%) | 0 (0.0%) |
| $100,000 and over | 981 (97.0%) | 30 (3.0%) |
Public vs Private Health Insurance Coverage by Age in Alloway
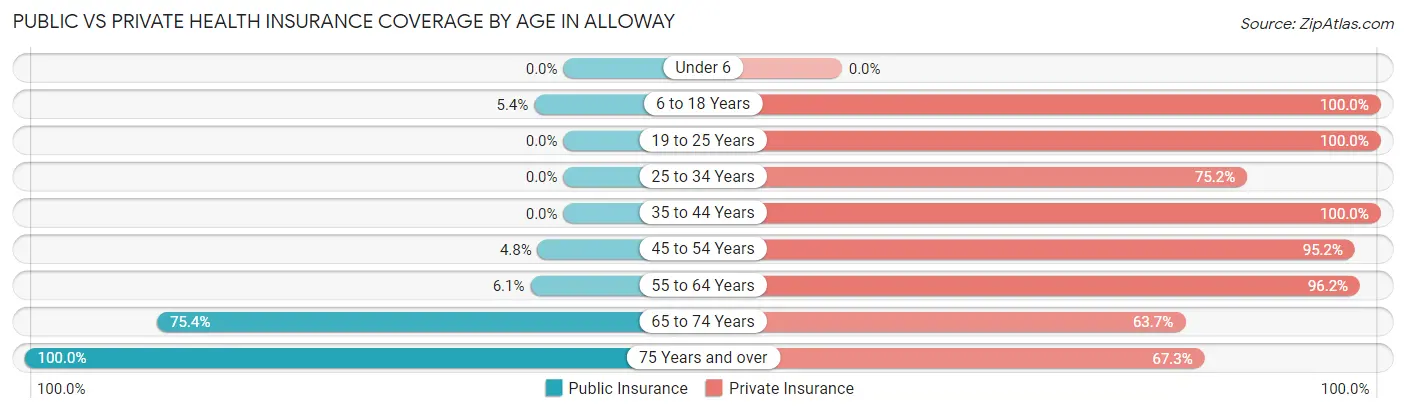
| Age Bracket | Public Insurance | Private Insurance |
| Under 6 | 0 (0.0%) | 0 (0.0%) |
| 6 to 18 Years | 13 (5.4%) | 240 (100.0%) |
| 19 to 25 Years | 0 (0.0%) | 115 (100.0%) |
| 25 to 34 Years | 0 (0.0%) | 91 (75.2%) |
| 35 to 44 Years | 0 (0.0%) | 78 (100.0%) |
| 45 to 54 Years | 15 (4.8%) | 298 (95.2%) |
| 55 to 64 Years | 16 (6.1%) | 251 (96.2%) |
| 65 to 74 Years | 135 (75.4%) | 114 (63.7%) |
| 75 Years and over | 101 (100.0%) | 68 (67.3%) |
| Total | 280 (19.9%) | 1,255 (89.1%) |
Disability Status by Sex by Age in Alloway
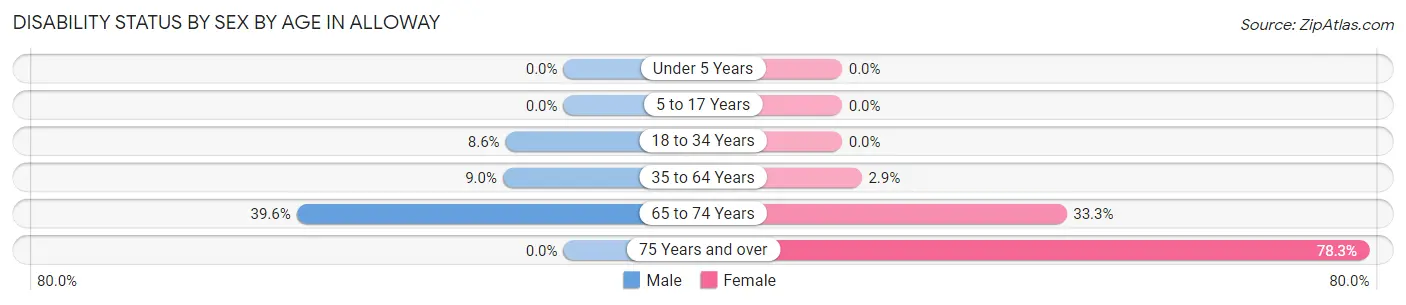
| Age Bracket | Male | Female |
| Under 5 Years | 0 (0.0%) | 0 (0.0%) |
| 5 to 17 Years | 0 (0.0%) | 0 (0.0%) |
| 18 to 34 Years | 8 (8.6%) | 0 (0.0%) |
| 35 to 64 Years | 34 (9.0%) | 8 (2.9%) |
| 65 to 74 Years | 21 (39.6%) | 42 (33.3%) |
| 75 Years and over | 0 (0.0%) | 36 (78.3%) |
Disability Class by Sex by Age in Alloway
Disability Class: Hearing Difficulty
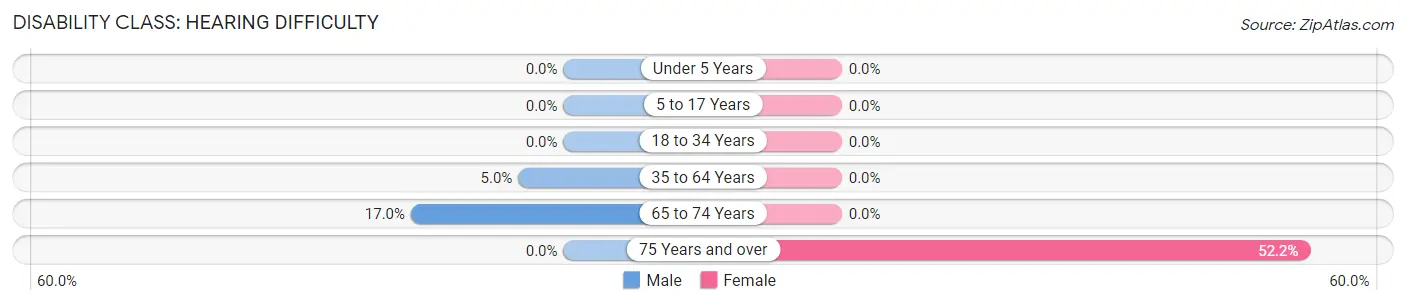
| Age Bracket | Male | Female |
| Under 5 Years | 0 (0.0%) | 0 (0.0%) |
| 5 to 17 Years | 0 (0.0%) | 0 (0.0%) |
| 18 to 34 Years | 0 (0.0%) | 0 (0.0%) |
| 35 to 64 Years | 19 (5.0%) | 0 (0.0%) |
| 65 to 74 Years | 9 (17.0%) | 0 (0.0%) |
| 75 Years and over | 0 (0.0%) | 24 (52.2%) |
Disability Class: Vision Difficulty
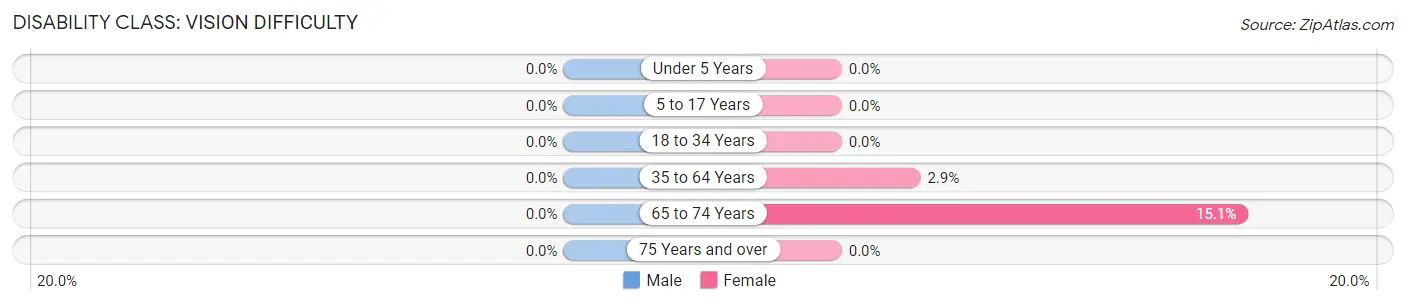
| Age Bracket | Male | Female |
| Under 5 Years | 0 (0.0%) | 0 (0.0%) |
| 5 to 17 Years | 0 (0.0%) | 0 (0.0%) |
| 18 to 34 Years | 0 (0.0%) | 0 (0.0%) |
| 35 to 64 Years | 0 (0.0%) | 8 (2.9%) |
| 65 to 74 Years | 0 (0.0%) | 19 (15.1%) |
| 75 Years and over | 0 (0.0%) | 0 (0.0%) |
Disability Class: Cognitive Difficulty
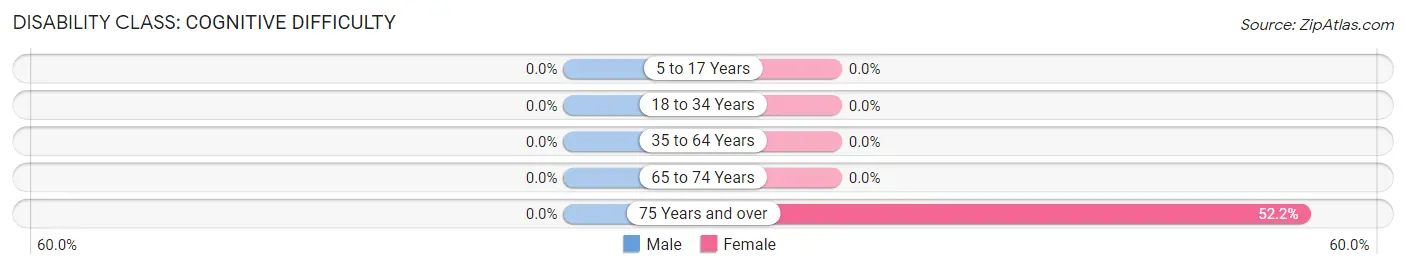
| Age Bracket | Male | Female |
| 5 to 17 Years | 0 (0.0%) | 0 (0.0%) |
| 18 to 34 Years | 0 (0.0%) | 0 (0.0%) |
| 35 to 64 Years | 0 (0.0%) | 0 (0.0%) |
| 65 to 74 Years | 0 (0.0%) | 0 (0.0%) |
| 75 Years and over | 0 (0.0%) | 24 (52.2%) |
Disability Class: Ambulatory Difficulty
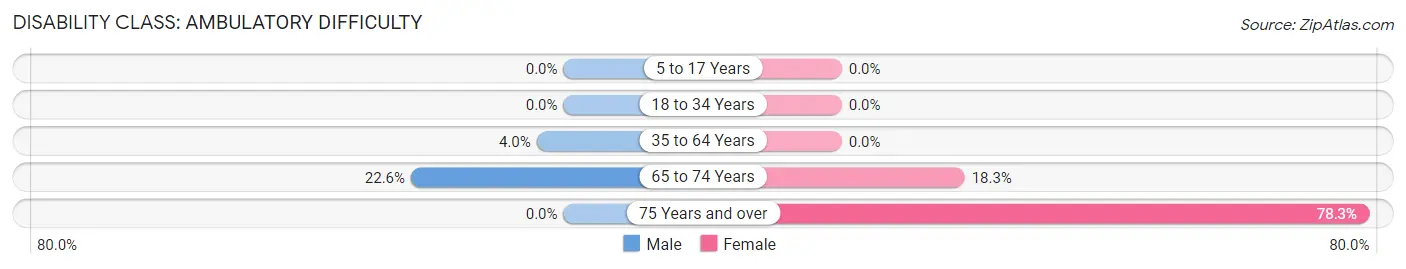
| Age Bracket | Male | Female |
| 5 to 17 Years | 0 (0.0%) | 0 (0.0%) |
| 18 to 34 Years | 0 (0.0%) | 0 (0.0%) |
| 35 to 64 Years | 15 (4.0%) | 0 (0.0%) |
| 65 to 74 Years | 12 (22.6%) | 23 (18.2%) |
| 75 Years and over | 0 (0.0%) | 36 (78.3%) |
Disability Class: Self-Care Difficulty
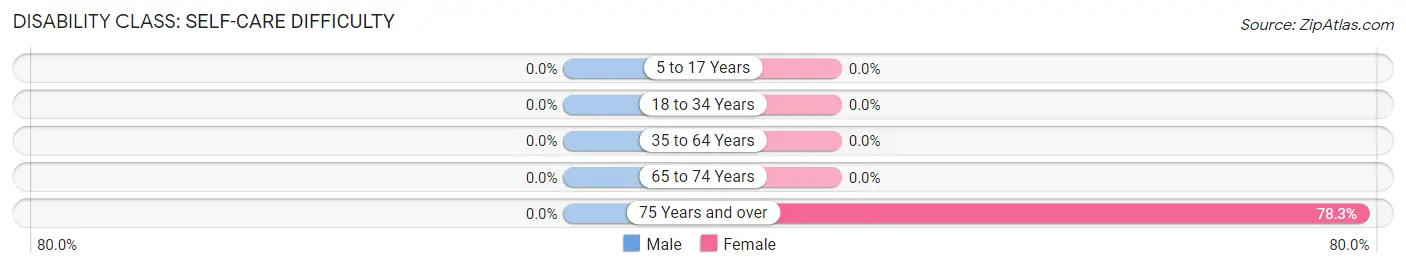
| Age Bracket | Male | Female |
| 5 to 17 Years | 0 (0.0%) | 0 (0.0%) |
| 18 to 34 Years | 0 (0.0%) | 0 (0.0%) |
| 35 to 64 Years | 0 (0.0%) | 0 (0.0%) |
| 65 to 74 Years | 0 (0.0%) | 0 (0.0%) |
| 75 Years and over | 0 (0.0%) | 36 (78.3%) |
Technology Access in Alloway
Computing Device Access in Alloway
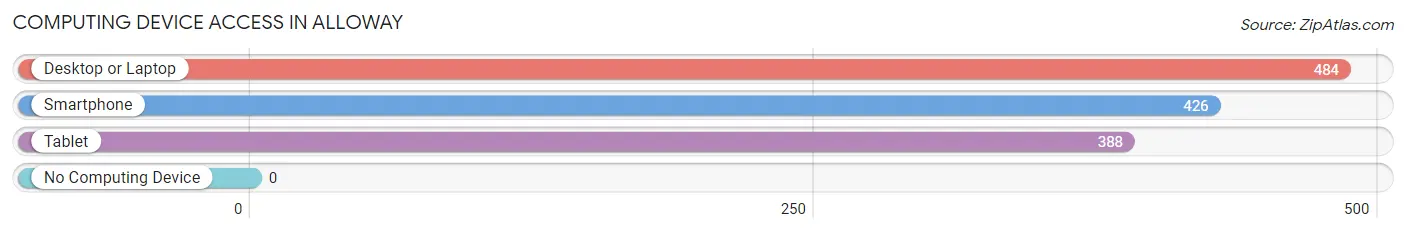
| Device Type | # Households | % Households |
| Desktop or Laptop | 484 | 93.6% |
| Smartphone | 426 | 82.4% |
| Tablet | 388 | 75.0% |
| No Computing Device | 0 | 0.0% |
| Total | 517 | 100.0% |
Internet Access in Alloway
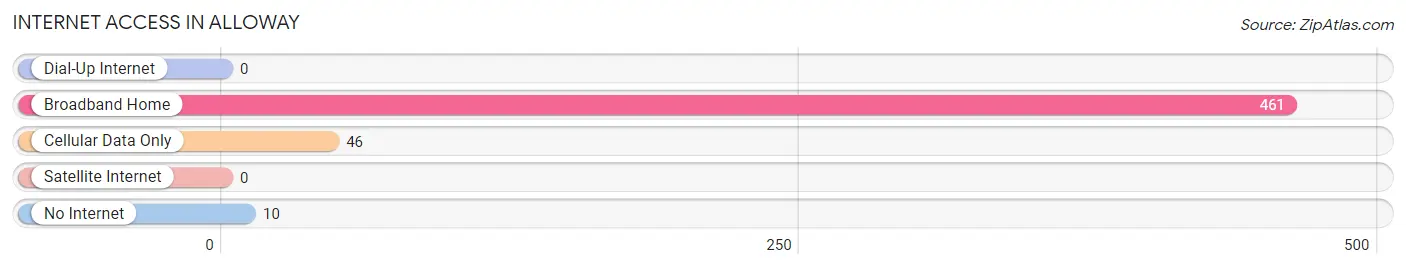
| Internet Type | # Households | % Households |
| Dial-Up Internet | 0 | 0.0% |
| Broadband Home | 461 | 89.2% |
| Cellular Data Only | 46 | 8.9% |
| Satellite Internet | 0 | 0.0% |
| No Internet | 10 | 1.9% |
| Total | 517 | 100.0% |
Alloway Summary
Alloway Township is a small rural community located in Salem County, New Jersey. It is situated in the southwestern corner of the state, just north of the Delaware River. The township is bordered by Upper Pittsgrove Township to the north, Elsinboro Township to the east, Mannington Township to the south, and Pennsville Township to the west. Alloway Township was incorporated in 1798 and is home to a population of approximately 2,500 people.
Geography
Alloway Township is located in the southwestern corner of Salem County, New Jersey. It is situated between the Delaware River to the south and Upper Pittsgrove Township to the north. The township is bordered by Elsinboro Township to the east, Mannington Township to the south, and Pennsville Township to the west. The township covers an area of approximately 11.5 square miles and is home to a population of approximately 2,500 people.
The township is primarily rural in nature, with a few small residential areas scattered throughout. The majority of the land is used for agricultural purposes, with corn, soybeans, and hay being the primary crops. The township is also home to several small lakes, including Alloway Lake, which is a popular spot for fishing and boating.
History
Alloway Township was originally part of the Salem County Township of Upper Pittsgrove. It was incorporated as its own township in 1798. The township was named after the Alloway family, who were among the first settlers in the area.
The township was primarily agricultural in nature, with corn, soybeans, and hay being the primary crops. The township also had several small industries, including a sawmill, a gristmill, and a brickyard.
In the late 19th century, the township began to experience a population boom, as many people moved to the area from Philadelphia and other parts of New Jersey. This population growth continued into the 20th century, and by the 1950s, the township had reached its peak population of over 3,000 people.
Economy
Alloway Township is primarily a rural community, with a few small residential areas scattered throughout. The majority of the land is used for agricultural purposes, with corn, soybeans, and hay being the primary crops. The township is also home to several small businesses, including a few restaurants, a gas station, and a few convenience stores.
The township is also home to several small industries, including a sawmill, a gristmill, and a brickyard. These industries provide employment for many of the township’s residents.
Demographics
As of the 2010 census, Alloway Township had a population of 2,521 people. The racial makeup of the township was 94.3% White, 2.7% African American, 0.3% Native American, 0.7% Asian, 0.1% Pacific Islander, and 1.9% from other races. Hispanic or Latino of any race were 3.2% of the population.
The median household income in Alloway Township was $63,958, and the median family income was $76,250. The per capita income for the township was $27,945. About 6.3% of families and 8.2% of the population were below the poverty line, including 10.2% of those under age 18 and 6.2% of those age 65 or over.
Conclusion
Alloway Township is a small rural community located in Salem County, New Jersey. It is situated in the southwestern corner of the state, just north of the Delaware River. The township was incorporated in 1798 and is home to a population of approximately 2,500 people. The township is primarily rural in nature, with a few small residential areas scattered throughout. The majority of the land is used for agricultural purposes, with corn, soybeans, and hay being the primary crops. The township is also home to several small businesses and industries, which provide employment for many of the township’s residents. The median household income in Alloway Township was $63,958, and the median family income was $76,250. The per capita income for the township was $27,945.
Common Questions
What is Per Capita Income in Alloway?
Per Capita income in Alloway is $56,008.
What is the Median Family Income in Alloway?
Median Family Income in Alloway is $133,750.
What is the Median Household income in Alloway?
Median Household Income in Alloway is $129,961.
What is Income or Wage Gap in Alloway?
Income or Wage Gap in Alloway is 30.7%.
Women in Alloway earn 69.3 cents for every dollar earned by a man.
What is Inequality or Gini Index in Alloway?
Inequality or Gini Index in Alloway is 0.29.
What is the Total Population of Alloway?
Total Population of Alloway is 1,428.
What is the Total Male Population of Alloway?
Total Male Population of Alloway is 653.
What is the Total Female Population of Alloway?
Total Female Population of Alloway is 775.
What is the Ratio of Males per 100 Females in Alloway?
There are 84.26 Males per 100 Females in Alloway.
What is the Ratio of Females per 100 Males in Alloway?
There are 118.68 Females per 100 Males in Alloway.
What is the Median Population Age in Alloway?
Median Population Age in Alloway is 50.9 Years.
What is the Average Family Size in Alloway
Average Family Size in Alloway is 2.7 People.
What is the Average Household Size in Alloway
Average Household Size in Alloway is 2.7 People.
How Large is the Labor Force in Alloway?
There are 807 People in the Labor Forcein in Alloway.
What is the Percentage of People in the Labor Force in Alloway?
63.4% of People are in the Labor Force in Alloway.
What is the Unemployment Rate in Alloway?
Unemployment Rate in Alloway is 8.7%.