Belvidere, NJ Map & Demographics
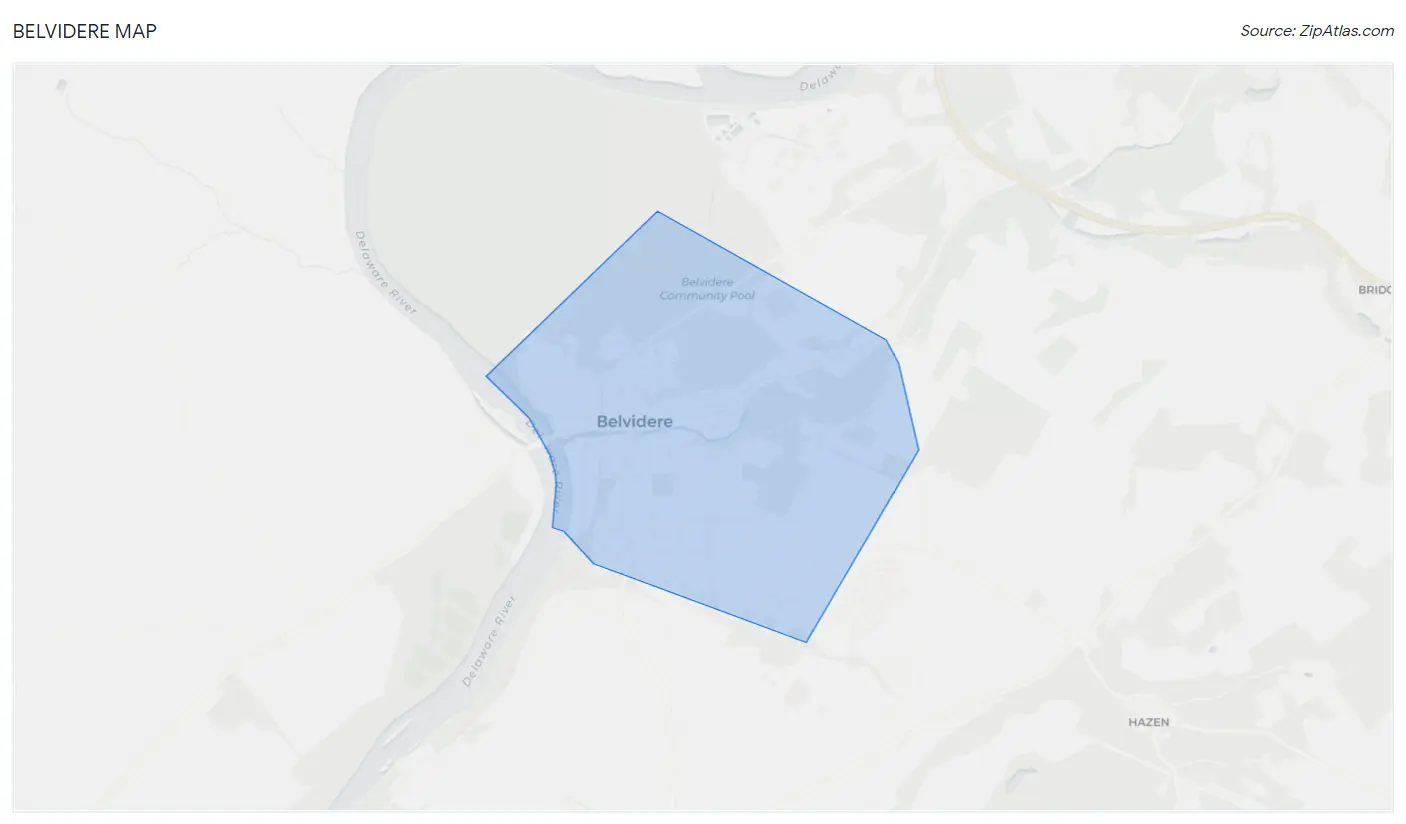
Belvidere Map
Belvidere Overview
$43,387
PER CAPITA INCOME
$100,781
AVG FAMILY INCOME
$95,861
AVG HOUSEHOLD INCOME
29.9%
WAGE / INCOME GAP [ % ]
70.1¢/ $1
WAGE / INCOME GAP [ $ ]
0.39
INEQUALITY / GINI INDEX
2,532
TOTAL POPULATION
1,385
MALE POPULATION
1,147
FEMALE POPULATION
120.75
MALES / 100 FEMALES
82.82
FEMALES / 100 MALES
48.0
MEDIAN AGE
2.7
AVG FAMILY SIZE
2.2
AVG HOUSEHOLD SIZE
1,504
LABOR FORCE [ PEOPLE ]
69.6%
PERCENT IN LABOR FORCE
8.5%
UNEMPLOYMENT RATE
Belvidere Zip Codes
Belvidere Area Codes
Income in Belvidere
Income Overview in Belvidere
Per Capita Income in Belvidere is $43,387, while median incomes of families and households are $100,781 and $95,861 respectively.
| Characteristic | Number | Measure |
| Per Capita Income | 2,532 | $43,387 |
| Median Family Income | 752 | $100,781 |
| Mean Family Income | 752 | $117,720 |
| Median Household Income | 1,144 | $95,861 |
| Mean Household Income | 1,144 | $96,957 |
| Income Deficit | 752 | $0 |
| Wage / Income Gap (%) | 2,532 | 29.95% |
| Wage / Income Gap ($) | 2,532 | 70.05¢ per $1 |
| Gini / Inequality Index | 2,532 | 0.39 |
Earnings by Sex in Belvidere
Average Earnings in Belvidere are $50,109, $58,707 for men and $41,125 for women, a difference of 29.9%.
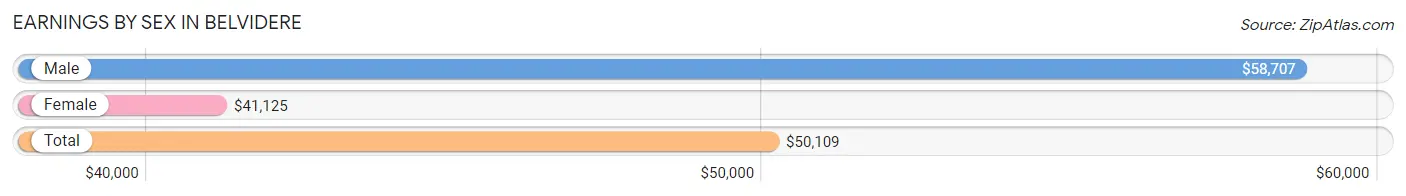
| Sex | Number | Average Earnings |
| Male | 910 (58.2%) | $58,707 |
| Female | 654 (41.8%) | $41,125 |
| Total | 1,564 (100.0%) | $50,109 |
Earnings by Sex by Income Bracket in Belvidere
The most common earnings brackets in Belvidere are $65,000 to $74,999 for men (154 | 16.9%) and $20,000 to $22,499 for women (106 | 16.2%).
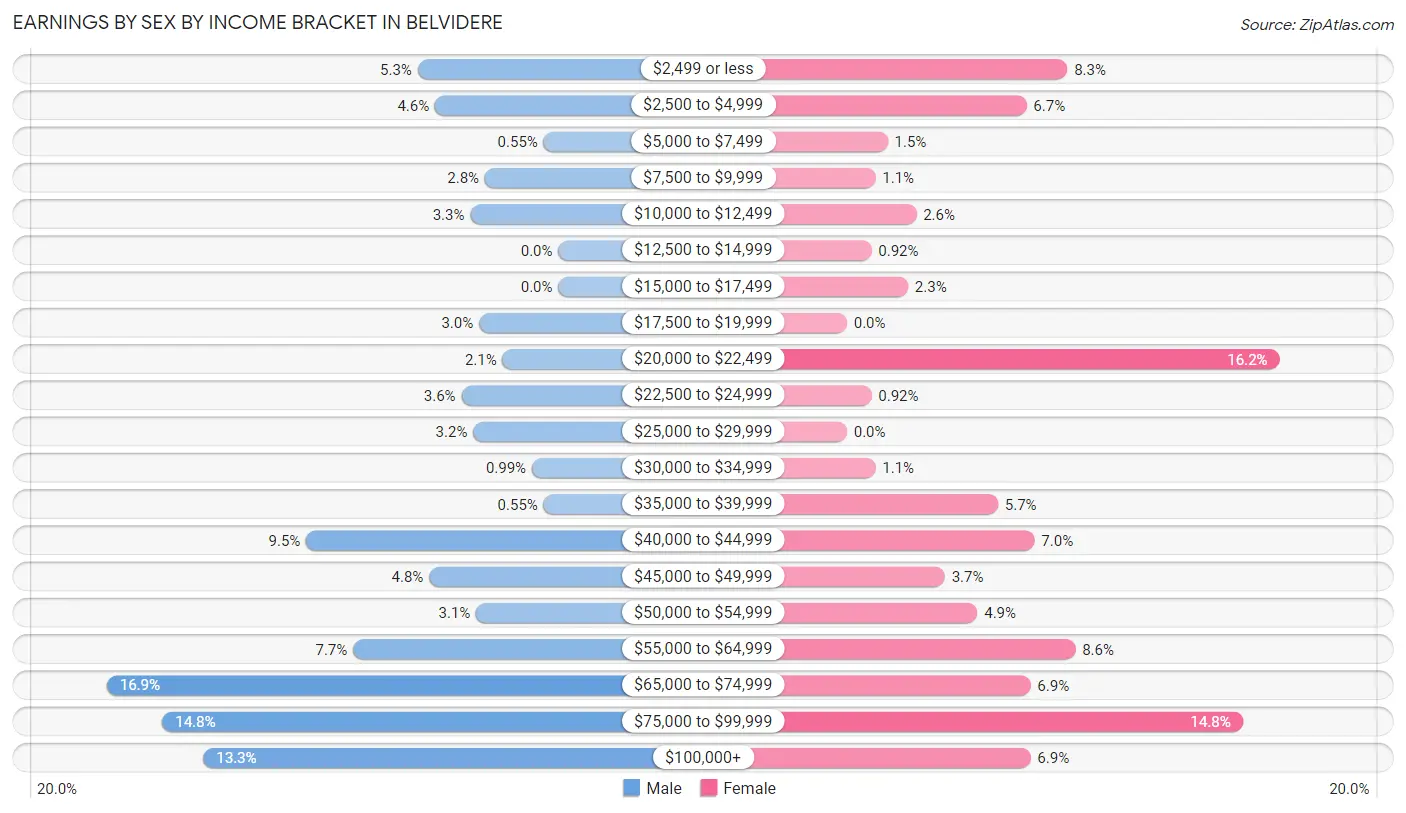
| Income | Male | Female |
| $2,499 or less | 48 (5.3%) | 54 (8.3%) |
| $2,500 to $4,999 | 42 (4.6%) | 44 (6.7%) |
| $5,000 to $7,499 | 5 (0.5%) | 10 (1.5%) |
| $7,500 to $9,999 | 25 (2.8%) | 7 (1.1%) |
| $10,000 to $12,499 | 30 (3.3%) | 17 (2.6%) |
| $12,500 to $14,999 | 0 (0.0%) | 6 (0.9%) |
| $15,000 to $17,499 | 0 (0.0%) | 15 (2.3%) |
| $17,500 to $19,999 | 27 (3.0%) | 0 (0.0%) |
| $20,000 to $22,499 | 19 (2.1%) | 106 (16.2%) |
| $22,500 to $24,999 | 33 (3.6%) | 6 (0.9%) |
| $25,000 to $29,999 | 29 (3.2%) | 0 (0.0%) |
| $30,000 to $34,999 | 9 (1.0%) | 7 (1.1%) |
| $35,000 to $39,999 | 5 (0.5%) | 37 (5.7%) |
| $40,000 to $44,999 | 86 (9.5%) | 46 (7.0%) |
| $45,000 to $49,999 | 44 (4.8%) | 24 (3.7%) |
| $50,000 to $54,999 | 28 (3.1%) | 32 (4.9%) |
| $55,000 to $64,999 | 70 (7.7%) | 56 (8.6%) |
| $65,000 to $74,999 | 154 (16.9%) | 45 (6.9%) |
| $75,000 to $99,999 | 135 (14.8%) | 97 (14.8%) |
| $100,000+ | 121 (13.3%) | 45 (6.9%) |
| Total | 910 (100.0%) | 654 (100.0%) |
Earnings by Sex by Educational Attainment in Belvidere
Average earnings in Belvidere are $70,017 for men and $42,063 for women, a difference of 39.9%. Men with an educational attainment of graduate degree enjoy the highest average annual earnings of $131,591, while those with bachelor's degree education earn the least with $47,417. Women with an educational attainment of graduate degree earn the most with the average annual earnings of $74,120, while those with less than high school education have the smallest earnings of $2,499.
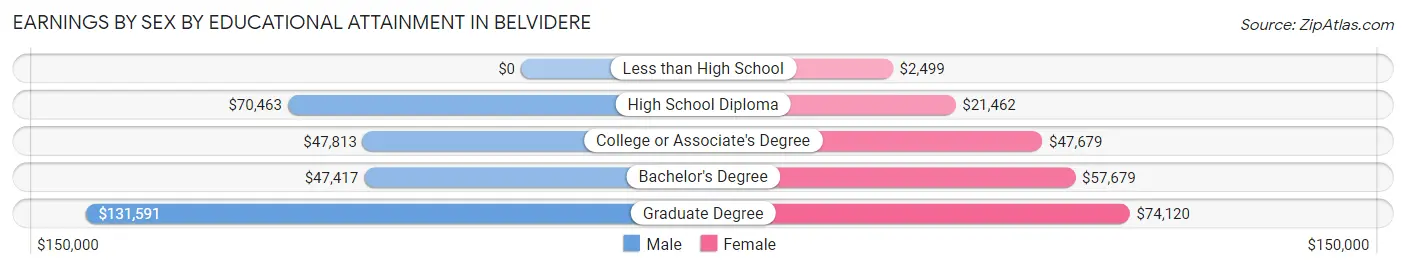
| Educational Attainment | Male Income | Female Income |
| Less than High School | - | - |
| High School Diploma | $70,463 | $21,462 |
| College or Associate's Degree | $47,813 | $47,679 |
| Bachelor's Degree | $47,417 | $57,679 |
| Graduate Degree | $131,591 | $74,120 |
| Total | $70,017 | $42,063 |
Family Income in Belvidere
Family Income Brackets in Belvidere
According to the Belvidere family income data, there are 210 families falling into the $100,000 to $149,999 income range, which is the most common income bracket and makes up 27.9% of all families.
| Income Bracket | # Families | % Families |
| Less than $10,000 | 30 | 4.0% |
| $10,000 to $14,999 | 19 | 2.5% |
| $15,000 to $24,999 | 0 | 0.0% |
| $25,000 to $34,999 | 9 | 1.2% |
| $35,000 to $49,999 | 11 | 1.5% |
| $50,000 to $74,999 | 108 | 14.4% |
| $75,000 to $99,999 | 194 | 25.8% |
| $100,000 to $149,999 | 210 | 27.9% |
| $150,000 to $199,999 | 112 | 14.9% |
| $200,000+ | 59 | 7.8% |
Family Income by Famaliy Size in Belvidere
4-person families (90 | 12.0%) account for the highest median family income in Belvidere with $143,214 per family, while 2-person families (417 | 55.4%) have the highest median income of $48,476 per family member.
| Income Bracket | # Families | Median Income |
| 2-Person Families | 417 (55.4%) | $96,951 |
| 3-Person Families | 196 (26.1%) | $114,583 |
| 4-Person Families | 90 (12.0%) | $143,214 |
| 5-Person Families | 21 (2.8%) | $0 |
| 6-Person Families | 18 (2.4%) | $0 |
| 7+ Person Families | 10 (1.3%) | $0 |
| Total | 752 (100.0%) | $100,781 |
Family Income by Number of Earners in Belvidere
The median family income in Belvidere is $100,781, with families comprising 3+ earners (85) having the highest median family income of $179,479, while families with no earners (52) have the lowest median family income of $51,250, accounting for 11.3% and 6.9% of families, respectively.
| Number of Earners | # Families | Median Income |
| No Earners | 52 (6.9%) | $51,250 |
| 1 Earner | 138 (18.3%) | $106,429 |
| 2 Earners | 477 (63.4%) | $97,086 |
| 3+ Earners | 85 (11.3%) | $179,479 |
| Total | 752 (100.0%) | $100,781 |
Household Income in Belvidere
Household Income Brackets in Belvidere
With 265 households falling in the category, the $100,000 to $149,999 income range is the most frequent in Belvidere, accounting for 23.2% of all households. In contrast, only 38 households (3.3%) fall into the $15,000 to $24,999 income bracket, making it the least populous group.
| Income Bracket | # Households | % Households |
| Less than $10,000 | 84 | 7.3% |
| $10,000 to $14,999 | 76 | 6.6% |
| $15,000 to $24,999 | 38 | 3.3% |
| $25,000 to $34,999 | 59 | 5.2% |
| $35,000 to $49,999 | 42 | 3.7% |
| $50,000 to $74,999 | 136 | 11.9% |
| $75,000 to $99,999 | 249 | 21.8% |
| $100,000 to $149,999 | 265 | 23.2% |
| $150,000 to $199,999 | 124 | 10.8% |
| $200,000+ | 72 | 6.3% |
Household Income by Householder Age in Belvidere
The median household income in Belvidere is $95,861, with the highest median household income of $96,858 found in the 45 to 64 years age bracket for the primary householder. A total of 658 households (57.5%) fall into this category.
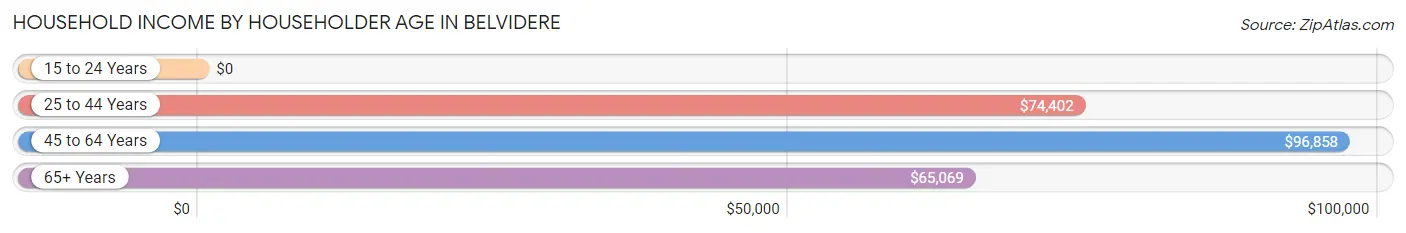
| Income Bracket | # Households | Median Income |
| 15 to 24 Years | 0 (0.0%) | $0 |
| 25 to 44 Years | 259 (22.6%) | $74,402 |
| 45 to 64 Years | 658 (57.5%) | $96,858 |
| 65+ Years | 227 (19.8%) | $65,069 |
| Total | 1,144 (100.0%) | $95,861 |
Poverty in Belvidere
Income Below Poverty by Sex and Age in Belvidere
With 7.1% poverty level for males and 16.0% for females among the residents of Belvidere, 25 to 34 year old males and 25 to 34 year old females are the most vulnerable to poverty, with 50 males (30.9%) and 44 females (27.7%) in their respective age groups living below the poverty level.
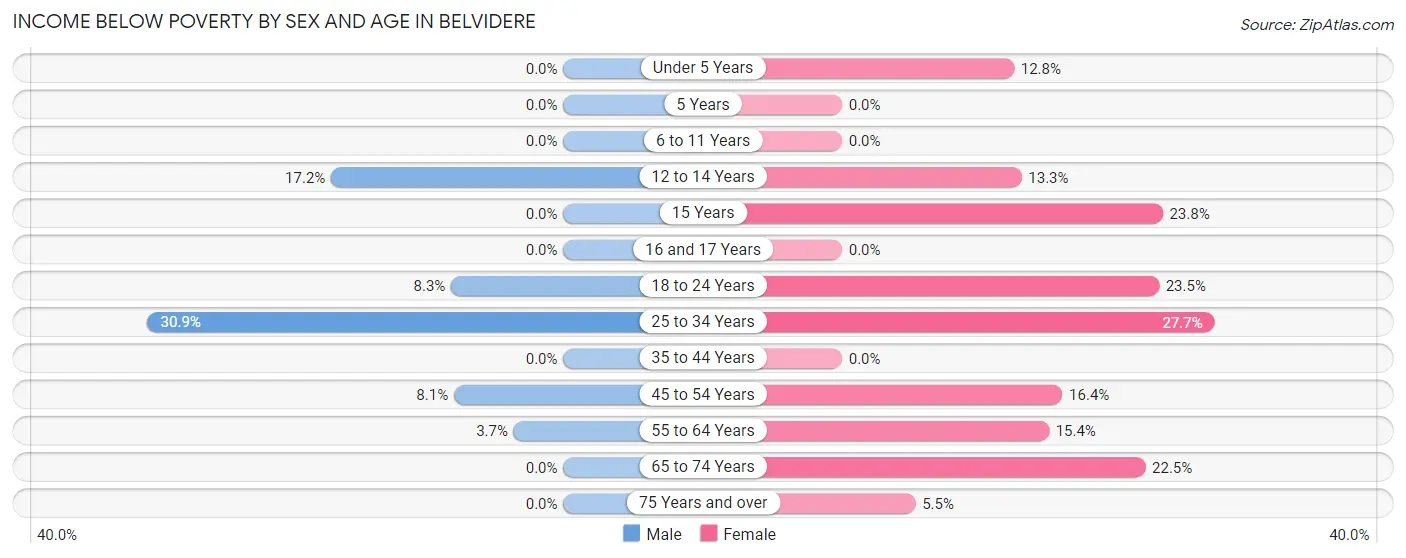
| Age Bracket | Male | Female |
| Under 5 Years | 0 (0.0%) | 6 (12.8%) |
| 5 Years | 0 (0.0%) | 0 (0.0%) |
| 6 to 11 Years | 0 (0.0%) | 0 (0.0%) |
| 12 to 14 Years | 10 (17.2%) | 4 (13.3%) |
| 15 Years | 0 (0.0%) | 5 (23.8%) |
| 16 and 17 Years | 0 (0.0%) | 0 (0.0%) |
| 18 to 24 Years | 11 (8.3%) | 8 (23.5%) |
| 25 to 34 Years | 50 (30.9%) | 44 (27.7%) |
| 35 to 44 Years | 0 (0.0%) | 0 (0.0%) |
| 45 to 54 Years | 16 (8.1%) | 35 (16.4%) |
| 55 to 64 Years | 12 (3.7%) | 53 (15.4%) |
| 65 to 74 Years | 0 (0.0%) | 25 (22.5%) |
| 75 Years and over | 0 (0.0%) | 3 (5.4%) |
| Total | 99 (7.1%) | 183 (16.0%) |
Income Above Poverty by Sex and Age in Belvidere
According to the poverty statistics in Belvidere, males aged under 5 years and females aged 6 to 11 years are the age groups that are most secure financially, with 100.0% of males and 100.0% of females in these age groups living above the poverty line.
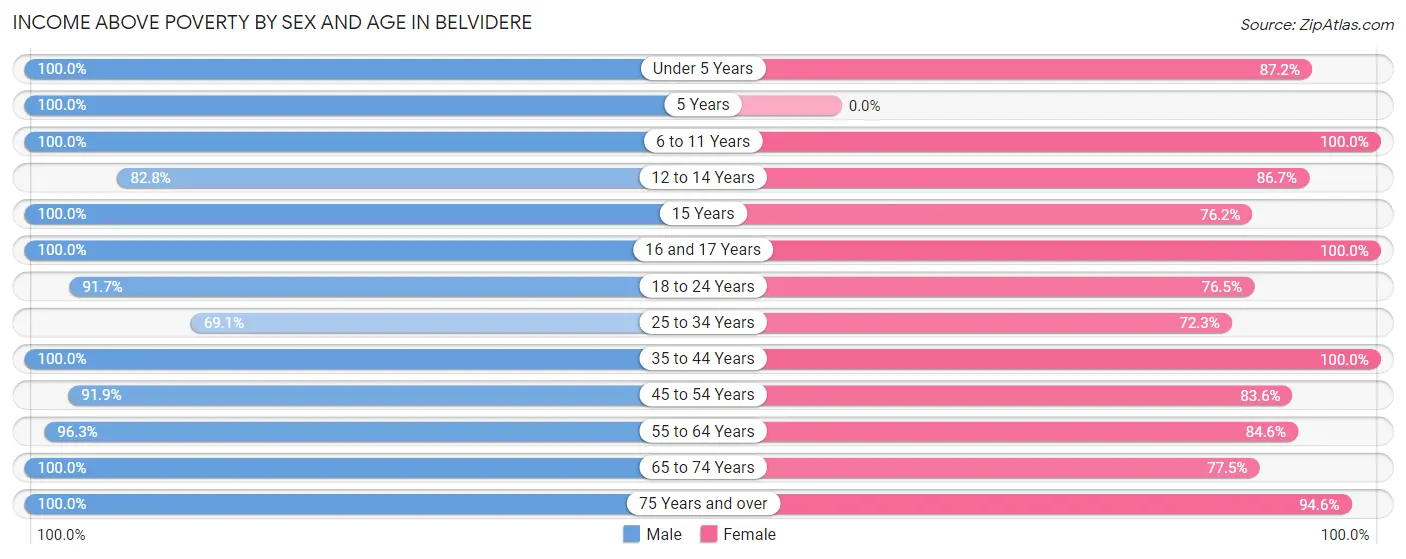
| Age Bracket | Male | Female |
| Under 5 Years | 94 (100.0%) | 41 (87.2%) |
| 5 Years | 21 (100.0%) | 0 (0.0%) |
| 6 to 11 Years | 47 (100.0%) | 24 (100.0%) |
| 12 to 14 Years | 48 (82.8%) | 26 (86.7%) |
| 15 Years | 29 (100.0%) | 16 (76.2%) |
| 16 and 17 Years | 18 (100.0%) | 18 (100.0%) |
| 18 to 24 Years | 121 (91.7%) | 26 (76.5%) |
| 25 to 34 Years | 112 (69.1%) | 115 (72.3%) |
| 35 to 44 Years | 147 (100.0%) | 89 (100.0%) |
| 45 to 54 Years | 181 (91.9%) | 179 (83.6%) |
| 55 to 64 Years | 314 (96.3%) | 292 (84.6%) |
| 65 to 74 Years | 103 (100.0%) | 86 (77.5%) |
| 75 Years and over | 51 (100.0%) | 52 (94.6%) |
| Total | 1,286 (92.8%) | 964 (84.1%) |
Income Below Poverty Among Married-Couple Families in Belvidere
The poverty statistics for married-couple families in Belvidere show that 1.0% or 6 of the total 617 families live below the poverty line. Families with no children have the highest poverty rate of 1.5%, comprising of 6 families. On the other hand, families with 1 or 2 children have the lowest poverty rate of 0.0%, which includes 0 families.
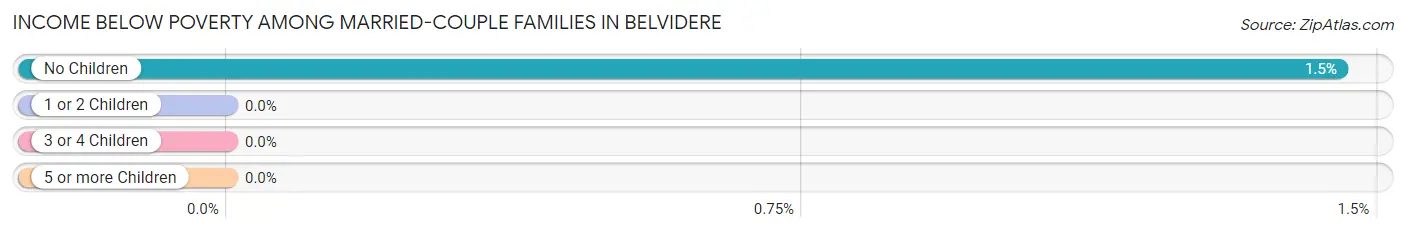
| Children | Above Poverty | Below Poverty |
| No Children | 408 (98.6%) | 6 (1.5%) |
| 1 or 2 Children | 181 (100.0%) | 0 (0.0%) |
| 3 or 4 Children | 12 (100.0%) | 0 (0.0%) |
| 5 or more Children | 10 (100.0%) | 0 (0.0%) |
| Total | 611 (99.0%) | 6 (1.0%) |
Income Below Poverty Among Single-Parent Households in Belvidere
According to the poverty data in Belvidere, 37.5% or 30 single-father households and 23.6% or 13 single-mother households are living below the poverty line. Among single-father households, those with 3 or 4 children have the highest poverty rate, with 8 households (100.0%) experiencing poverty. Likewise, among single-mother households, those with 1 or 2 children have the highest poverty rate, with 6 households (31.6%) falling below the poverty line.
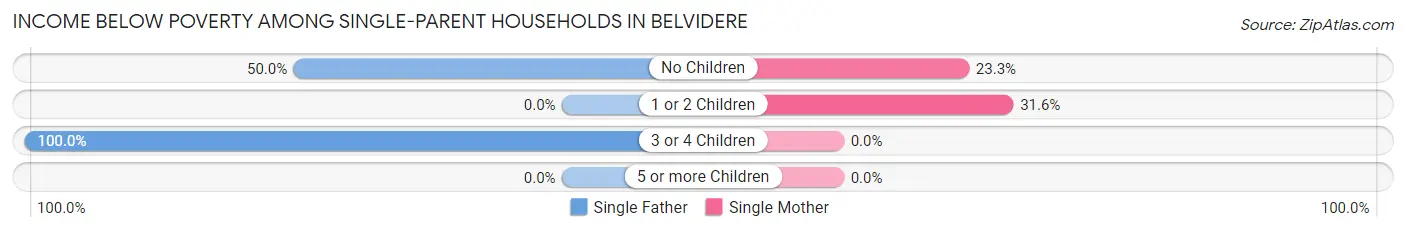
| Children | Single Father | Single Mother |
| No Children | 22 (50.0%) | 7 (23.3%) |
| 1 or 2 Children | 0 (0.0%) | 6 (31.6%) |
| 3 or 4 Children | 8 (100.0%) | 0 (0.0%) |
| 5 or more Children | 0 (0.0%) | 0 (0.0%) |
| Total | 30 (37.5%) | 13 (23.6%) |
Income Below Poverty Among Married-Couple vs Single-Parent Households in Belvidere
The poverty data for Belvidere shows that 6 of the married-couple family households (1.0%) and 43 of the single-parent households (31.9%) are living below the poverty level. Within the married-couple family households, those with no children have the highest poverty rate, with 6 households (1.5%) falling below the poverty line. Among the single-parent households, those with 3 or 4 children have the highest poverty rate, with 8 household (57.1%) living below poverty.
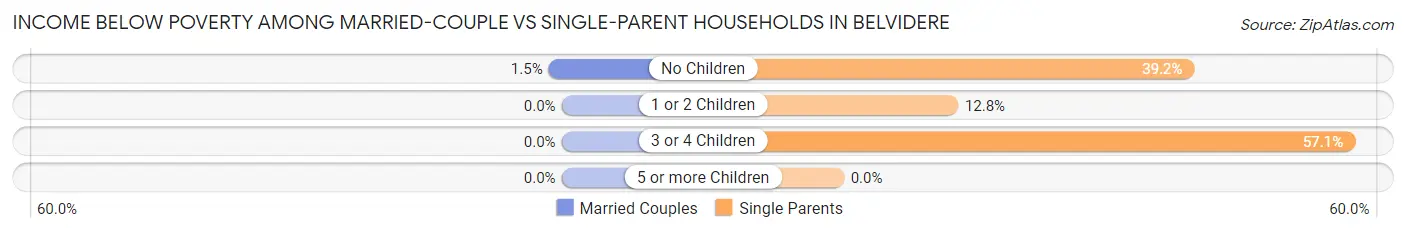
| Children | Married-Couple Families | Single-Parent Households |
| No Children | 6 (1.5%) | 29 (39.2%) |
| 1 or 2 Children | 0 (0.0%) | 6 (12.8%) |
| 3 or 4 Children | 0 (0.0%) | 8 (57.1%) |
| 5 or more Children | 0 (0.0%) | 0 (0.0%) |
| Total | 6 (1.0%) | 43 (31.9%) |
Race in Belvidere
The most populous races in Belvidere are White / Caucasian (2,356 | 93.0%), Hispanic or Latino (189 | 7.5%), and Two or more Races (113 | 4.5%).
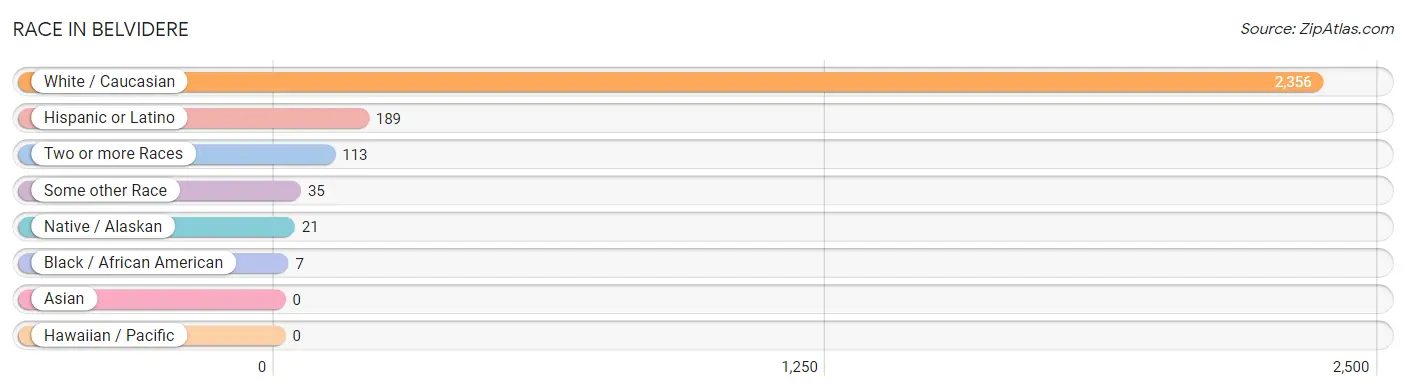
| Race | # Population | % Population |
| Asian | 0 | 0.0% |
| Black / African American | 7 | 0.3% |
| Hawaiian / Pacific | 0 | 0.0% |
| Hispanic or Latino | 189 | 7.5% |
| Native / Alaskan | 21 | 0.8% |
| White / Caucasian | 2,356 | 93.0% |
| Two or more Races | 113 | 4.5% |
| Some other Race | 35 | 1.4% |
| Total | 2,532 | 100.0% |
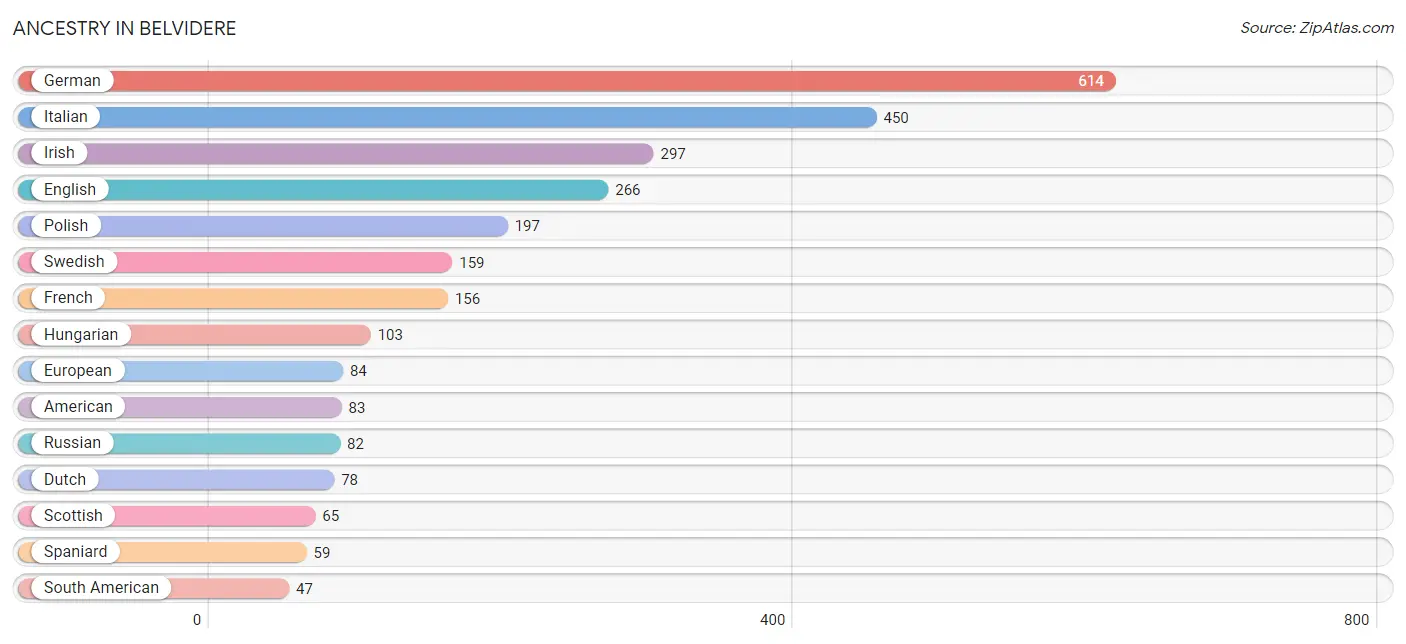
Ancestry in Belvidere
The most populous ancestries reported in Belvidere are German (614 | 24.2%), Italian (450 | 17.8%), Irish (297 | 11.7%), English (266 | 10.5%), and Polish (197 | 7.8%), together accounting for 72.0% of all Belvidere residents.
| Ancestry | # Population | % Population |
| American | 83 | 3.3% |
| Austrian | 19 | 0.7% |
| Bhutanese | 4 | 0.2% |
| Burmese | 4 | 0.2% |
| Central American | 28 | 1.1% |
| Colombian | 36 | 1.4% |
| Costa Rican | 28 | 1.1% |
| Croatian | 12 | 0.5% |
| Czech | 6 | 0.2% |
| Czechoslovakian | 9 | 0.4% |
| Danish | 27 | 1.1% |
| Dominican | 21 | 0.8% |
| Dutch | 78 | 3.1% |
| Eastern European | 27 | 1.1% |
| English | 266 | 10.5% |
| Ethiopian | 19 | 0.7% |
| European | 84 | 3.3% |
| French | 156 | 6.2% |
| German | 614 | 24.2% |
| Greek | 7 | 0.3% |
| Hungarian | 103 | 4.1% |
| Indian (Asian) | 4 | 0.2% |
| Irish | 297 | 11.7% |
| Italian | 450 | 17.8% |
| Korean | 4 | 0.2% |
| Luxembourger | 4 | 0.2% |
| Mexican | 19 | 0.7% |
| Northern European | 14 | 0.5% |
| Norwegian | 19 | 0.7% |
| Pakistani | 25 | 1.0% |
| Peruvian | 11 | 0.4% |
| Polish | 197 | 7.8% |
| Portuguese | 18 | 0.7% |
| Puerto Rican | 15 | 0.6% |
| Russian | 82 | 3.2% |
| Scandinavian | 20 | 0.8% |
| Scotch-Irish | 5 | 0.2% |
| Scottish | 65 | 2.6% |
| Serbian | 6 | 0.2% |
| Slovak | 35 | 1.4% |
| South American | 47 | 1.9% |
| South American Indian | 11 | 0.4% |
| Spaniard | 59 | 2.3% |
| Sri Lankan | 4 | 0.2% |
| Subsaharan African | 19 | 0.7% |
| Swedish | 159 | 6.3% |
| Thai | 4 | 0.2% |
| Ukrainian | 18 | 0.7% |
| Welsh | 10 | 0.4% | View All 49 Rows |
Immigrants in Belvidere
The most numerous immigrant groups reported in Belvidere came from Latin America (42 | 1.7%), Central America (25 | 1.0%), Europe (19 | 0.7%), Colombia (17 | 0.7%), and South America (17 | 0.7%), together accounting for 4.7% of all Belvidere residents.
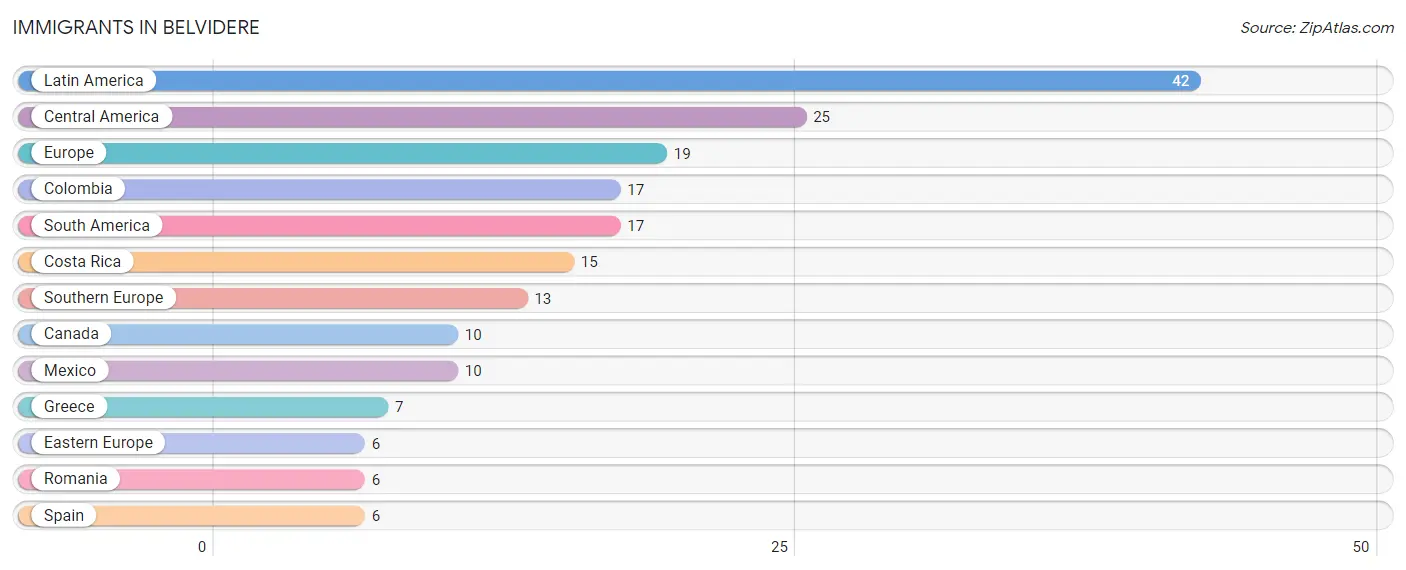
| Immigration Origin | # Population | % Population |
| Canada | 10 | 0.4% |
| Central America | 25 | 1.0% |
| Colombia | 17 | 0.7% |
| Costa Rica | 15 | 0.6% |
| Eastern Europe | 6 | 0.2% |
| Europe | 19 | 0.7% |
| Greece | 7 | 0.3% |
| Latin America | 42 | 1.7% |
| Mexico | 10 | 0.4% |
| Romania | 6 | 0.2% |
| South America | 17 | 0.7% |
| Southern Europe | 13 | 0.5% |
| Spain | 6 | 0.2% | View All 13 Rows |
Sex and Age in Belvidere
Sex and Age in Belvidere
The most populous age groups in Belvidere are 60 to 64 Years (243 | 17.5%) for men and 60 to 64 Years (224 | 19.5%) for women.
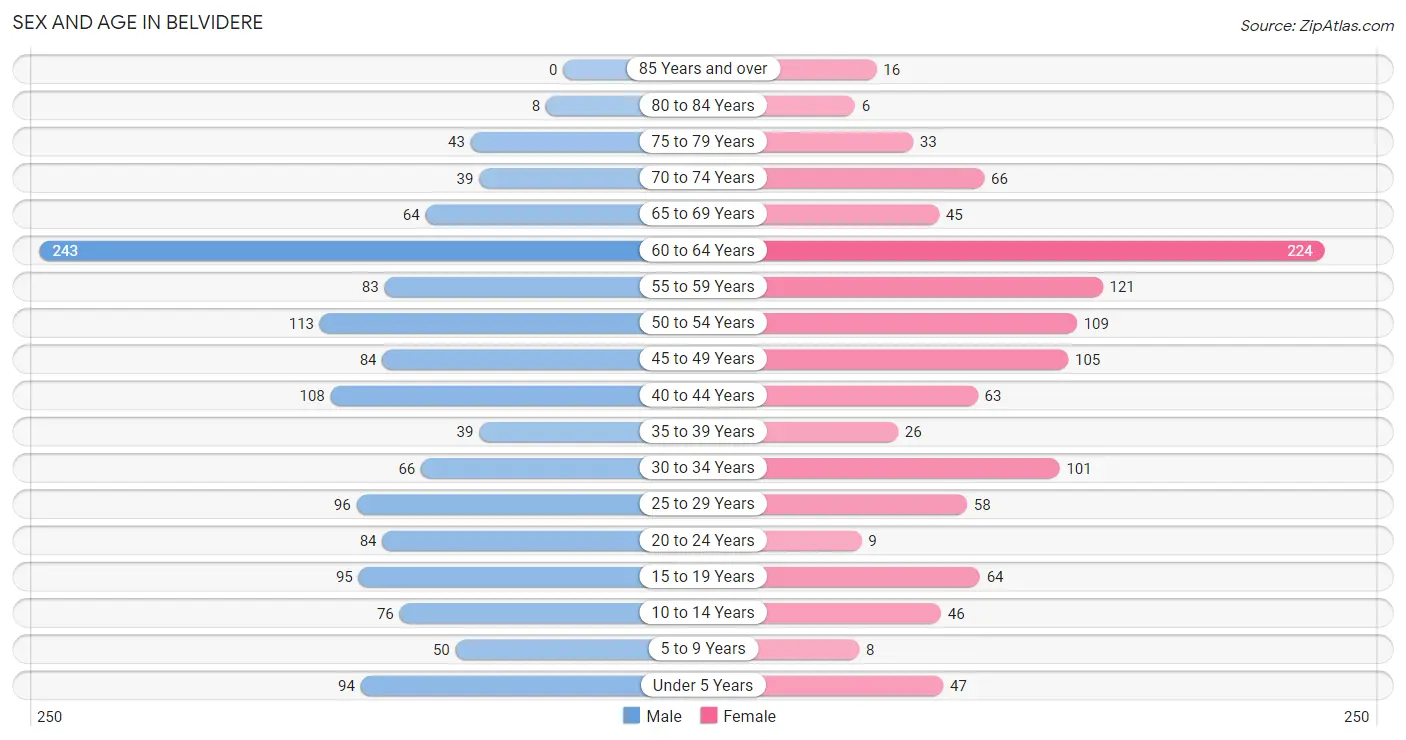
| Age Bracket | Male | Female |
| Under 5 Years | 94 (6.8%) | 47 (4.1%) |
| 5 to 9 Years | 50 (3.6%) | 8 (0.7%) |
| 10 to 14 Years | 76 (5.5%) | 46 (4.0%) |
| 15 to 19 Years | 95 (6.9%) | 64 (5.6%) |
| 20 to 24 Years | 84 (6.1%) | 9 (0.8%) |
| 25 to 29 Years | 96 (6.9%) | 58 (5.1%) |
| 30 to 34 Years | 66 (4.8%) | 101 (8.8%) |
| 35 to 39 Years | 39 (2.8%) | 26 (2.3%) |
| 40 to 44 Years | 108 (7.8%) | 63 (5.5%) |
| 45 to 49 Years | 84 (6.1%) | 105 (9.1%) |
| 50 to 54 Years | 113 (8.2%) | 109 (9.5%) |
| 55 to 59 Years | 83 (6.0%) | 121 (10.5%) |
| 60 to 64 Years | 243 (17.5%) | 224 (19.5%) |
| 65 to 69 Years | 64 (4.6%) | 45 (3.9%) |
| 70 to 74 Years | 39 (2.8%) | 66 (5.8%) |
| 75 to 79 Years | 43 (3.1%) | 33 (2.9%) |
| 80 to 84 Years | 8 (0.6%) | 6 (0.5%) |
| 85 Years and over | 0 (0.0%) | 16 (1.4%) |
| Total | 1,385 (100.0%) | 1,147 (100.0%) |
Families and Households in Belvidere
Median Family Size in Belvidere
The median family size in Belvidere is 2.71 persons per family, with single female/mother families (55 | 7.3%) accounting for the largest median family size of 2.93 persons per family. On the other hand, single male/father families (80 | 10.6%) represent the smallest median family size with 2.44 persons per family.
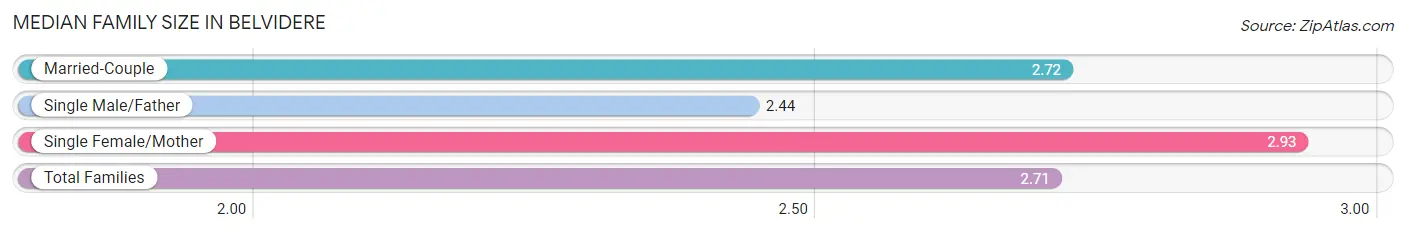
| Family Type | # Families | Family Size |
| Married-Couple | 617 (82.1%) | 2.72 |
| Single Male/Father | 80 (10.6%) | 2.44 |
| Single Female/Mother | 55 (7.3%) | 2.93 |
| Total Families | 752 (100.0%) | 2.71 |
Median Household Size in Belvidere
The median household size in Belvidere is 2.19 persons per household, with single female/mother households (55 | 4.8%) accounting for the largest median household size of 3.04 persons per household. non-family households (392 | 34.3%) represent the smallest median household size with 1.15 persons per household.
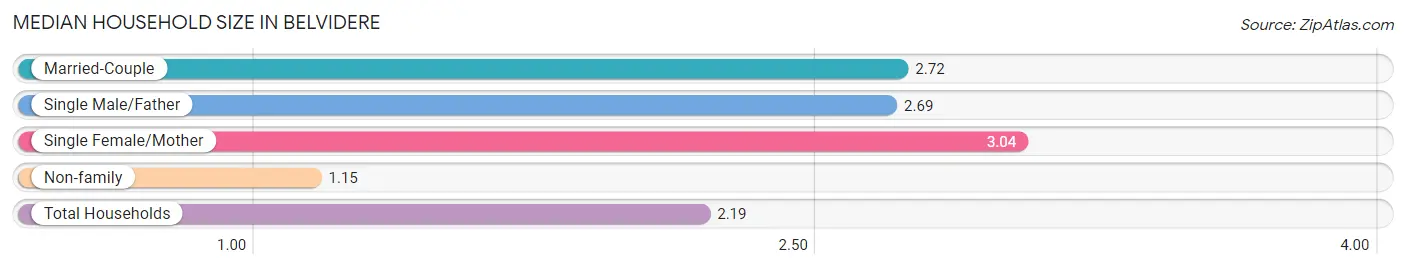
| Household Type | # Households | Household Size |
| Married-Couple | 617 (53.9%) | 2.72 |
| Single Male/Father | 80 (7.0%) | 2.69 |
| Single Female/Mother | 55 (4.8%) | 3.04 |
| Non-family | 392 (34.3%) | 1.15 |
| Total Households | 1,144 (100.0%) | 2.19 |
Household Size by Marriage Status in Belvidere
Out of a total of 1,144 households in Belvidere, 752 (65.7%) are family households, while 392 (34.3%) are nonfamily households. The most numerous type of family households are 2-person households, comprising 401, and the most common type of nonfamily households are 1-person households, comprising 335.
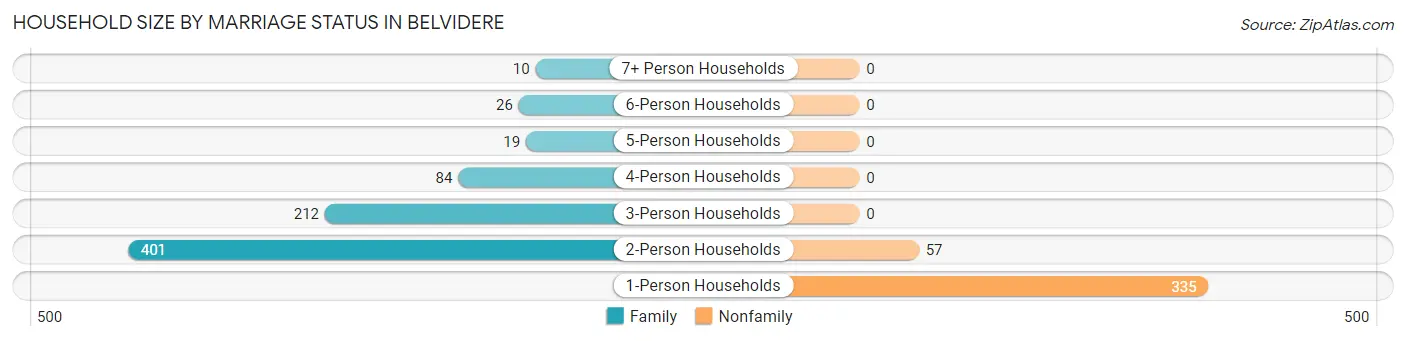
| Household Size | Family Households | Nonfamily Households |
| 1-Person Households | - | 335 (29.3%) |
| 2-Person Households | 401 (35.0%) | 57 (5.0%) |
| 3-Person Households | 212 (18.5%) | 0 (0.0%) |
| 4-Person Households | 84 (7.3%) | 0 (0.0%) |
| 5-Person Households | 19 (1.7%) | 0 (0.0%) |
| 6-Person Households | 26 (2.3%) | 0 (0.0%) |
| 7+ Person Households | 10 (0.9%) | 0 (0.0%) |
| Total | 752 (65.7%) | 392 (34.3%) |
Female Fertility in Belvidere
Fertility by Age in Belvidere
Average fertility rate in Belvidere is 63.0 births per 1,000 women. Women in the age bracket of 20 to 34 years have the highest fertility rate with 113.0 births per 1,000 women. Women in the age bracket of 20 to 34 years acount for 67.9% of all women with births.
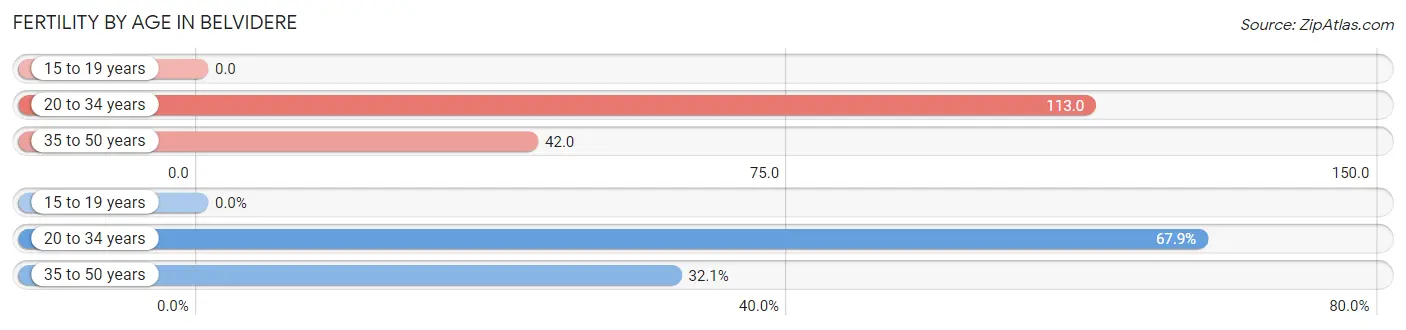
| Age Bracket | Women with Births | Births / 1,000 Women |
| 15 to 19 years | 0 (0.0%) | 0.0 |
| 20 to 34 years | 19 (67.9%) | 113.0 |
| 35 to 50 years | 9 (32.1%) | 42.0 |
| Total | 28 (100.0%) | 63.0 |
Fertility by Age by Marriage Status in Belvidere
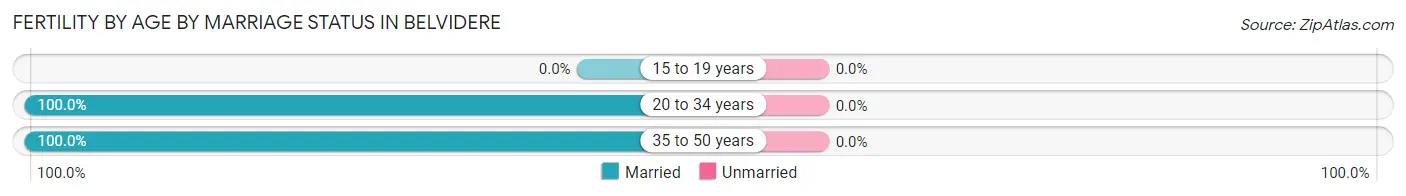
| Age Bracket | Married | Unmarried |
| 15 to 19 years | 0 (0.0%) | 0 (0.0%) |
| 20 to 34 years | 19 (100.0%) | 0 (0.0%) |
| 35 to 50 years | 9 (100.0%) | 0 (0.0%) |
| Total | 28 (100.0%) | 0 (0.0%) |
Fertility by Education in Belvidere
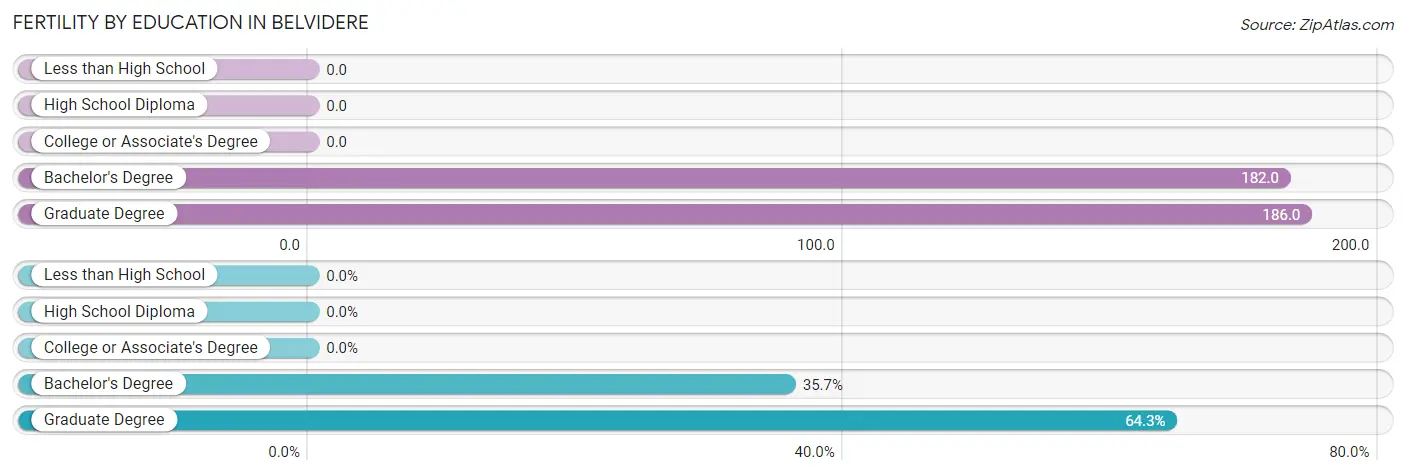
| Educational Attainment | Women with Births | Births / 1,000 Women |
| Less than High School | 0 (0.0%) | 0.0 |
| High School Diploma | 0 (0.0%) | 0.0 |
| College or Associate's Degree | 0 (0.0%) | 0.0 |
| Bachelor's Degree | 10 (35.7%) | 182.0 |
| Graduate Degree | 18 (64.3%) | 186.0 |
| Total | 28 (100.0%) | 63.0 |
Fertility by Education by Marriage Status in Belvidere
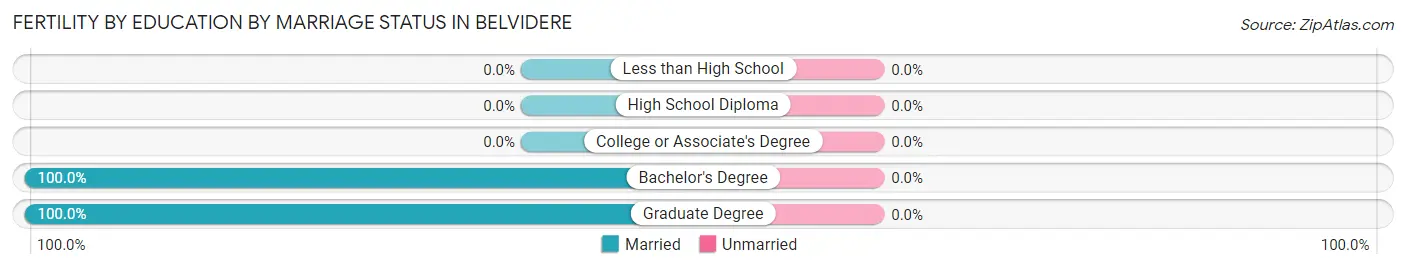
| Educational Attainment | Married | Unmarried |
| Less than High School | 0 (0.0%) | 0 (0.0%) |
| High School Diploma | 0 (0.0%) | 0 (0.0%) |
| College or Associate's Degree | 0 (0.0%) | 0 (0.0%) |
| Bachelor's Degree | 10 (100.0%) | 0 (0.0%) |
| Graduate Degree | 18 (100.0%) | 0 (0.0%) |
| Total | 28 (100.0%) | 0 (0.0%) |
Employment Characteristics in Belvidere
Employment by Class of Employer in Belvidere
Among the 1,365 employed individuals in Belvidere, private company employees (823 | 60.3%), local government employees (269 | 19.7%), and self-employed (not incorporated) (89 | 6.5%) make up the most common classes of employment.
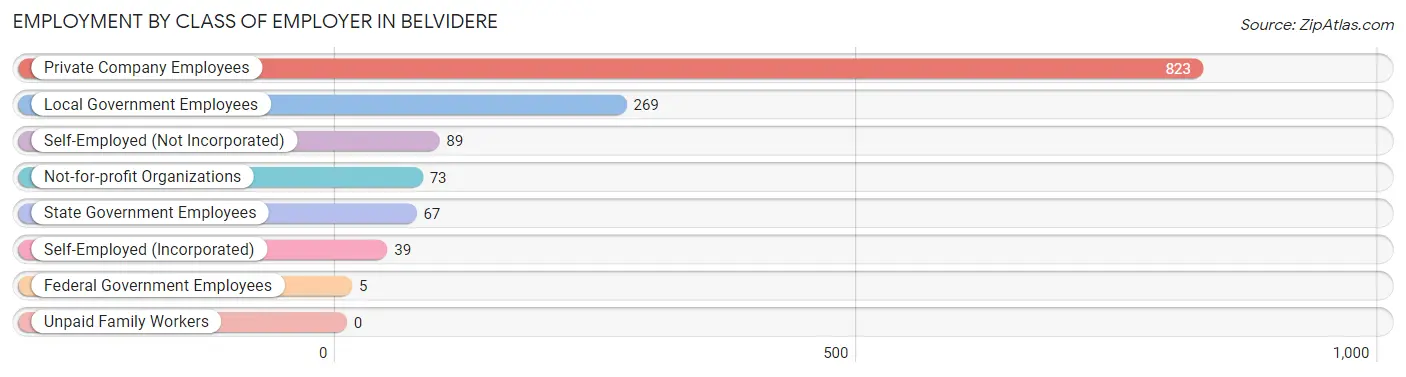
| Employer Class | # Employees | % Employees |
| Private Company Employees | 823 | 60.3% |
| Self-Employed (Incorporated) | 39 | 2.9% |
| Self-Employed (Not Incorporated) | 89 | 6.5% |
| Not-for-profit Organizations | 73 | 5.3% |
| Local Government Employees | 269 | 19.7% |
| State Government Employees | 67 | 4.9% |
| Federal Government Employees | 5 | 0.4% |
| Unpaid Family Workers | 0 | 0.0% |
| Total | 1,365 | 100.0% |
Employment Status by Age in Belvidere
According to the labor force statistics for Belvidere, out of the total population over 16 years of age (2,161), 69.6% or 1,504 individuals are in the labor force, with 8.5% or 128 of them unemployed. The age group with the highest labor force participation rate is 25 to 29 years, with 91.6% or 141 individuals in the labor force. Within the labor force, the 16 to 19 years age range has the highest percentage of unemployed individuals, with 59.0% or 36 of them being unemployed.
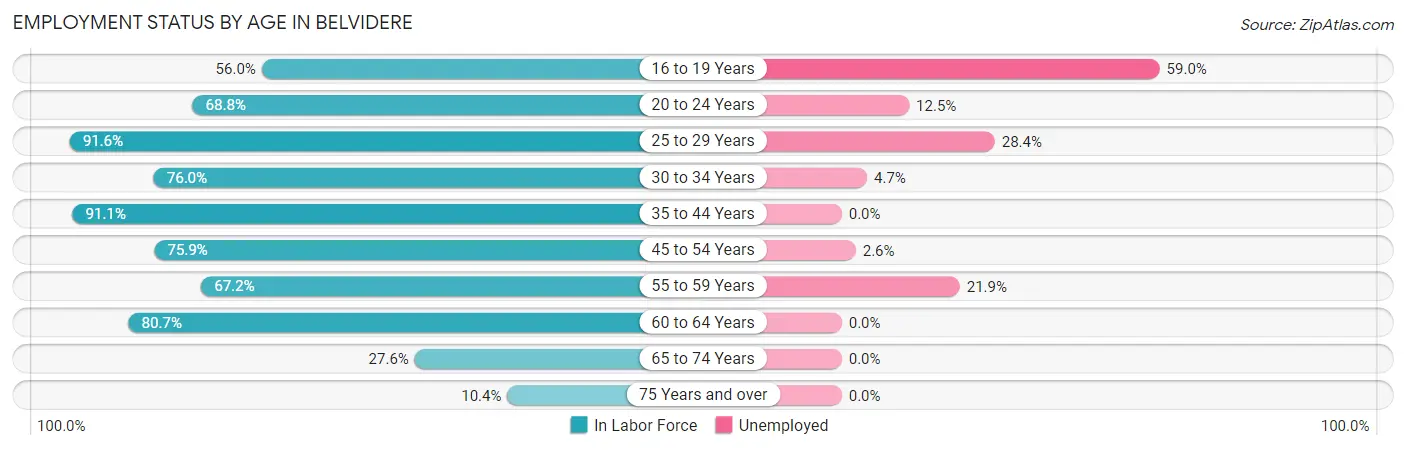
| Age Bracket | In Labor Force | Unemployed |
| 16 to 19 Years | 61 (56.0%) | 36 (59.0%) |
| 20 to 24 Years | 64 (68.8%) | 8 (12.5%) |
| 25 to 29 Years | 141 (91.6%) | 40 (28.4%) |
| 30 to 34 Years | 127 (76.0%) | 6 (4.7%) |
| 35 to 44 Years | 215 (91.1%) | 0 (0.0%) |
| 45 to 54 Years | 312 (75.9%) | 8 (2.6%) |
| 55 to 59 Years | 137 (67.2%) | 30 (21.9%) |
| 60 to 64 Years | 377 (80.7%) | 0 (0.0%) |
| 65 to 74 Years | 59 (27.6%) | 0 (0.0%) |
| 75 Years and over | 11 (10.4%) | 0 (0.0%) |
| Total | 1,504 (69.6%) | 128 (8.5%) |
Employment Status by Educational Attainment in Belvidere
According to labor force statistics for Belvidere, 79.9% of individuals (1,310) out of the total population between 25 and 64 years of age (1,639) are in the labor force, with 6.4% or 84 of them being unemployed. The group with the highest labor force participation rate are those with the educational attainment of bachelor's degree or higher, with 89.6% or 423 individuals in the labor force. Within the labor force, individuals with less than high school education have the highest percentage of unemployment, with 13.0% or 6 of them being unemployed.
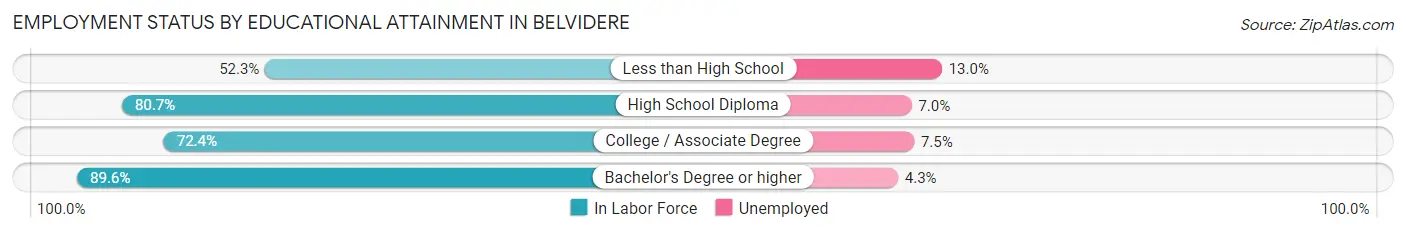
| Educational Attainment | In Labor Force | Unemployed |
| Less than High School | 46 (52.3%) | 11 (13.0%) |
| High School Diploma | 572 (80.7%) | 50 (7.0%) |
| College / Associate Degree | 268 (72.4%) | 28 (7.5%) |
| Bachelor's Degree or higher | 423 (89.6%) | 20 (4.3%) |
| Total | 1,310 (79.9%) | 105 (6.4%) |
Employment Occupations by Sex in Belvidere
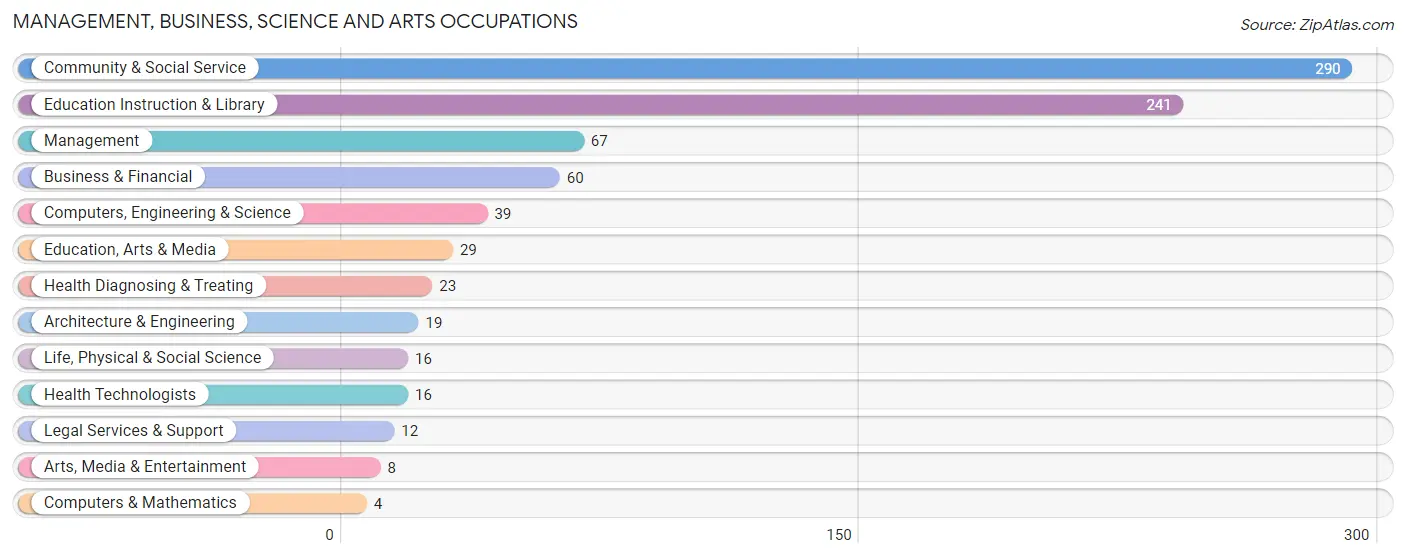
Management, Business, Science and Arts Occupations
The most common Management, Business, Science and Arts occupations in Belvidere are Community & Social Service (290 | 21.1%), Education Instruction & Library (241 | 17.5%), Management (67 | 4.9%), Business & Financial (60 | 4.4%), and Computers, Engineering & Science (39 | 2.8%).
Management, Business, Science and Arts Occupations by Sex
Within the Management, Business, Science and Arts occupations in Belvidere, the most male-oriented occupations are Architecture & Engineering (100.0%), Arts, Media & Entertainment (100.0%), and Computers, Engineering & Science (64.1%), while the most female-oriented occupations are Computers & Mathematics (100.0%), Health Diagnosing & Treating (100.0%), and Health Technologists (100.0%).
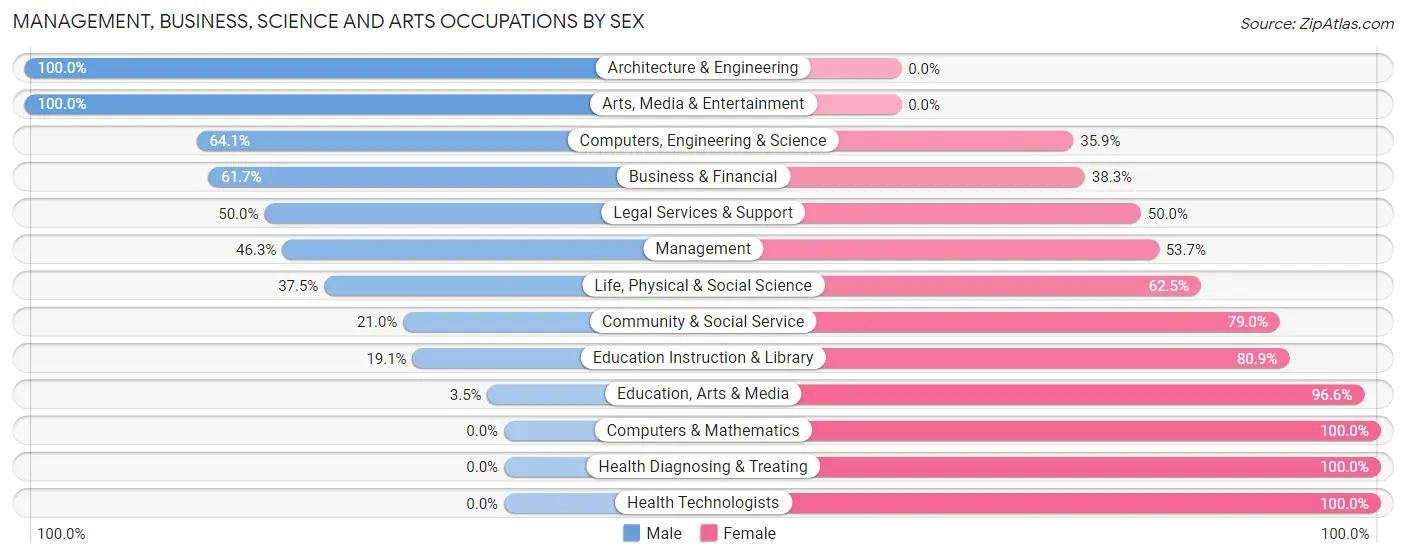
| Occupation | Male | Female |
| Management | 31 (46.3%) | 36 (53.7%) |
| Business & Financial | 37 (61.7%) | 23 (38.3%) |
| Computers, Engineering & Science | 25 (64.1%) | 14 (35.9%) |
| Computers & Mathematics | 0 (0.0%) | 4 (100.0%) |
| Architecture & Engineering | 19 (100.0%) | 0 (0.0%) |
| Life, Physical & Social Science | 6 (37.5%) | 10 (62.5%) |
| Community & Social Service | 61 (21.0%) | 229 (79.0%) |
| Education, Arts & Media | 1 (3.5%) | 28 (96.6%) |
| Legal Services & Support | 6 (50.0%) | 6 (50.0%) |
| Education Instruction & Library | 46 (19.1%) | 195 (80.9%) |
| Arts, Media & Entertainment | 8 (100.0%) | 0 (0.0%) |
| Health Diagnosing & Treating | 0 (0.0%) | 23 (100.0%) |
| Health Technologists | 0 (0.0%) | 16 (100.0%) |
| Total (Category) | 154 (32.2%) | 325 (67.8%) |
| Total (Overall) | 788 (57.3%) | 588 (42.7%) |
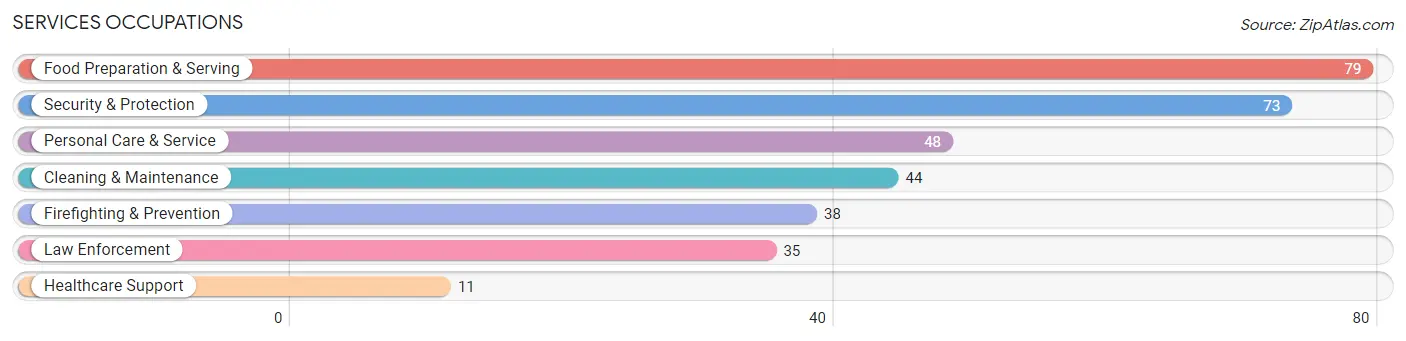
Services Occupations
The most common Services occupations in Belvidere are Food Preparation & Serving (79 | 5.7%), Security & Protection (73 | 5.3%), Personal Care & Service (48 | 3.5%), Cleaning & Maintenance (44 | 3.2%), and Firefighting & Prevention (38 | 2.8%).
Services Occupations by Sex
Within the Services occupations in Belvidere, the most male-oriented occupations are Law Enforcement (100.0%), Security & Protection (91.8%), and Firefighting & Prevention (84.2%), while the most female-oriented occupations are Healthcare Support (100.0%), Personal Care & Service (100.0%), and Cleaning & Maintenance (54.5%).
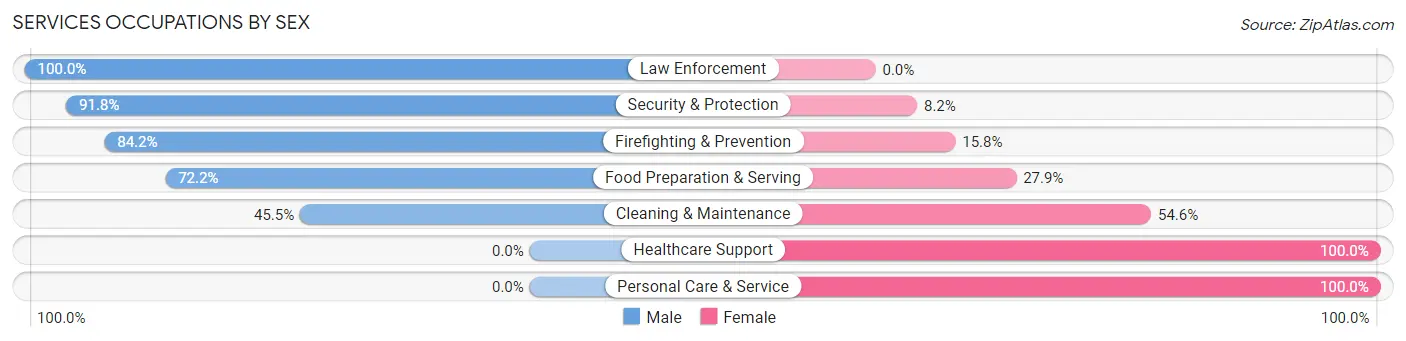
| Occupation | Male | Female |
| Healthcare Support | 0 (0.0%) | 11 (100.0%) |
| Security & Protection | 67 (91.8%) | 6 (8.2%) |
| Firefighting & Prevention | 32 (84.2%) | 6 (15.8%) |
| Law Enforcement | 35 (100.0%) | 0 (0.0%) |
| Food Preparation & Serving | 57 (72.2%) | 22 (27.9%) |
| Cleaning & Maintenance | 20 (45.5%) | 24 (54.5%) |
| Personal Care & Service | 0 (0.0%) | 48 (100.0%) |
| Total (Category) | 144 (56.5%) | 111 (43.5%) |
| Total (Overall) | 788 (57.3%) | 588 (42.7%) |
Sales and Office Occupations
The most common Sales and Office occupations in Belvidere are Sales & Related (138 | 10.0%), and Office & Administration (120 | 8.7%).

Sales and Office Occupations by Sex

| Occupation | Male | Female |
| Sales & Related | 81 (58.7%) | 57 (41.3%) |
| Office & Administration | 45 (37.5%) | 75 (62.5%) |
| Total (Category) | 126 (48.8%) | 132 (51.2%) |
| Total (Overall) | 788 (57.3%) | 588 (42.7%) |
Natural Resources, Construction and Maintenance Occupations
The most common Natural Resources, Construction and Maintenance occupations in Belvidere are Construction & Extraction (95 | 6.9%), and Installation, Maintenance & Repair (26 | 1.9%).

Natural Resources, Construction and Maintenance Occupations by Sex

| Occupation | Male | Female |
| Farming, Fishing & Forestry | 0 (0.0%) | 0 (0.0%) |
| Construction & Extraction | 95 (100.0%) | 0 (0.0%) |
| Installation, Maintenance & Repair | 26 (100.0%) | 0 (0.0%) |
| Total (Category) | 121 (100.0%) | 0 (0.0%) |
| Total (Overall) | 788 (57.3%) | 588 (42.7%) |
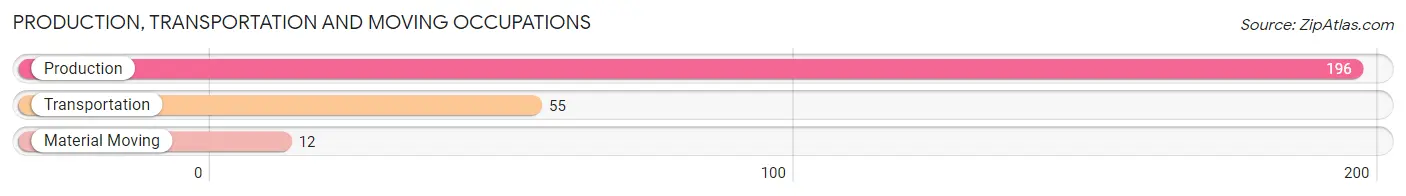
Production, Transportation and Moving Occupations
The most common Production, Transportation and Moving occupations in Belvidere are Production (196 | 14.2%), Transportation (55 | 4.0%), and Material Moving (12 | 0.9%).
Production, Transportation and Moving Occupations by Sex
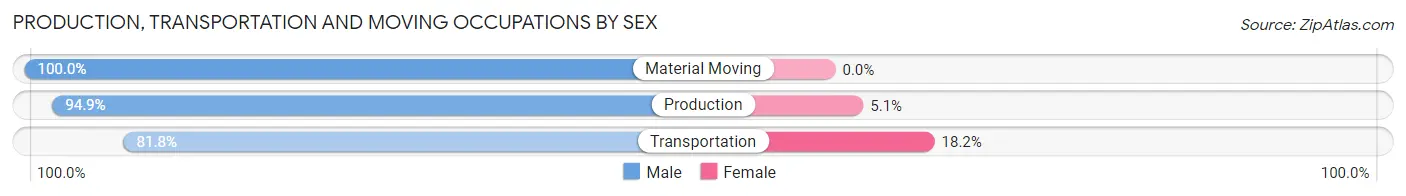
| Occupation | Male | Female |
| Production | 186 (94.9%) | 10 (5.1%) |
| Transportation | 45 (81.8%) | 10 (18.2%) |
| Material Moving | 12 (100.0%) | 0 (0.0%) |
| Total (Category) | 243 (92.4%) | 20 (7.6%) |
| Total (Overall) | 788 (57.3%) | 588 (42.7%) |
Employment Industries by Sex in Belvidere
Employment Industries in Belvidere
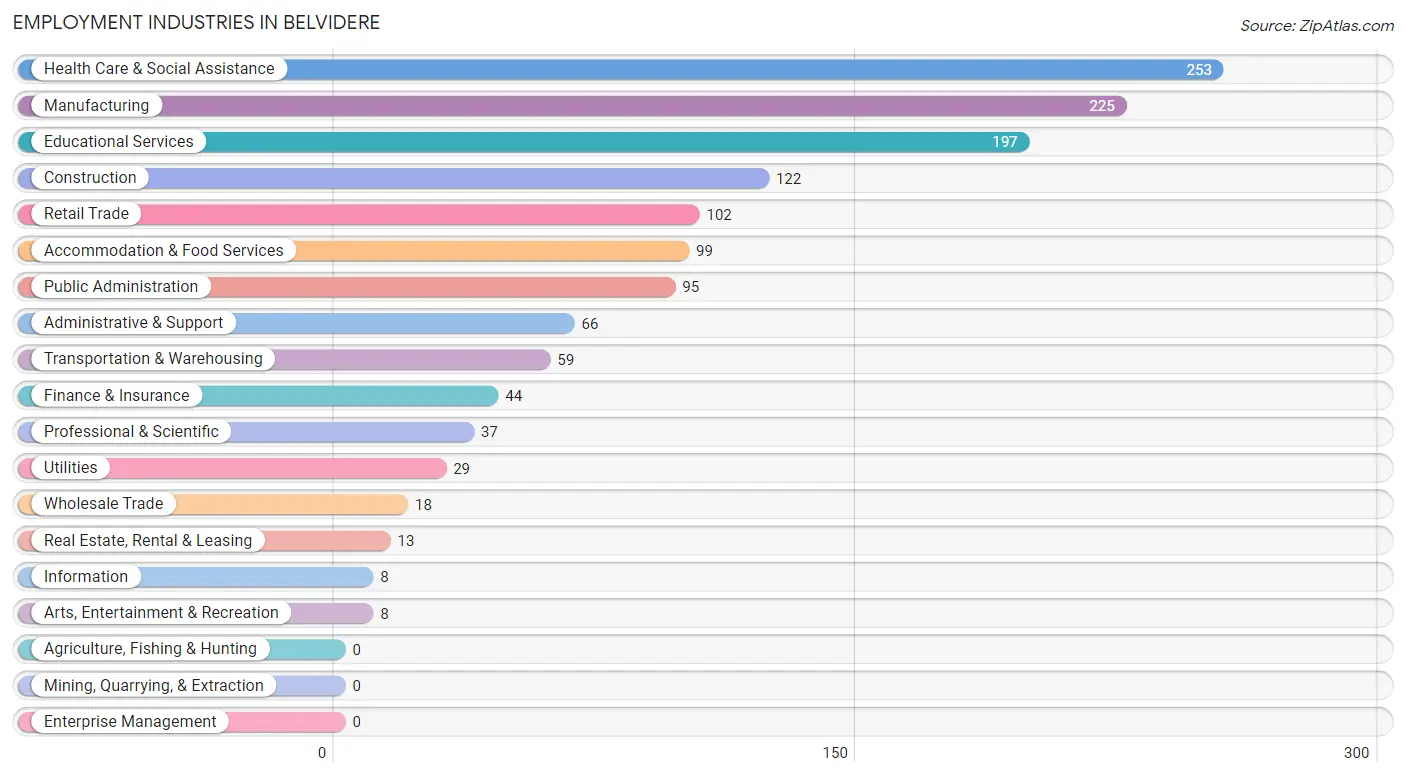
The major employment industries in Belvidere include Health Care & Social Assistance (253 | 18.4%), Manufacturing (225 | 16.4%), Educational Services (197 | 14.3%), Construction (122 | 8.9%), and Retail Trade (102 | 7.4%).
Employment Industries by Sex in Belvidere
The Belvidere industries that see more men than women are Utilities (100.0%), Information (100.0%), and Arts, Entertainment & Recreation (100.0%), whereas the industries that tend to have a higher number of women are Health Care & Social Assistance (90.9%), Finance & Insurance (75.0%), and Educational Services (65.0%).
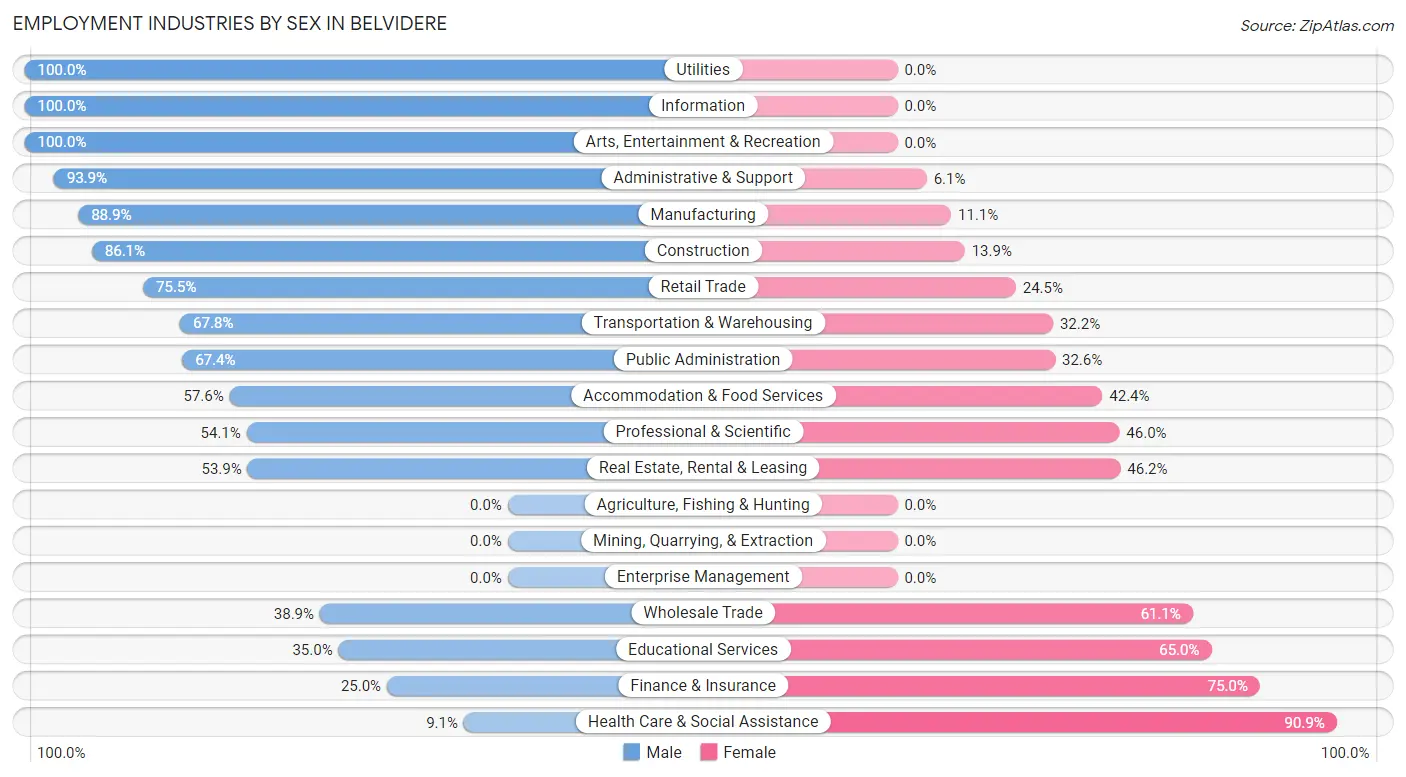
| Industry | Male | Female |
| Agriculture, Fishing & Hunting | 0 (0.0%) | 0 (0.0%) |
| Mining, Quarrying, & Extraction | 0 (0.0%) | 0 (0.0%) |
| Construction | 105 (86.1%) | 17 (13.9%) |
| Manufacturing | 200 (88.9%) | 25 (11.1%) |
| Wholesale Trade | 7 (38.9%) | 11 (61.1%) |
| Retail Trade | 77 (75.5%) | 25 (24.5%) |
| Transportation & Warehousing | 40 (67.8%) | 19 (32.2%) |
| Utilities | 29 (100.0%) | 0 (0.0%) |
| Information | 8 (100.0%) | 0 (0.0%) |
| Finance & Insurance | 11 (25.0%) | 33 (75.0%) |
| Real Estate, Rental & Leasing | 7 (53.8%) | 6 (46.2%) |
| Professional & Scientific | 20 (54.0%) | 17 (46.0%) |
| Enterprise Management | 0 (0.0%) | 0 (0.0%) |
| Administrative & Support | 62 (93.9%) | 4 (6.1%) |
| Educational Services | 69 (35.0%) | 128 (65.0%) |
| Health Care & Social Assistance | 23 (9.1%) | 230 (90.9%) |
| Arts, Entertainment & Recreation | 8 (100.0%) | 0 (0.0%) |
| Accommodation & Food Services | 57 (57.6%) | 42 (42.4%) |
| Public Administration | 64 (67.4%) | 31 (32.6%) |
| Total | 788 (57.3%) | 588 (42.7%) |
Education in Belvidere
School Enrollment in Belvidere
The most common levels of schooling among the 430 students in Belvidere are high school (143 | 33.3%), middle school (100 | 23.3%), and college / undergraduate (99 | 23.0%).
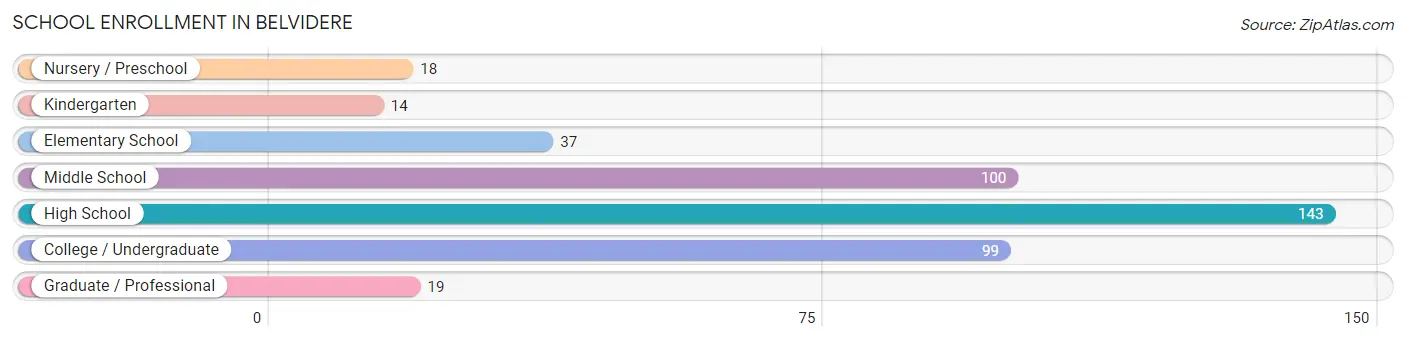
| School Level | # Students | % Students |
| Nursery / Preschool | 18 | 4.2% |
| Kindergarten | 14 | 3.3% |
| Elementary School | 37 | 8.6% |
| Middle School | 100 | 23.3% |
| High School | 143 | 33.3% |
| College / Undergraduate | 99 | 23.0% |
| Graduate / Professional | 19 | 4.4% |
| Total | 430 | 100.0% |
School Enrollment by Age by Funding Source in Belvidere
Out of a total of 430 students who are enrolled in schools in Belvidere, 117 (27.2%) attend a private institution, while the remaining 313 (72.8%) are enrolled in public schools. The age group of 3 to 4 year olds has the highest likelihood of being enrolled in private schools, with 11 (100.0% in the age bracket) enrolled. Conversely, the age group of 25 to 34 year olds has the lowest likelihood of being enrolled in a private school, with 28 (100.0% in the age bracket) attending a public institution.
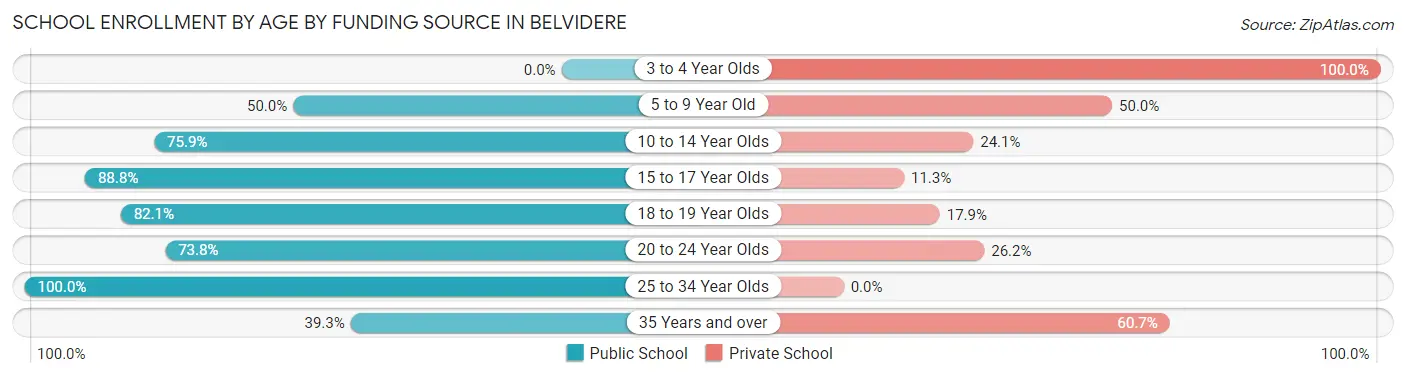
| Age Bracket | Public School | Private School |
| 3 to 4 Year Olds | 0 (0.0%) | 11 (100.0%) |
| 5 to 9 Year Old | 29 (50.0%) | 29 (50.0%) |
| 10 to 14 Year Olds | 88 (75.9%) | 28 (24.1%) |
| 15 to 17 Year Olds | 71 (88.7%) | 9 (11.3%) |
| 18 to 19 Year Olds | 55 (82.1%) | 12 (17.9%) |
| 20 to 24 Year Olds | 31 (73.8%) | 11 (26.2%) |
| 25 to 34 Year Olds | 28 (100.0%) | 0 (0.0%) |
| 35 Years and over | 11 (39.3%) | 17 (60.7%) |
| Total | 313 (72.8%) | 117 (27.2%) |
Educational Attainment by Field of Study in Belvidere
Education (130 | 23.5%), business (83 | 15.0%), psychology (56 | 10.1%), communications (49 | 8.9%), and social sciences (38 | 6.9%) are the most common fields of study among 552 individuals in Belvidere who have obtained a bachelor's degree or higher.
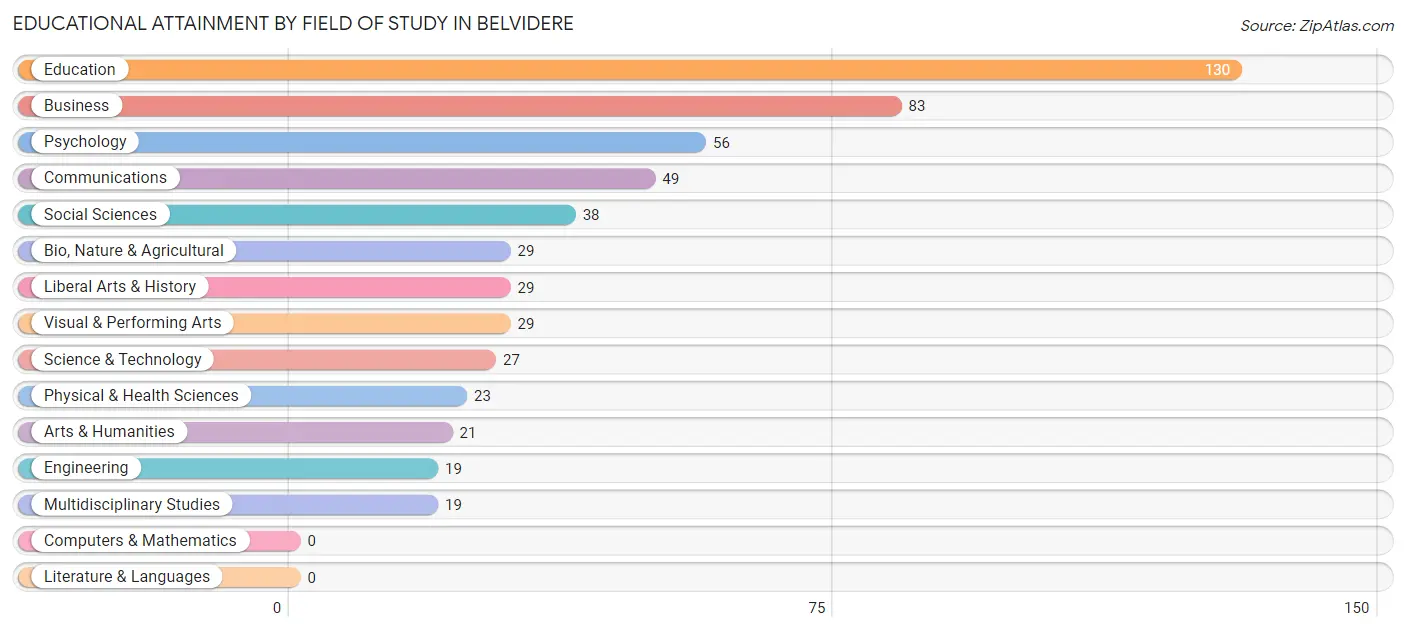
| Field of Study | # Graduates | % Graduates |
| Computers & Mathematics | 0 | 0.0% |
| Bio, Nature & Agricultural | 29 | 5.2% |
| Physical & Health Sciences | 23 | 4.2% |
| Psychology | 56 | 10.1% |
| Social Sciences | 38 | 6.9% |
| Engineering | 19 | 3.4% |
| Multidisciplinary Studies | 19 | 3.4% |
| Science & Technology | 27 | 4.9% |
| Business | 83 | 15.0% |
| Education | 130 | 23.5% |
| Literature & Languages | 0 | 0.0% |
| Liberal Arts & History | 29 | 5.2% |
| Visual & Performing Arts | 29 | 5.2% |
| Communications | 49 | 8.9% |
| Arts & Humanities | 21 | 3.8% |
| Total | 552 | 100.0% |
Transportation & Commute in Belvidere
Vehicle Availability by Sex in Belvidere
The most prevalent vehicle ownership categories in Belvidere are males with 2 vehicles (259, accounting for 33.6%) and females with 2 vehicles (224, making up 44.1%).
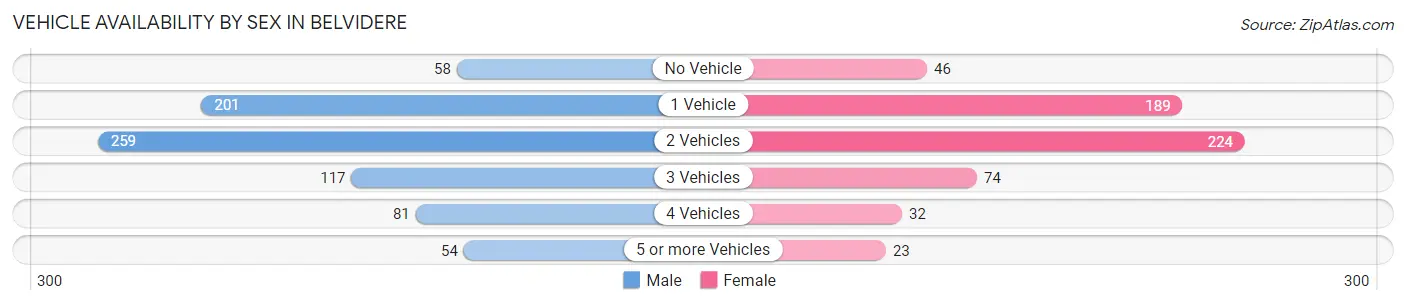
| Vehicles Available | Male | Female |
| No Vehicle | 58 (7.5%) | 46 (7.8%) |
| 1 Vehicle | 201 (26.1%) | 189 (32.1%) |
| 2 Vehicles | 259 (33.6%) | 224 (38.1%) |
| 3 Vehicles | 117 (15.2%) | 74 (12.6%) |
| 4 Vehicles | 81 (10.5%) | 32 (5.4%) |
| 5 or more Vehicles | 54 (7.0%) | 23 (3.9%) |
| Total | 770 (100.0%) | 588 (100.0%) |
Commute Time in Belvidere
The most frequently occuring commute durations in Belvidere are less than 5 minutes (234 commuters, 18.0%), 20 to 24 minutes (164 commuters, 12.6%), and 60 to 89 minutes (148 commuters, 11.4%).
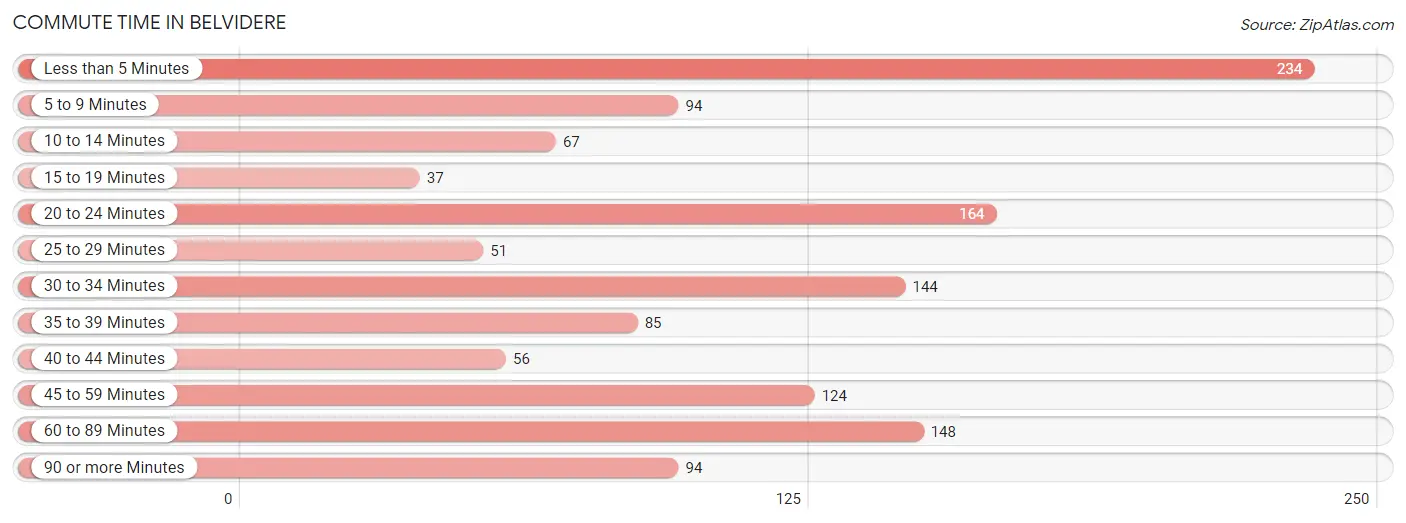
| Commute Time | # Commuters | % Commuters |
| Less than 5 Minutes | 234 | 18.0% |
| 5 to 9 Minutes | 94 | 7.2% |
| 10 to 14 Minutes | 67 | 5.2% |
| 15 to 19 Minutes | 37 | 2.9% |
| 20 to 24 Minutes | 164 | 12.6% |
| 25 to 29 Minutes | 51 | 3.9% |
| 30 to 34 Minutes | 144 | 11.1% |
| 35 to 39 Minutes | 85 | 6.6% |
| 40 to 44 Minutes | 56 | 4.3% |
| 45 to 59 Minutes | 124 | 9.6% |
| 60 to 89 Minutes | 148 | 11.4% |
| 90 or more Minutes | 94 | 7.2% |
Commute Time by Sex in Belvidere
The most common commute times in Belvidere are less than 5 minutes (194 commuters, 25.6%) for males and 20 to 24 minutes (139 commuters, 25.7%) for females.
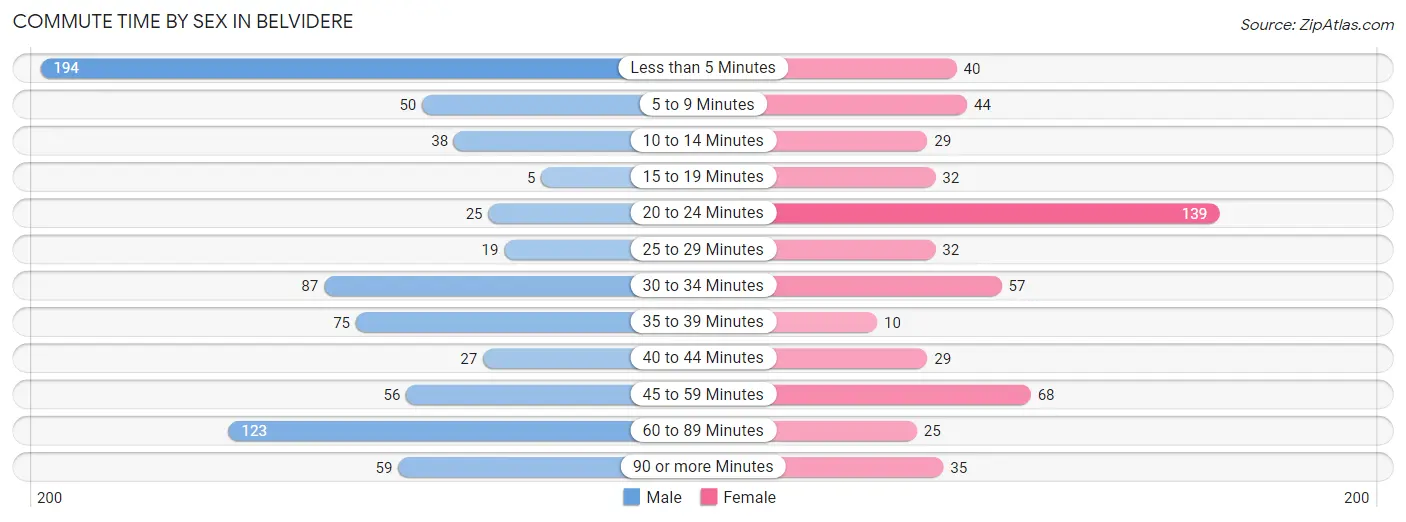
| Commute Time | Male | Female |
| Less than 5 Minutes | 194 (25.6%) | 40 (7.4%) |
| 5 to 9 Minutes | 50 (6.6%) | 44 (8.2%) |
| 10 to 14 Minutes | 38 (5.0%) | 29 (5.4%) |
| 15 to 19 Minutes | 5 (0.7%) | 32 (5.9%) |
| 20 to 24 Minutes | 25 (3.3%) | 139 (25.7%) |
| 25 to 29 Minutes | 19 (2.5%) | 32 (5.9%) |
| 30 to 34 Minutes | 87 (11.5%) | 57 (10.6%) |
| 35 to 39 Minutes | 75 (9.9%) | 10 (1.8%) |
| 40 to 44 Minutes | 27 (3.6%) | 29 (5.4%) |
| 45 to 59 Minutes | 56 (7.4%) | 68 (12.6%) |
| 60 to 89 Minutes | 123 (16.2%) | 25 (4.6%) |
| 90 or more Minutes | 59 (7.8%) | 35 (6.5%) |
Time of Departure to Work by Sex in Belvidere
The most frequent times of departure to work in Belvidere are 6:30 AM to 6:59 AM (232, 30.6%) for males and 10:00 AM to 10:59 AM (108, 20.0%) for females.
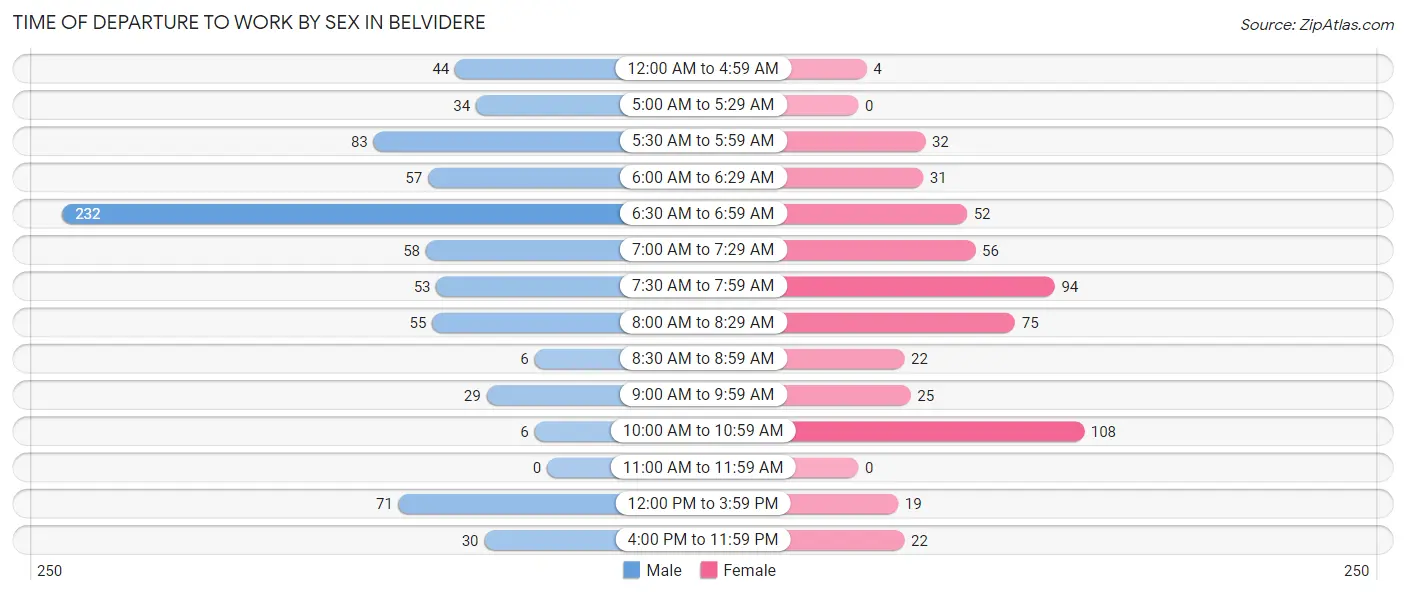
| Time of Departure | Male | Female |
| 12:00 AM to 4:59 AM | 44 (5.8%) | 4 (0.7%) |
| 5:00 AM to 5:29 AM | 34 (4.5%) | 0 (0.0%) |
| 5:30 AM to 5:59 AM | 83 (11.0%) | 32 (5.9%) |
| 6:00 AM to 6:29 AM | 57 (7.5%) | 31 (5.7%) |
| 6:30 AM to 6:59 AM | 232 (30.6%) | 52 (9.6%) |
| 7:00 AM to 7:29 AM | 58 (7.6%) | 56 (10.4%) |
| 7:30 AM to 7:59 AM | 53 (7.0%) | 94 (17.4%) |
| 8:00 AM to 8:29 AM | 55 (7.3%) | 75 (13.9%) |
| 8:30 AM to 8:59 AM | 6 (0.8%) | 22 (4.1%) |
| 9:00 AM to 9:59 AM | 29 (3.8%) | 25 (4.6%) |
| 10:00 AM to 10:59 AM | 6 (0.8%) | 108 (20.0%) |
| 11:00 AM to 11:59 AM | 0 (0.0%) | 0 (0.0%) |
| 12:00 PM to 3:59 PM | 71 (9.4%) | 19 (3.5%) |
| 4:00 PM to 11:59 PM | 30 (4.0%) | 22 (4.1%) |
| Total | 758 (100.0%) | 540 (100.0%) |
Housing Occupancy in Belvidere
Occupancy by Ownership in Belvidere
Of the total 1,144 dwellings in Belvidere, owner-occupied units account for 631 (55.2%), while renter-occupied units make up 513 (44.8%).
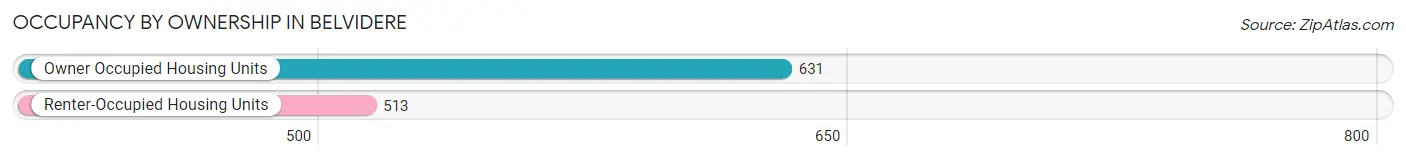
| Occupancy | # Housing Units | % Housing Units |
| Owner Occupied Housing Units | 631 | 55.2% |
| Renter-Occupied Housing Units | 513 | 44.8% |
| Total Occupied Housing Units | 1,144 | 100.0% |
Occupancy by Household Size in Belvidere
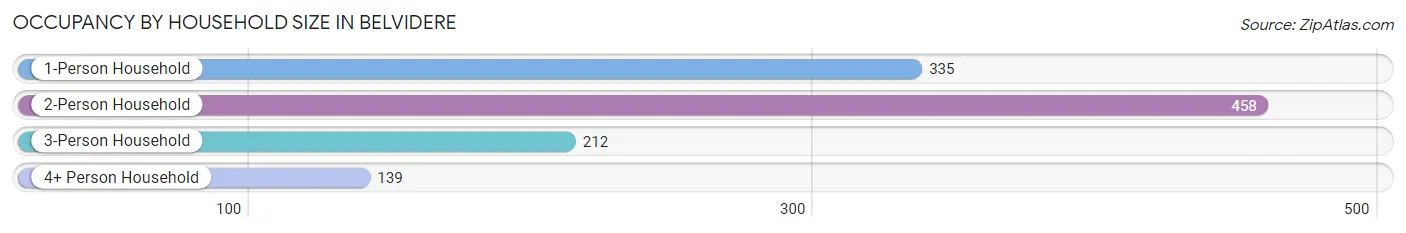
| Household Size | # Housing Units | % Housing Units |
| 1-Person Household | 335 | 29.3% |
| 2-Person Household | 458 | 40.0% |
| 3-Person Household | 212 | 18.5% |
| 4+ Person Household | 139 | 12.1% |
| Total Housing Units | 1,144 | 100.0% |
Occupancy by Ownership by Household Size in Belvidere
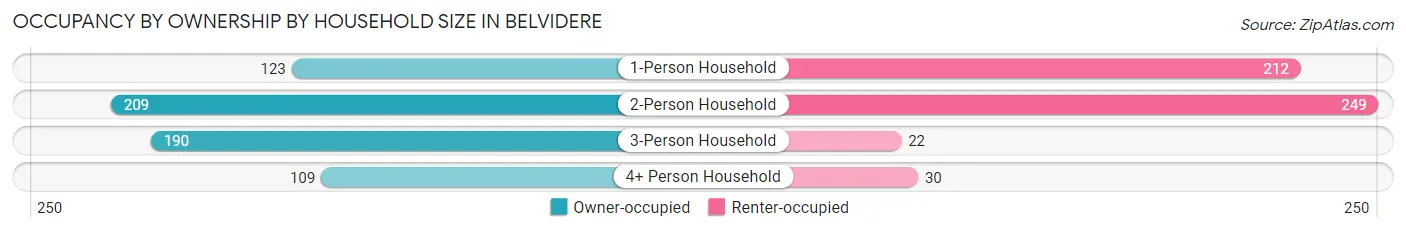
| Household Size | Owner-occupied | Renter-occupied |
| 1-Person Household | 123 (36.7%) | 212 (63.3%) |
| 2-Person Household | 209 (45.6%) | 249 (54.4%) |
| 3-Person Household | 190 (89.6%) | 22 (10.4%) |
| 4+ Person Household | 109 (78.4%) | 30 (21.6%) |
| Total Housing Units | 631 (55.2%) | 513 (44.8%) |
Occupancy by Educational Attainment in Belvidere
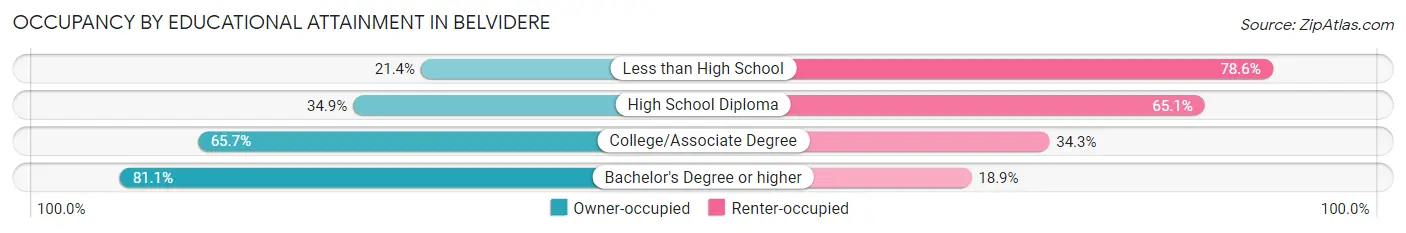
| Household Size | Owner-occupied | Renter-occupied |
| Less than High School | 12 (21.4%) | 44 (78.6%) |
| High School Diploma | 164 (34.9%) | 306 (65.1%) |
| College/Associate Degree | 197 (65.7%) | 103 (34.3%) |
| Bachelor's Degree or higher | 258 (81.1%) | 60 (18.9%) |
Occupancy by Age of Householder in Belvidere
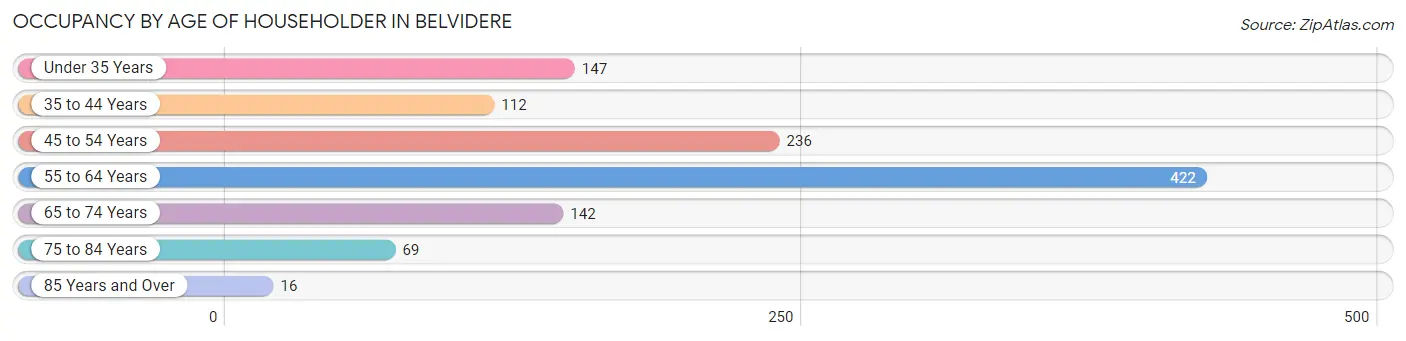
| Age Bracket | # Households | % Households |
| Under 35 Years | 147 | 12.9% |
| 35 to 44 Years | 112 | 9.8% |
| 45 to 54 Years | 236 | 20.6% |
| 55 to 64 Years | 422 | 36.9% |
| 65 to 74 Years | 142 | 12.4% |
| 75 to 84 Years | 69 | 6.0% |
| 85 Years and Over | 16 | 1.4% |
| Total | 1,144 | 100.0% |
Housing Finances in Belvidere
Median Income by Occupancy in Belvidere
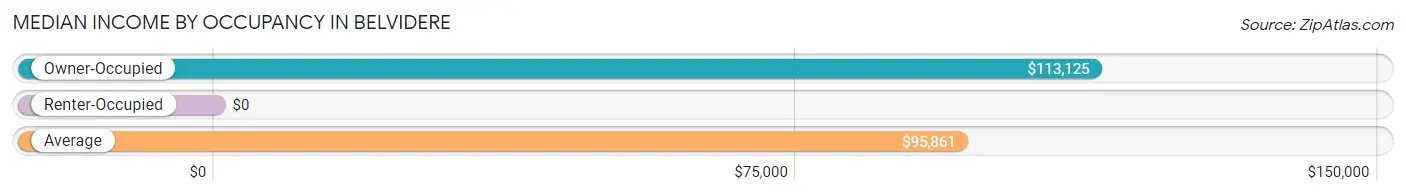
| Occupancy Type | # Households | Median Income |
| Owner-Occupied | 631 (55.2%) | $113,125 |
| Renter-Occupied | 513 (44.8%) | $0 |
| Average | 1,144 (100.0%) | $95,861 |
Occupancy by Householder Income Bracket in Belvidere
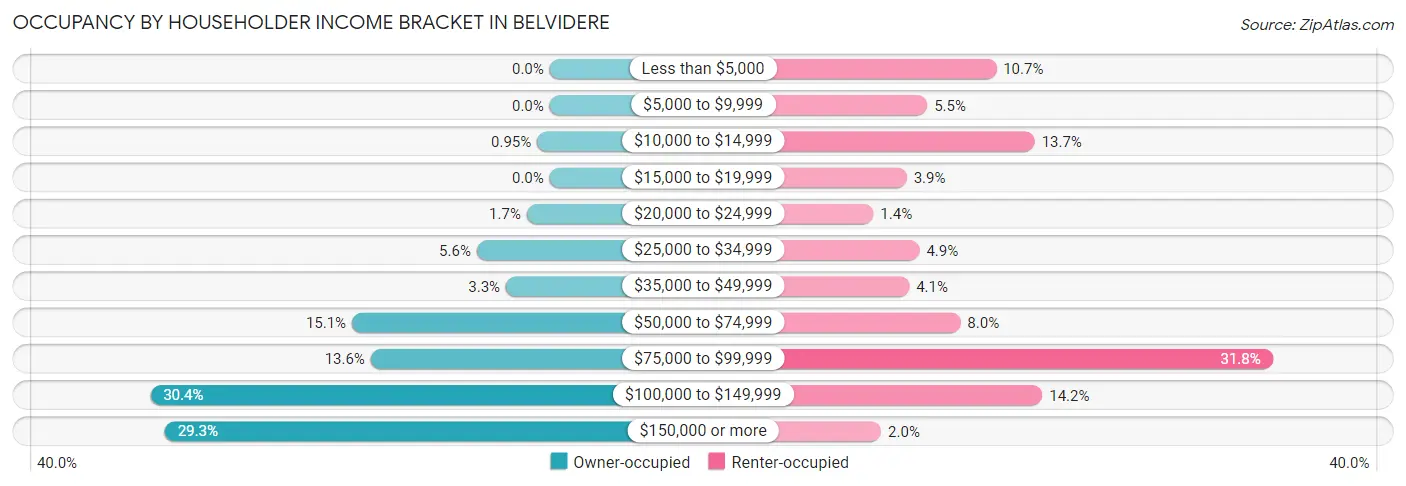
| Income Bracket | Owner-occupied | Renter-occupied |
| Less than $5,000 | 0 (0.0%) | 55 (10.7%) |
| $5,000 to $9,999 | 0 (0.0%) | 28 (5.5%) |
| $10,000 to $14,999 | 6 (0.9%) | 70 (13.7%) |
| $15,000 to $19,999 | 0 (0.0%) | 20 (3.9%) |
| $20,000 to $24,999 | 11 (1.7%) | 7 (1.4%) |
| $25,000 to $34,999 | 35 (5.6%) | 25 (4.9%) |
| $35,000 to $49,999 | 21 (3.3%) | 21 (4.1%) |
| $50,000 to $74,999 | 95 (15.1%) | 41 (8.0%) |
| $75,000 to $99,999 | 86 (13.6%) | 163 (31.8%) |
| $100,000 to $149,999 | 192 (30.4%) | 73 (14.2%) |
| $150,000 or more | 185 (29.3%) | 10 (1.9%) |
| Total | 631 (100.0%) | 513 (100.0%) |
Monthly Housing Cost Tiers in Belvidere
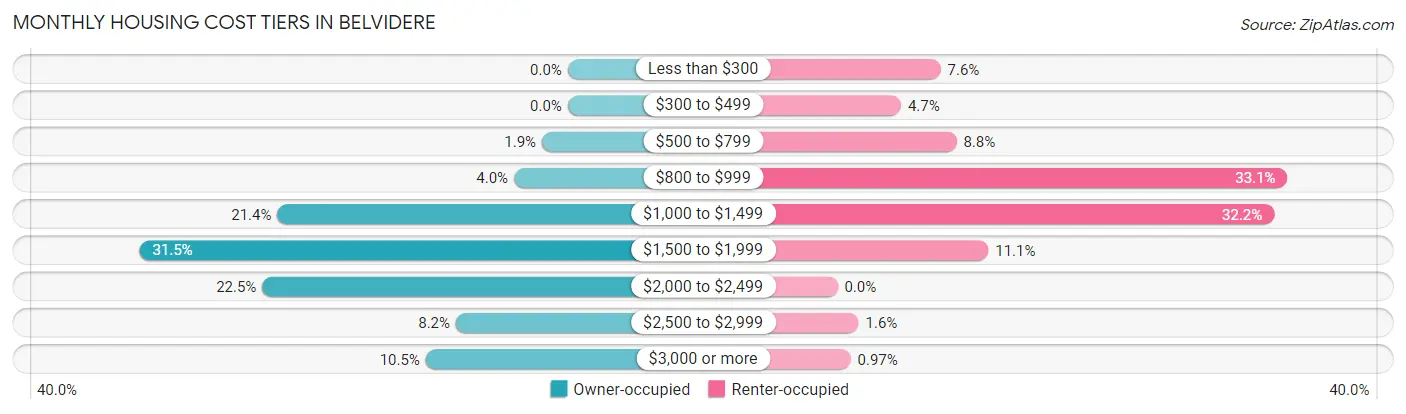
| Monthly Cost | Owner-occupied | Renter-occupied |
| Less than $300 | 0 (0.0%) | 39 (7.6%) |
| $300 to $499 | 0 (0.0%) | 24 (4.7%) |
| $500 to $799 | 12 (1.9%) | 45 (8.8%) |
| $800 to $999 | 25 (4.0%) | 170 (33.1%) |
| $1,000 to $1,499 | 135 (21.4%) | 165 (32.2%) |
| $1,500 to $1,999 | 199 (31.5%) | 57 (11.1%) |
| $2,000 to $2,499 | 142 (22.5%) | 0 (0.0%) |
| $2,500 to $2,999 | 52 (8.2%) | 8 (1.6%) |
| $3,000 or more | 66 (10.5%) | 5 (1.0%) |
| Total | 631 (100.0%) | 513 (100.0%) |
Physical Housing Characteristics in Belvidere
Housing Structures in Belvidere
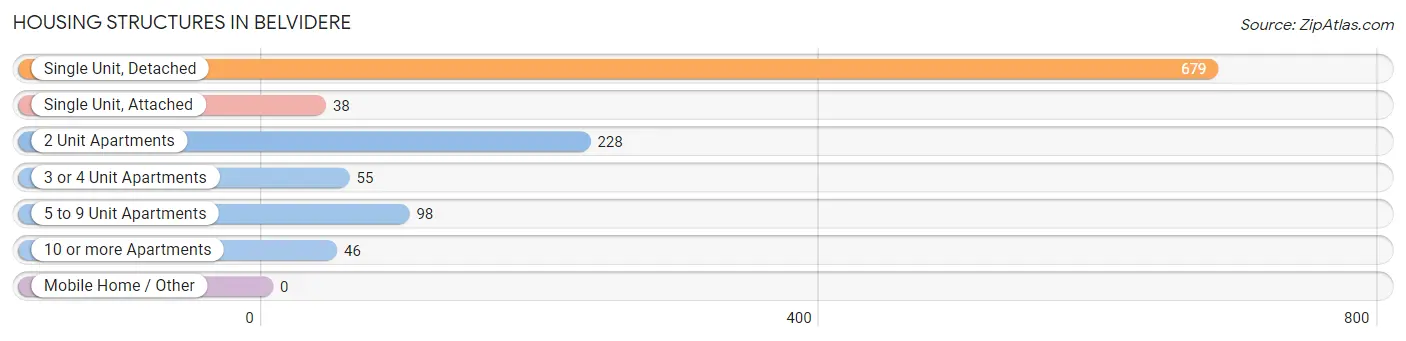
| Structure Type | # Housing Units | % Housing Units |
| Single Unit, Detached | 679 | 59.4% |
| Single Unit, Attached | 38 | 3.3% |
| 2 Unit Apartments | 228 | 19.9% |
| 3 or 4 Unit Apartments | 55 | 4.8% |
| 5 to 9 Unit Apartments | 98 | 8.6% |
| 10 or more Apartments | 46 | 4.0% |
| Mobile Home / Other | 0 | 0.0% |
| Total | 1,144 | 100.0% |
Housing Structures by Occupancy in Belvidere
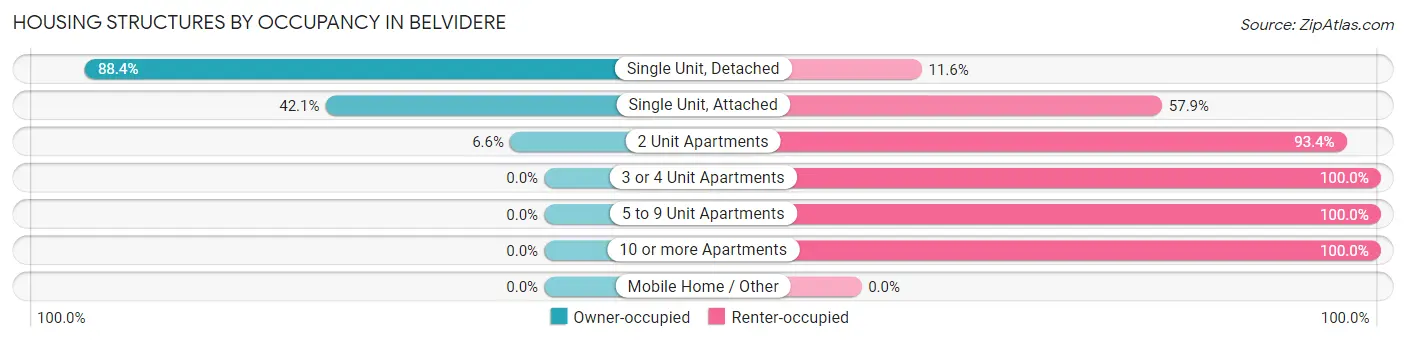
| Structure Type | Owner-occupied | Renter-occupied |
| Single Unit, Detached | 600 (88.4%) | 79 (11.6%) |
| Single Unit, Attached | 16 (42.1%) | 22 (57.9%) |
| 2 Unit Apartments | 15 (6.6%) | 213 (93.4%) |
| 3 or 4 Unit Apartments | 0 (0.0%) | 55 (100.0%) |
| 5 to 9 Unit Apartments | 0 (0.0%) | 98 (100.0%) |
| 10 or more Apartments | 0 (0.0%) | 46 (100.0%) |
| Mobile Home / Other | 0 (0.0%) | 0 (0.0%) |
| Total | 631 (55.2%) | 513 (44.8%) |
Housing Structures by Number of Rooms in Belvidere
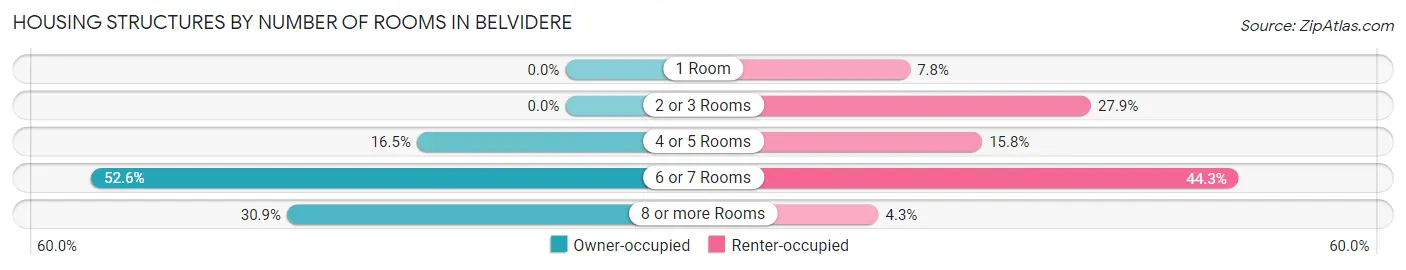
| Number of Rooms | Owner-occupied | Renter-occupied |
| 1 Room | 0 (0.0%) | 40 (7.8%) |
| 2 or 3 Rooms | 0 (0.0%) | 143 (27.9%) |
| 4 or 5 Rooms | 104 (16.5%) | 81 (15.8%) |
| 6 or 7 Rooms | 332 (52.6%) | 227 (44.3%) |
| 8 or more Rooms | 195 (30.9%) | 22 (4.3%) |
| Total | 631 (100.0%) | 513 (100.0%) |
Housing Structure by Heating Type in Belvidere
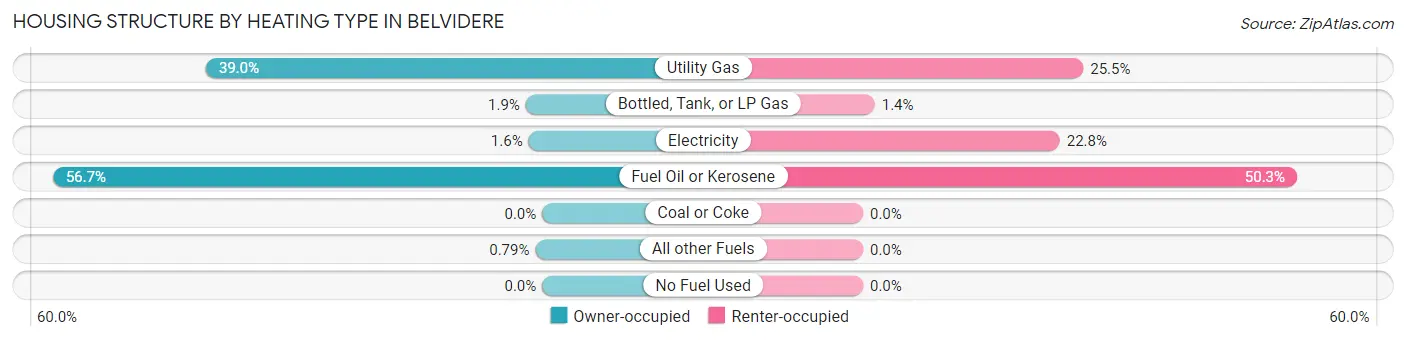
| Heating Type | Owner-occupied | Renter-occupied |
| Utility Gas | 246 (39.0%) | 131 (25.5%) |
| Bottled, Tank, or LP Gas | 12 (1.9%) | 7 (1.4%) |
| Electricity | 10 (1.6%) | 117 (22.8%) |
| Fuel Oil or Kerosene | 358 (56.7%) | 258 (50.3%) |
| Coal or Coke | 0 (0.0%) | 0 (0.0%) |
| All other Fuels | 5 (0.8%) | 0 (0.0%) |
| No Fuel Used | 0 (0.0%) | 0 (0.0%) |
| Total | 631 (100.0%) | 513 (100.0%) |
Household Vehicle Usage in Belvidere
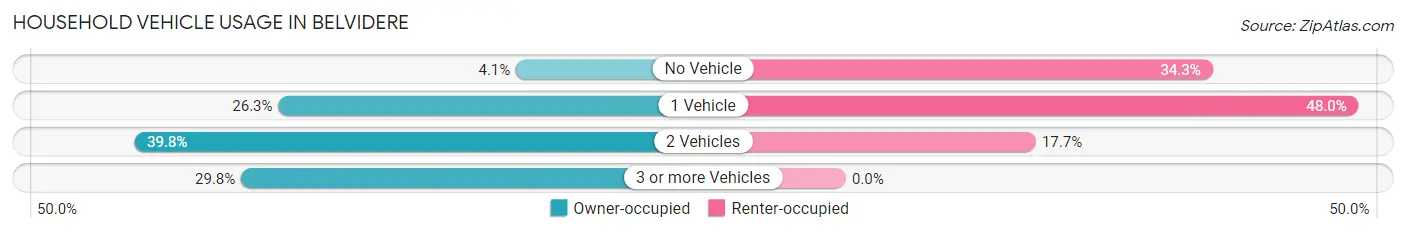
| Vehicles per Household | Owner-occupied | Renter-occupied |
| No Vehicle | 26 (4.1%) | 176 (34.3%) |
| 1 Vehicle | 166 (26.3%) | 246 (47.9%) |
| 2 Vehicles | 251 (39.8%) | 91 (17.7%) |
| 3 or more Vehicles | 188 (29.8%) | 0 (0.0%) |
| Total | 631 (100.0%) | 513 (100.0%) |
Real Estate & Mortgages in Belvidere
Real Estate and Mortgage Overview in Belvidere
| Characteristic | Without Mortgage | With Mortgage |
| Housing Units | 120 | 511 |
| Median Property Value | $227,800 | $261,800 |
| Median Household Income | $69,000 | $162 |
| Monthly Housing Costs | $1,077 | $66 |
| Real Estate Taxes | $7,368 | $0 |
Property Value by Mortgage Status in Belvidere
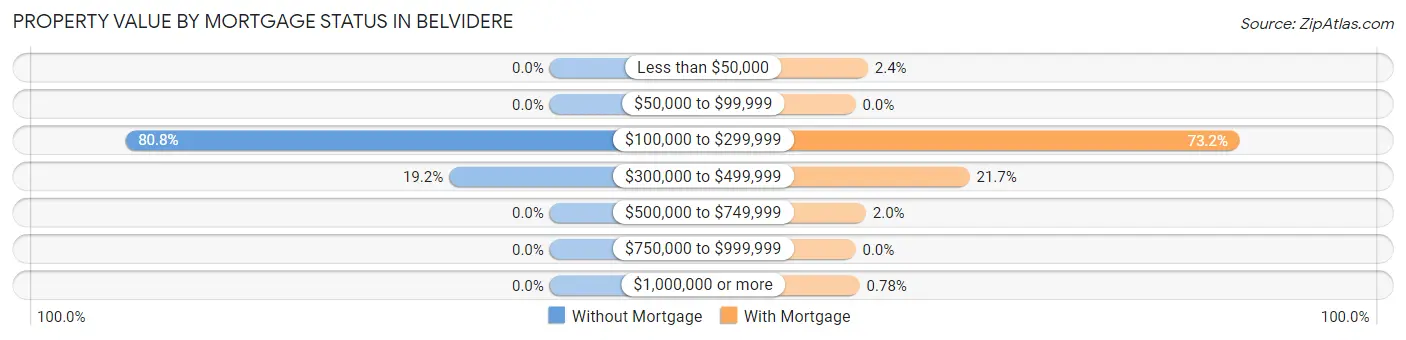
| Property Value | Without Mortgage | With Mortgage |
| Less than $50,000 | 0 (0.0%) | 12 (2.4%) |
| $50,000 to $99,999 | 0 (0.0%) | 0 (0.0%) |
| $100,000 to $299,999 | 97 (80.8%) | 374 (73.2%) |
| $300,000 to $499,999 | 23 (19.2%) | 111 (21.7%) |
| $500,000 to $749,999 | 0 (0.0%) | 10 (2.0%) |
| $750,000 to $999,999 | 0 (0.0%) | 0 (0.0%) |
| $1,000,000 or more | 0 (0.0%) | 4 (0.8%) |
| Total | 120 (100.0%) | 511 (100.0%) |
Household Income by Mortgage Status in Belvidere
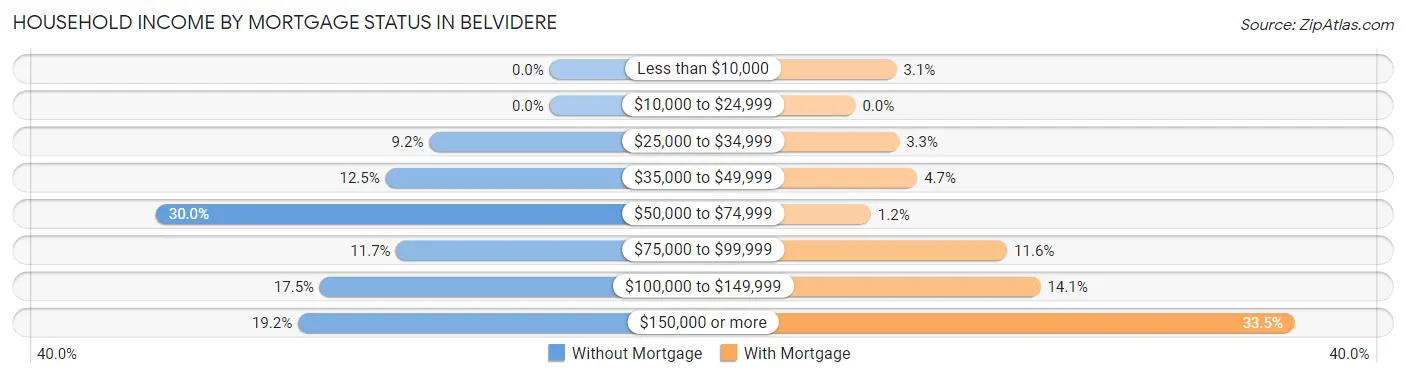
| Household Income | Without Mortgage | With Mortgage |
| Less than $10,000 | 0 (0.0%) | 16 (3.1%) |
| $10,000 to $24,999 | 0 (0.0%) | 0 (0.0%) |
| $25,000 to $34,999 | 11 (9.2%) | 17 (3.3%) |
| $35,000 to $49,999 | 15 (12.5%) | 24 (4.7%) |
| $50,000 to $74,999 | 36 (30.0%) | 6 (1.2%) |
| $75,000 to $99,999 | 14 (11.7%) | 59 (11.6%) |
| $100,000 to $149,999 | 21 (17.5%) | 72 (14.1%) |
| $150,000 or more | 23 (19.2%) | 171 (33.5%) |
| Total | 120 (100.0%) | 511 (100.0%) |
Property Value to Household Income Ratio in Belvidere
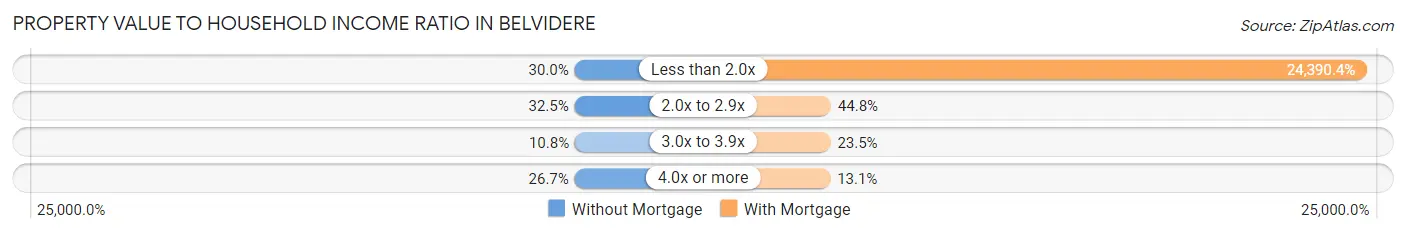
| Value-to-Income Ratio | Without Mortgage | With Mortgage |
| Less than 2.0x | 36 (30.0%) | 124,635 (24,390.4%) |
| 2.0x to 2.9x | 39 (32.5%) | 229 (44.8%) |
| 3.0x to 3.9x | 13 (10.8%) | 120 (23.5%) |
| 4.0x or more | 32 (26.7%) | 67 (13.1%) |
| Total | 120 (100.0%) | 511 (100.0%) |
Real Estate Taxes by Mortgage Status in Belvidere

| Property Taxes | Without Mortgage | With Mortgage |
| Less than $800 | 0 (0.0%) | 0 (0.0%) |
| $800 to $1,499 | 0 (0.0%) | 0 (0.0%) |
| $800 to $1,499 | 120 (100.0%) | 17 (3.3%) |
| Total | 120 (100.0%) | 511 (100.0%) |
Health & Disability in Belvidere
Health Insurance Coverage by Age in Belvidere
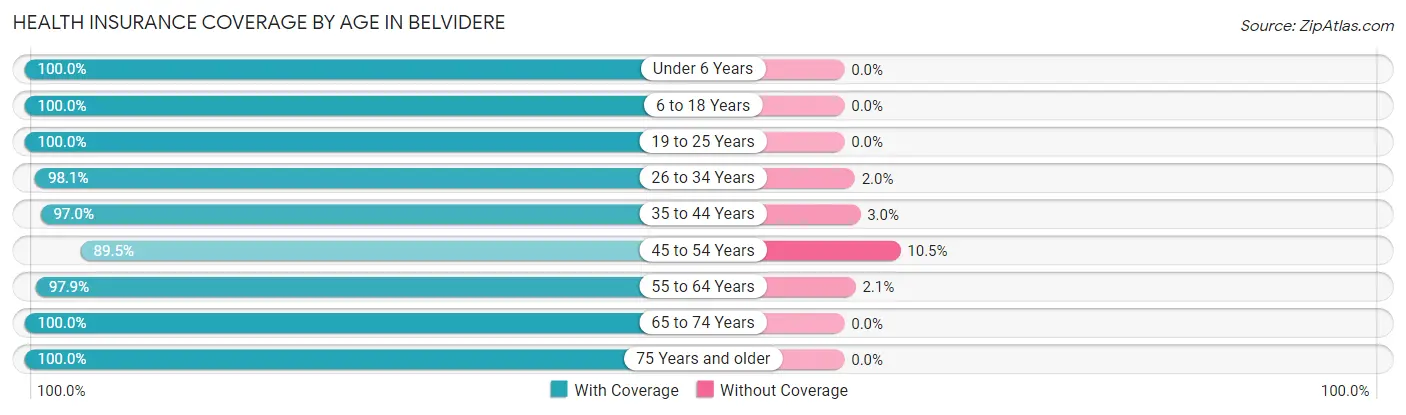
| Age Bracket | With Coverage | Without Coverage |
| Under 6 Years | 162 (100.0%) | 0 (0.0%) |
| 6 to 18 Years | 300 (100.0%) | 0 (0.0%) |
| 19 to 25 Years | 125 (100.0%) | 0 (0.0%) |
| 26 to 34 Years | 301 (98.1%) | 6 (1.9%) |
| 35 to 44 Years | 229 (97.0%) | 7 (3.0%) |
| 45 to 54 Years | 368 (89.5%) | 43 (10.5%) |
| 55 to 64 Years | 657 (97.9%) | 14 (2.1%) |
| 65 to 74 Years | 214 (100.0%) | 0 (0.0%) |
| 75 Years and older | 106 (100.0%) | 0 (0.0%) |
| Total | 2,462 (97.2%) | 70 (2.8%) |
Health Insurance Coverage by Citizenship Status in Belvidere

| Citizenship Status | With Coverage | Without Coverage |
| Native Born | 162 (100.0%) | 0 (0.0%) |
| Foreign Born, Citizen | 300 (100.0%) | 0 (0.0%) |
| Foreign Born, not a Citizen | 125 (100.0%) | 0 (0.0%) |
Health Insurance Coverage by Household Income in Belvidere
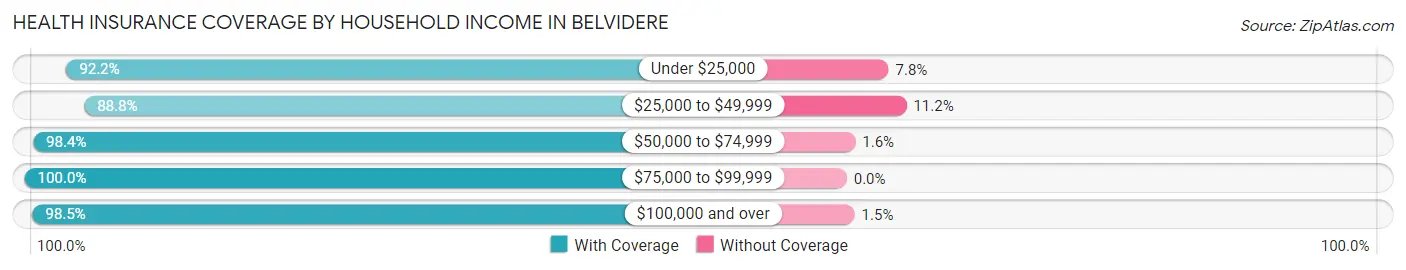
| Household Income | With Coverage | Without Coverage |
| Under $25,000 | 259 (92.2%) | 22 (7.8%) |
| $25,000 to $49,999 | 135 (88.8%) | 17 (11.2%) |
| $50,000 to $74,999 | 367 (98.4%) | 6 (1.6%) |
| $75,000 to $99,999 | 414 (100.0%) | 0 (0.0%) |
| $100,000 and over | 1,272 (98.5%) | 19 (1.5%) |
Public vs Private Health Insurance Coverage by Age in Belvidere
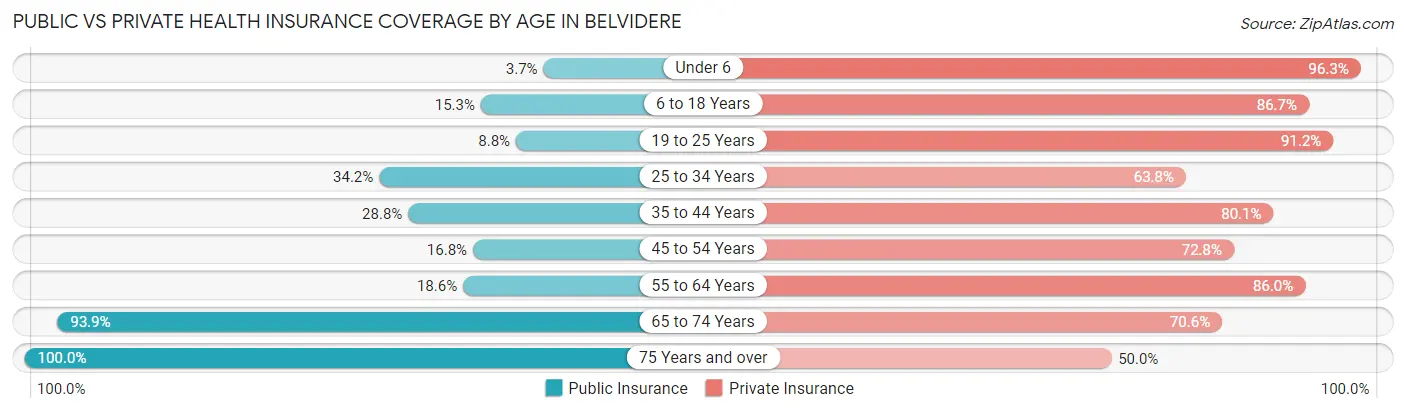
| Age Bracket | Public Insurance | Private Insurance |
| Under 6 | 6 (3.7%) | 156 (96.3%) |
| 6 to 18 Years | 46 (15.3%) | 260 (86.7%) |
| 19 to 25 Years | 11 (8.8%) | 114 (91.2%) |
| 25 to 34 Years | 105 (34.2%) | 196 (63.8%) |
| 35 to 44 Years | 68 (28.8%) | 189 (80.1%) |
| 45 to 54 Years | 69 (16.8%) | 299 (72.8%) |
| 55 to 64 Years | 125 (18.6%) | 577 (86.0%) |
| 65 to 74 Years | 201 (93.9%) | 151 (70.6%) |
| 75 Years and over | 106 (100.0%) | 53 (50.0%) |
| Total | 737 (29.1%) | 1,995 (78.8%) |
Disability Status by Sex by Age in Belvidere
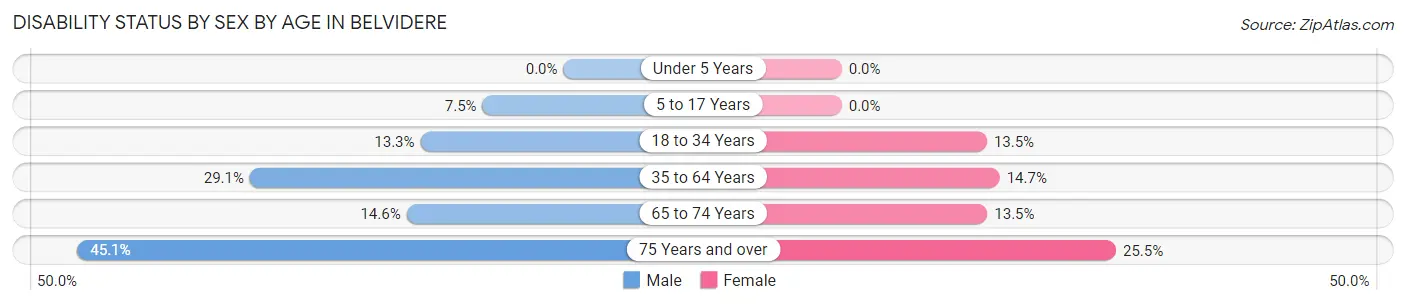
| Age Bracket | Male | Female |
| Under 5 Years | 0 (0.0%) | 0 (0.0%) |
| 5 to 17 Years | 13 (7.5%) | 0 (0.0%) |
| 18 to 34 Years | 39 (13.3%) | 26 (13.5%) |
| 35 to 64 Years | 195 (29.1%) | 95 (14.7%) |
| 65 to 74 Years | 15 (14.6%) | 15 (13.5%) |
| 75 Years and over | 23 (45.1%) | 14 (25.5%) |
Disability Class by Sex by Age in Belvidere
Disability Class: Hearing Difficulty
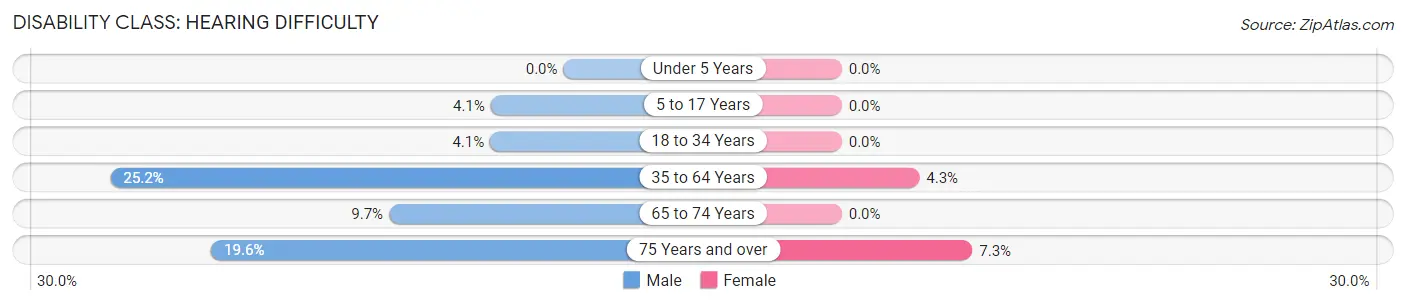
| Age Bracket | Male | Female |
| Under 5 Years | 0 (0.0%) | 0 (0.0%) |
| 5 to 17 Years | 7 (4.1%) | 0 (0.0%) |
| 18 to 34 Years | 12 (4.1%) | 0 (0.0%) |
| 35 to 64 Years | 169 (25.2%) | 28 (4.3%) |
| 65 to 74 Years | 10 (9.7%) | 0 (0.0%) |
| 75 Years and over | 10 (19.6%) | 4 (7.3%) |
Disability Class: Vision Difficulty
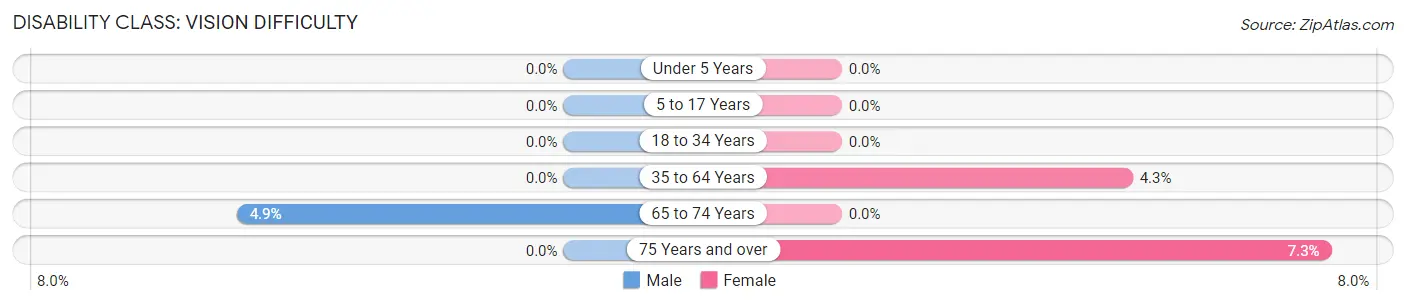
| Age Bracket | Male | Female |
| Under 5 Years | 0 (0.0%) | 0 (0.0%) |
| 5 to 17 Years | 0 (0.0%) | 0 (0.0%) |
| 18 to 34 Years | 0 (0.0%) | 0 (0.0%) |
| 35 to 64 Years | 0 (0.0%) | 28 (4.3%) |
| 65 to 74 Years | 5 (4.9%) | 0 (0.0%) |
| 75 Years and over | 0 (0.0%) | 4 (7.3%) |
Disability Class: Cognitive Difficulty
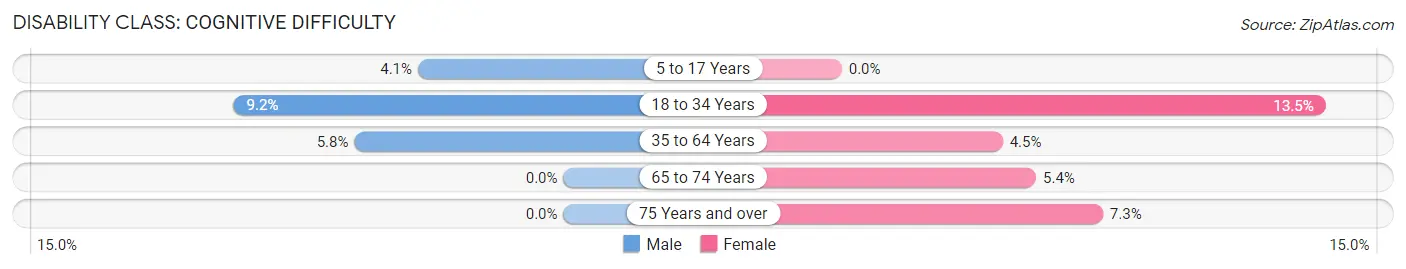
| Age Bracket | Male | Female |
| 5 to 17 Years | 7 (4.1%) | 0 (0.0%) |
| 18 to 34 Years | 27 (9.2%) | 26 (13.5%) |
| 35 to 64 Years | 39 (5.8%) | 29 (4.5%) |
| 65 to 74 Years | 0 (0.0%) | 6 (5.4%) |
| 75 Years and over | 0 (0.0%) | 4 (7.3%) |
Disability Class: Ambulatory Difficulty
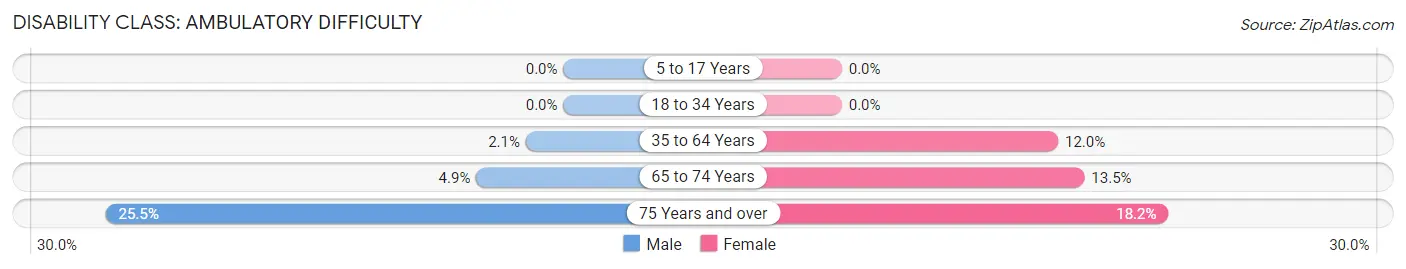
| Age Bracket | Male | Female |
| 5 to 17 Years | 0 (0.0%) | 0 (0.0%) |
| 18 to 34 Years | 0 (0.0%) | 0 (0.0%) |
| 35 to 64 Years | 14 (2.1%) | 78 (12.0%) |
| 65 to 74 Years | 5 (4.9%) | 15 (13.5%) |
| 75 Years and over | 13 (25.5%) | 10 (18.2%) |
Disability Class: Self-Care Difficulty
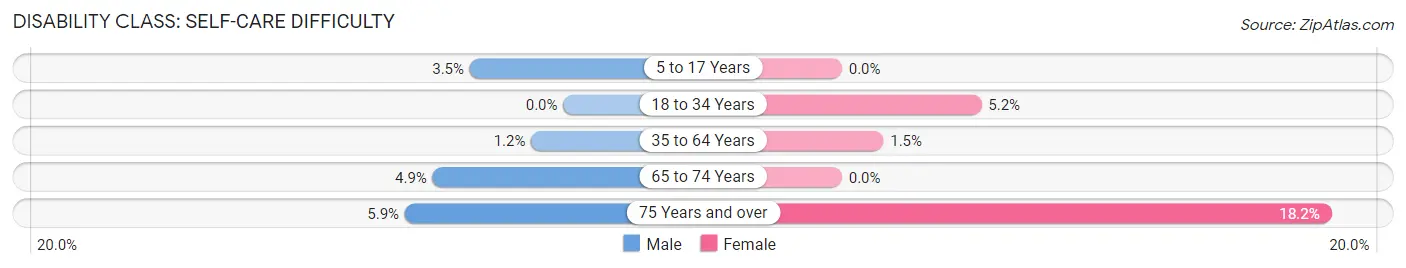
| Age Bracket | Male | Female |
| 5 to 17 Years | 6 (3.5%) | 0 (0.0%) |
| 18 to 34 Years | 0 (0.0%) | 10 (5.2%) |
| 35 to 64 Years | 8 (1.2%) | 10 (1.5%) |
| 65 to 74 Years | 5 (4.9%) | 0 (0.0%) |
| 75 Years and over | 3 (5.9%) | 10 (18.2%) |
Technology Access in Belvidere
Computing Device Access in Belvidere
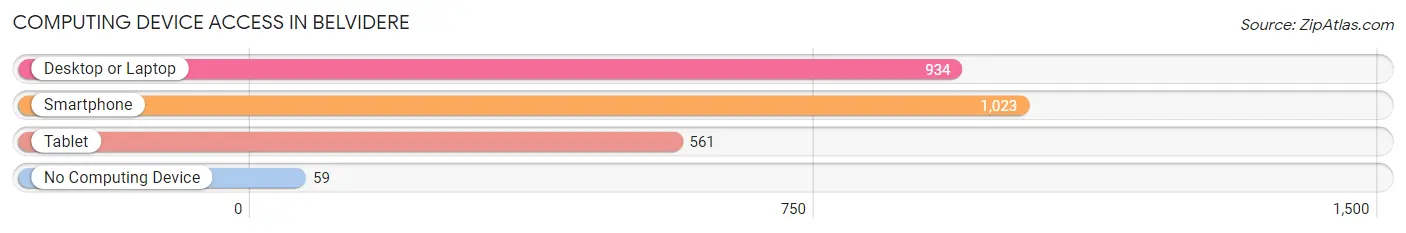
| Device Type | # Households | % Households |
| Desktop or Laptop | 934 | 81.6% |
| Smartphone | 1,023 | 89.4% |
| Tablet | 561 | 49.0% |
| No Computing Device | 59 | 5.2% |
| Total | 1,144 | 100.0% |
Internet Access in Belvidere
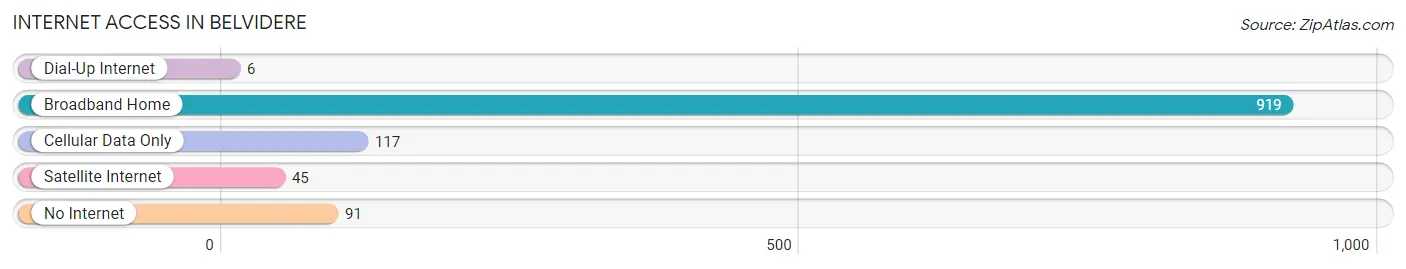
| Internet Type | # Households | % Households |
| Dial-Up Internet | 6 | 0.5% |
| Broadband Home | 919 | 80.3% |
| Cellular Data Only | 117 | 10.2% |
| Satellite Internet | 45 | 3.9% |
| No Internet | 91 | 8.0% |
| Total | 1,144 | 100.0% |
Belvidere Summary
Belvidere is a small town located in Warren County, New Jersey. It is situated on the banks of the Delaware River, and is part of the Allamuchy Township. The town has a population of approximately 4,000 people, and is known for its historic buildings and quaint atmosphere.
History
Belvidere was first settled in 1720 by a group of Dutch settlers. The town was originally known as “Belvidere”, which is derived from the Dutch word for “beautiful view”. The town was officially incorporated in 1845, and was named after the nearby Belvidere Mountain.
The town was an important stop on the Delaware and Raritan Canal, which was built in the early 1800s. The canal was used to transport goods and people between New York City and Philadelphia. The canal was eventually replaced by the Belvidere-Delaware Railroad in the late 1800s.
The town was also home to a number of factories, including a silk mill, a paper mill, and a woolen mill. These factories provided employment for many of the town’s residents.
Geography
Belvidere is located in Warren County, New Jersey. It is situated on the banks of the Delaware River, and is part of the Allamuchy Township. The town is located approximately 40 miles northwest of New York City, and is bordered by the towns of Oxford, Washington, and White Township.
The town has a total area of 1.3 square miles, all of which is land. The town is located at an elevation of approximately 500 feet above sea level.
Economy
Belvidere’s economy is largely based on tourism and agriculture. The town is home to a number of historic buildings, including the Belvidere Mansion, which was built in 1790. The town also has a number of small businesses, including restaurants, shops, and galleries.
The town is also home to a number of farms, which produce a variety of crops, including corn, soybeans, and hay. The town also has a number of wineries, which produce a variety of wines.
Demographics
As of the 2010 census, Belvidere had a population of 4,000 people. The town has a median household income of $50,000, and a median home value of $200,000. The town is predominantly white, with approximately 90% of the population identifying as Caucasian. The town also has a small Hispanic population, with approximately 5% of the population identifying as Hispanic or Latino.
Belvidere is a small town with a rich history and a unique atmosphere. The town is home to a number of historic buildings, and is a popular destination for tourists. The town also has a strong agricultural economy, and is home to a number of small businesses. The town has a population of approximately 4,000 people, and is predominantly white.
Common Questions
What is Per Capita Income in Belvidere?
Per Capita income in Belvidere is $43,387.
What is the Median Family Income in Belvidere?
Median Family Income in Belvidere is $100,781.
What is the Median Household income in Belvidere?
Median Household Income in Belvidere is $95,861.
What is Income or Wage Gap in Belvidere?
Income or Wage Gap in Belvidere is 29.9%.
Women in Belvidere earn 70.1 cents for every dollar earned by a man.
What is Inequality or Gini Index in Belvidere?
Inequality or Gini Index in Belvidere is 0.39.
What is the Total Population of Belvidere?
Total Population of Belvidere is 2,532.
What is the Total Male Population of Belvidere?
Total Male Population of Belvidere is 1,385.
What is the Total Female Population of Belvidere?
Total Female Population of Belvidere is 1,147.
What is the Ratio of Males per 100 Females in Belvidere?
There are 120.75 Males per 100 Females in Belvidere.
What is the Ratio of Females per 100 Males in Belvidere?
There are 82.82 Females per 100 Males in Belvidere.
What is the Median Population Age in Belvidere?
Median Population Age in Belvidere is 48.0 Years.
What is the Average Family Size in Belvidere
Average Family Size in Belvidere is 2.7 People.
What is the Average Household Size in Belvidere
Average Household Size in Belvidere is 2.2 People.
How Large is the Labor Force in Belvidere?
There are 1,504 People in the Labor Forcein in Belvidere.
What is the Percentage of People in the Labor Force in Belvidere?
69.6% of People are in the Labor Force in Belvidere.
What is the Unemployment Rate in Belvidere?
Unemployment Rate in Belvidere is 8.5%.