Zip Codes with the Highest Percentage of Population Employed in Mining, Quarrying, & Extraction in Missoula, MT
RELATED REPORTS & OPTIONS
Mining, Quarrying, & Extraction
Missoula
Compare Zip Codes
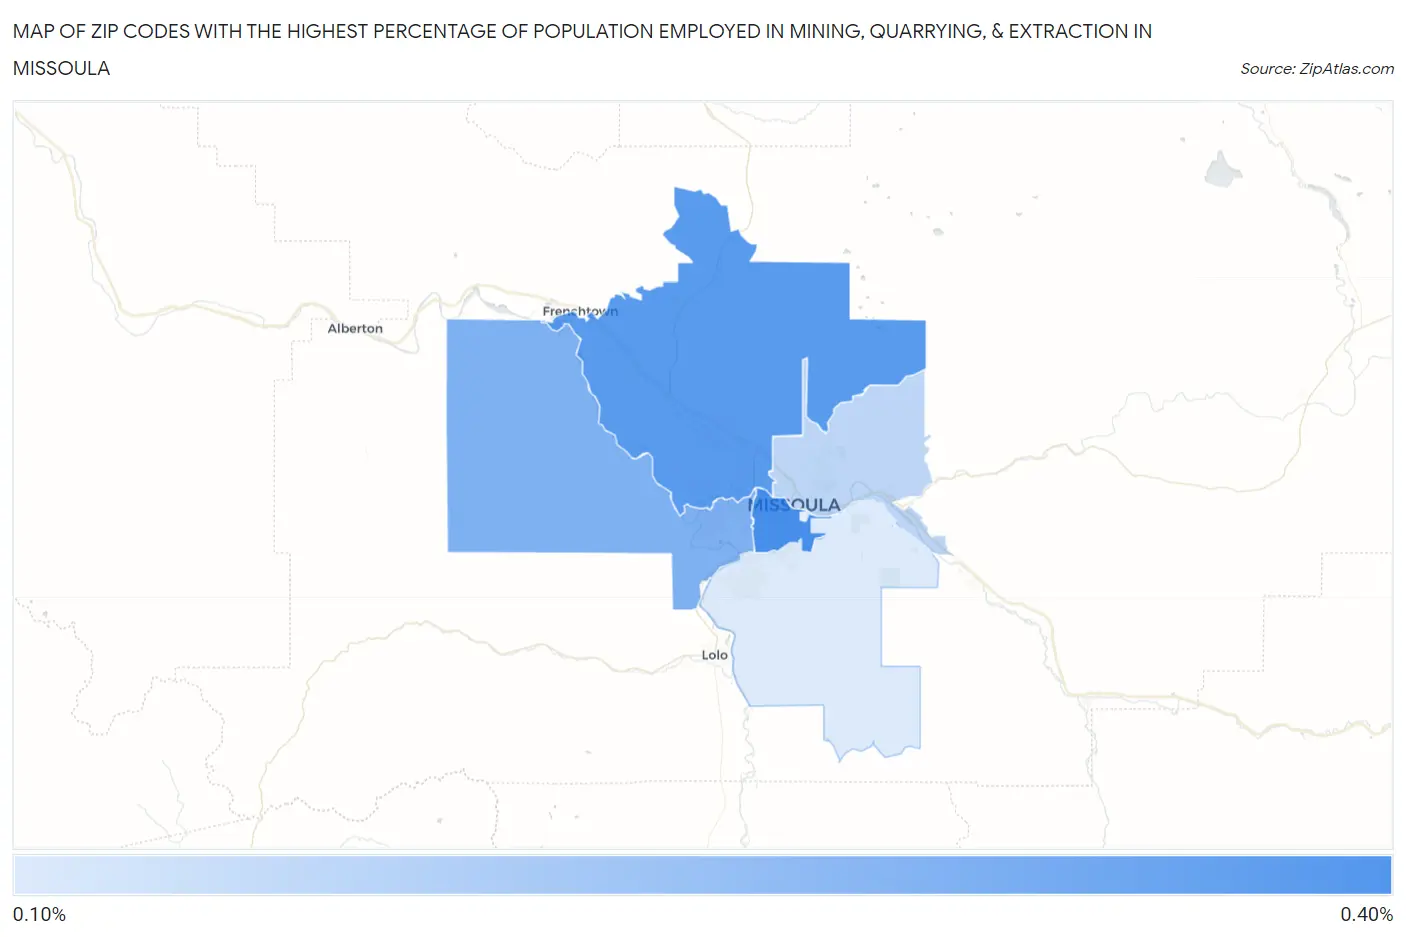
Map of Zip Codes with the Highest Percentage of Population Employed in Mining, Quarrying, & Extraction in Missoula
0.14%
0.37%
Zip Codes with the Highest Percentage of Population Employed in Mining, Quarrying, & Extraction in Missoula, MT
| Zip Code | % Employed | vs State | vs National | |
| 1. | 59801 | 0.37% | 1.4%(-1.00)#162 | 0.44%(-0.068)#7,967 |
| 2. | 59808 | 0.35% | 1.4%(-1.03)#164 | 0.44%(-0.092)#8,143 |
| 3. | 59804 | 0.29% | 1.4%(-1.09)#168 | 0.44%(-0.154)#8,627 |
| 4. | 59802 | 0.19% | 1.4%(-1.18)#173 | 0.44%(-0.249)#9,608 |
| 5. | 59803 | 0.14% | 1.4%(-1.23)#175 | 0.44%(-0.298)#10,206 |
1
Common Questions
What are the Top 5 Zip Codes with the Highest Percentage of Population Employed in Mining, Quarrying, & Extraction in Missoula, MT?
Top 5 Zip Codes with the Highest Percentage of Population Employed in Mining, Quarrying, & Extraction in Missoula, MT are:
What zip code has the Highest Percentage of Population Employed in Mining, Quarrying, & Extraction in Missoula, MT?
59801 has the Highest Percentage of Population Employed in Mining, Quarrying, & Extraction in Missoula, MT with 0.37%.
What is the Percentage of Population Employed in Mining, Quarrying, & Extraction in Missoula, MT?
Percentage of Population Employed in Mining, Quarrying, & Extraction in Missoula is 0.21%.
What is the Percentage of Population Employed in Mining, Quarrying, & Extraction in Montana?
Percentage of Population Employed in Mining, Quarrying, & Extraction in Montana is 1.4%.
What is the Percentage of Population Employed in Mining, Quarrying, & Extraction in the United States?
Percentage of Population Employed in Mining, Quarrying, & Extraction in the United States is 0.44%.