Zip Codes with the Highest Percentage of Population Employed in Food Preparation & Serving in Missoula, MT
RELATED REPORTS & OPTIONS
Food Preparation & Serving
Missoula
Compare Zip Codes
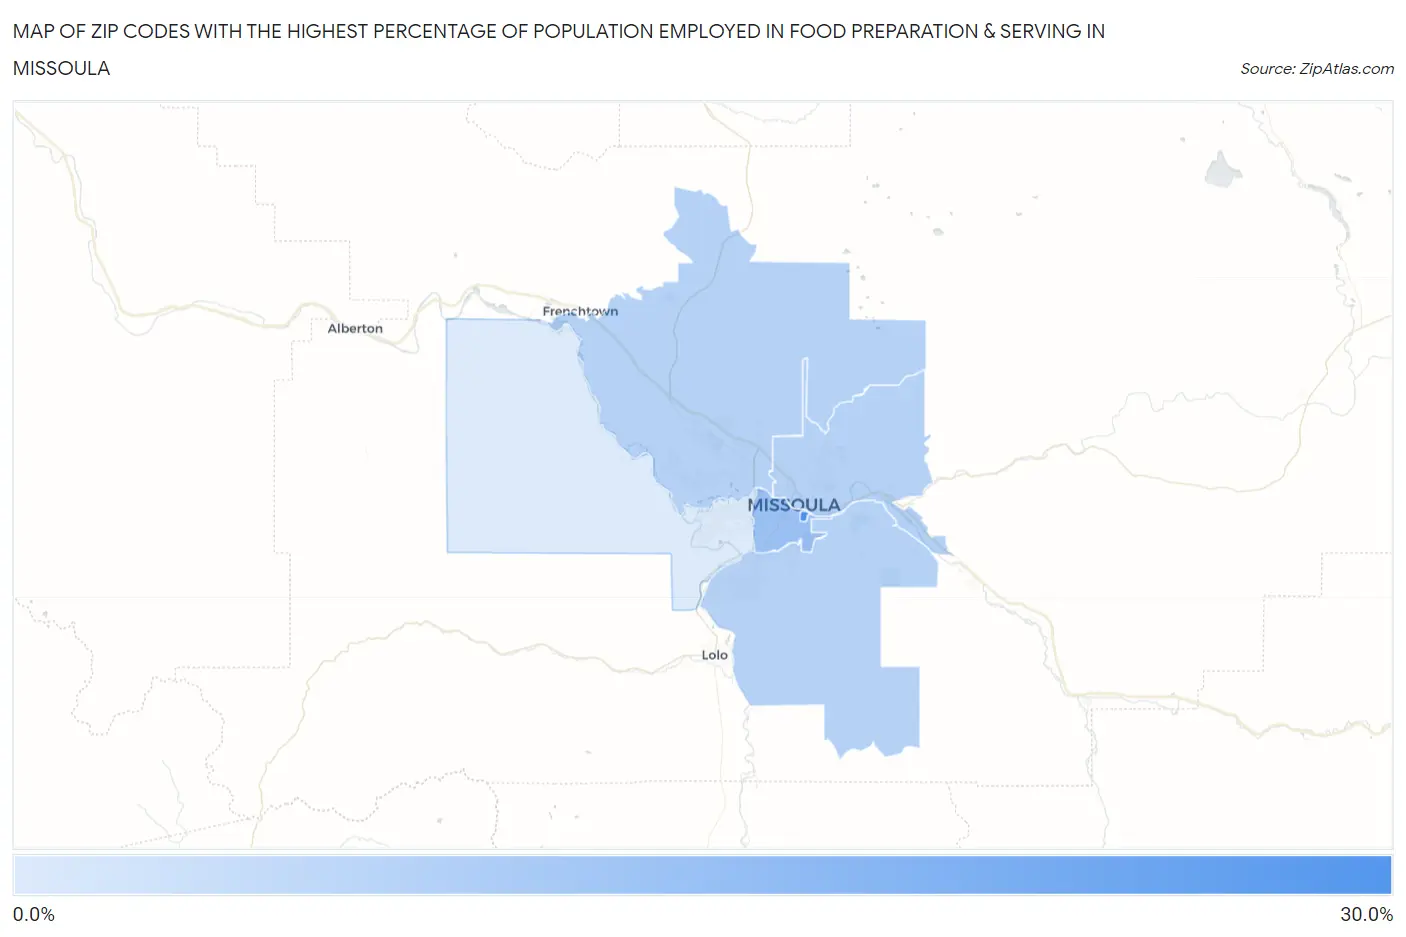
Map of Zip Codes with the Highest Percentage of Population Employed in Food Preparation & Serving in Missoula
3.5%
25.3%
Zip Codes with the Highest Percentage of Population Employed in Food Preparation & Serving in Missoula, MT
| Zip Code | % Employed | vs State | vs National | |
| 1. | 59812 | 25.3% | 6.7%(+18.6)#12 | 5.3%(+20.0)#304 |
| 2. | 59801 | 12.3% | 6.7%(+5.55)#40 | 5.3%(+6.98)#1,576 |
| 3. | 59808 | 9.0% | 6.7%(+2.27)#64 | 5.3%(+3.71)#3,537 |
| 4. | 59803 | 8.9% | 6.7%(+2.21)#66 | 5.3%(+3.65)#3,588 |
| 5. | 59802 | 8.9% | 6.7%(+2.16)#69 | 5.3%(+3.59)#3,638 |
| 6. | 59804 | 3.5% | 6.7%(-3.18)#201 | 5.3%(-1.74)#19,023 |
1
Common Questions
What are the Top 5 Zip Codes with the Highest Percentage of Population Employed in Food Preparation & Serving in Missoula, MT?
Top 5 Zip Codes with the Highest Percentage of Population Employed in Food Preparation & Serving in Missoula, MT are:
What zip code has the Highest Percentage of Population Employed in Food Preparation & Serving in Missoula, MT?
59812 has the Highest Percentage of Population Employed in Food Preparation & Serving in Missoula, MT with 25.3%.
What is the Percentage of Population Employed in Food Preparation & Serving in Missoula, MT?
Percentage of Population Employed in Food Preparation & Serving in Missoula is 10.6%.
What is the Percentage of Population Employed in Food Preparation & Serving in Montana?
Percentage of Population Employed in Food Preparation & Serving in Montana is 6.7%.
What is the Percentage of Population Employed in Food Preparation & Serving in the United States?
Percentage of Population Employed in Food Preparation & Serving in the United States is 5.3%.