Zip Codes with the Highest Percentage of Households with Income Above $100,000 in Missoula, MT
RELATED REPORTS & OPTIONS
Household Income | $100k+
Missoula
Compare Zip Codes
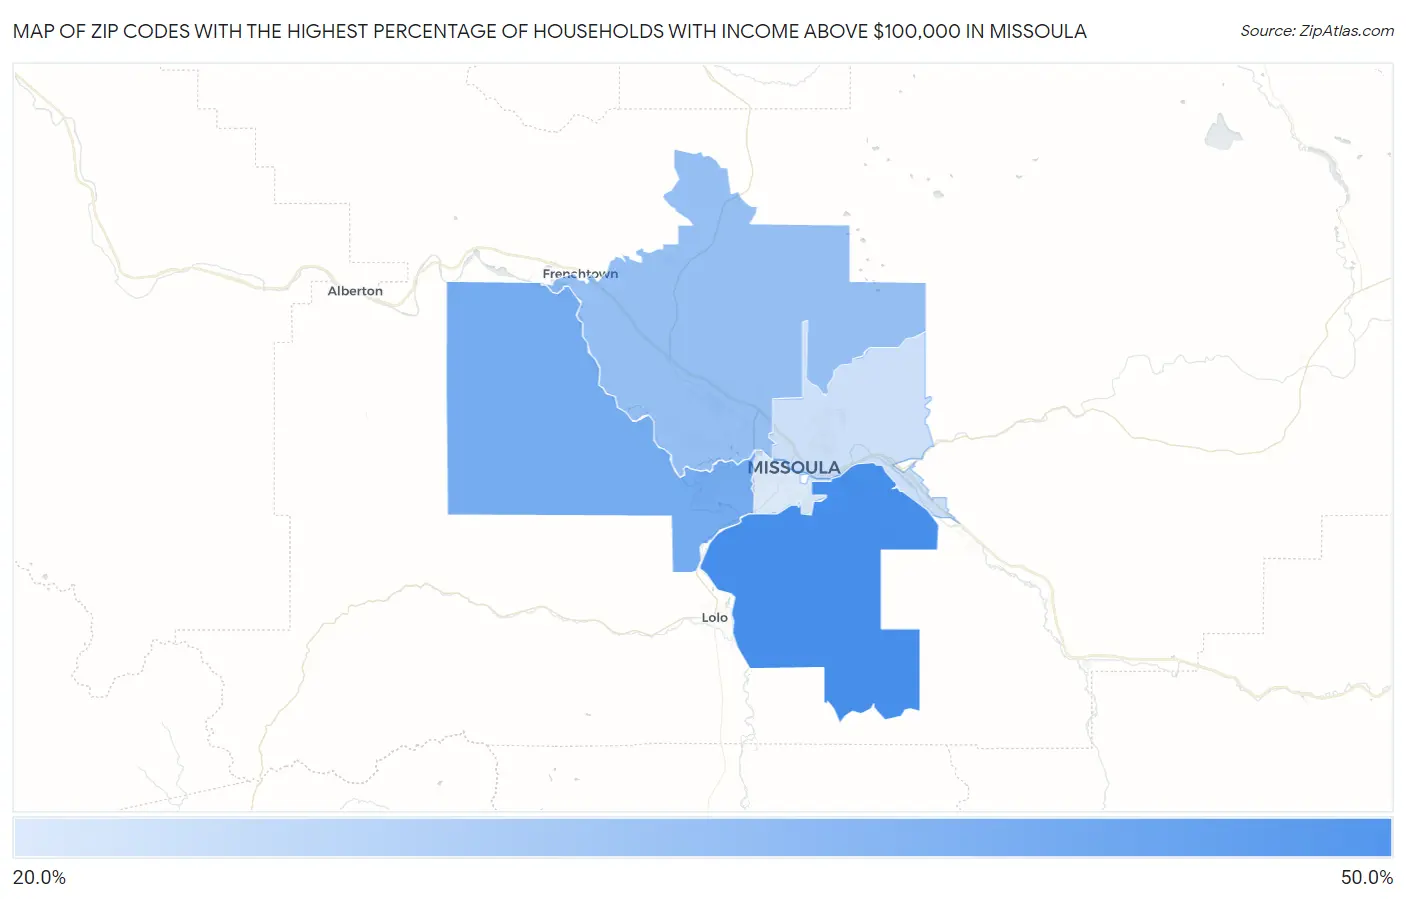
Map of Zip Codes with the Highest Percentage of Households with Income Above $100,000 in Missoula
21.2%
49.1%
Zip Codes with the Highest Percentage of Households with Income Above $100,000 in Missoula, MT
| Zip Code | Households with Income > $100k | vs State | vs National | |
| 1. | 59803 | 49.1% | 30.1%(+19.0)#19 | 37.3%(+11.8)#5,138 |
| 2. | 59804 | 39.8% | 30.1%(+9.70)#63 | 37.3%(+2.50)#9,026 |
| 3. | 59808 | 34.0% | 30.1%(+3.90)#96 | 37.3%(-3.30)#12,410 |
| 4. | 59802 | 23.8% | 30.1%(-6.30)#211 | 37.3%(-13.5)#20,825 |
| 5. | 59801 | 21.2% | 30.1%(-8.90)#236 | 37.3%(-16.1)#23,066 |
1
Common Questions
What are the Top 3 Zip Codes with the Highest Percentage of Households with Income Above $100,000 in Missoula, MT?
Top 3 Zip Codes with the Highest Percentage of Households with Income Above $100,000 in Missoula, MT are:
What zip code has the Highest Percentage of Households with Income Above $100,000 in Missoula, MT?
59803 has the Highest Percentage of Households with Income Above $100,000 in Missoula, MT with 49.1%.
What is the Percentage of Households with Income Above $100,000 in Missoula, MT?
Percentage of Households with Income Above $100,000 in Missoula is 27.0%.
What is the Percentage of Households with Income Above $100,000 in Montana?
Percentage of Households with Income Above $100,000 in Montana is 30.1%.
What is the Percentage of Households with Income Above $100,000 in the United States?
Percentage of Households with Income Above $100,000 in the United States is 37.3%.