Zip Codes with the Highest Percentage of Population Employed in Community & Social Service in Billings, MT
RELATED REPORTS & OPTIONS
Community & Social Service
Billings
Compare Zip Codes
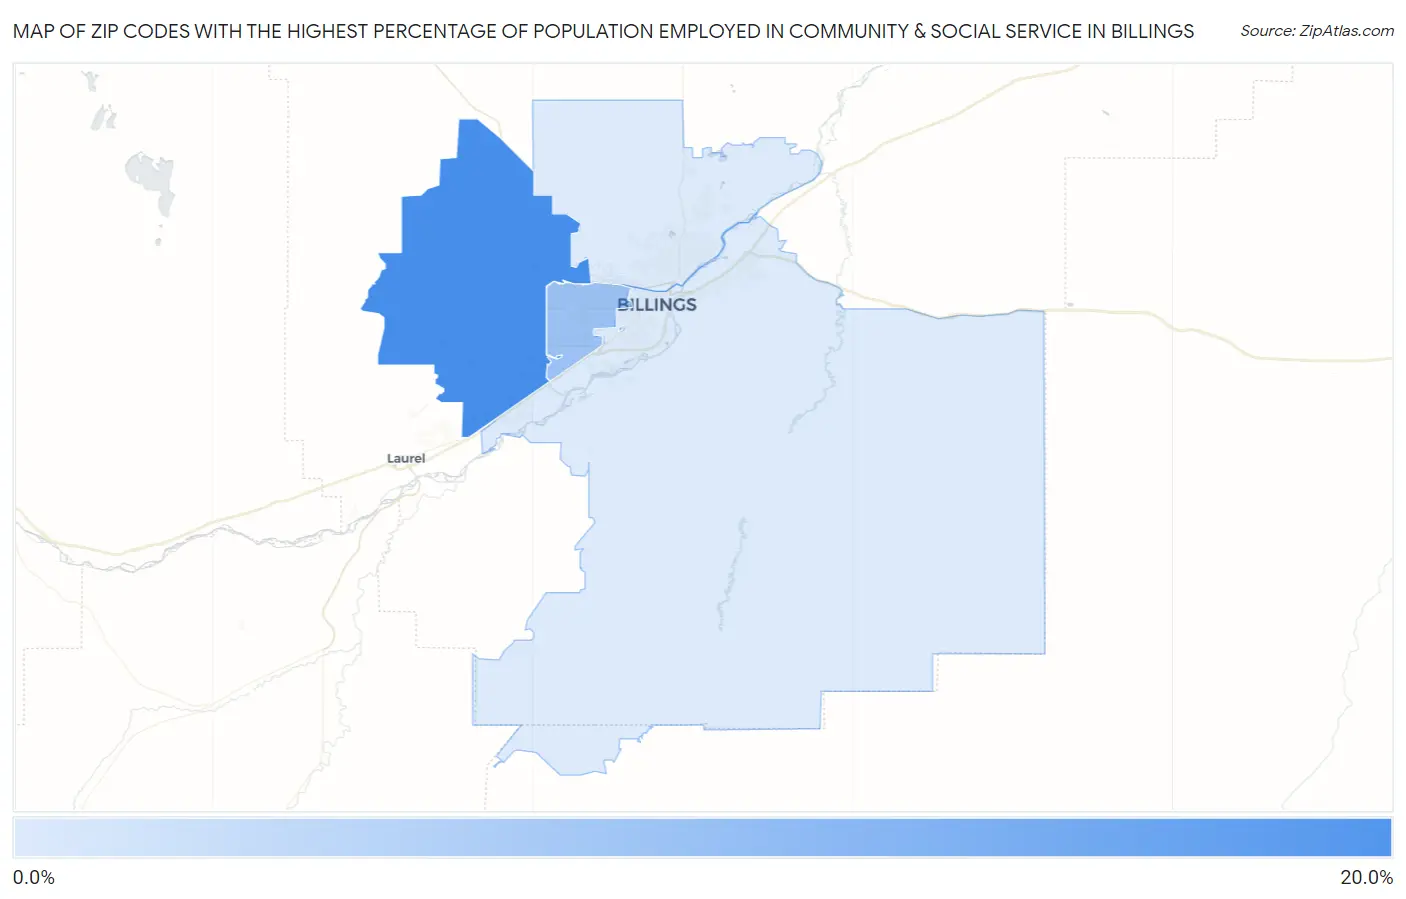
Map of Zip Codes with the Highest Percentage of Population Employed in Community & Social Service in Billings
9.4%
16.3%
Zip Codes with the Highest Percentage of Population Employed in Community & Social Service in Billings, MT
| Zip Code | % Employed | vs State | vs National | |
| 1. | 59106 | 16.3% | 10.6%(+5.75)#36 | 11.2%(+5.12)#3,819 |
| 2. | 59102 | 12.5% | 10.6%(+1.87)#90 | 11.2%(+1.24)#8,497 |
| 3. | 59105 | 9.4% | 10.6%(-1.17)#152 | 11.2%(-1.80)#15,653 |
| 4. | 59101 | 9.4% | 10.6%(-1.19)#154 | 11.2%(-1.83)#15,715 |
1
Common Questions
What are the Top 3 Zip Codes with the Highest Percentage of Population Employed in Community & Social Service in Billings, MT?
Top 3 Zip Codes with the Highest Percentage of Population Employed in Community & Social Service in Billings, MT are:
What zip code has the Highest Percentage of Population Employed in Community & Social Service in Billings, MT?
59106 has the Highest Percentage of Population Employed in Community & Social Service in Billings, MT with 16.3%.
What is the Percentage of Population Employed in Community & Social Service in Billings, MT?
Percentage of Population Employed in Community & Social Service in Billings is 11.6%.
What is the Percentage of Population Employed in Community & Social Service in Montana?
Percentage of Population Employed in Community & Social Service in Montana is 10.6%.
What is the Percentage of Population Employed in Community & Social Service in the United States?
Percentage of Population Employed in Community & Social Service in the United States is 11.2%.