Zip Codes with the Highest Percentage of Population Employed in Food Preparation & Serving in Billings, MT
RELATED REPORTS & OPTIONS
Food Preparation & Serving
Billings
Compare Zip Codes
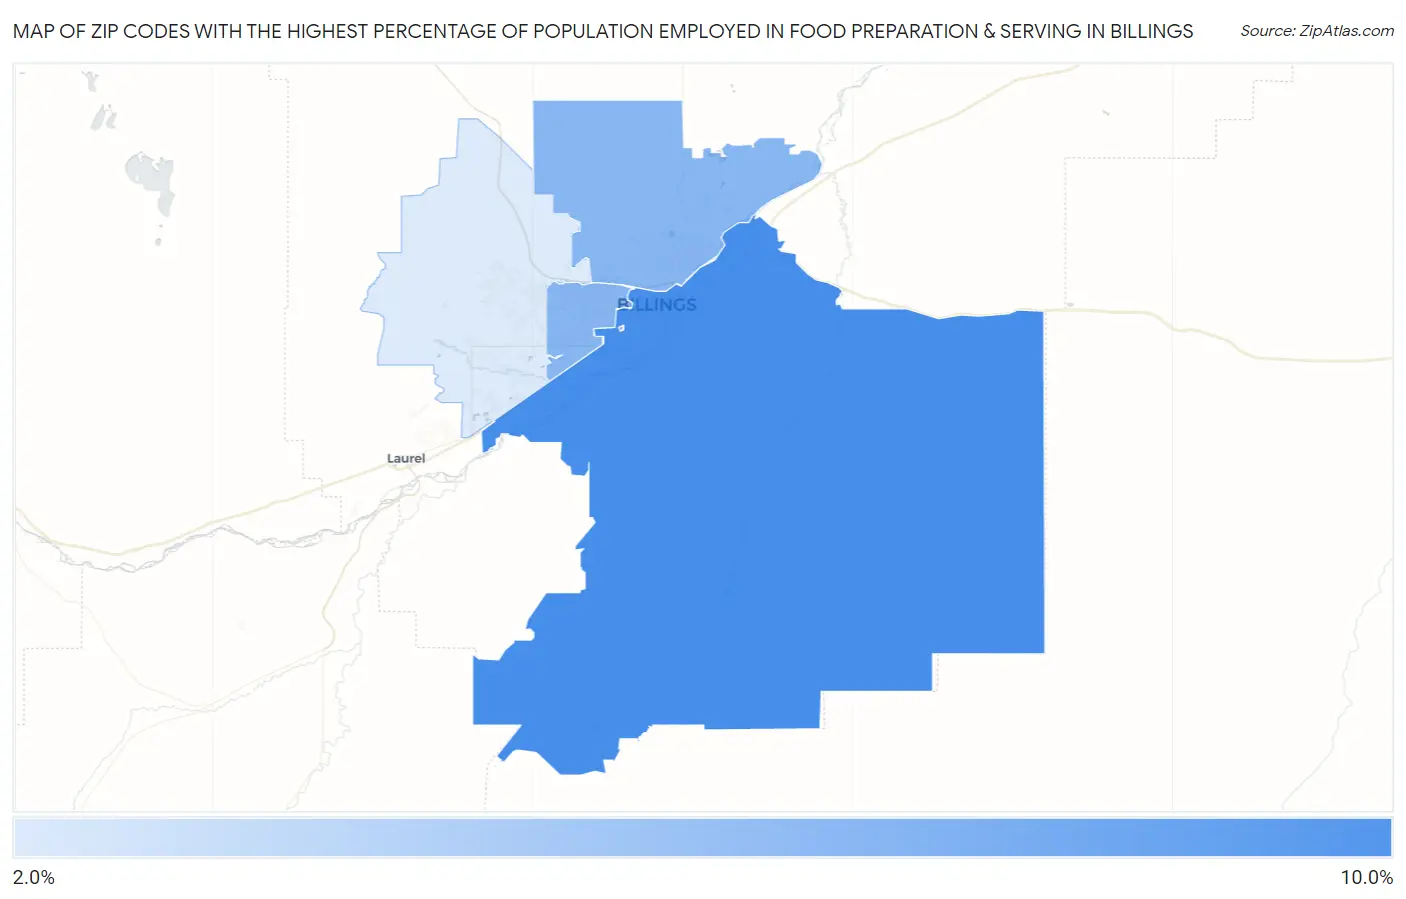
Map of Zip Codes with the Highest Percentage of Population Employed in Food Preparation & Serving in Billings
2.4%
9.8%
Zip Codes with the Highest Percentage of Population Employed in Food Preparation & Serving in Billings, MT
| Zip Code | % Employed | vs State | vs National | |
| 1. | 59101 | 9.8% | 6.7%(+3.12)#55 | 5.3%(+4.56)#2,758 |
| 2. | 59102 | 6.6% | 6.7%(-0.142)#119 | 5.3%(+1.29)#7,658 |
| 3. | 59105 | 6.5% | 6.7%(-0.179)#121 | 5.3%(+1.26)#7,759 |
| 4. | 59106 | 2.4% | 6.7%(-4.36)#237 | 5.3%(-2.93)#23,586 |
1
Common Questions
What are the Top 3 Zip Codes with the Highest Percentage of Population Employed in Food Preparation & Serving in Billings, MT?
Top 3 Zip Codes with the Highest Percentage of Population Employed in Food Preparation & Serving in Billings, MT are:
What zip code has the Highest Percentage of Population Employed in Food Preparation & Serving in Billings, MT?
59101 has the Highest Percentage of Population Employed in Food Preparation & Serving in Billings, MT with 9.8%.
What is the Percentage of Population Employed in Food Preparation & Serving in Billings, MT?
Percentage of Population Employed in Food Preparation & Serving in Billings is 6.7%.
What is the Percentage of Population Employed in Food Preparation & Serving in Montana?
Percentage of Population Employed in Food Preparation & Serving in Montana is 6.7%.
What is the Percentage of Population Employed in Food Preparation & Serving in the United States?
Percentage of Population Employed in Food Preparation & Serving in the United States is 5.3%.