Zip Codes with the Highest Percentage of Population Employed in Arts, Media & Entertainment in Billings, MT
RELATED REPORTS & OPTIONS
Arts, Media & Entertainment
Billings
Compare Zip Codes
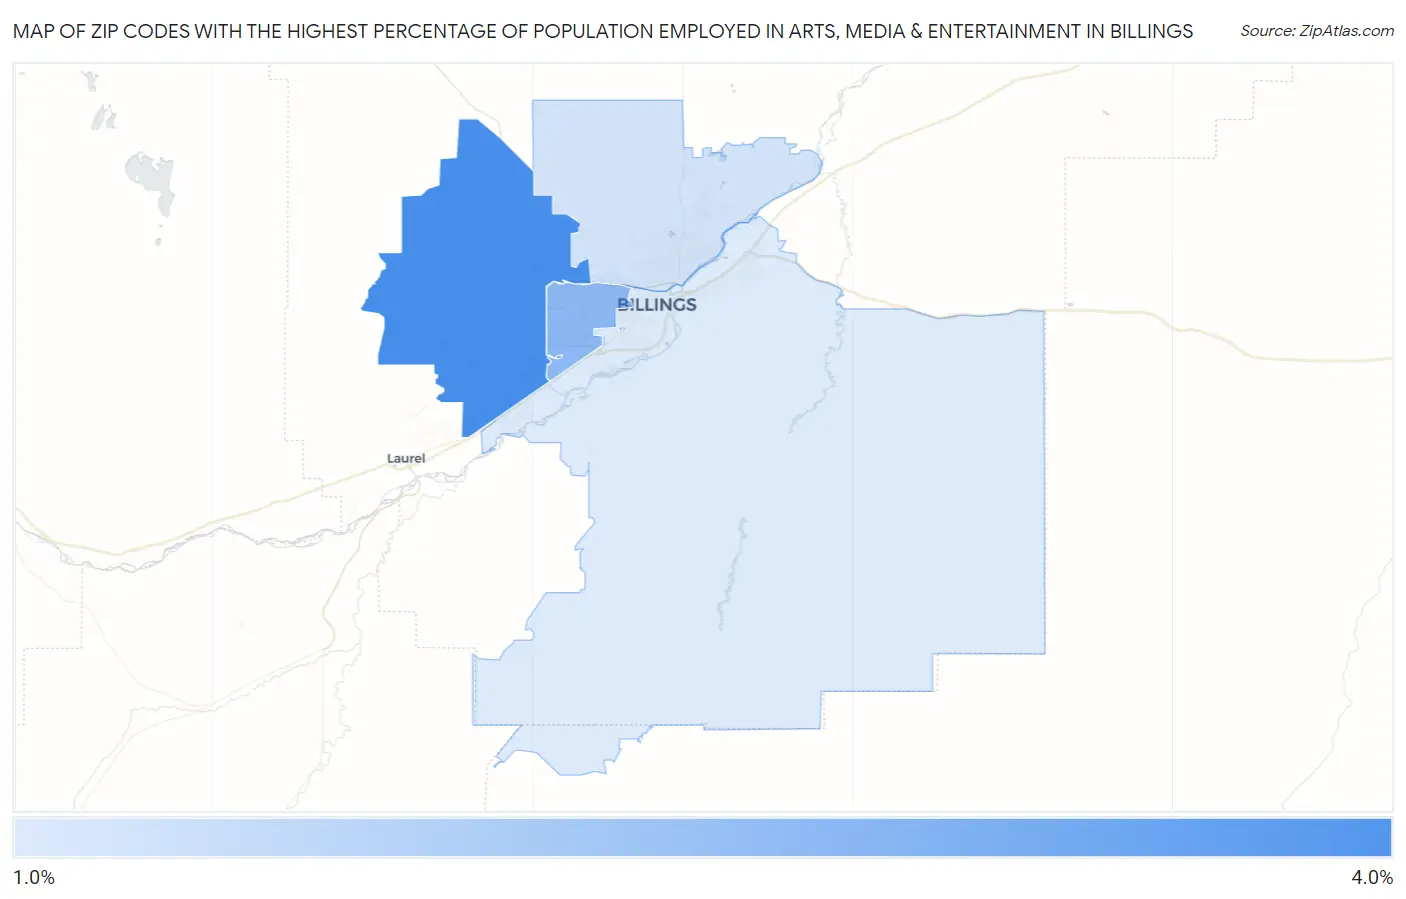
Map of Zip Codes with the Highest Percentage of Population Employed in Arts, Media & Entertainment in Billings
1.7%
3.1%
Zip Codes with the Highest Percentage of Population Employed in Arts, Media & Entertainment in Billings, MT
| Zip Code | % Employed | vs State | vs National | |
| 1. | 59106 | 3.1% | 2.0%(+1.18)#40 | 2.1%(+1.09)#3,745 |
| 2. | 59102 | 2.5% | 2.0%(+0.495)#58 | 2.1%(+0.401)#5,678 |
| 3. | 59105 | 1.8% | 2.0%(-0.179)#83 | 2.1%(-0.274)#9,048 |
| 4. | 59101 | 1.7% | 2.0%(-0.300)#92 | 2.1%(-0.394)#9,870 |
1
Common Questions
What are the Top 3 Zip Codes with the Highest Percentage of Population Employed in Arts, Media & Entertainment in Billings, MT?
Top 3 Zip Codes with the Highest Percentage of Population Employed in Arts, Media & Entertainment in Billings, MT are:
What zip code has the Highest Percentage of Population Employed in Arts, Media & Entertainment in Billings, MT?
59106 has the Highest Percentage of Population Employed in Arts, Media & Entertainment in Billings, MT with 3.1%.
What is the Percentage of Population Employed in Arts, Media & Entertainment in Billings, MT?
Percentage of Population Employed in Arts, Media & Entertainment in Billings is 2.2%.
What is the Percentage of Population Employed in Arts, Media & Entertainment in Montana?
Percentage of Population Employed in Arts, Media & Entertainment in Montana is 2.0%.
What is the Percentage of Population Employed in Arts, Media & Entertainment in the United States?
Percentage of Population Employed in Arts, Media & Entertainment in the United States is 2.1%.