Zip Codes with the Highest Percentage of Population Employed in Business & Financial in Billings, MT
RELATED REPORTS & OPTIONS
Business & Financial
Billings
Compare Zip Codes
Map of Zip Codes with the Highest Percentage of Population Employed in Business & Financial in Billings
4.5%
7.0%
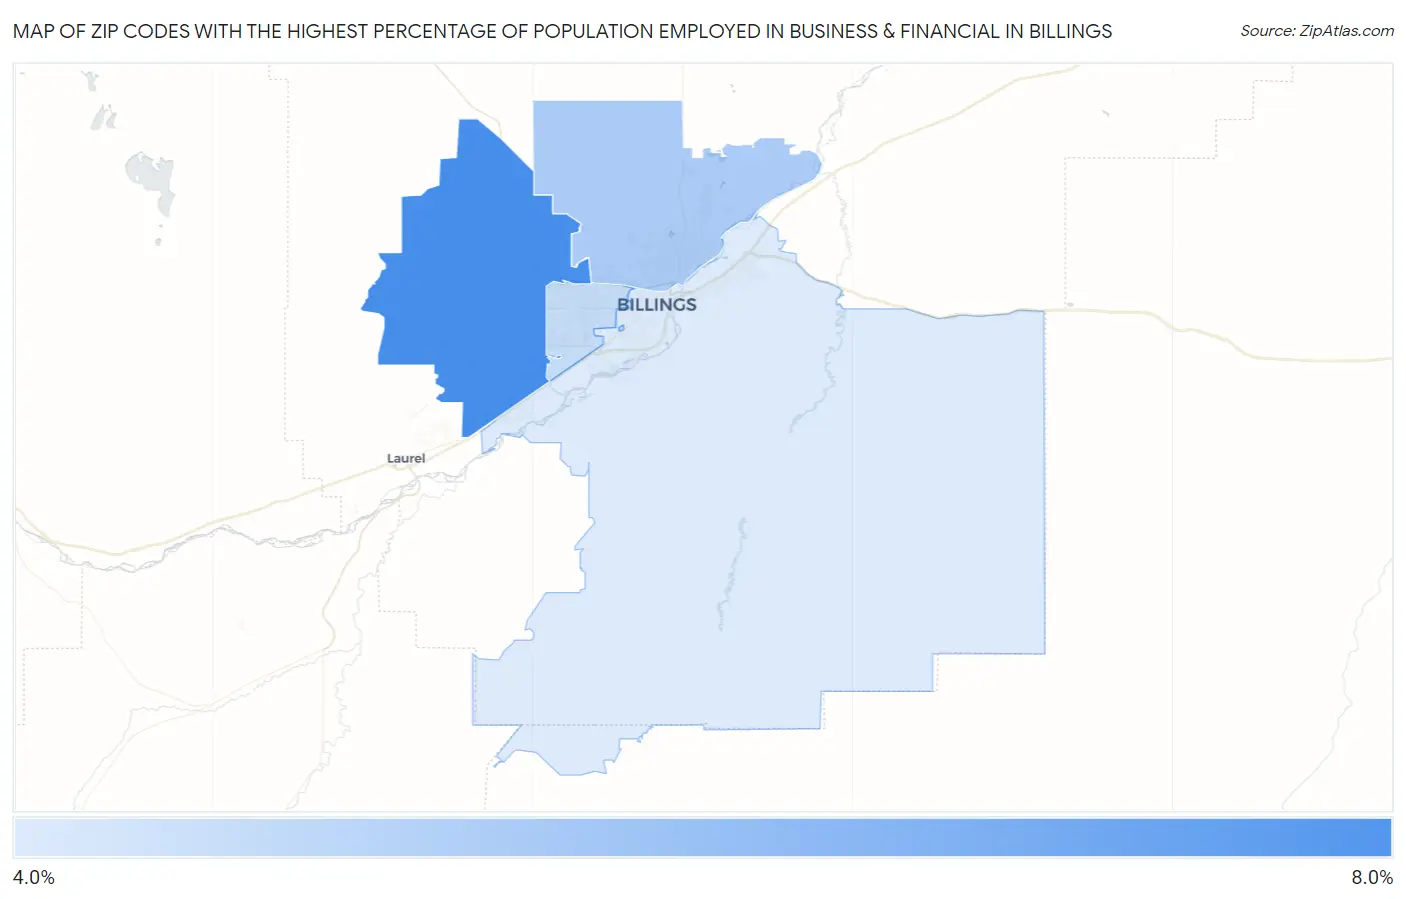
Zip Codes with the Highest Percentage of Population Employed in Business & Financial in Billings, MT
| Zip Code | % Employed | vs State | vs National | |
| 1. | 59106 | 7.0% | 4.2%(+2.83)#30 | 5.8%(+1.28)#5,746 |
| 2. | 59105 | 5.4% | 4.2%(+1.16)#53 | 5.8%(-0.395)#9,399 |
| 3. | 59102 | 4.9% | 4.2%(+0.667)#66 | 5.8%(-0.883)#10,811 |
| 4. | 59101 | 4.5% | 4.2%(+0.291)#77 | 5.8%(-1.26)#12,077 |
1
Common Questions
What are the Top 3 Zip Codes with the Highest Percentage of Population Employed in Business & Financial in Billings, MT?
Top 3 Zip Codes with the Highest Percentage of Population Employed in Business & Financial in Billings, MT are:
What zip code has the Highest Percentage of Population Employed in Business & Financial in Billings, MT?
59106 has the Highest Percentage of Population Employed in Business & Financial in Billings, MT with 7.0%.
What is the Percentage of Population Employed in Business & Financial in Billings, MT?
Percentage of Population Employed in Business & Financial in Billings is 5.4%.
What is the Percentage of Population Employed in Business & Financial in Montana?
Percentage of Population Employed in Business & Financial in Montana is 4.2%.
What is the Percentage of Population Employed in Business & Financial in the United States?
Percentage of Population Employed in Business & Financial in the United States is 5.8%.