Zip Codes with the Highest Percentage of Population with a Degree in Liberal Arts and History in New Bedford, MA
RELATED REPORTS & OPTIONS
Liberal Arts and History
New Bedford
Compare Zip Codes
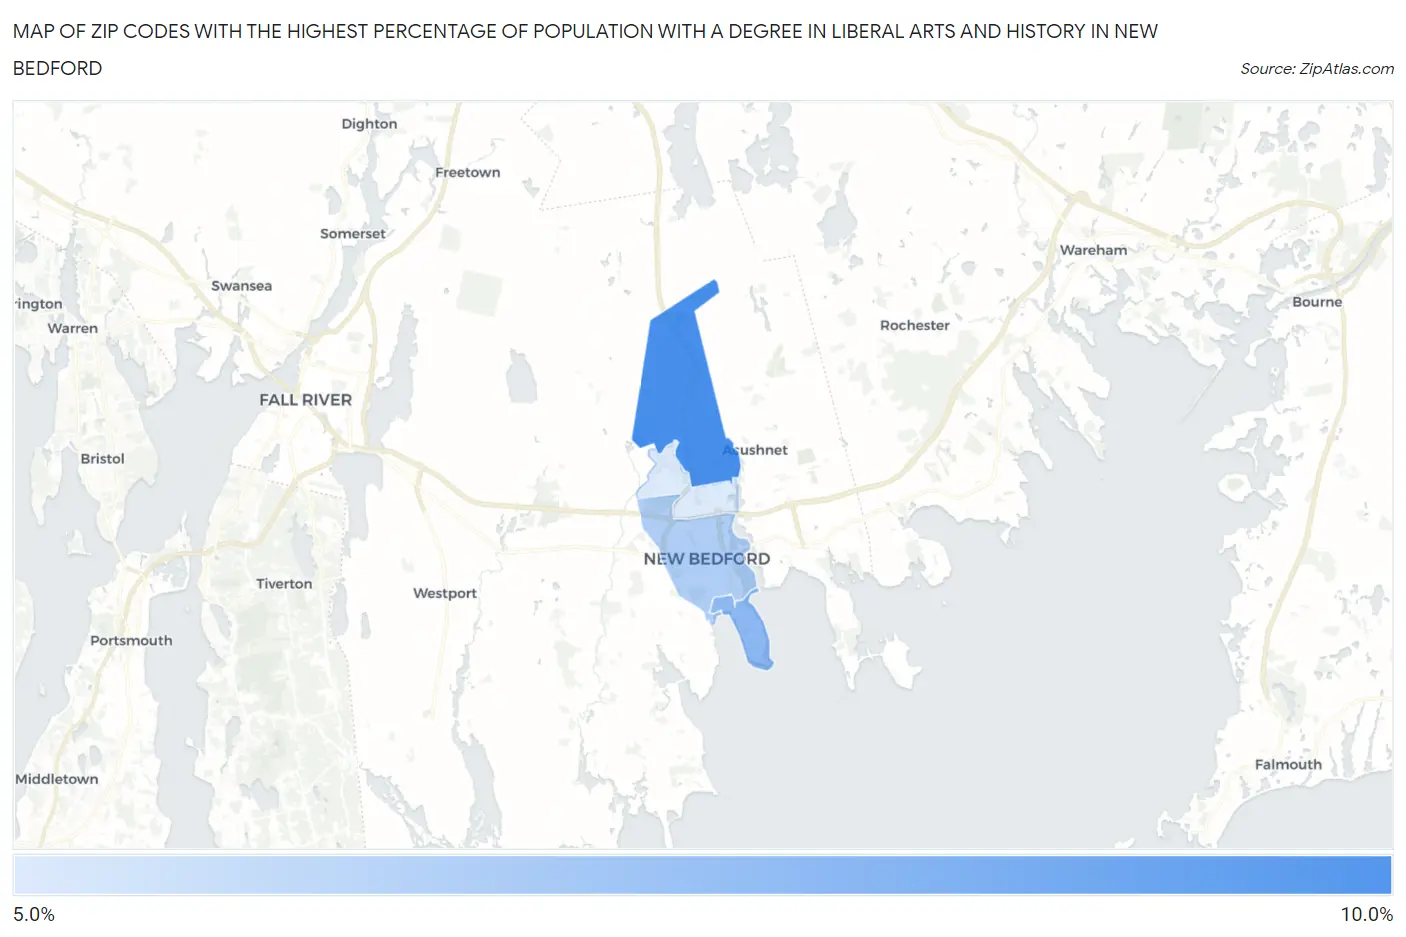
Map of Zip Codes with the Highest Percentage of Population with a Degree in Liberal Arts and History in New Bedford
5.1%
8.3%
Zip Codes with the Highest Percentage of Population with a Degree in Liberal Arts and History in New Bedford, MA
| Zip Code | % Graduates | vs State | vs National | |
| 1. | 02745 | 8.3% | 5.5%(+2.85)#89 | 4.9%(+3.46)#4,501 |
| 2. | 02744 | 6.9% | 5.5%(+1.38)#147 | 4.9%(+1.99)#6,617 |
| 3. | 02740 | 6.1% | 5.5%(+0.635)#185 | 4.9%(+1.24)#8,221 |
| 4. | 02746 | 5.1% | 5.5%(-0.360)#261 | 4.9%(+0.248)#10,975 |
1
Common Questions
What are the Top 3 Zip Codes with the Highest Percentage of Population with a Degree in Liberal Arts and History in New Bedford, MA?
Top 3 Zip Codes with the Highest Percentage of Population with a Degree in Liberal Arts and History in New Bedford, MA are:
What zip code has the Highest Percentage of Population with a Degree in Liberal Arts and History in New Bedford, MA?
02745 has the Highest Percentage of Population with a Degree in Liberal Arts and History in New Bedford, MA with 8.3%.
What is the Percentage of Population with a Degree in Liberal Arts and History in New Bedford, MA?
Percentage of Population with a Degree in Liberal Arts and History in New Bedford is 6.8%.
What is the Percentage of Population with a Degree in Liberal Arts and History in Massachusetts?
Percentage of Population with a Degree in Liberal Arts and History in Massachusetts is 5.5%.
What is the Percentage of Population with a Degree in Liberal Arts and History in the United States?
Percentage of Population with a Degree in Liberal Arts and History in the United States is 4.9%.