Zip Codes with the Highest Percentage of Households with Income Above $100,000 in New Bedford, MA
RELATED REPORTS & OPTIONS
Household Income | $100k+
New Bedford
Compare Zip Codes
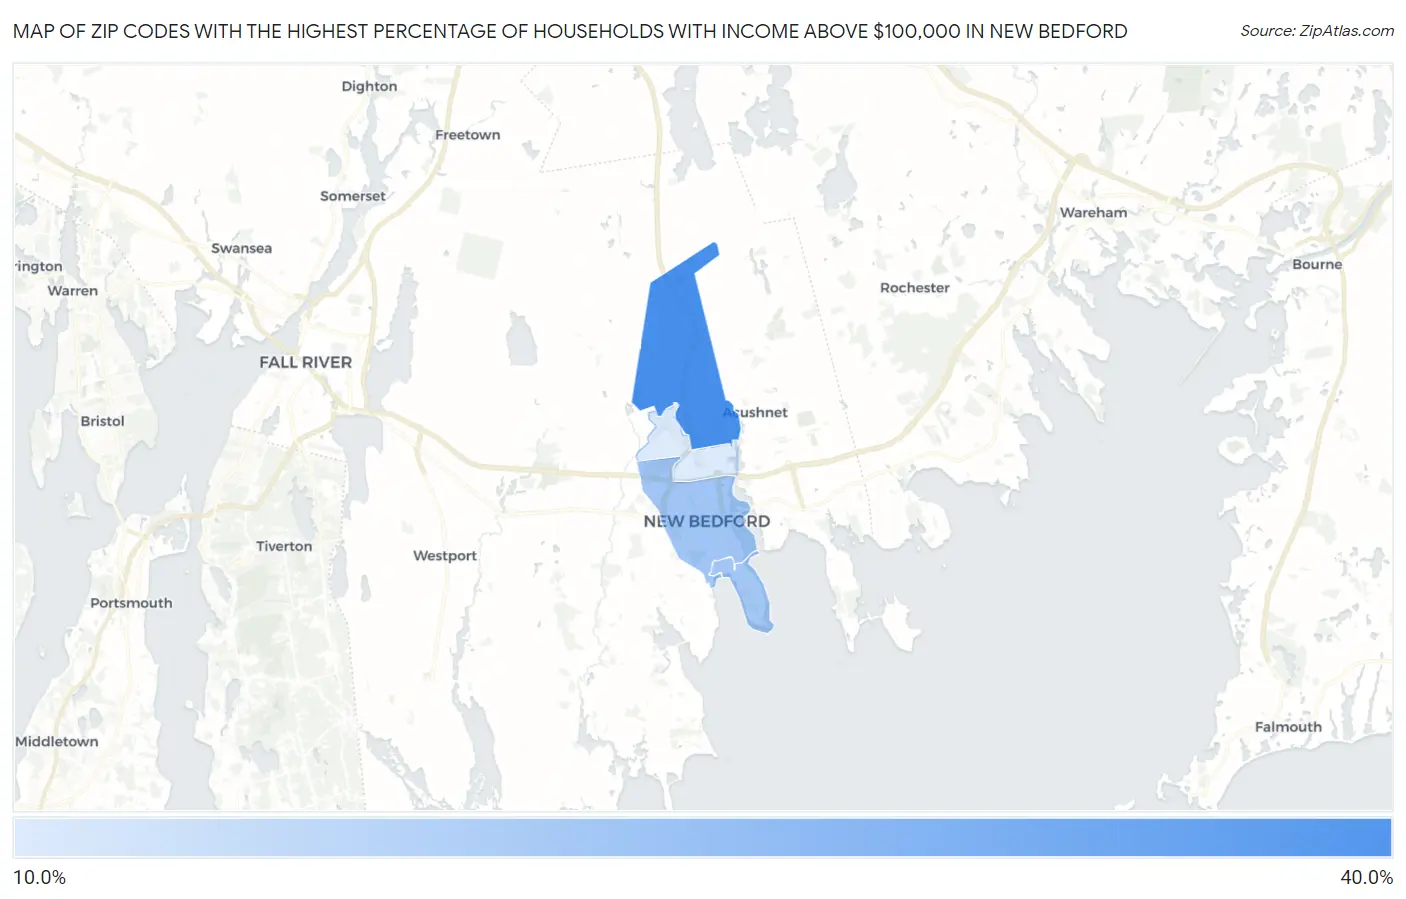
Map of Zip Codes with the Highest Percentage of Households with Income Above $100,000 in New Bedford
14.9%
35.1%
Zip Codes with the Highest Percentage of Households with Income Above $100,000 in New Bedford, MA
| Zip Code | Households with Income > $100k | vs State | vs National | |
| 1. | 02745 | 35.1% | 48.6%(-13.5)#426 | 37.3%(-2.20)#11,710 |
| 2. | 02740 | 22.7% | 48.6%(-25.9)#495 | 37.3%(-14.6)#21,793 |
| 3. | 02744 | 22.2% | 48.6%(-26.4)#498 | 37.3%(-15.1)#22,227 |
| 4. | 02746 | 14.9% | 48.6%(-33.7)#517 | 37.3%(-22.4)#27,607 |
1
Common Questions
What are the Top 3 Zip Codes with the Highest Percentage of Households with Income Above $100,000 in New Bedford, MA?
Top 3 Zip Codes with the Highest Percentage of Households with Income Above $100,000 in New Bedford, MA are:
What zip code has the Highest Percentage of Households with Income Above $100,000 in New Bedford, MA?
02745 has the Highest Percentage of Households with Income Above $100,000 in New Bedford, MA with 35.1%.
What is the Percentage of Households with Income Above $100,000 in New Bedford, MA?
Percentage of Households with Income Above $100,000 in New Bedford is 24.5%.
What is the Percentage of Households with Income Above $100,000 in Massachusetts?
Percentage of Households with Income Above $100,000 in Massachusetts is 48.6%.
What is the Percentage of Households with Income Above $100,000 in the United States?
Percentage of Households with Income Above $100,000 in the United States is 37.3%.