Cities with the Highest Percentage of Thai Population in Kentucky
RELATED REPORTS & OPTIONS
Thai
Kentucky
Compare Cities
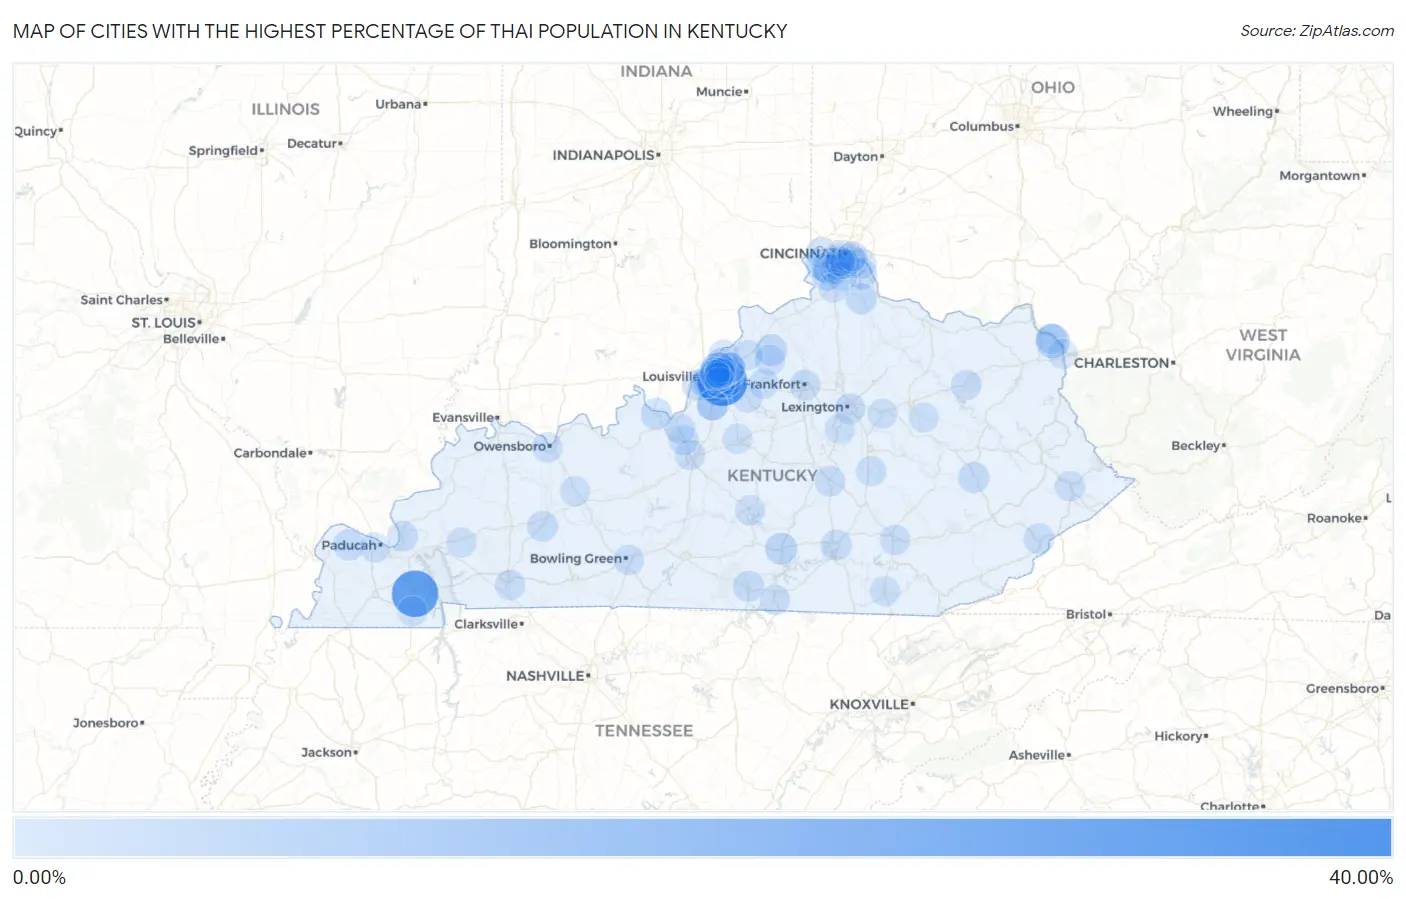
Map of Cities with the Highest Percentage of Thai Population in Kentucky
0.00%
40.00%
Cities with the Highest Percentage of Thai Population in Kentucky
| City | Thai | vs State | vs National | |
| 1. | Hurstbourne Acres | 36.22% | 0.44%(+35.8)#1 | 1.44%(+34.8)#18 |
| 2. | Dexter | 30.30% | 0.44%(+29.9)#2 | 1.44%(+28.9)#29 |
| 3. | Hurstbourne | 18.72% | 0.44%(+18.3)#3 | 1.44%(+17.3)#77 |
| 4. | Hills And Dales | 8.59% | 0.44%(+8.15)#4 | 1.44%(+7.16)#286 |
| 5. | St. Joseph | 7.00% | 0.44%(+6.56)#5 | 1.44%(+5.56)#390 |
| 6. | Bellefonte | 6.99% | 0.44%(+6.55)#6 | 1.44%(+5.55)#392 |
| 7. | West Buechel | 5.58% | 0.44%(+5.14)#7 | 1.44%(+4.14)#536 |
| 8. | Creekside | 4.95% | 0.44%(+4.50)#8 | 1.44%(+3.51)#622 |
| 9. | Wildwood | 3.78% | 0.44%(+3.34)#9 | 1.44%(+2.34)#917 |
| 10. | Middletown | 3.74% | 0.44%(+3.30)#10 | 1.44%(+2.30)#928 |
| 11. | Russell Springs | 3.46% | 0.44%(+3.02)#11 | 1.44%(+2.03)#1,008 |
| 12. | New Castle | 2.84% | 0.44%(+2.40)#12 | 1.44%(+1.40)#1,287 |
| 13. | Brandenburg | 2.80% | 0.44%(+2.36)#13 | 1.44%(+1.36)#1,309 |
| 14. | Alexandria | 2.65% | 0.44%(+2.21)#14 | 1.44%(+1.22)#1,383 |
| 15. | Old Brownsboro Place | 2.60% | 0.44%(+2.16)#15 | 1.44%(+1.17)#1,418 |
| 16. | Hillview | 2.60% | 0.44%(+2.16)#16 | 1.44%(+1.17)#1,419 |
| 17. | Jeffersontown | 2.38% | 0.44%(+1.93)#17 | 1.44%(+0.938)#1,539 |
| 18. | Parkway Village | 2.25% | 0.44%(+1.81)#18 | 1.44%(+0.813)#1,631 |
| 19. | Glenview | 2.09% | 0.44%(+1.65)#19 | 1.44%(+0.653)#1,722 |
| 20. | Northfield | 2.08% | 0.44%(+1.64)#20 | 1.44%(+0.642)#1,731 |
| 21. | Kevil | 2.05% | 0.44%(+1.61)#21 | 1.44%(+0.613)#1,756 |
| 22. | Butler | 1.99% | 0.44%(+1.55)#22 | 1.44%(+0.552)#1,807 |
| 23. | Worthington Hills | 1.96% | 0.44%(+1.52)#23 | 1.44%(+0.521)#1,836 |
| 24. | Burlington | 1.93% | 0.44%(+1.49)#24 | 1.44%(+0.495)#1,852 |
| 25. | Jackson | 1.79% | 0.44%(+1.35)#25 | 1.44%(+0.356)#2,001 |
| 26. | Seneca Gardens | 1.75% | 0.44%(+1.31)#26 | 1.44%(+0.317)#2,037 |
| 27. | Highland Heights | 1.74% | 0.44%(+1.30)#27 | 1.44%(+0.299)#2,061 |
| 28. | Union | 1.70% | 0.44%(+1.26)#28 | 1.44%(+0.259)#2,105 |
| 29. | Hickory Hill | 1.68% | 0.44%(+1.24)#29 | 1.44%(+0.243)#2,118 |
| 30. | Greenville | 1.55% | 0.44%(+1.11)#30 | 1.44%(+0.109)#2,271 |
| 31. | Somerset | 1.52% | 0.44%(+1.08)#31 | 1.44%(+0.079)#2,308 |
| 32. | Smithland | 1.46% | 0.44%(+1.02)#32 | 1.44%(+0.022)#2,378 |
| 33. | Anchorage | 1.45% | 0.44%(+1.01)#33 | 1.44%(+0.009)#2,394 |
| 34. | Brownsboro Farm | 1.45% | 0.44%(+1.01)#34 | 1.44%(+0.009)#2,395 |
| 35. | Frankfort | 1.42% | 0.44%(+0.979)#35 | 1.44%(-0.018)#2,444 |
| 36. | Burkesville | 1.41% | 0.44%(+0.965)#36 | 1.44%(-0.032)#2,464 |
| 37. | Florence | 1.39% | 0.44%(+0.954)#37 | 1.44%(-0.043)#2,485 |
| 38. | Crescent Springs | 1.36% | 0.44%(+0.916)#38 | 1.44%(-0.081)#2,533 |
| 39. | Beechwood Village | 1.31% | 0.44%(+0.865)#39 | 1.44%(-0.132)#2,602 |
| 40. | Riverwood | 1.20% | 0.44%(+0.757)#40 | 1.44%(-0.240)#2,776 |
| 41. | Fincastle | 1.19% | 0.44%(+0.750)#41 | 1.44%(-0.247)#2,792 |
| 42. | Francisville | 1.14% | 0.44%(+0.694)#42 | 1.44%(-0.302)#2,889 |
| 43. | Whitesburg | 1.11% | 0.44%(+0.674)#43 | 1.44%(-0.323)#2,931 |
| 44. | Lexington | 1.11% | 0.44%(+0.669)#44 | 1.44%(-0.328)#2,939 |
| 45. | Prospect | 1.08% | 0.44%(+0.641)#45 | 1.44%(-0.356)#2,998 |
| 46. | Stanford | 1.07% | 0.44%(+0.627)#46 | 1.44%(-0.370)#3,031 |
| 47. | Goshen | 0.96% | 0.44%(+0.524)#47 | 1.44%(-0.473)#3,246 |
| 48. | Crestview Hills | 0.93% | 0.44%(+0.493)#48 | 1.44%(-0.503)#3,310 |
| 49. | Spring Valley | 0.93% | 0.44%(+0.491)#49 | 1.44%(-0.506)#3,314 |
| 50. | Russell | 0.89% | 0.44%(+0.450)#50 | 1.44%(-0.547)#3,401 |
| 51. | Eminence | 0.89% | 0.44%(+0.447)#51 | 1.44%(-0.550)#3,409 |
| 52. | Hopkinsville | 0.80% | 0.44%(+0.361)#52 | 1.44%(-0.635)#3,603 |
| 53. | Louisville | 0.74% | 0.44%(+0.302)#53 | 1.44%(-0.694)#3,773 |
| 54. | Oakbrook | 0.74% | 0.44%(+0.296)#54 | 1.44%(-0.701)#3,791 |
| 55. | London | 0.74% | 0.44%(+0.295)#55 | 1.44%(-0.702)#3,794 |
| 56. | Pikeville | 0.73% | 0.44%(+0.286)#56 | 1.44%(-0.710)#3,825 |
| 57. | Shively | 0.72% | 0.44%(+0.284)#57 | 1.44%(-0.713)#3,838 |
| 58. | Bowling Green | 0.68% | 0.44%(+0.239)#58 | 1.44%(-0.758)#3,964 |
| 59. | Plantation | 0.67% | 0.44%(+0.233)#59 | 1.44%(-0.763)#3,979 |
| 60. | Elizabethtown | 0.67% | 0.44%(+0.224)#60 | 1.44%(-0.772)#4,011 |
| 61. | Elsmere | 0.66% | 0.44%(+0.217)#61 | 1.44%(-0.780)#4,035 |
| 62. | Coldstream | 0.66% | 0.44%(+0.214)#62 | 1.44%(-0.782)#4,045 |
| 63. | Langdon Place | 0.64% | 0.44%(+0.202)#63 | 1.44%(-0.794)#4,089 |
| 64. | Morehead | 0.64% | 0.44%(+0.202)#64 | 1.44%(-0.795)#4,091 |
| 65. | Indian Hills | 0.62% | 0.44%(+0.182)#65 | 1.44%(-0.815)#4,162 |
| 66. | Albany | 0.57% | 0.44%(+0.133)#66 | 1.44%(-0.863)#4,337 |
| 67. | Radcliff | 0.57% | 0.44%(+0.129)#67 | 1.44%(-0.867)#4,352 |
| 68. | Pioneer Village | 0.56% | 0.44%(+0.118)#68 | 1.44%(-0.879)#4,385 |
| 69. | Owensboro | 0.55% | 0.44%(+0.111)#69 | 1.44%(-0.886)#4,418 |
| 70. | Green Spring | 0.52% | 0.44%(+0.077)#70 | 1.44%(-0.919)#4,517 |
| 71. | Shelbyville | 0.51% | 0.44%(+0.070)#71 | 1.44%(-0.927)#4,553 |
| 72. | Fort Knox | 0.49% | 0.44%(+0.045)#72 | 1.44%(-0.952)#4,647 |
| 73. | Elk Creek | 0.44% | 0.44%(-0.005)#73 | 1.44%(-1.00)#4,818 |
| 74. | Campbellsville | 0.41% | 0.44%(-0.030)#74 | 1.44%(-1.03)#4,943 |
| 75. | La Grange | 0.41% | 0.44%(-0.034)#75 | 1.44%(-1.03)#4,961 |
| 76. | Bancroft | 0.40% | 0.44%(-0.040)#76 | 1.44%(-1.04)#4,991 |
| 77. | Houston Acres | 0.40% | 0.44%(-0.041)#77 | 1.44%(-1.04)#4,997 |
| 78. | St Matthews | 0.39% | 0.44%(-0.047)#78 | 1.44%(-1.04)#5,029 |
| 79. | Catlettsburg | 0.39% | 0.44%(-0.048)#79 | 1.44%(-1.04)#5,035 |
| 80. | Graymoor Devondale | 0.39% | 0.44%(-0.054)#80 | 1.44%(-1.05)#5,069 |
| 81. | Erlanger | 0.38% | 0.44%(-0.058)#81 | 1.44%(-1.05)#5,091 |
| 82. | Hartford | 0.37% | 0.44%(-0.066)#82 | 1.44%(-1.06)#5,135 |
| 83. | Melbourne | 0.37% | 0.44%(-0.075)#83 | 1.44%(-1.07)#5,174 |
| 84. | Winchester | 0.35% | 0.44%(-0.090)#84 | 1.44%(-1.09)#5,239 |
| 85. | Independence | 0.35% | 0.44%(-0.093)#85 | 1.44%(-1.09)#5,250 |
| 86. | Paducah | 0.32% | 0.44%(-0.117)#86 | 1.44%(-1.11)#5,364 |
| 87. | Brownsboro Village | 0.31% | 0.44%(-0.134)#87 | 1.44%(-1.13)#5,440 |
| 88. | Murray | 0.30% | 0.44%(-0.136)#88 | 1.44%(-1.13)#5,457 |
| 89. | Princeton | 0.27% | 0.44%(-0.169)#89 | 1.44%(-1.17)#5,618 |
| 90. | Berea | 0.25% | 0.44%(-0.194)#90 | 1.44%(-1.19)#5,752 |
| 91. | Ludlow | 0.23% | 0.44%(-0.213)#91 | 1.44%(-1.21)#5,861 |
| 92. | Southgate | 0.22% | 0.44%(-0.223)#92 | 1.44%(-1.22)#5,922 |
| 93. | Fort Thomas | 0.20% | 0.44%(-0.239)#93 | 1.44%(-1.24)#6,024 |
| 94. | Walton | 0.20% | 0.44%(-0.240)#94 | 1.44%(-1.24)#6,032 |
| 95. | Nicholasville | 0.18% | 0.44%(-0.256)#95 | 1.44%(-1.25)#6,126 |
| 96. | Jeffersonville | 0.16% | 0.44%(-0.277)#96 | 1.44%(-1.27)#6,254 |
| 97. | Covington | 0.15% | 0.44%(-0.289)#97 | 1.44%(-1.29)#6,340 |
| 98. | Williamsburg | 0.13% | 0.44%(-0.307)#98 | 1.44%(-1.30)#6,444 |
| 99. | Bardstown | 0.13% | 0.44%(-0.308)#99 | 1.44%(-1.30)#6,449 |
| 100. | Fort Mitchell | 0.13% | 0.44%(-0.314)#100 | 1.44%(-1.31)#6,488 |
Common Questions
What are the Top 10 Cities with the Highest Percentage of Thai Population in Kentucky?
Top 10 Cities with the Highest Percentage of Thai Population in Kentucky are:
#1
36.22%
#2
30.30%
#3
18.72%
#4
8.59%
#5
6.99%
#6
5.58%
#7
4.95%
#8
3.78%
#9
3.74%
#10
3.46%
What city has the Highest Percentage of Thai Population in Kentucky?
Hurstbourne Acres has the Highest Percentage of Thai Population in Kentucky with 36.22%.
What is the Percentage of Thai Population in the State of Kentucky?
Percentage of Thai Population in Kentucky is 0.44%.
What is the Percentage of Thai Population in the United States?
Percentage of Thai Population in the United States is 1.44%.