Zip Codes with the Highest Percentage of Households with Income Above $200,000 in London, KY
RELATED REPORTS & OPTIONS
Household Income | $200k+
London
Compare Zip Codes
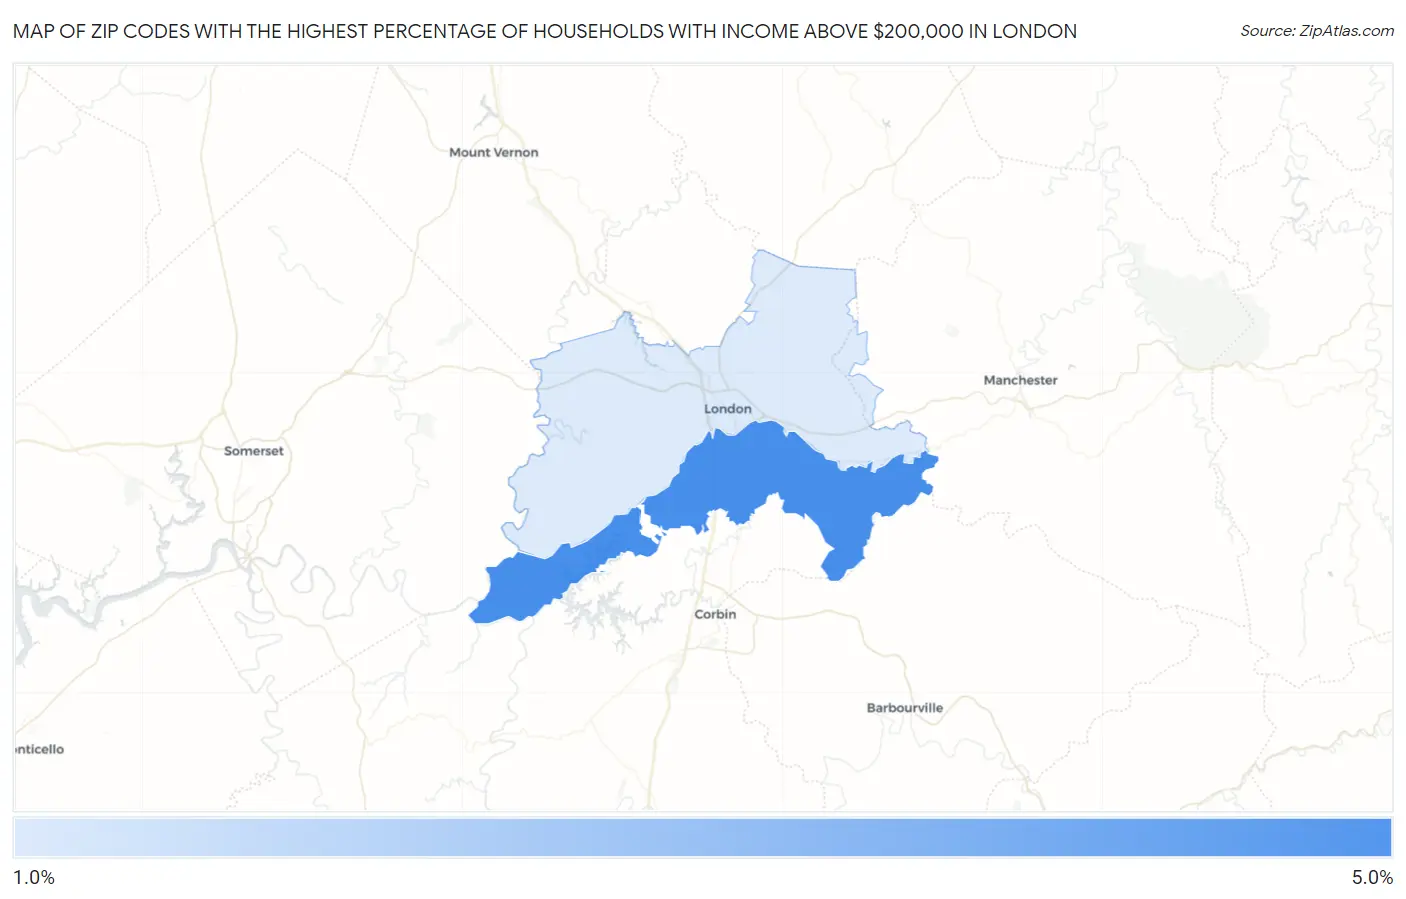
Map of Zip Codes with the Highest Percentage of Households with Income Above $200,000 in London
1.3%
4.1%
Zip Codes with the Highest Percentage of Households with Income Above $200,000 in London, KY
| Zip Code | Households with Income > $200k | vs State | vs National | |
| 1. | 40744 | 4.1% | 6.0%(-1.90)#216 | 11.4%(-7.30)#17,853 |
| 2. | 40741 | 1.3% | 6.0%(-4.70)#419 | 11.4%(-10.1)#25,529 |
1
Common Questions
What are the Top Zip Codes with the Highest Percentage of Households with Income Above $200,000 in London, KY?
Top Zip Codes with the Highest Percentage of Households with Income Above $200,000 in London, KY are:
What zip code has the Highest Percentage of Households with Income Above $200,000 in London, KY?
40744 has the Highest Percentage of Households with Income Above $200,000 in London, KY with 4.1%.
What is the Percentage of Households with Income Above $200,000 in London, KY?
Percentage of Households with Income Above $200,000 in London is 0.90%.
What is the Percentage of Households with Income Above $200,000 in Kentucky?
Percentage of Households with Income Above $200,000 in Kentucky is 6.0%.
What is the Percentage of Households with Income Above $200,000 in the United States?
Percentage of Households with Income Above $200,000 in the United States is 11.4%.