Crestwood, KY Map & Demographics
Crestwood Map
Crestwood Overview
$50,642
PER CAPITA INCOME
$123,065
AVG FAMILY INCOME
$110,147
AVG HOUSEHOLD INCOME
36.4%
WAGE / INCOME GAP [ % ]
63.6¢/ $1
WAGE / INCOME GAP [ $ ]
0.43
INEQUALITY / GINI INDEX
6,175
TOTAL POPULATION
2,715
MALE POPULATION
3,460
FEMALE POPULATION
78.47
MALES / 100 FEMALES
127.44
FEMALES / 100 MALES
36.5
MEDIAN AGE
3.4
AVG FAMILY SIZE
2.9
AVG HOUSEHOLD SIZE
3,420
LABOR FORCE [ PEOPLE ]
75.2%
PERCENT IN LABOR FORCE
5.0%
UNEMPLOYMENT RATE
Crestwood Zip Codes
Crestwood Area Codes
Income in Crestwood
Income Overview in Crestwood
Per Capita Income in Crestwood is $50,642, while median incomes of families and households are $123,065 and $110,147 respectively.
| Characteristic | Number | Measure |
| Per Capita Income | 6,175 | $50,642 |
| Median Family Income | 1,648 | $123,065 |
| Mean Family Income | 1,648 | $158,277 |
| Median Household Income | 2,120 | $110,147 |
| Mean Household Income | 2,120 | $140,758 |
| Income Deficit | 1,648 | $0 |
| Wage / Income Gap (%) | 6,175 | 36.35% |
| Wage / Income Gap ($) | 6,175 | 63.65¢ per $1 |
| Gini / Inequality Index | 6,175 | 0.43 |
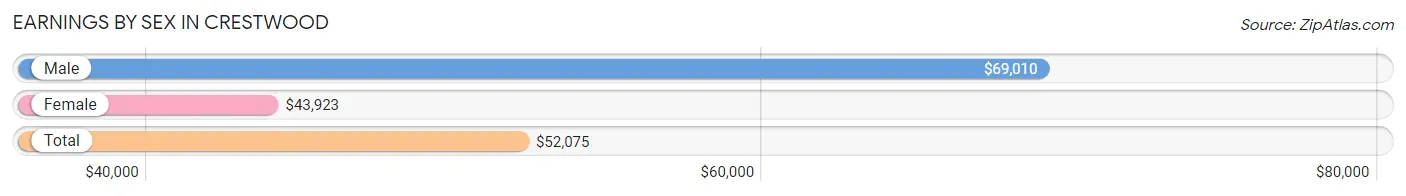
Earnings by Sex in Crestwood
Average Earnings in Crestwood are $52,075, $69,010 for men and $43,923 for women, a difference of 36.3%.
| Sex | Number | Average Earnings |
| Male | 1,741 (48.8%) | $69,010 |
| Female | 1,828 (51.2%) | $43,923 |
| Total | 3,569 (100.0%) | $52,075 |
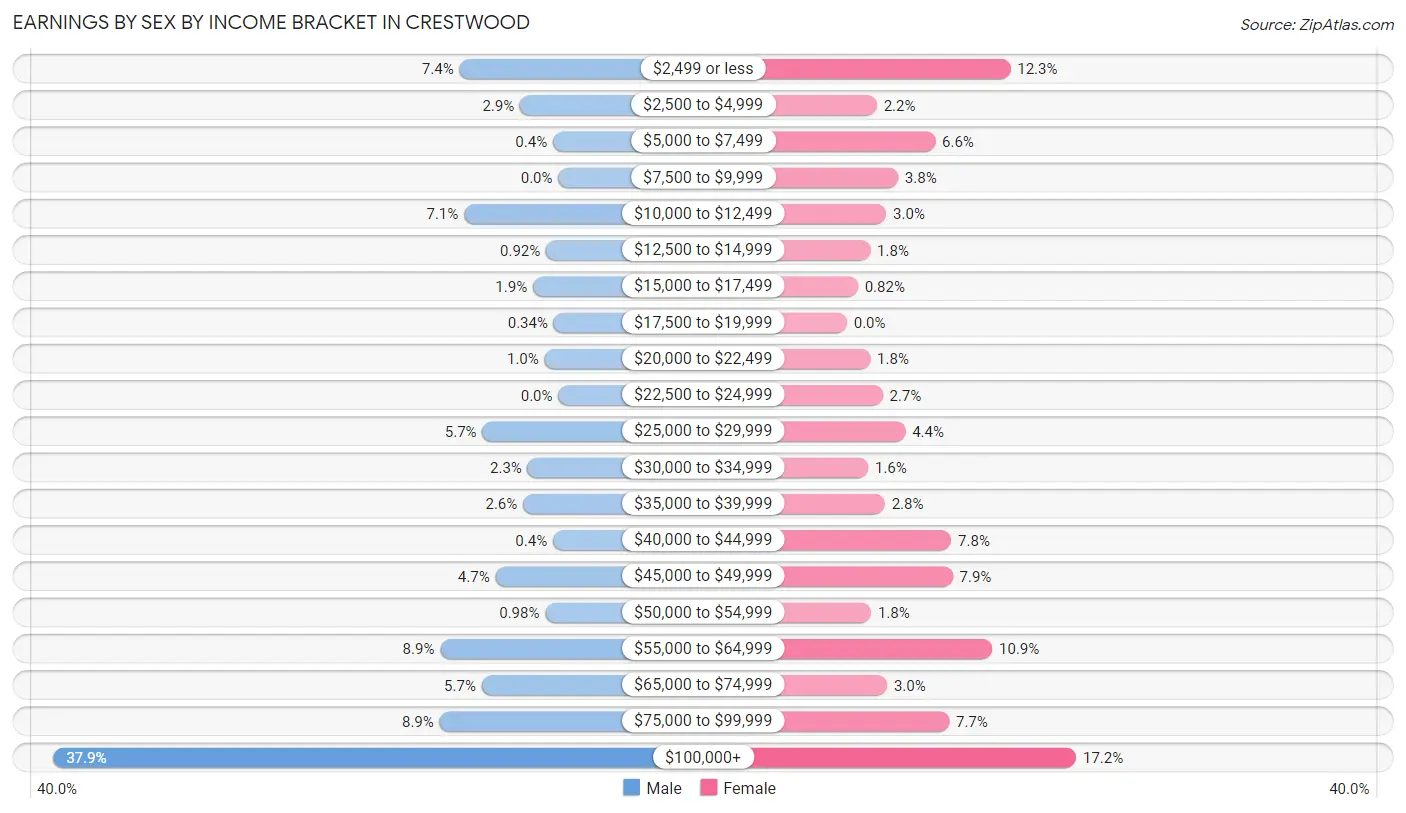
Earnings by Sex by Income Bracket in Crestwood
The most common earnings brackets in Crestwood are $100,000+ for men (659 | 37.9%) and $100,000+ for women (314 | 17.2%).
| Income | Male | Female |
| $2,499 or less | 129 (7.4%) | 224 (12.2%) |
| $2,500 to $4,999 | 50 (2.9%) | 41 (2.2%) |
| $5,000 to $7,499 | 7 (0.4%) | 121 (6.6%) |
| $7,500 to $9,999 | 0 (0.0%) | 70 (3.8%) |
| $10,000 to $12,499 | 123 (7.1%) | 54 (2.9%) |
| $12,500 to $14,999 | 16 (0.9%) | 32 (1.8%) |
| $15,000 to $17,499 | 33 (1.9%) | 15 (0.8%) |
| $17,500 to $19,999 | 6 (0.3%) | 0 (0.0%) |
| $20,000 to $22,499 | 18 (1.0%) | 32 (1.8%) |
| $22,500 to $24,999 | 0 (0.0%) | 49 (2.7%) |
| $25,000 to $29,999 | 99 (5.7%) | 80 (4.4%) |
| $30,000 to $34,999 | 40 (2.3%) | 29 (1.6%) |
| $35,000 to $39,999 | 46 (2.6%) | 52 (2.8%) |
| $40,000 to $44,999 | 7 (0.4%) | 143 (7.8%) |
| $45,000 to $49,999 | 82 (4.7%) | 145 (7.9%) |
| $50,000 to $54,999 | 17 (1.0%) | 33 (1.8%) |
| $55,000 to $64,999 | 154 (8.8%) | 199 (10.9%) |
| $65,000 to $74,999 | 100 (5.7%) | 55 (3.0%) |
| $75,000 to $99,999 | 155 (8.9%) | 140 (7.7%) |
| $100,000+ | 659 (37.9%) | 314 (17.2%) |
| Total | 1,741 (100.0%) | 1,828 (100.0%) |
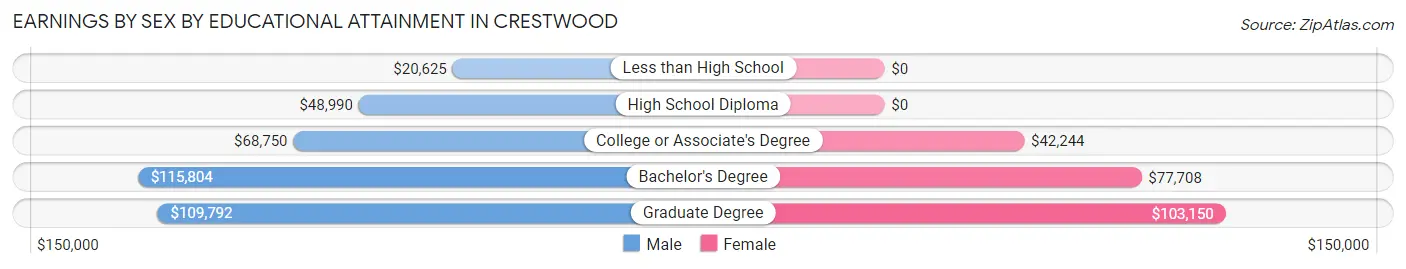
Earnings by Sex by Educational Attainment in Crestwood
Average earnings in Crestwood are $81,525 for men and $53,750 for women, a difference of 34.1%. Men with an educational attainment of bachelor's degree enjoy the highest average annual earnings of $115,804, while those with less than high school education earn the least with $20,625. Women with an educational attainment of graduate degree earn the most with the average annual earnings of $103,150, while those with college or associate's degree education have the smallest earnings of $42,244.
| Educational Attainment | Male Income | Female Income |
| Less than High School | $20,625 | $0 |
| High School Diploma | $48,990 | $0 |
| College or Associate's Degree | $68,750 | $42,244 |
| Bachelor's Degree | $115,804 | $77,708 |
| Graduate Degree | $109,792 | $103,150 |
| Total | $81,525 | $53,750 |
Family Income in Crestwood
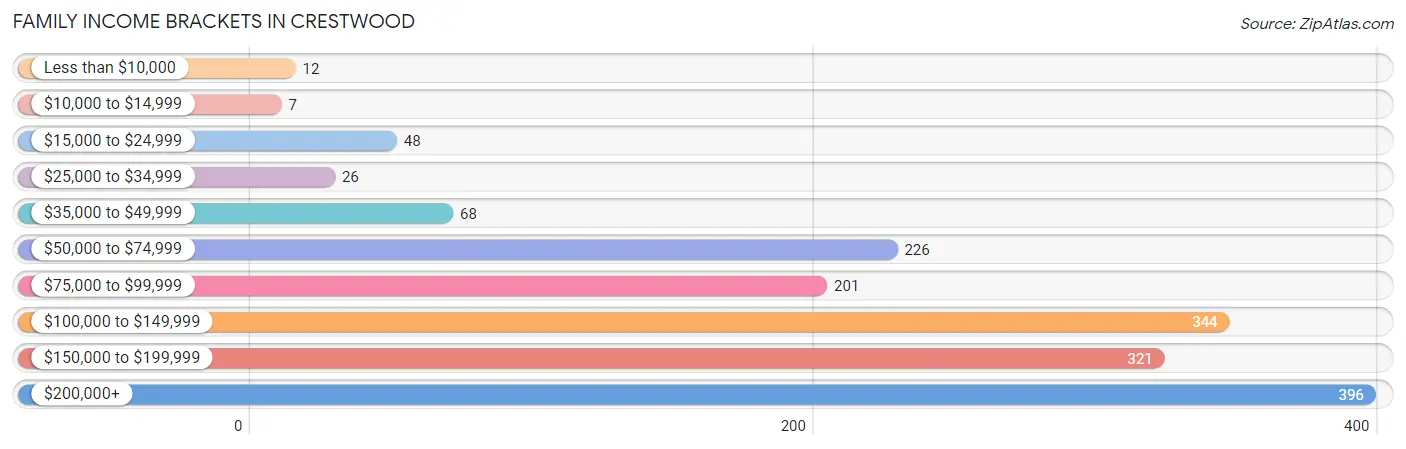
Family Income Brackets in Crestwood
According to the Crestwood family income data, there are 396 families falling into the $200,000+ income range, which is the most common income bracket and makes up 24.0% of all families. Conversely, the $10,000 to $14,999 income bracket is the least frequent group with only 7 families (0.4%) belonging to this category.
| Income Bracket | # Families | % Families |
| Less than $10,000 | 12 | 0.7% |
| $10,000 to $14,999 | 7 | 0.4% |
| $15,000 to $24,999 | 48 | 2.9% |
| $25,000 to $34,999 | 26 | 1.6% |
| $35,000 to $49,999 | 68 | 4.1% |
| $50,000 to $74,999 | 226 | 13.7% |
| $75,000 to $99,999 | 201 | 12.2% |
| $100,000 to $149,999 | 344 | 20.9% |
| $150,000 to $199,999 | 321 | 19.5% |
| $200,000+ | 396 | 24.0% |
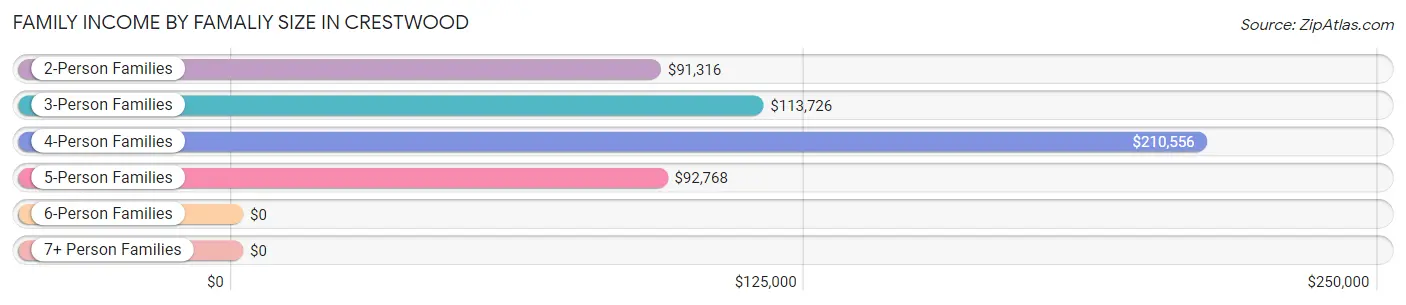
Family Income by Famaliy Size in Crestwood
4-person families (446 | 27.1%) account for the highest median family income in Crestwood with $210,556 per family, while 4-person families (446 | 27.1%) have the highest median income of $52,639 per family member.
| Income Bracket | # Families | Median Income |
| 2-Person Families | 488 (29.6%) | $91,316 |
| 3-Person Families | 462 (28.0%) | $113,726 |
| 4-Person Families | 446 (27.1%) | $210,556 |
| 5-Person Families | 194 (11.8%) | $92,768 |
| 6-Person Families | 33 (2.0%) | $0 |
| 7+ Person Families | 25 (1.5%) | $0 |
| Total | 1,648 (100.0%) | $123,065 |
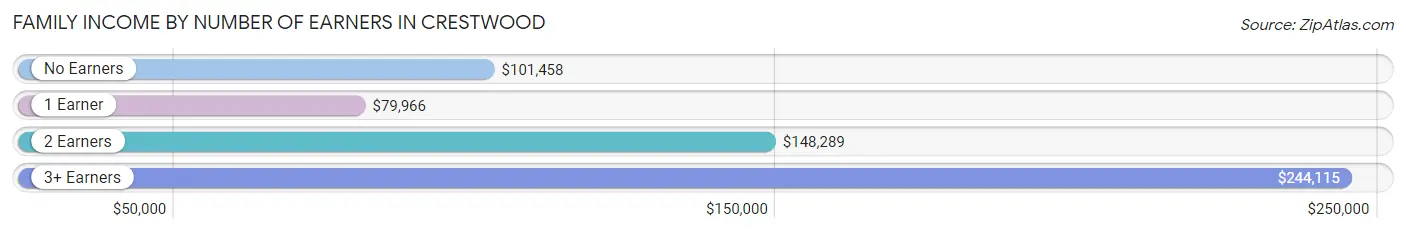
Family Income by Number of Earners in Crestwood
The median family income in Crestwood is $123,065, with families comprising 3+ earners (217) having the highest median family income of $244,115, while families with 1 earner (463) have the lowest median family income of $79,966, accounting for 13.2% and 28.1% of families, respectively.
| Number of Earners | # Families | Median Income |
| No Earners | 80 (4.9%) | $101,458 |
| 1 Earner | 463 (28.1%) | $79,966 |
| 2 Earners | 888 (53.9%) | $148,289 |
| 3+ Earners | 217 (13.2%) | $244,115 |
| Total | 1,648 (100.0%) | $123,065 |
Household Income in Crestwood
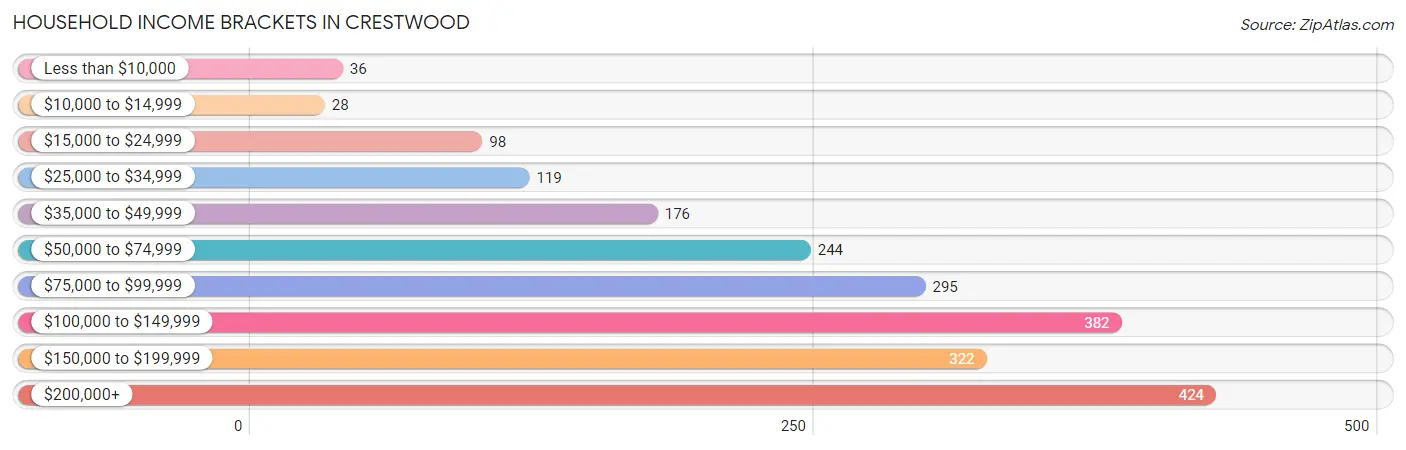
Household Income Brackets in Crestwood
With 424 households falling in the category, the $200,000+ income range is the most frequent in Crestwood, accounting for 20.0% of all households. In contrast, only 28 households (1.3%) fall into the $10,000 to $14,999 income bracket, making it the least populous group.
| Income Bracket | # Households | % Households |
| Less than $10,000 | 36 | 1.7% |
| $10,000 to $14,999 | 28 | 1.3% |
| $15,000 to $24,999 | 98 | 4.6% |
| $25,000 to $34,999 | 119 | 5.6% |
| $35,000 to $49,999 | 176 | 8.3% |
| $50,000 to $74,999 | 244 | 11.5% |
| $75,000 to $99,999 | 295 | 13.9% |
| $100,000 to $149,999 | 382 | 18.0% |
| $150,000 to $199,999 | 322 | 15.2% |
| $200,000+ | 424 | 20.0% |
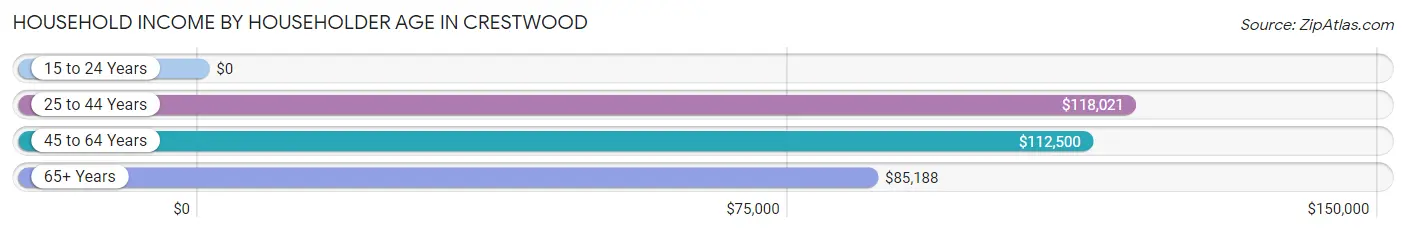
Household Income by Householder Age in Crestwood
The median household income in Crestwood is $110,147, with the highest median household income of $118,021 found in the 25 to 44 years age bracket for the primary householder. A total of 707 households (33.4%) fall into this category.
| Income Bracket | # Households | Median Income |
| 15 to 24 Years | 0 (0.0%) | $0 |
| 25 to 44 Years | 707 (33.4%) | $118,021 |
| 45 to 64 Years | 1,090 (51.4%) | $112,500 |
| 65+ Years | 323 (15.2%) | $85,188 |
| Total | 2,120 (100.0%) | $110,147 |
Poverty in Crestwood
Income Below Poverty by Sex and Age in Crestwood
With 4.9% poverty level for males and 4.9% for females among the residents of Crestwood, 6 to 11 year old males and 18 to 24 year old females are the most vulnerable to poverty, with 43 males (14.0%) and 48 females (13.4%) in their respective age groups living below the poverty level.
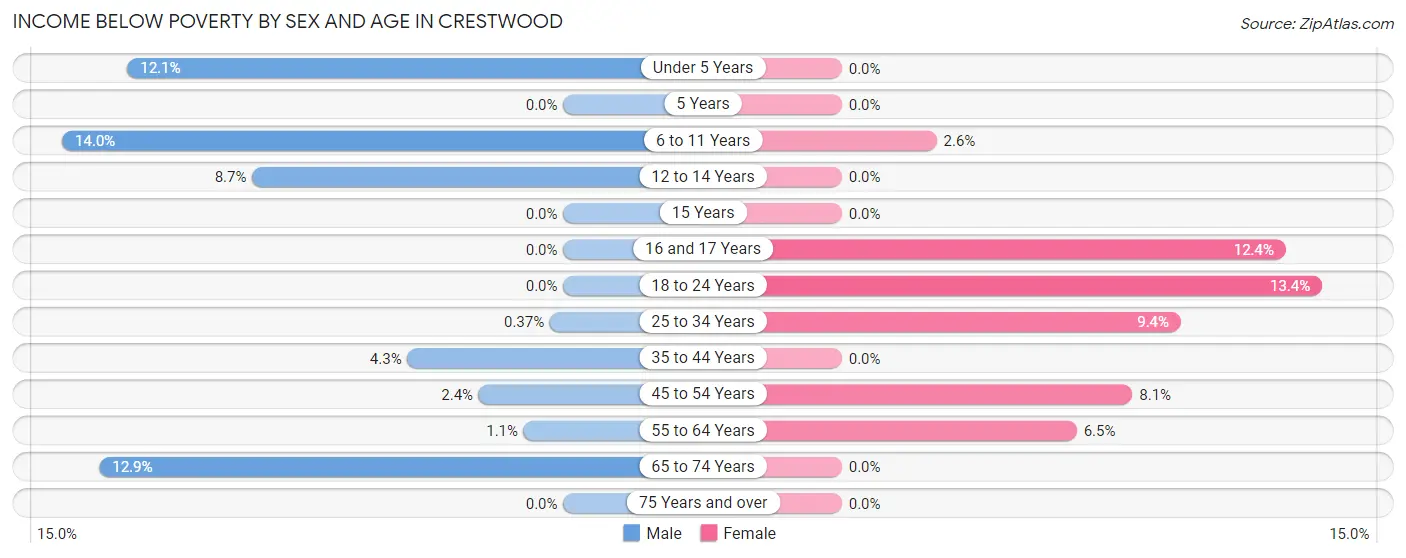
| Age Bracket | Male | Female |
| Under 5 Years | 17 (12.1%) | 0 (0.0%) |
| 5 Years | 0 (0.0%) | 0 (0.0%) |
| 6 to 11 Years | 43 (14.0%) | 12 (2.6%) |
| 12 to 14 Years | 11 (8.7%) | 0 (0.0%) |
| 15 Years | 0 (0.0%) | 0 (0.0%) |
| 16 and 17 Years | 0 (0.0%) | 11 (12.4%) |
| 18 to 24 Years | 0 (0.0%) | 48 (13.4%) |
| 25 to 34 Years | 1 (0.4%) | 27 (9.4%) |
| 35 to 44 Years | 20 (4.3%) | 0 (0.0%) |
| 45 to 54 Years | 12 (2.4%) | 47 (8.1%) |
| 55 to 64 Years | 4 (1.1%) | 24 (6.5%) |
| 65 to 74 Years | 23 (12.9%) | 0 (0.0%) |
| 75 Years and over | 0 (0.0%) | 0 (0.0%) |
| Total | 131 (4.9%) | 169 (4.9%) |
Income Above Poverty by Sex and Age in Crestwood
According to the poverty statistics in Crestwood, males aged 15 years and females aged under 5 years are the age groups that are most secure financially, with 100.0% of males and 100.0% of females in these age groups living above the poverty line.
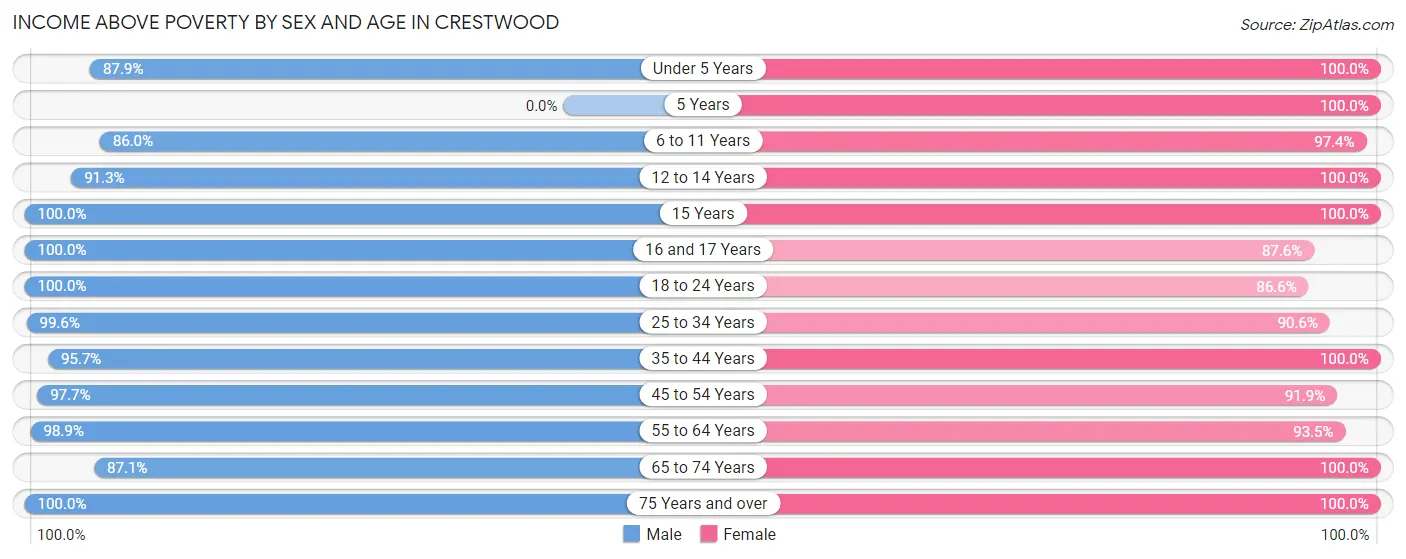
| Age Bracket | Male | Female |
| Under 5 Years | 123 (87.9%) | 130 (100.0%) |
| 5 Years | 0 (0.0%) | 22 (100.0%) |
| 6 to 11 Years | 265 (86.0%) | 442 (97.4%) |
| 12 to 14 Years | 116 (91.3%) | 185 (100.0%) |
| 15 Years | 28 (100.0%) | 208 (100.0%) |
| 16 and 17 Years | 51 (100.0%) | 78 (87.6%) |
| 18 to 24 Years | 170 (100.0%) | 311 (86.6%) |
| 25 to 34 Years | 269 (99.6%) | 259 (90.6%) |
| 35 to 44 Years | 441 (95.7%) | 452 (100.0%) |
| 45 to 54 Years | 499 (97.7%) | 534 (91.9%) |
| 55 to 64 Years | 358 (98.9%) | 343 (93.5%) |
| 65 to 74 Years | 155 (87.1%) | 170 (100.0%) |
| 75 Years and over | 79 (100.0%) | 157 (100.0%) |
| Total | 2,554 (95.1%) | 3,291 (95.1%) |
Income Below Poverty Among Married-Couple Families in Crestwood
The poverty statistics for married-couple families in Crestwood show that 0.9% or 12 of the total 1,267 families live below the poverty line. Families with 1 or 2 children have the highest poverty rate of 1.9%, comprising of 12 families. On the other hand, families with no children have the lowest poverty rate of 0.0%, which includes 0 families.
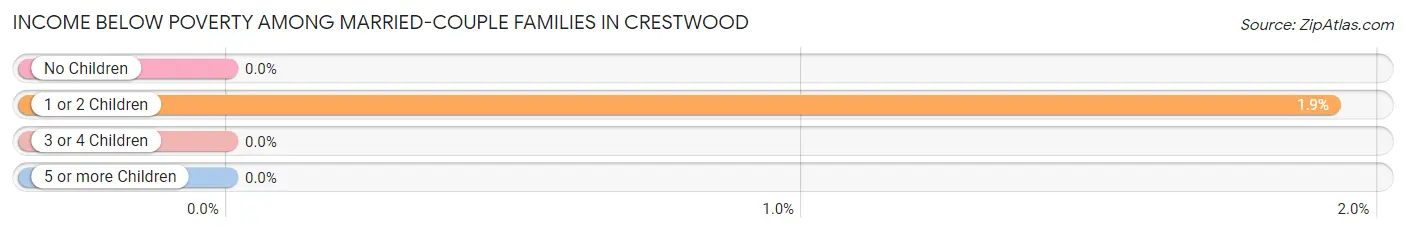
| Children | Above Poverty | Below Poverty |
| No Children | 513 (100.0%) | 0 (0.0%) |
| 1 or 2 Children | 612 (98.1%) | 12 (1.9%) |
| 3 or 4 Children | 105 (100.0%) | 0 (0.0%) |
| 5 or more Children | 25 (100.0%) | 0 (0.0%) |
| Total | 1,255 (99.1%) | 12 (0.9%) |
Income Below Poverty Among Single-Parent Households in Crestwood
According to the poverty data in Crestwood, 12.1% or 18 single-father households and 12.5% or 29 single-mother households are living below the poverty line. Among single-father households, those with 3 or 4 children have the highest poverty rate, with 18 households (100.0%) experiencing poverty. Likewise, among single-mother households, those with 1 or 2 children have the highest poverty rate, with 29 households (14.0%) falling below the poverty line.
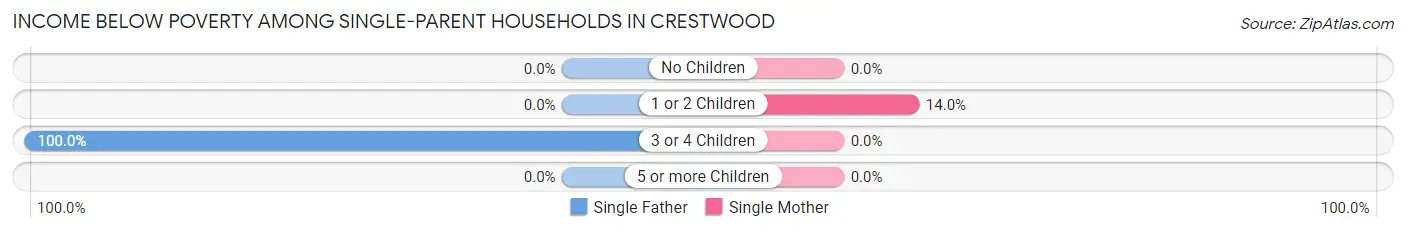
| Children | Single Father | Single Mother |
| No Children | 0 (0.0%) | 0 (0.0%) |
| 1 or 2 Children | 0 (0.0%) | 29 (14.0%) |
| 3 or 4 Children | 18 (100.0%) | 0 (0.0%) |
| 5 or more Children | 0 (0.0%) | 0 (0.0%) |
| Total | 18 (12.1%) | 29 (12.5%) |
Income Below Poverty Among Married-Couple vs Single-Parent Households in Crestwood
The poverty data for Crestwood shows that 12 of the married-couple family households (0.9%) and 47 of the single-parent households (12.3%) are living below the poverty level. Within the married-couple family households, those with 1 or 2 children have the highest poverty rate, with 12 households (1.9%) falling below the poverty line. Among the single-parent households, those with 3 or 4 children have the highest poverty rate, with 18 household (100.0%) living below poverty.
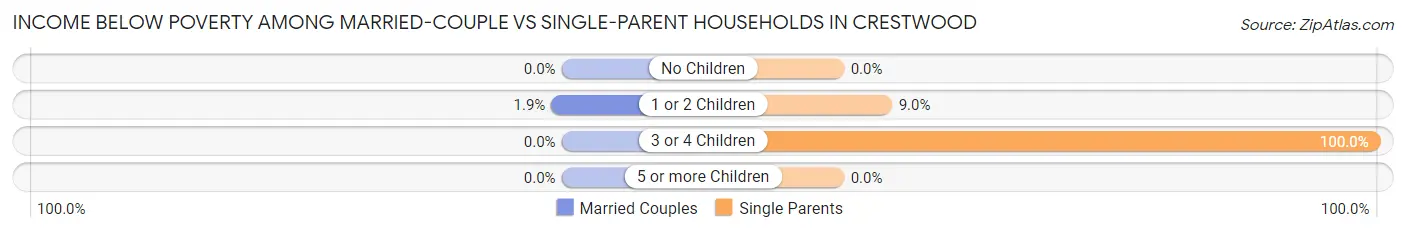
| Children | Married-Couple Families | Single-Parent Households |
| No Children | 0 (0.0%) | 0 (0.0%) |
| 1 or 2 Children | 12 (1.9%) | 29 (8.9%) |
| 3 or 4 Children | 0 (0.0%) | 18 (100.0%) |
| 5 or more Children | 0 (0.0%) | 0 (0.0%) |
| Total | 12 (0.9%) | 47 (12.3%) |
Race in Crestwood
The most populous races in Crestwood are White / Caucasian (5,775 | 93.5%), Hispanic or Latino (645 | 10.4%), and Two or more Races (160 | 2.6%).
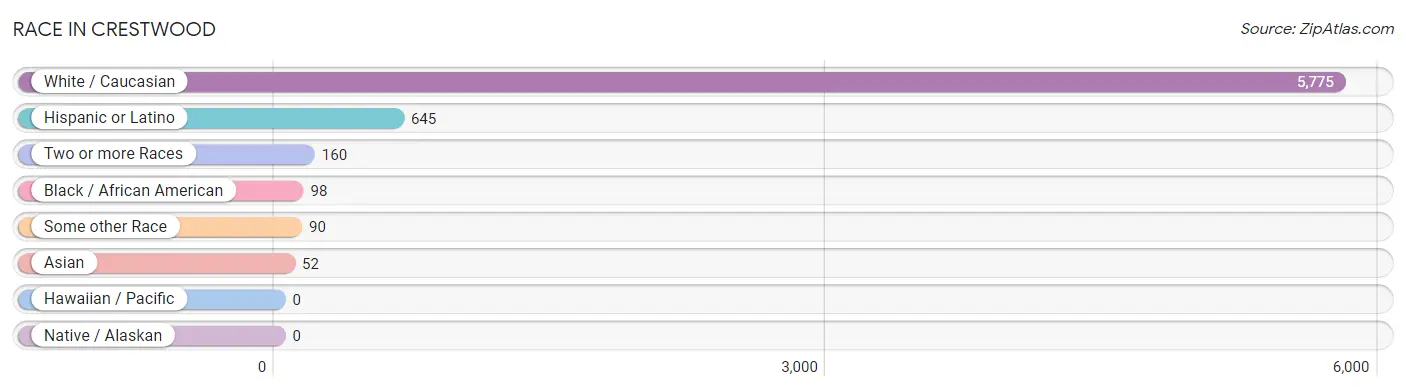
| Race | # Population | % Population |
| Asian | 52 | 0.8% |
| Black / African American | 98 | 1.6% |
| Hawaiian / Pacific | 0 | 0.0% |
| Hispanic or Latino | 645 | 10.4% |
| Native / Alaskan | 0 | 0.0% |
| White / Caucasian | 5,775 | 93.5% |
| Two or more Races | 160 | 2.6% |
| Some other Race | 90 | 1.5% |
| Total | 6,175 | 100.0% |
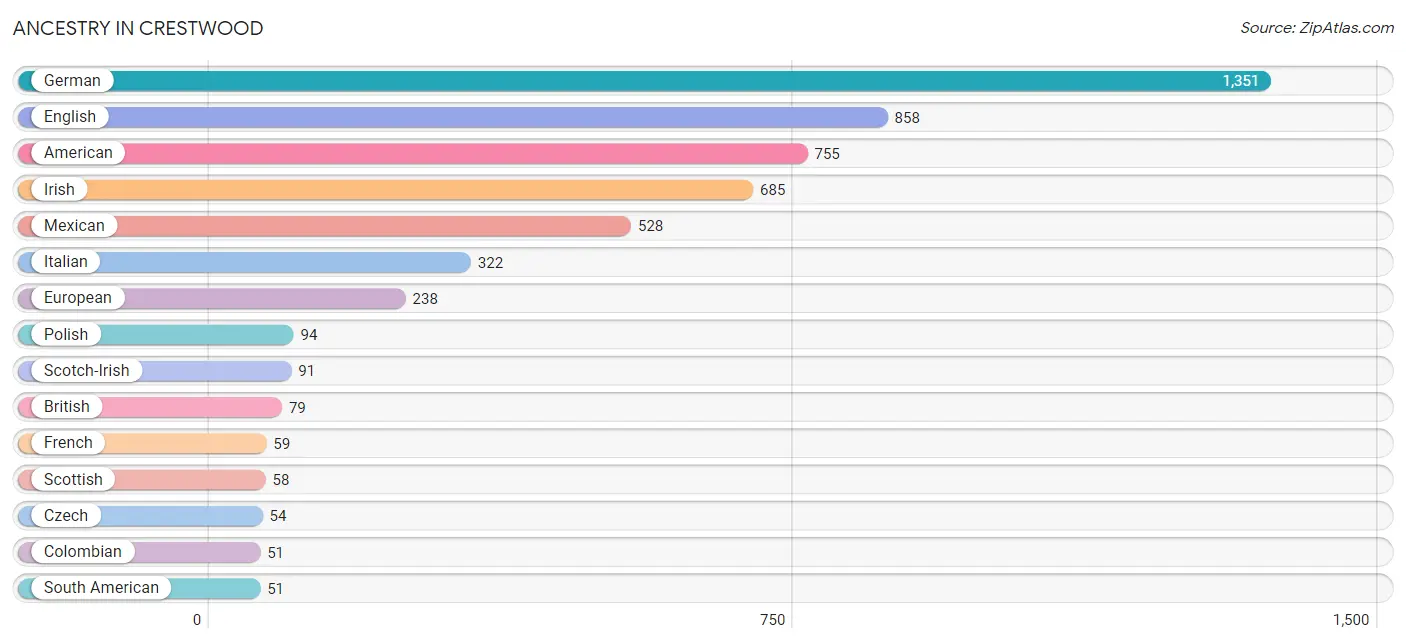
Ancestry in Crestwood
The most populous ancestries reported in Crestwood are German (1,351 | 21.9%), English (858 | 13.9%), American (755 | 12.2%), Irish (685 | 11.1%), and Mexican (528 | 8.6%), together accounting for 67.6% of all Crestwood residents.
| Ancestry | # Population | % Population |
| American | 755 | 12.2% |
| Bhutanese | 38 | 0.6% |
| British | 79 | 1.3% |
| Burmese | 14 | 0.2% |
| Canadian | 12 | 0.2% |
| Central American | 20 | 0.3% |
| Cherokee | 28 | 0.4% |
| Colombian | 51 | 0.8% |
| Czech | 54 | 0.9% |
| Eastern European | 4 | 0.1% |
| English | 858 | 13.9% |
| European | 238 | 3.8% |
| Finnish | 19 | 0.3% |
| French | 59 | 1.0% |
| German | 1,351 | 21.9% |
| Guatemalan | 20 | 0.3% |
| Irish | 685 | 11.1% |
| Italian | 322 | 5.2% |
| Jamaican | 30 | 0.5% |
| Korean | 30 | 0.5% |
| Mexican | 528 | 8.6% |
| Norwegian | 23 | 0.4% |
| Polish | 94 | 1.5% |
| Portuguese | 37 | 0.6% |
| Puerto Rican | 24 | 0.4% |
| Russian | 20 | 0.3% |
| Scotch-Irish | 91 | 1.5% |
| Scottish | 58 | 0.9% |
| Slovak | 32 | 0.5% |
| South American | 51 | 0.8% |
| Spaniard | 22 | 0.4% |
| Swedish | 11 | 0.2% |
| Swiss | 11 | 0.2% |
| Welsh | 22 | 0.4% | View All 34 Rows |
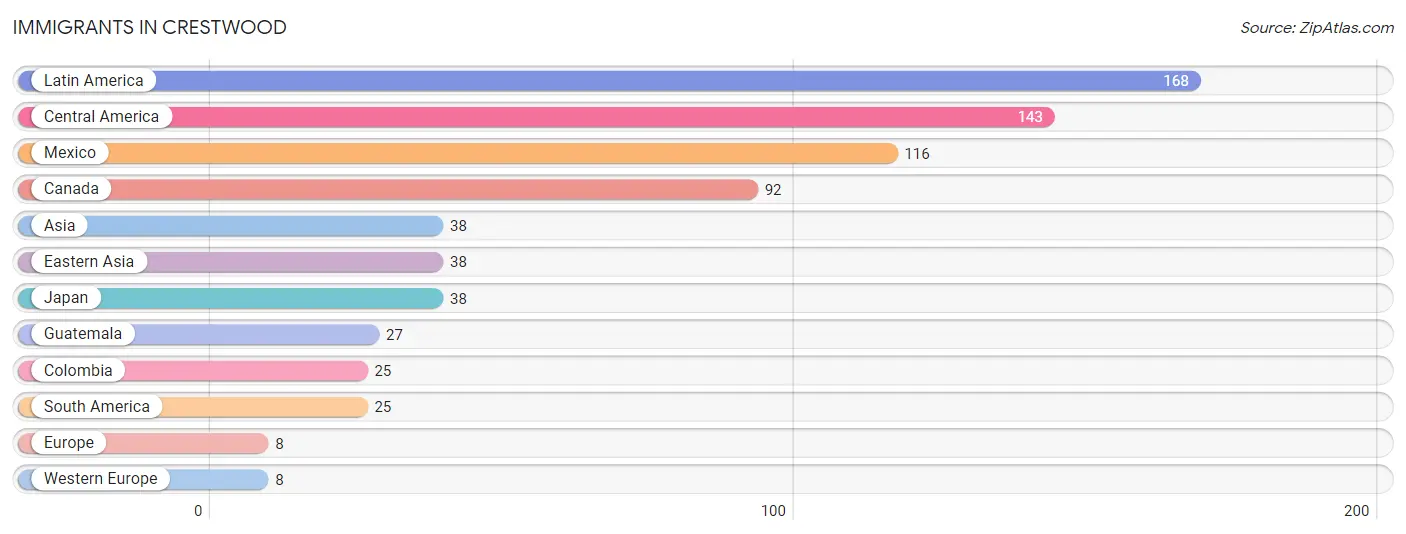
Immigrants in Crestwood
The most numerous immigrant groups reported in Crestwood came from Latin America (168 | 2.7%), Central America (143 | 2.3%), Mexico (116 | 1.9%), Canada (92 | 1.5%), and Asia (38 | 0.6%), together accounting for 9.0% of all Crestwood residents.
| Immigration Origin | # Population | % Population |
| Asia | 38 | 0.6% |
| Canada | 92 | 1.5% |
| Central America | 143 | 2.3% |
| Colombia | 25 | 0.4% |
| Eastern Asia | 38 | 0.6% |
| Europe | 8 | 0.1% |
| Guatemala | 27 | 0.4% |
| Japan | 38 | 0.6% |
| Latin America | 168 | 2.7% |
| Mexico | 116 | 1.9% |
| South America | 25 | 0.4% |
| Western Europe | 8 | 0.1% | View All 12 Rows |
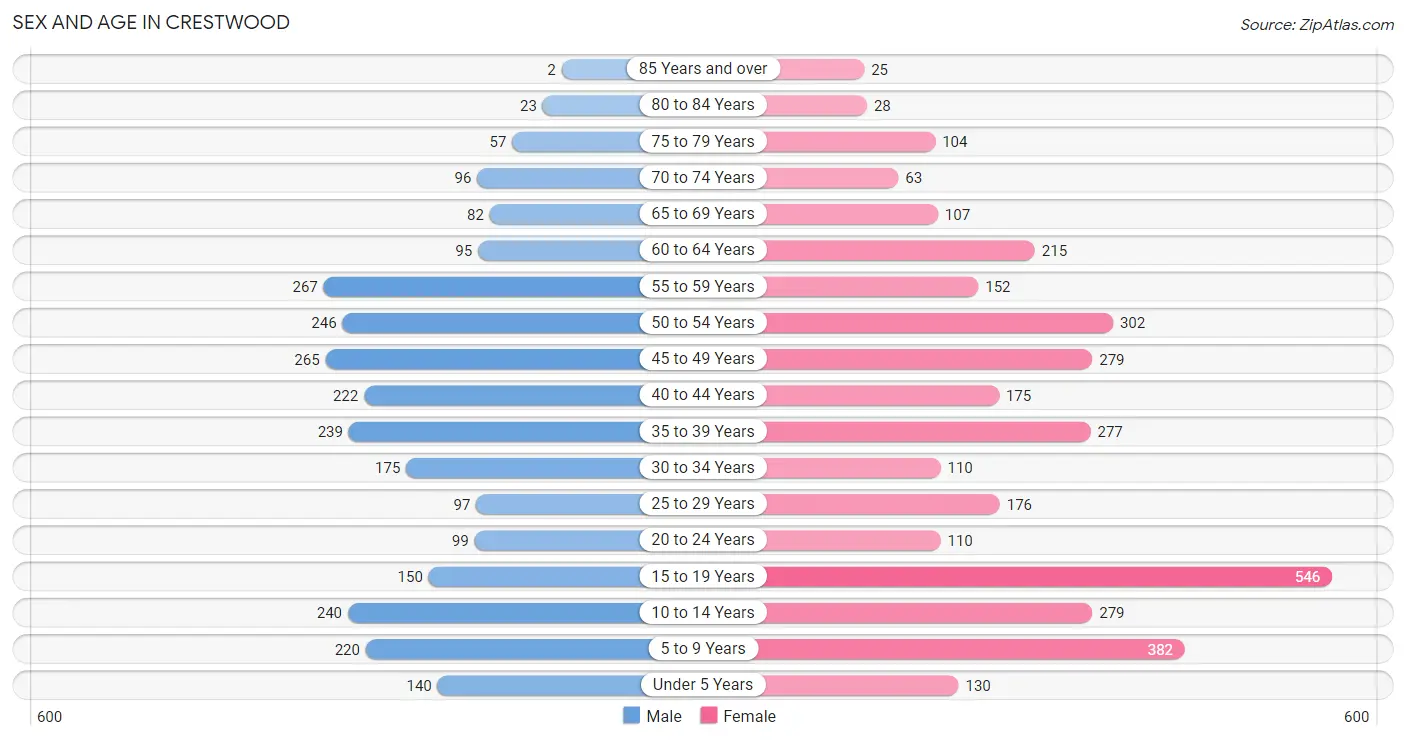
Sex and Age in Crestwood
Sex and Age in Crestwood
The most populous age groups in Crestwood are 55 to 59 Years (267 | 9.8%) for men and 15 to 19 Years (546 | 15.8%) for women.
| Age Bracket | Male | Female |
| Under 5 Years | 140 (5.2%) | 130 (3.8%) |
| 5 to 9 Years | 220 (8.1%) | 382 (11.0%) |
| 10 to 14 Years | 240 (8.8%) | 279 (8.1%) |
| 15 to 19 Years | 150 (5.5%) | 546 (15.8%) |
| 20 to 24 Years | 99 (3.6%) | 110 (3.2%) |
| 25 to 29 Years | 97 (3.6%) | 176 (5.1%) |
| 30 to 34 Years | 175 (6.5%) | 110 (3.2%) |
| 35 to 39 Years | 239 (8.8%) | 277 (8.0%) |
| 40 to 44 Years | 222 (8.2%) | 175 (5.1%) |
| 45 to 49 Years | 265 (9.8%) | 279 (8.1%) |
| 50 to 54 Years | 246 (9.1%) | 302 (8.7%) |
| 55 to 59 Years | 267 (9.8%) | 152 (4.4%) |
| 60 to 64 Years | 95 (3.5%) | 215 (6.2%) |
| 65 to 69 Years | 82 (3.0%) | 107 (3.1%) |
| 70 to 74 Years | 96 (3.5%) | 63 (1.8%) |
| 75 to 79 Years | 57 (2.1%) | 104 (3.0%) |
| 80 to 84 Years | 23 (0.9%) | 28 (0.8%) |
| 85 Years and over | 2 (0.1%) | 25 (0.7%) |
| Total | 2,715 (100.0%) | 3,460 (100.0%) |
Families and Households in Crestwood
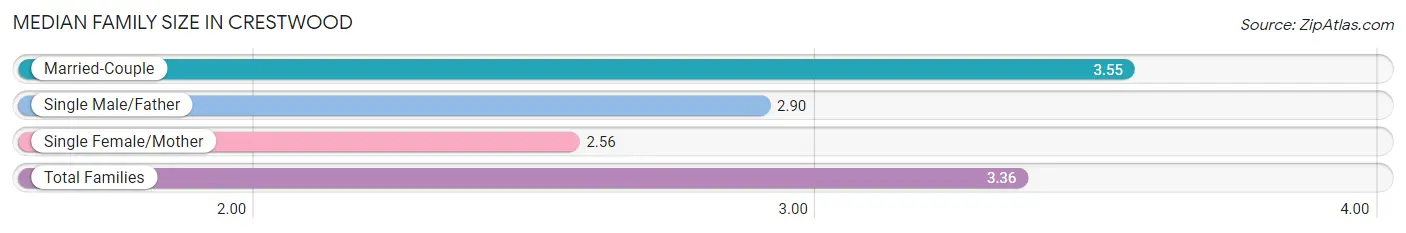
Median Family Size in Crestwood
The median family size in Crestwood is 3.36 persons per family, with married-couple families (1,267 | 76.9%) accounting for the largest median family size of 3.55 persons per family. On the other hand, single female/mother families (232 | 14.1%) represent the smallest median family size with 2.56 persons per family.
| Family Type | # Families | Family Size |
| Married-Couple | 1,267 (76.9%) | 3.55 |
| Single Male/Father | 149 (9.0%) | 2.90 |
| Single Female/Mother | 232 (14.1%) | 2.56 |
| Total Families | 1,648 (100.0%) | 3.36 |
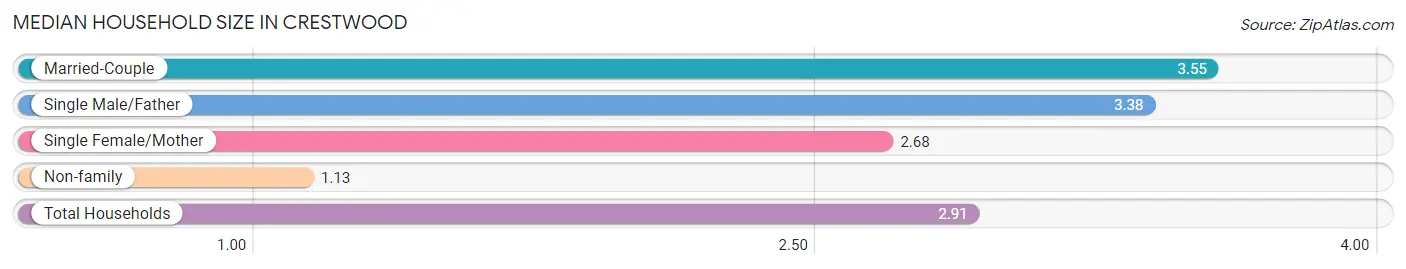
Median Household Size in Crestwood
The median household size in Crestwood is 2.91 persons per household, with married-couple households (1,267 | 59.8%) accounting for the largest median household size of 3.55 persons per household. non-family households (472 | 22.3%) represent the smallest median household size with 1.13 persons per household.
| Household Type | # Households | Household Size |
| Married-Couple | 1,267 (59.8%) | 3.55 |
| Single Male/Father | 149 (7.0%) | 3.38 |
| Single Female/Mother | 232 (10.9%) | 2.68 |
| Non-family | 472 (22.3%) | 1.13 |
| Total Households | 2,120 (100.0%) | 2.91 |
Household Size by Marriage Status in Crestwood
Out of a total of 2,120 households in Crestwood, 1,648 (77.7%) are family households, while 472 (22.3%) are nonfamily households. The most numerous type of family households are 4-person households, comprising 491, and the most common type of nonfamily households are 1-person households, comprising 418.
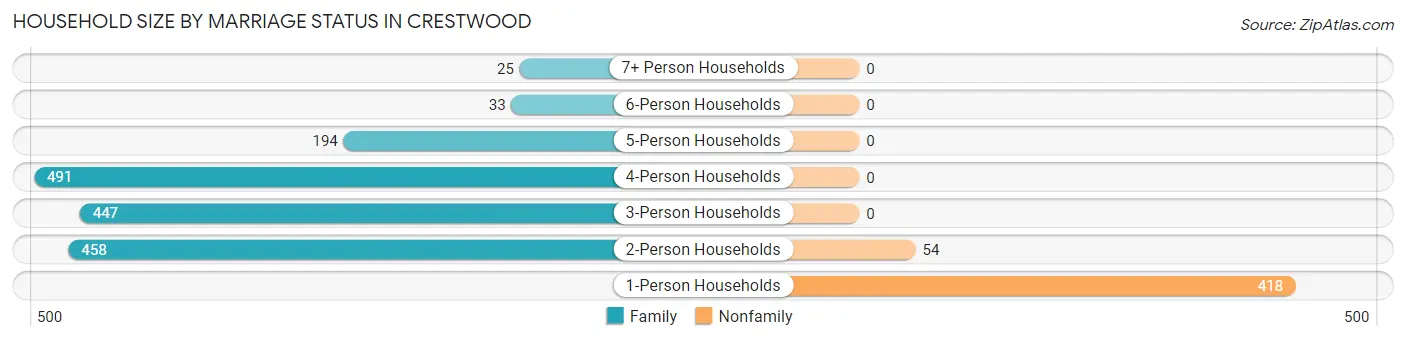
| Household Size | Family Households | Nonfamily Households |
| 1-Person Households | - | 418 (19.7%) |
| 2-Person Households | 458 (21.6%) | 54 (2.5%) |
| 3-Person Households | 447 (21.1%) | 0 (0.0%) |
| 4-Person Households | 491 (23.2%) | 0 (0.0%) |
| 5-Person Households | 194 (9.1%) | 0 (0.0%) |
| 6-Person Households | 33 (1.6%) | 0 (0.0%) |
| 7+ Person Households | 25 (1.2%) | 0 (0.0%) |
| Total | 1,648 (77.7%) | 472 (22.3%) |
Female Fertility in Crestwood
Fertility by Age in Crestwood
| Age Bracket | Women with Births | Births / 1,000 Women |
| 15 to 19 years | 0 (0.0%) | 0.0 |
| 20 to 34 years | 0 (0.0%) | 0.0 |
| 35 to 50 years | 0 (0.0%) | 0.0 |
| Total | 0 (0.0%) | 0.0 |
Fertility by Age by Marriage Status in Crestwood
| Age Bracket | Married | Unmarried |
| 15 to 19 years | 0 (0.0%) | 0 (0.0%) |
| 20 to 34 years | 0 (0.0%) | 0 (0.0%) |
| 35 to 50 years | 0 (0.0%) | 0 (0.0%) |
| Total | 0 (0.0%) | 0 (0.0%) |
Fertility by Education in Crestwood
| Educational Attainment | Women with Births | Births / 1,000 Women |
| Less than High School | 0 (0.0%) | 0.0 |
| High School Diploma | 0 (0.0%) | 0.0 |
| College or Associate's Degree | 0 (0.0%) | 0.0 |
| Bachelor's Degree | 0 (0.0%) | 0.0 |
| Graduate Degree | 0 (0.0%) | 0.0 |
| Total | 0 (0.0%) | 0.0 |
Fertility by Education by Marriage Status in Crestwood
| Educational Attainment | Married | Unmarried |
| Less than High School | 0 (0.0%) | 0 (0.0%) |
| High School Diploma | 0 (0.0%) | 0 (0.0%) |
| College or Associate's Degree | 0 (0.0%) | 0 (0.0%) |
| Bachelor's Degree | 0 (0.0%) | 0 (0.0%) |
| Graduate Degree | 0 (0.0%) | 0 (0.0%) |
| Total | 0 (0.0%) | 0 (0.0%) |
Employment Characteristics in Crestwood
Employment by Class of Employer in Crestwood
Among the 3,219 employed individuals in Crestwood, private company employees (2,408 | 74.8%), local government employees (218 | 6.8%), and self-employed (incorporated) (187 | 5.8%) make up the most common classes of employment.
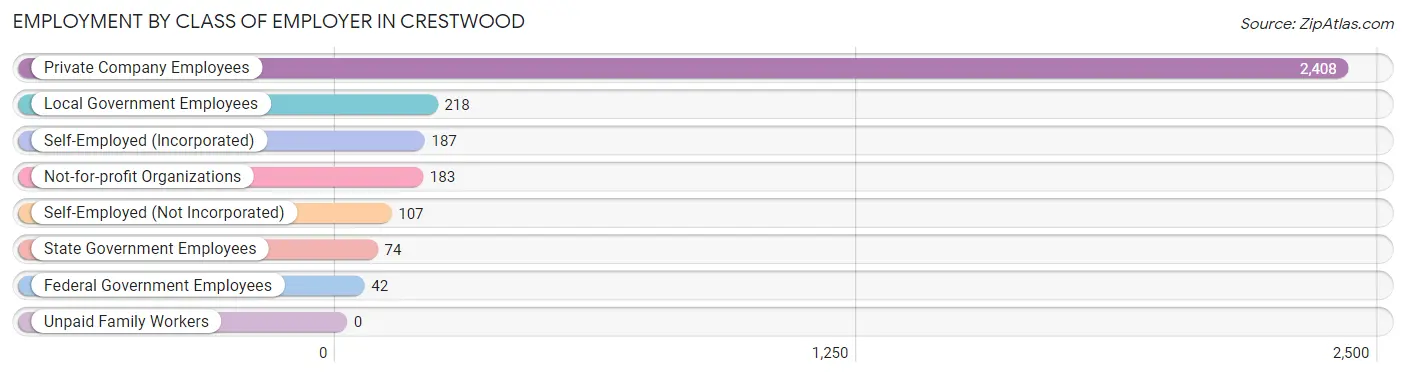
| Employer Class | # Employees | % Employees |
| Private Company Employees | 2,408 | 74.8% |
| Self-Employed (Incorporated) | 187 | 5.8% |
| Self-Employed (Not Incorporated) | 107 | 3.3% |
| Not-for-profit Organizations | 183 | 5.7% |
| Local Government Employees | 218 | 6.8% |
| State Government Employees | 74 | 2.3% |
| Federal Government Employees | 42 | 1.3% |
| Unpaid Family Workers | 0 | 0.0% |
| Total | 3,219 | 100.0% |
Employment Status by Age in Crestwood
According to the labor force statistics for Crestwood, out of the total population over 16 years of age (4,548), 75.2% or 3,420 individuals are in the labor force, with 5.0% or 171 of them unemployed. The age group with the highest labor force participation rate is 30 to 34 years, with 98.9% or 282 individuals in the labor force. Within the labor force, the 60 to 64 years age range has the highest percentage of unemployed individuals, with 24.5% or 50 of them being unemployed.
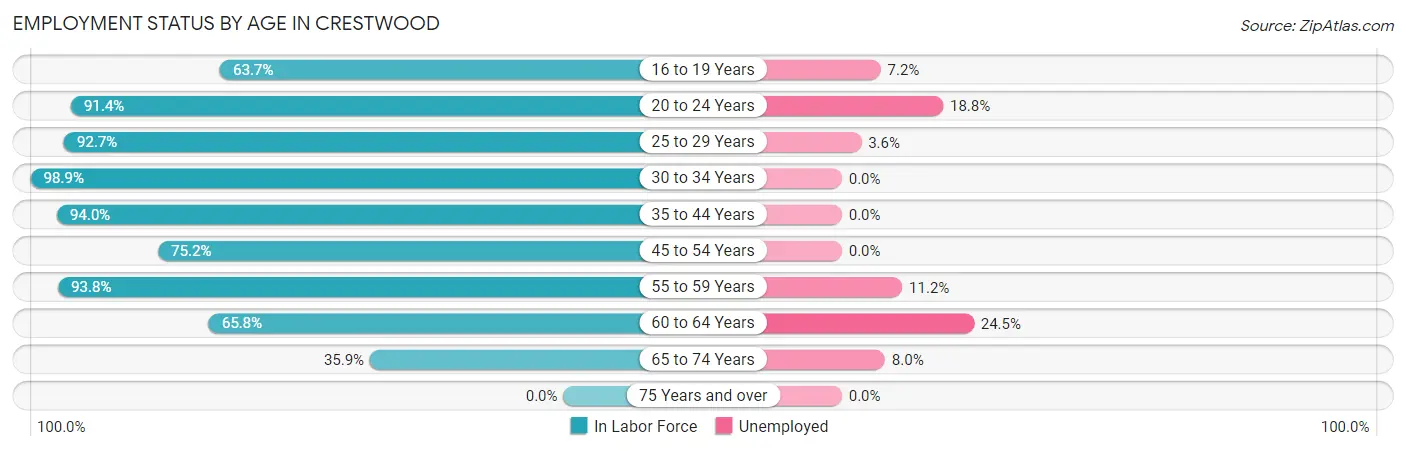
| Age Bracket | In Labor Force | Unemployed |
| 16 to 19 Years | 293 (63.7%) | 21 (7.2%) |
| 20 to 24 Years | 191 (91.4%) | 36 (18.8%) |
| 25 to 29 Years | 253 (92.7%) | 9 (3.6%) |
| 30 to 34 Years | 282 (98.9%) | 0 (0.0%) |
| 35 to 44 Years | 858 (94.0%) | 0 (0.0%) |
| 45 to 54 Years | 821 (75.2%) | 0 (0.0%) |
| 55 to 59 Years | 393 (93.8%) | 44 (11.2%) |
| 60 to 64 Years | 204 (65.8%) | 50 (24.5%) |
| 65 to 74 Years | 125 (35.9%) | 10 (8.0%) |
| 75 Years and over | 0 (0.0%) | 0 (0.0%) |
| Total | 3,420 (75.2%) | 171 (5.0%) |
Employment Status by Educational Attainment in Crestwood
According to labor force statistics for Crestwood, 85.4% of individuals (2,811) out of the total population between 25 and 64 years of age (3,292) are in the labor force, with 3.7% or 104 of them being unemployed. The group with the highest labor force participation rate are those with the educational attainment of college / associate degree, with 92.5% or 993 individuals in the labor force. Within the labor force, individuals with college / associate degree education have the highest percentage of unemployment, with 3.9% or 39 of them being unemployed.
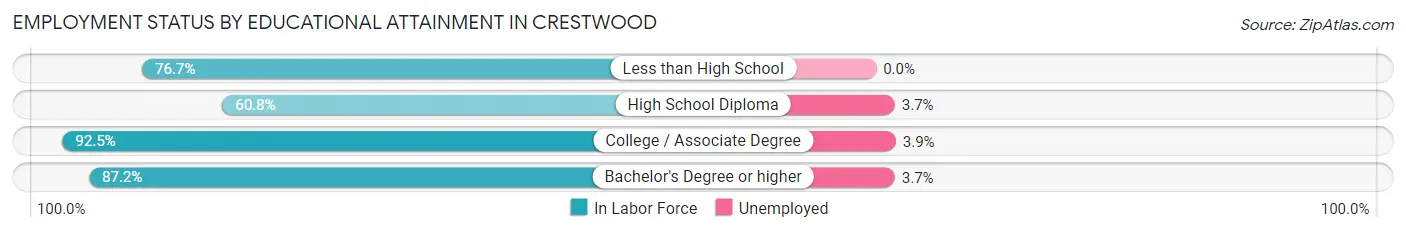
| Educational Attainment | In Labor Force | Unemployed |
| Less than High School | 69 (76.7%) | 0 (0.0%) |
| High School Diploma | 245 (60.8%) | 15 (3.7%) |
| College / Associate Degree | 993 (92.5%) | 42 (3.9%) |
| Bachelor's Degree or higher | 1,504 (87.2%) | 64 (3.7%) |
| Total | 2,811 (85.4%) | 122 (3.7%) |
Employment Occupations by Sex in Crestwood
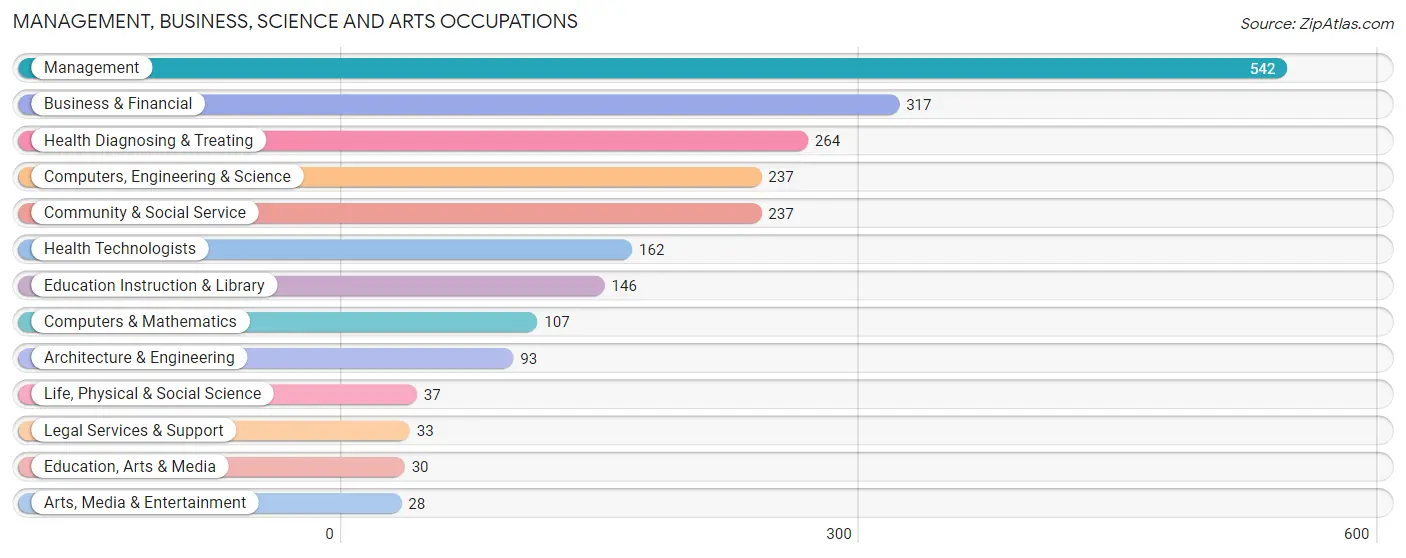
Management, Business, Science and Arts Occupations
The most common Management, Business, Science and Arts occupations in Crestwood are Management (542 | 16.7%), Business & Financial (317 | 9.8%), Health Diagnosing & Treating (264 | 8.1%), Computers, Engineering & Science (237 | 7.3%), and Community & Social Service (237 | 7.3%).
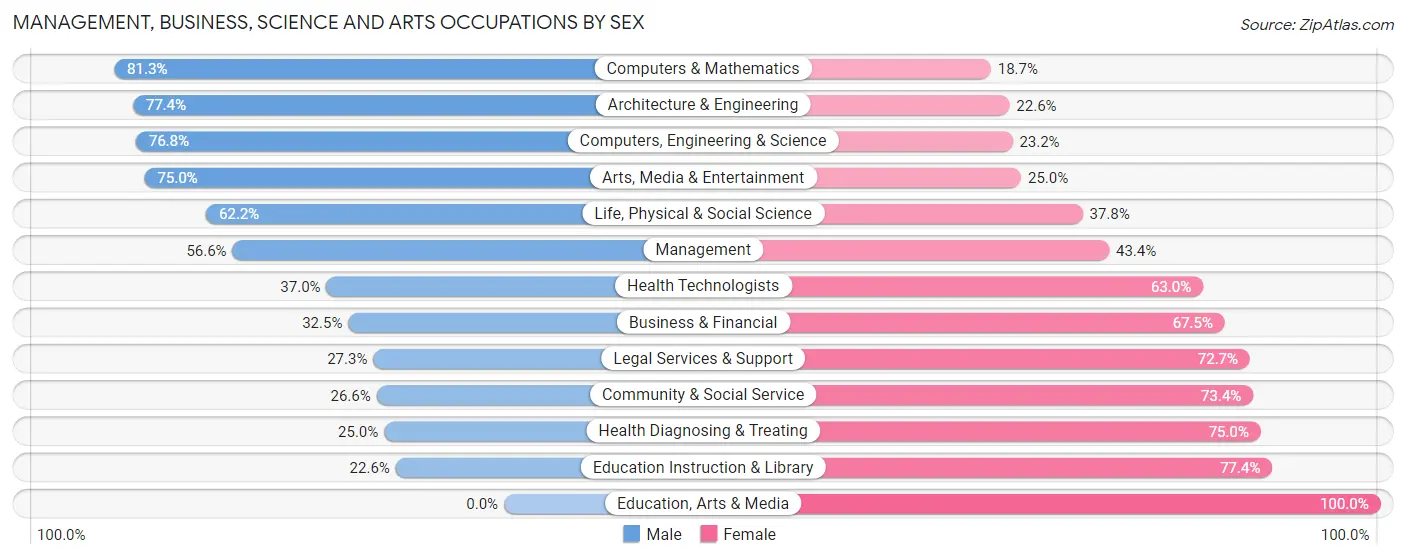
Management, Business, Science and Arts Occupations by Sex
Within the Management, Business, Science and Arts occupations in Crestwood, the most male-oriented occupations are Computers & Mathematics (81.3%), Architecture & Engineering (77.4%), and Computers, Engineering & Science (76.8%), while the most female-oriented occupations are Education, Arts & Media (100.0%), Education Instruction & Library (77.4%), and Health Diagnosing & Treating (75.0%).
| Occupation | Male | Female |
| Management | 307 (56.6%) | 235 (43.4%) |
| Business & Financial | 103 (32.5%) | 214 (67.5%) |
| Computers, Engineering & Science | 182 (76.8%) | 55 (23.2%) |
| Computers & Mathematics | 87 (81.3%) | 20 (18.7%) |
| Architecture & Engineering | 72 (77.4%) | 21 (22.6%) |
| Life, Physical & Social Science | 23 (62.2%) | 14 (37.8%) |
| Community & Social Service | 63 (26.6%) | 174 (73.4%) |
| Education, Arts & Media | 0 (0.0%) | 30 (100.0%) |
| Legal Services & Support | 9 (27.3%) | 24 (72.7%) |
| Education Instruction & Library | 33 (22.6%) | 113 (77.4%) |
| Arts, Media & Entertainment | 21 (75.0%) | 7 (25.0%) |
| Health Diagnosing & Treating | 66 (25.0%) | 198 (75.0%) |
| Health Technologists | 60 (37.0%) | 102 (63.0%) |
| Total (Category) | 721 (45.2%) | 876 (54.8%) |
| Total (Overall) | 1,630 (50.1%) | 1,620 (49.8%) |
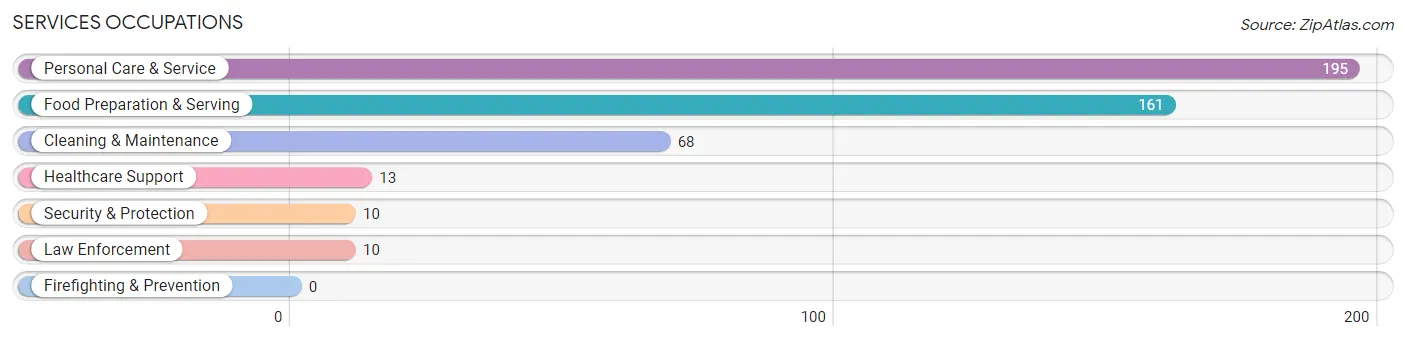
Services Occupations
The most common Services occupations in Crestwood are Personal Care & Service (195 | 6.0%), Food Preparation & Serving (161 | 5.0%), Cleaning & Maintenance (68 | 2.1%), Healthcare Support (13 | 0.4%), and Security & Protection (10 | 0.3%).
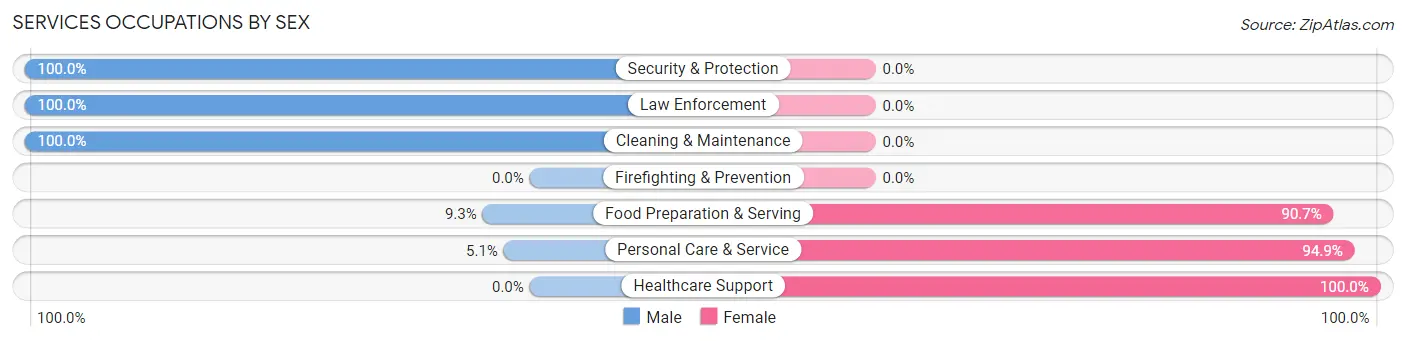
Services Occupations by Sex
Within the Services occupations in Crestwood, the most male-oriented occupations are Security & Protection (100.0%), Law Enforcement (100.0%), and Cleaning & Maintenance (100.0%), while the most female-oriented occupations are Healthcare Support (100.0%), Personal Care & Service (94.9%), and Food Preparation & Serving (90.7%).
| Occupation | Male | Female |
| Healthcare Support | 0 (0.0%) | 13 (100.0%) |
| Security & Protection | 10 (100.0%) | 0 (0.0%) |
| Firefighting & Prevention | 0 (0.0%) | 0 (0.0%) |
| Law Enforcement | 10 (100.0%) | 0 (0.0%) |
| Food Preparation & Serving | 15 (9.3%) | 146 (90.7%) |
| Cleaning & Maintenance | 68 (100.0%) | 0 (0.0%) |
| Personal Care & Service | 10 (5.1%) | 185 (94.9%) |
| Total (Category) | 103 (23.0%) | 344 (77.0%) |
| Total (Overall) | 1,630 (50.1%) | 1,620 (49.8%) |
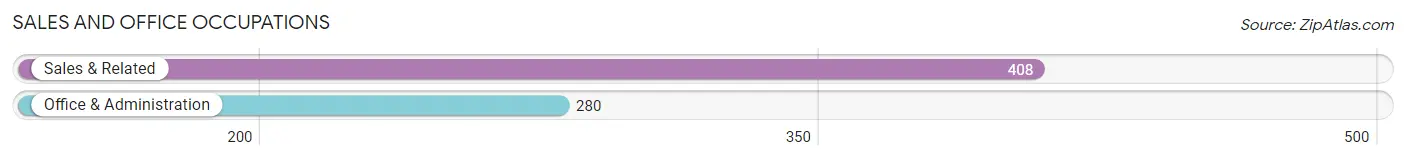
Sales and Office Occupations
The most common Sales and Office occupations in Crestwood are Sales & Related (408 | 12.6%), and Office & Administration (280 | 8.6%).
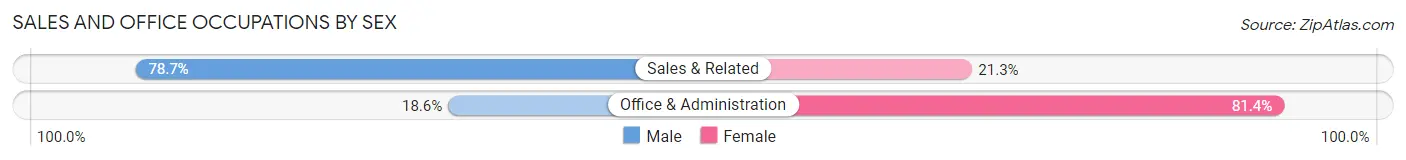
Sales and Office Occupations by Sex
| Occupation | Male | Female |
| Sales & Related | 321 (78.7%) | 87 (21.3%) |
| Office & Administration | 52 (18.6%) | 228 (81.4%) |
| Total (Category) | 373 (54.2%) | 315 (45.8%) |
| Total (Overall) | 1,630 (50.1%) | 1,620 (49.8%) |
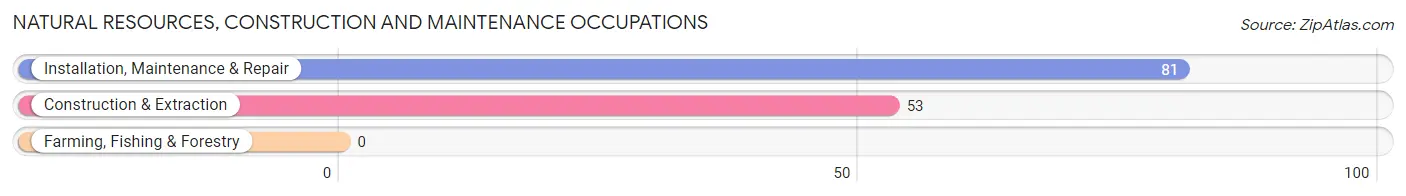
Natural Resources, Construction and Maintenance Occupations
The most common Natural Resources, Construction and Maintenance occupations in Crestwood are Installation, Maintenance & Repair (81 | 2.5%), and Construction & Extraction (53 | 1.6%).
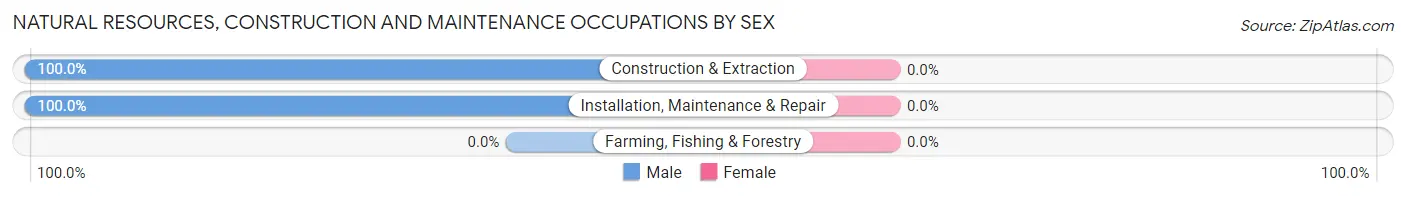
Natural Resources, Construction and Maintenance Occupations by Sex
| Occupation | Male | Female |
| Farming, Fishing & Forestry | 0 (0.0%) | 0 (0.0%) |
| Construction & Extraction | 53 (100.0%) | 0 (0.0%) |
| Installation, Maintenance & Repair | 81 (100.0%) | 0 (0.0%) |
| Total (Category) | 134 (100.0%) | 0 (0.0%) |
| Total (Overall) | 1,630 (50.1%) | 1,620 (49.8%) |
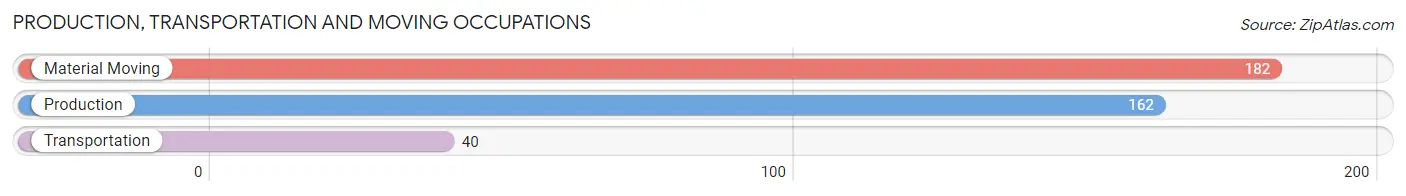
Production, Transportation and Moving Occupations
The most common Production, Transportation and Moving occupations in Crestwood are Material Moving (182 | 5.6%), Production (162 | 5.0%), and Transportation (40 | 1.2%).
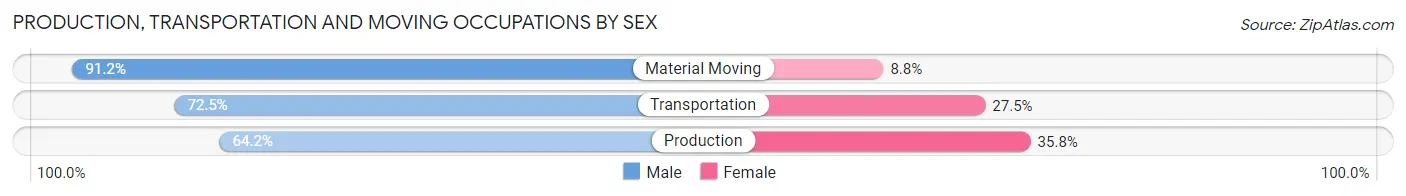
Production, Transportation and Moving Occupations by Sex
| Occupation | Male | Female |
| Production | 104 (64.2%) | 58 (35.8%) |
| Transportation | 29 (72.5%) | 11 (27.5%) |
| Material Moving | 166 (91.2%) | 16 (8.8%) |
| Total (Category) | 299 (77.9%) | 85 (22.1%) |
| Total (Overall) | 1,630 (50.1%) | 1,620 (49.8%) |
Employment Industries by Sex in Crestwood
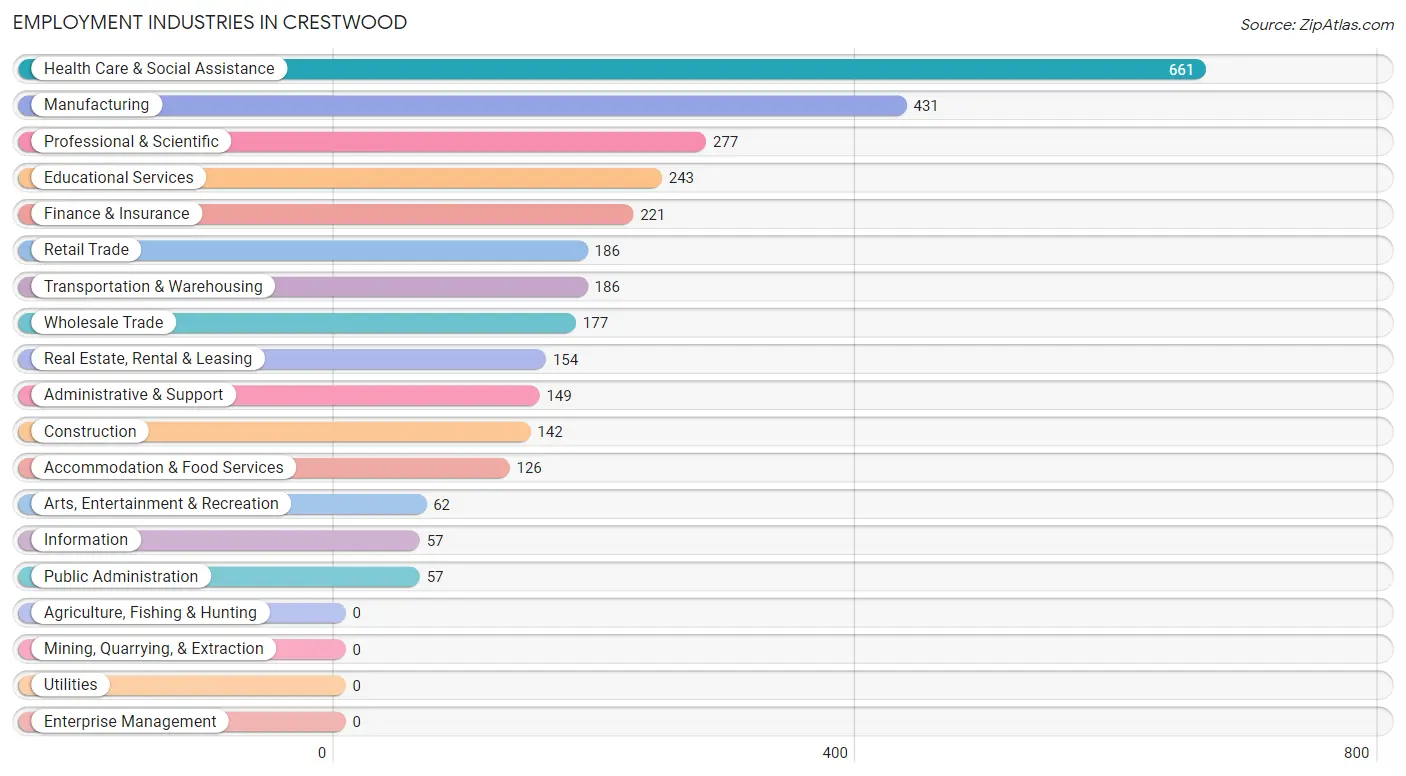
Employment Industries in Crestwood
The major employment industries in Crestwood include Health Care & Social Assistance (661 | 20.3%), Manufacturing (431 | 13.3%), Professional & Scientific (277 | 8.5%), Educational Services (243 | 7.5%), and Finance & Insurance (221 | 6.8%).
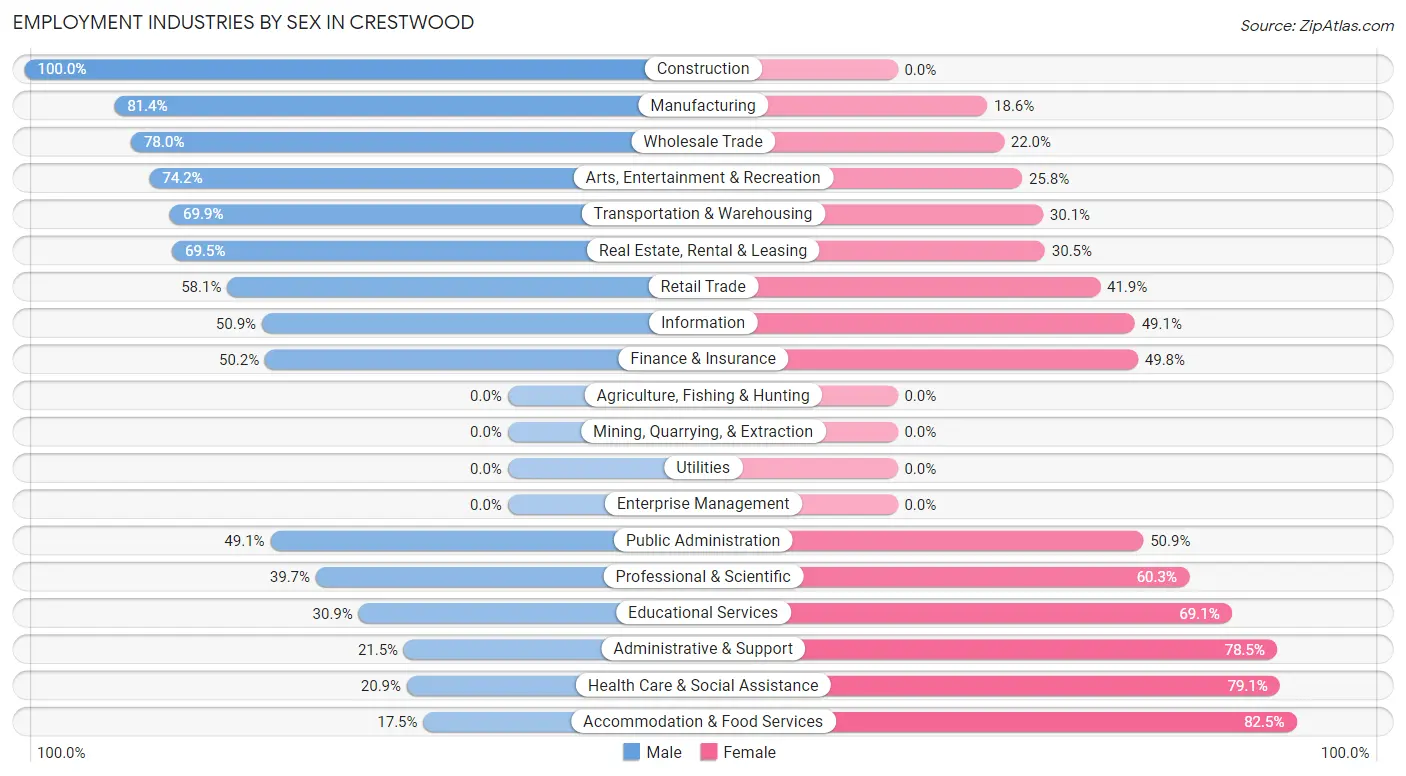
Employment Industries by Sex in Crestwood
The Crestwood industries that see more men than women are Construction (100.0%), Manufacturing (81.4%), and Wholesale Trade (78.0%), whereas the industries that tend to have a higher number of women are Accommodation & Food Services (82.5%), Health Care & Social Assistance (79.1%), and Administrative & Support (78.5%).
| Industry | Male | Female |
| Agriculture, Fishing & Hunting | 0 (0.0%) | 0 (0.0%) |
| Mining, Quarrying, & Extraction | 0 (0.0%) | 0 (0.0%) |
| Construction | 142 (100.0%) | 0 (0.0%) |
| Manufacturing | 351 (81.4%) | 80 (18.6%) |
| Wholesale Trade | 138 (78.0%) | 39 (22.0%) |
| Retail Trade | 108 (58.1%) | 78 (41.9%) |
| Transportation & Warehousing | 130 (69.9%) | 56 (30.1%) |
| Utilities | 0 (0.0%) | 0 (0.0%) |
| Information | 29 (50.9%) | 28 (49.1%) |
| Finance & Insurance | 111 (50.2%) | 110 (49.8%) |
| Real Estate, Rental & Leasing | 107 (69.5%) | 47 (30.5%) |
| Professional & Scientific | 110 (39.7%) | 167 (60.3%) |
| Enterprise Management | 0 (0.0%) | 0 (0.0%) |
| Administrative & Support | 32 (21.5%) | 117 (78.5%) |
| Educational Services | 75 (30.9%) | 168 (69.1%) |
| Health Care & Social Assistance | 138 (20.9%) | 523 (79.1%) |
| Arts, Entertainment & Recreation | 46 (74.2%) | 16 (25.8%) |
| Accommodation & Food Services | 22 (17.5%) | 104 (82.5%) |
| Public Administration | 28 (49.1%) | 29 (50.9%) |
| Total | 1,630 (50.1%) | 1,620 (49.8%) |
Education in Crestwood
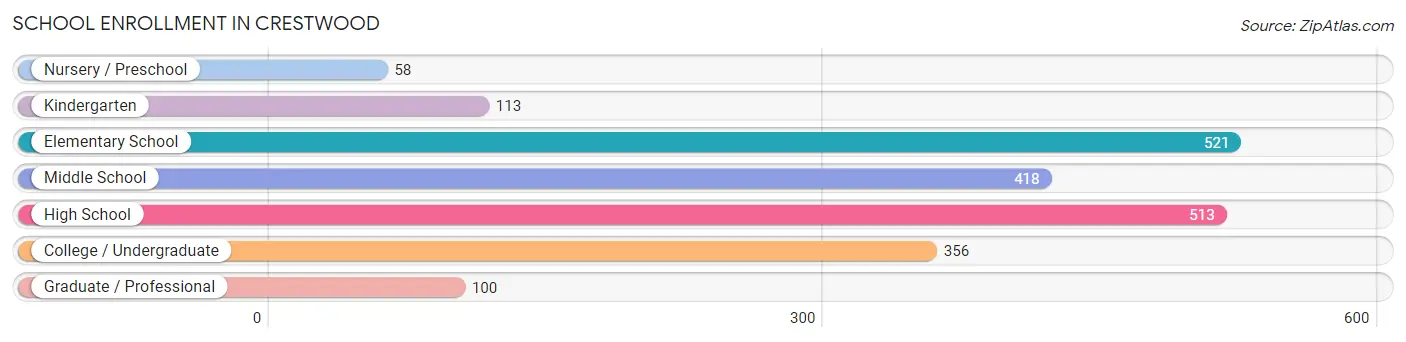
School Enrollment in Crestwood
The most common levels of schooling among the 2,079 students in Crestwood are elementary school (521 | 25.1%), high school (513 | 24.7%), and middle school (418 | 20.1%).
| School Level | # Students | % Students |
| Nursery / Preschool | 58 | 2.8% |
| Kindergarten | 113 | 5.4% |
| Elementary School | 521 | 25.1% |
| Middle School | 418 | 20.1% |
| High School | 513 | 24.7% |
| College / Undergraduate | 356 | 17.1% |
| Graduate / Professional | 100 | 4.8% |
| Total | 2,079 | 100.0% |
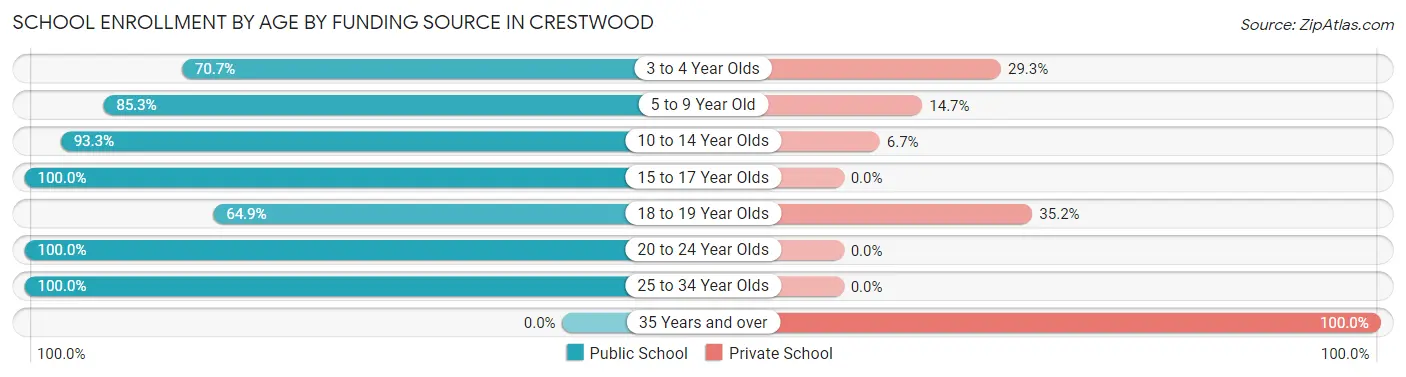
School Enrollment by Age by Funding Source in Crestwood
Out of a total of 2,079 students who are enrolled in schools in Crestwood, 274 (13.2%) attend a private institution, while the remaining 1,805 (86.8%) are enrolled in public schools. The age group of 35 years and over has the highest likelihood of being enrolled in private schools, with 34 (100.0% in the age bracket) enrolled. Conversely, the age group of 15 to 17 year olds has the lowest likelihood of being enrolled in a private school, with 365 (100.0% in the age bracket) attending a public institution.
| Age Bracket | Public School | Private School |
| 3 to 4 Year Olds | 41 (70.7%) | 17 (29.3%) |
| 5 to 9 Year Old | 495 (85.3%) | 85 (14.7%) |
| 10 to 14 Year Olds | 484 (93.3%) | 35 (6.7%) |
| 15 to 17 Year Olds | 365 (100.0%) | 0 (0.0%) |
| 18 to 19 Year Olds | 190 (64.8%) | 103 (35.1%) |
| 20 to 24 Year Olds | 89 (100.0%) | 0 (0.0%) |
| 25 to 34 Year Olds | 141 (100.0%) | 0 (0.0%) |
| 35 Years and over | 0 (0.0%) | 34 (100.0%) |
| Total | 1,805 (86.8%) | 274 (13.2%) |
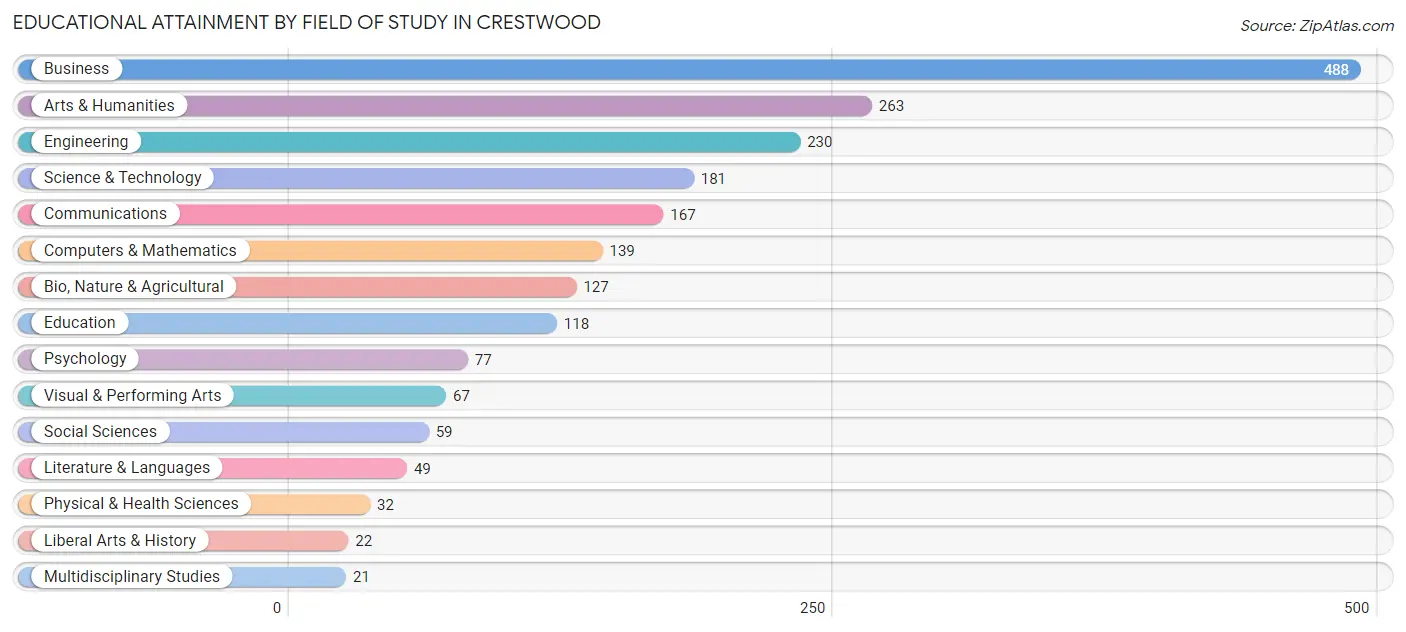
Educational Attainment by Field of Study in Crestwood
Business (488 | 23.9%), arts & humanities (263 | 12.9%), engineering (230 | 11.3%), science & technology (181 | 8.9%), and communications (167 | 8.2%) are the most common fields of study among 2,040 individuals in Crestwood who have obtained a bachelor's degree or higher.
| Field of Study | # Graduates | % Graduates |
| Computers & Mathematics | 139 | 6.8% |
| Bio, Nature & Agricultural | 127 | 6.2% |
| Physical & Health Sciences | 32 | 1.6% |
| Psychology | 77 | 3.8% |
| Social Sciences | 59 | 2.9% |
| Engineering | 230 | 11.3% |
| Multidisciplinary Studies | 21 | 1.0% |
| Science & Technology | 181 | 8.9% |
| Business | 488 | 23.9% |
| Education | 118 | 5.8% |
| Literature & Languages | 49 | 2.4% |
| Liberal Arts & History | 22 | 1.1% |
| Visual & Performing Arts | 67 | 3.3% |
| Communications | 167 | 8.2% |
| Arts & Humanities | 263 | 12.9% |
| Total | 2,040 | 100.0% |
Transportation & Commute in Crestwood
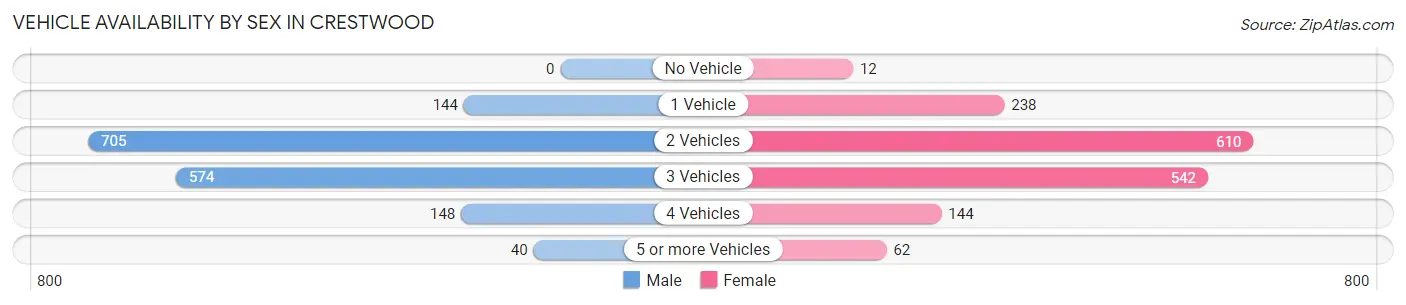
Vehicle Availability by Sex in Crestwood
The most prevalent vehicle ownership categories in Crestwood are males with 2 vehicles (705, accounting for 43.8%) and females with 2 vehicles (610, making up 43.8%).
| Vehicles Available | Male | Female |
| No Vehicle | 0 (0.0%) | 12 (0.7%) |
| 1 Vehicle | 144 (8.9%) | 238 (14.8%) |
| 2 Vehicles | 705 (43.8%) | 610 (37.9%) |
| 3 Vehicles | 574 (35.6%) | 542 (33.7%) |
| 4 Vehicles | 148 (9.2%) | 144 (9.0%) |
| 5 or more Vehicles | 40 (2.5%) | 62 (3.9%) |
| Total | 1,611 (100.0%) | 1,608 (100.0%) |
Commute Time in Crestwood
The most frequently occuring commute durations in Crestwood are 20 to 24 minutes (732 commuters, 25.4%), 30 to 34 minutes (552 commuters, 19.2%), and 35 to 39 minutes (325 commuters, 11.3%).
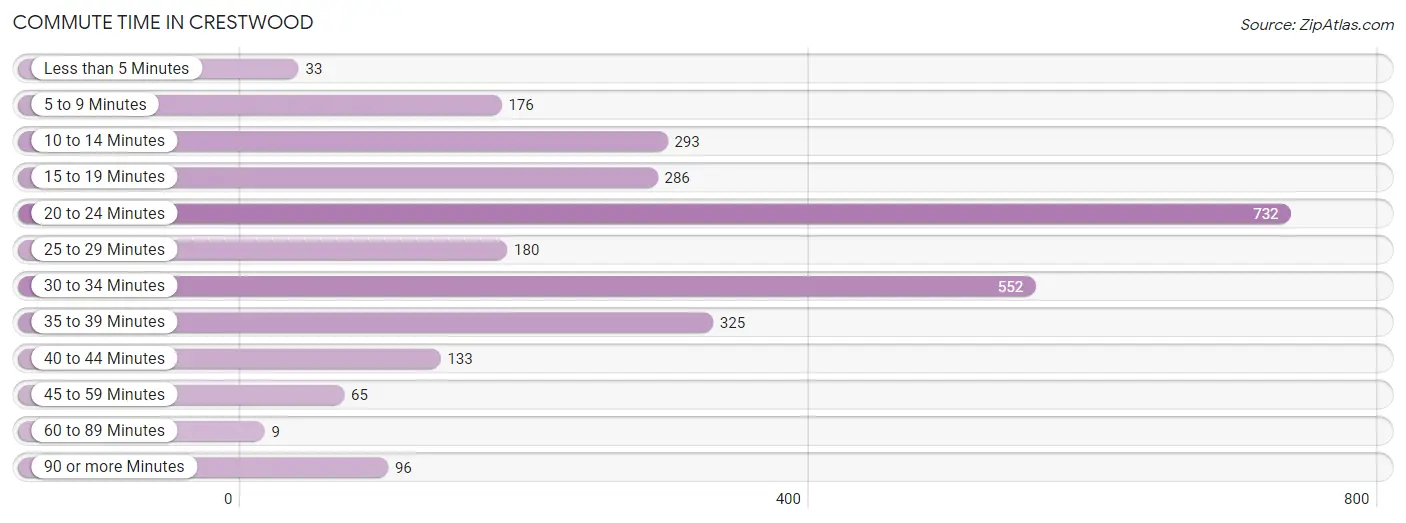
| Commute Time | # Commuters | % Commuters |
| Less than 5 Minutes | 33 | 1.1% |
| 5 to 9 Minutes | 176 | 6.1% |
| 10 to 14 Minutes | 293 | 10.2% |
| 15 to 19 Minutes | 286 | 9.9% |
| 20 to 24 Minutes | 732 | 25.4% |
| 25 to 29 Minutes | 180 | 6.2% |
| 30 to 34 Minutes | 552 | 19.2% |
| 35 to 39 Minutes | 325 | 11.3% |
| 40 to 44 Minutes | 133 | 4.6% |
| 45 to 59 Minutes | 65 | 2.3% |
| 60 to 89 Minutes | 9 | 0.3% |
| 90 or more Minutes | 96 | 3.3% |
Commute Time by Sex in Crestwood
The most common commute times in Crestwood are 20 to 24 minutes (403 commuters, 28.0%) for males and 20 to 24 minutes (329 commuters, 22.9%) for females.
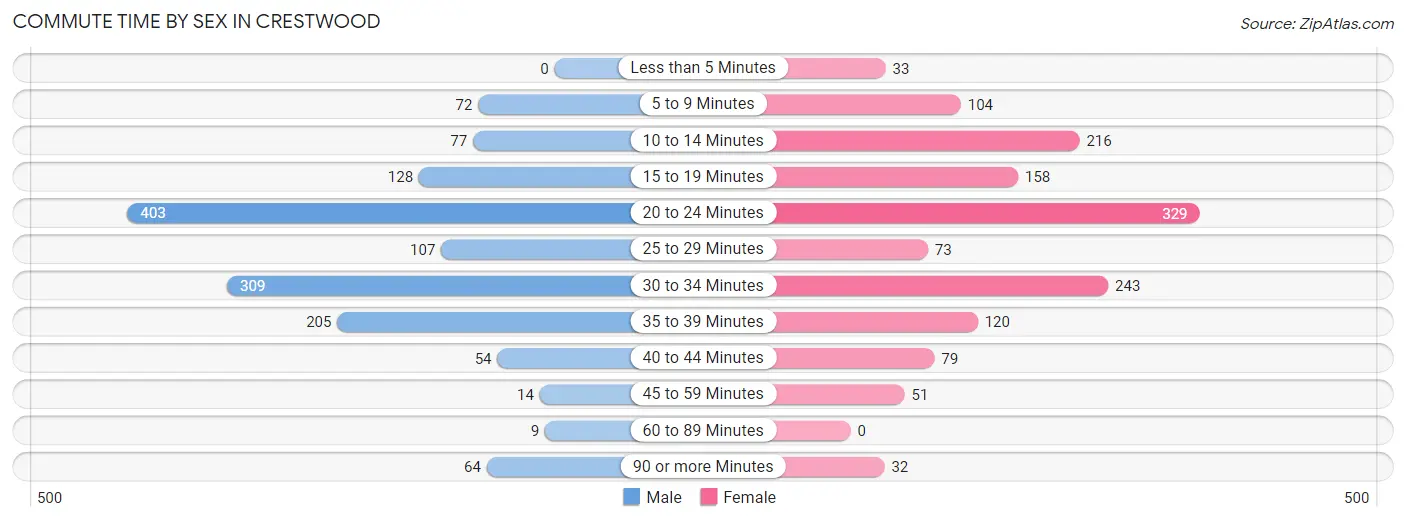
| Commute Time | Male | Female |
| Less than 5 Minutes | 0 (0.0%) | 33 (2.3%) |
| 5 to 9 Minutes | 72 (5.0%) | 104 (7.2%) |
| 10 to 14 Minutes | 77 (5.3%) | 216 (15.0%) |
| 15 to 19 Minutes | 128 (8.9%) | 158 (11.0%) |
| 20 to 24 Minutes | 403 (28.0%) | 329 (22.9%) |
| 25 to 29 Minutes | 107 (7.4%) | 73 (5.1%) |
| 30 to 34 Minutes | 309 (21.4%) | 243 (16.9%) |
| 35 to 39 Minutes | 205 (14.2%) | 120 (8.3%) |
| 40 to 44 Minutes | 54 (3.7%) | 79 (5.5%) |
| 45 to 59 Minutes | 14 (1.0%) | 51 (3.5%) |
| 60 to 89 Minutes | 9 (0.6%) | 0 (0.0%) |
| 90 or more Minutes | 64 (4.4%) | 32 (2.2%) |
Time of Departure to Work by Sex in Crestwood
The most frequent times of departure to work in Crestwood are 7:00 AM to 7:29 AM (280, 19.4%) for males and 7:00 AM to 7:29 AM (308, 21.4%) for females.
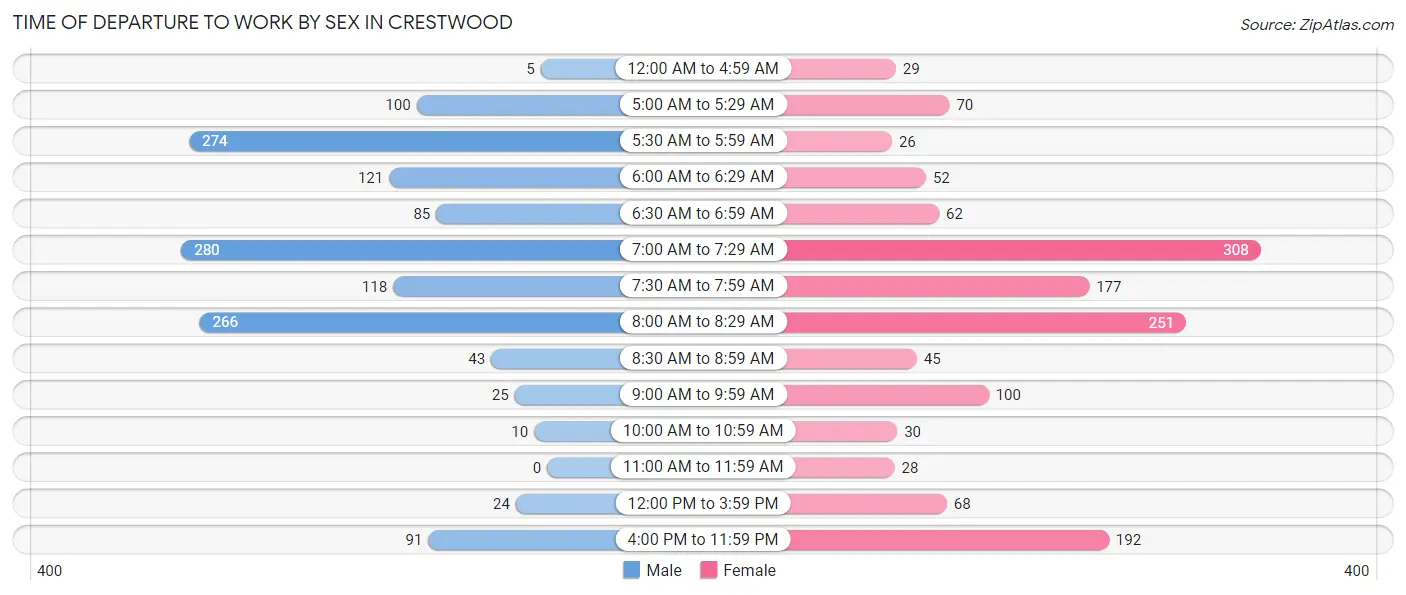
| Time of Departure | Male | Female |
| 12:00 AM to 4:59 AM | 5 (0.4%) | 29 (2.0%) |
| 5:00 AM to 5:29 AM | 100 (6.9%) | 70 (4.9%) |
| 5:30 AM to 5:59 AM | 274 (19.0%) | 26 (1.8%) |
| 6:00 AM to 6:29 AM | 121 (8.4%) | 52 (3.6%) |
| 6:30 AM to 6:59 AM | 85 (5.9%) | 62 (4.3%) |
| 7:00 AM to 7:29 AM | 280 (19.4%) | 308 (21.4%) |
| 7:30 AM to 7:59 AM | 118 (8.2%) | 177 (12.3%) |
| 8:00 AM to 8:29 AM | 266 (18.4%) | 251 (17.4%) |
| 8:30 AM to 8:59 AM | 43 (3.0%) | 45 (3.1%) |
| 9:00 AM to 9:59 AM | 25 (1.7%) | 100 (7.0%) |
| 10:00 AM to 10:59 AM | 10 (0.7%) | 30 (2.1%) |
| 11:00 AM to 11:59 AM | 0 (0.0%) | 28 (1.9%) |
| 12:00 PM to 3:59 PM | 24 (1.7%) | 68 (4.7%) |
| 4:00 PM to 11:59 PM | 91 (6.3%) | 192 (13.4%) |
| Total | 1,442 (100.0%) | 1,438 (100.0%) |
Housing Occupancy in Crestwood
Occupancy by Ownership in Crestwood
Of the total 2,120 dwellings in Crestwood, owner-occupied units account for 1,693 (79.9%), while renter-occupied units make up 427 (20.1%).
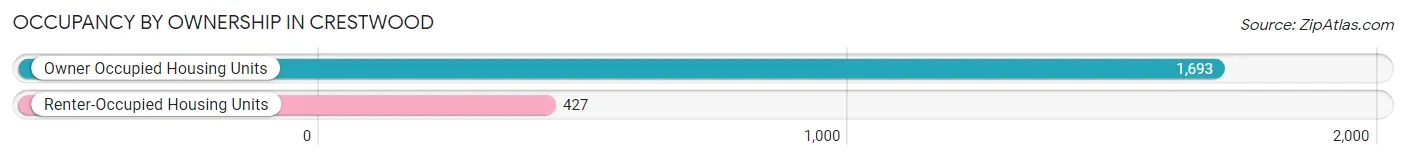
| Occupancy | # Housing Units | % Housing Units |
| Owner Occupied Housing Units | 1,693 | 79.9% |
| Renter-Occupied Housing Units | 427 | 20.1% |
| Total Occupied Housing Units | 2,120 | 100.0% |
Occupancy by Household Size in Crestwood
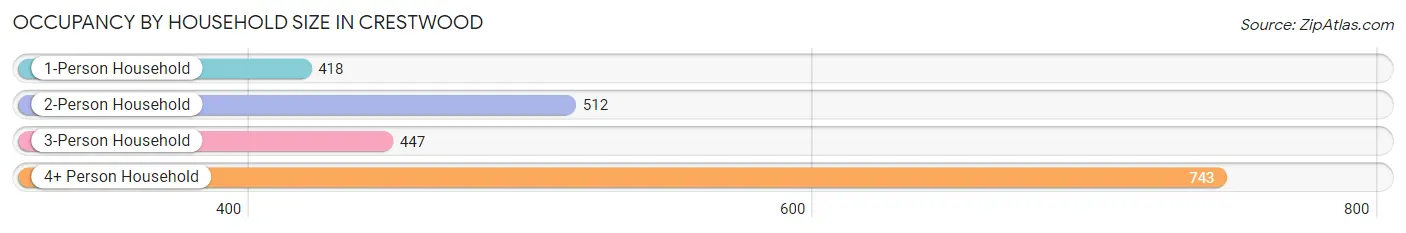
| Household Size | # Housing Units | % Housing Units |
| 1-Person Household | 418 | 19.7% |
| 2-Person Household | 512 | 24.1% |
| 3-Person Household | 447 | 21.1% |
| 4+ Person Household | 743 | 35.0% |
| Total Housing Units | 2,120 | 100.0% |
Occupancy by Ownership by Household Size in Crestwood
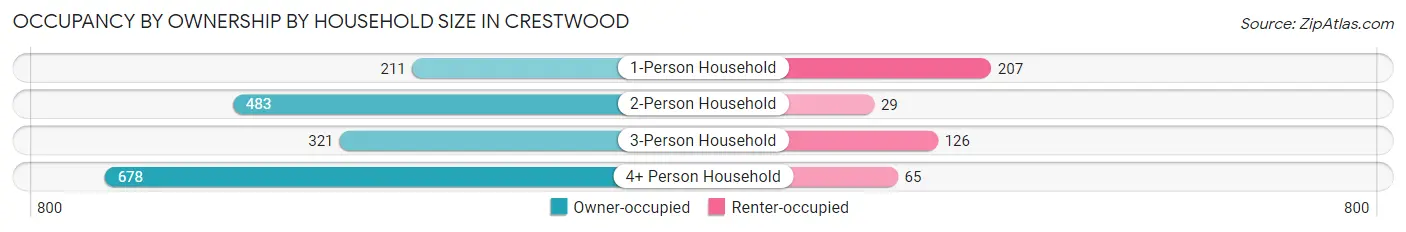
| Household Size | Owner-occupied | Renter-occupied |
| 1-Person Household | 211 (50.5%) | 207 (49.5%) |
| 2-Person Household | 483 (94.3%) | 29 (5.7%) |
| 3-Person Household | 321 (71.8%) | 126 (28.2%) |
| 4+ Person Household | 678 (91.2%) | 65 (8.7%) |
| Total Housing Units | 1,693 (79.9%) | 427 (20.1%) |
Occupancy by Educational Attainment in Crestwood
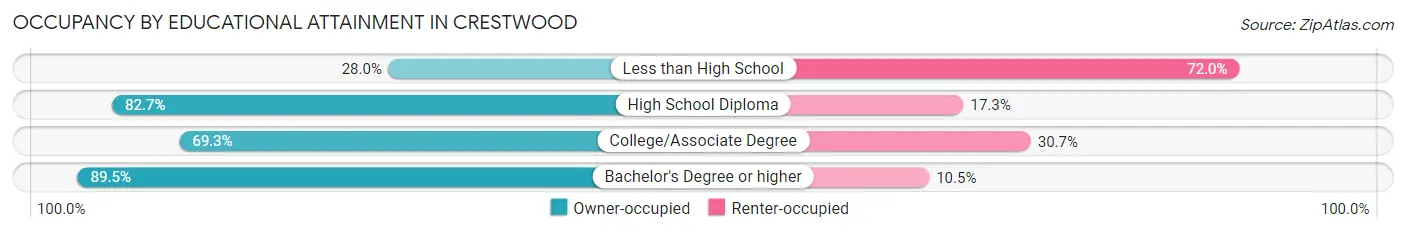
| Household Size | Owner-occupied | Renter-occupied |
| Less than High School | 14 (28.0%) | 36 (72.0%) |
| High School Diploma | 205 (82.7%) | 43 (17.3%) |
| College/Associate Degree | 538 (69.3%) | 238 (30.7%) |
| Bachelor's Degree or higher | 936 (89.5%) | 110 (10.5%) |
Occupancy by Age of Householder in Crestwood
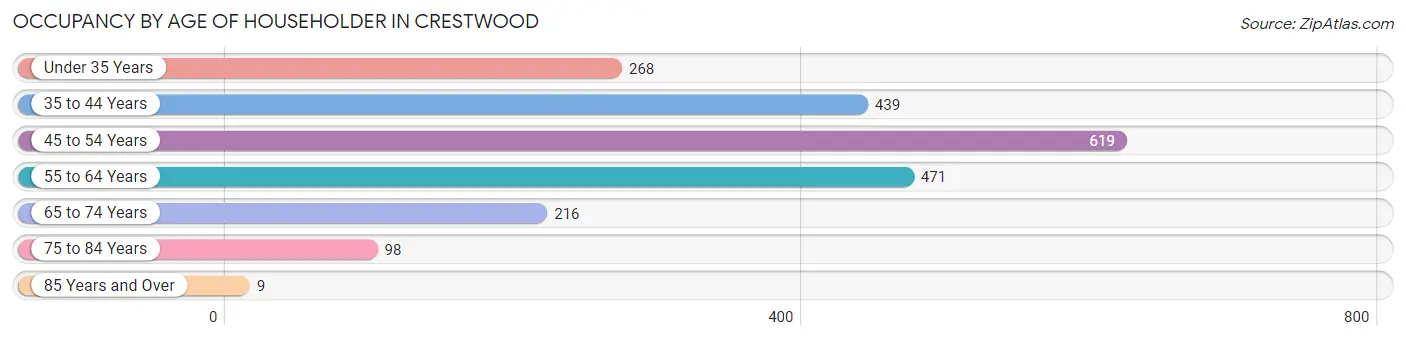
| Age Bracket | # Households | % Households |
| Under 35 Years | 268 | 12.6% |
| 35 to 44 Years | 439 | 20.7% |
| 45 to 54 Years | 619 | 29.2% |
| 55 to 64 Years | 471 | 22.2% |
| 65 to 74 Years | 216 | 10.2% |
| 75 to 84 Years | 98 | 4.6% |
| 85 Years and Over | 9 | 0.4% |
| Total | 2,120 | 100.0% |
Housing Finances in Crestwood
Median Income by Occupancy in Crestwood
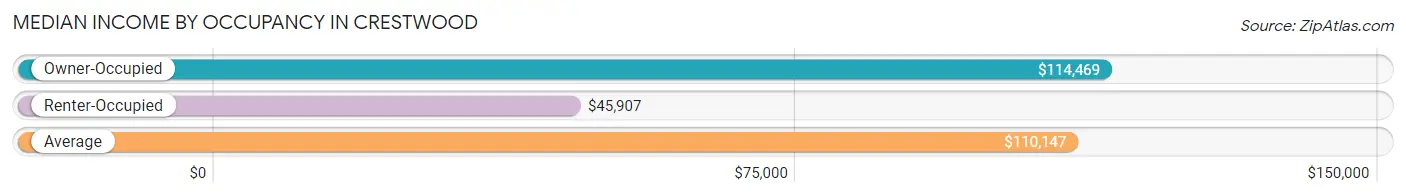
| Occupancy Type | # Households | Median Income |
| Owner-Occupied | 1,693 (79.9%) | $114,469 |
| Renter-Occupied | 427 (20.1%) | $45,907 |
| Average | 2,120 (100.0%) | $110,147 |
Occupancy by Householder Income Bracket in Crestwood
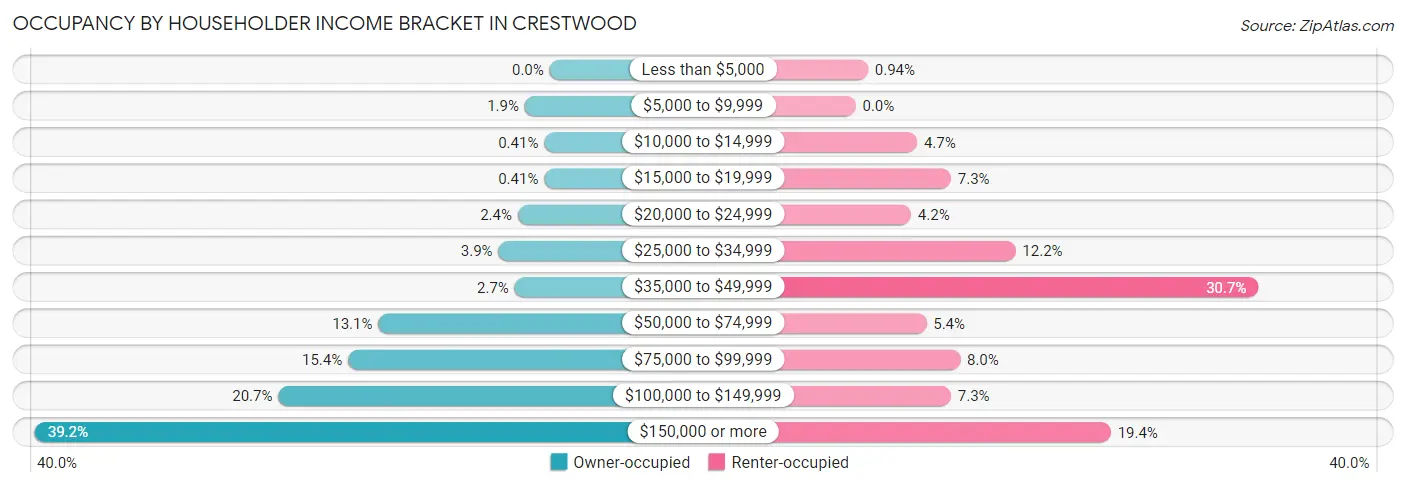
| Income Bracket | Owner-occupied | Renter-occupied |
| Less than $5,000 | 0 (0.0%) | 4 (0.9%) |
| $5,000 to $9,999 | 32 (1.9%) | 0 (0.0%) |
| $10,000 to $14,999 | 7 (0.4%) | 20 (4.7%) |
| $15,000 to $19,999 | 7 (0.4%) | 31 (7.3%) |
| $20,000 to $24,999 | 41 (2.4%) | 18 (4.2%) |
| $25,000 to $34,999 | 66 (3.9%) | 52 (12.2%) |
| $35,000 to $49,999 | 45 (2.7%) | 131 (30.7%) |
| $50,000 to $74,999 | 221 (13.1%) | 23 (5.4%) |
| $75,000 to $99,999 | 260 (15.4%) | 34 (8.0%) |
| $100,000 to $149,999 | 350 (20.7%) | 31 (7.3%) |
| $150,000 or more | 664 (39.2%) | 83 (19.4%) |
| Total | 1,693 (100.0%) | 427 (100.0%) |
Monthly Housing Cost Tiers in Crestwood
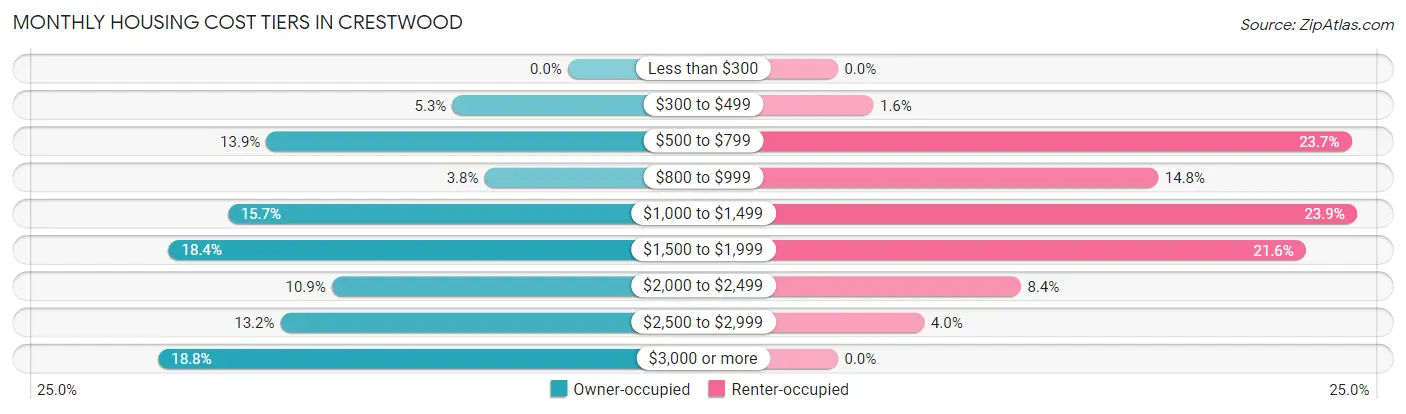
| Monthly Cost | Owner-occupied | Renter-occupied |
| Less than $300 | 0 (0.0%) | 0 (0.0%) |
| $300 to $499 | 90 (5.3%) | 7 (1.6%) |
| $500 to $799 | 235 (13.9%) | 101 (23.6%) |
| $800 to $999 | 65 (3.8%) | 63 (14.7%) |
| $1,000 to $1,499 | 265 (15.7%) | 102 (23.9%) |
| $1,500 to $1,999 | 311 (18.4%) | 92 (21.5%) |
| $2,000 to $2,499 | 184 (10.9%) | 36 (8.4%) |
| $2,500 to $2,999 | 224 (13.2%) | 17 (4.0%) |
| $3,000 or more | 319 (18.8%) | 0 (0.0%) |
| Total | 1,693 (100.0%) | 427 (100.0%) |
Physical Housing Characteristics in Crestwood
Housing Structures in Crestwood
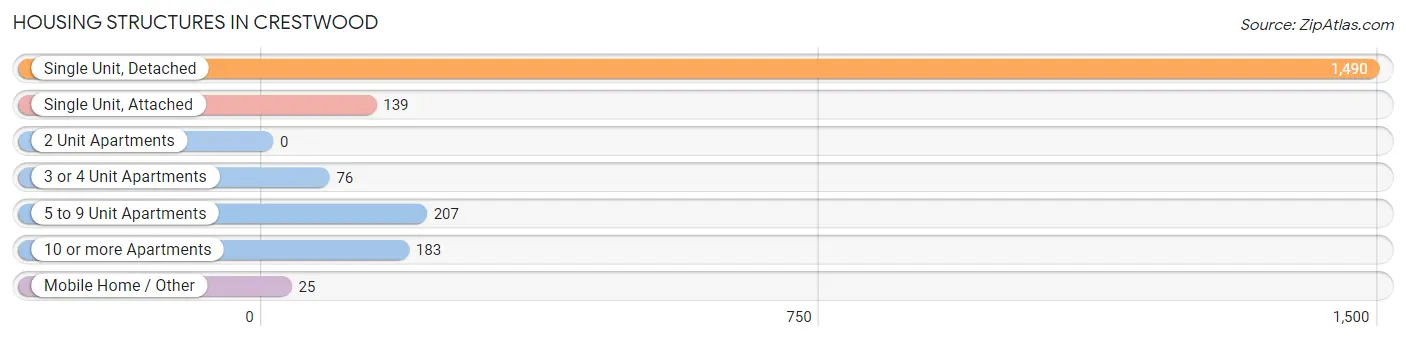
| Structure Type | # Housing Units | % Housing Units |
| Single Unit, Detached | 1,490 | 70.3% |
| Single Unit, Attached | 139 | 6.6% |
| 2 Unit Apartments | 0 | 0.0% |
| 3 or 4 Unit Apartments | 76 | 3.6% |
| 5 to 9 Unit Apartments | 207 | 9.8% |
| 10 or more Apartments | 183 | 8.6% |
| Mobile Home / Other | 25 | 1.2% |
| Total | 2,120 | 100.0% |
Housing Structures by Occupancy in Crestwood
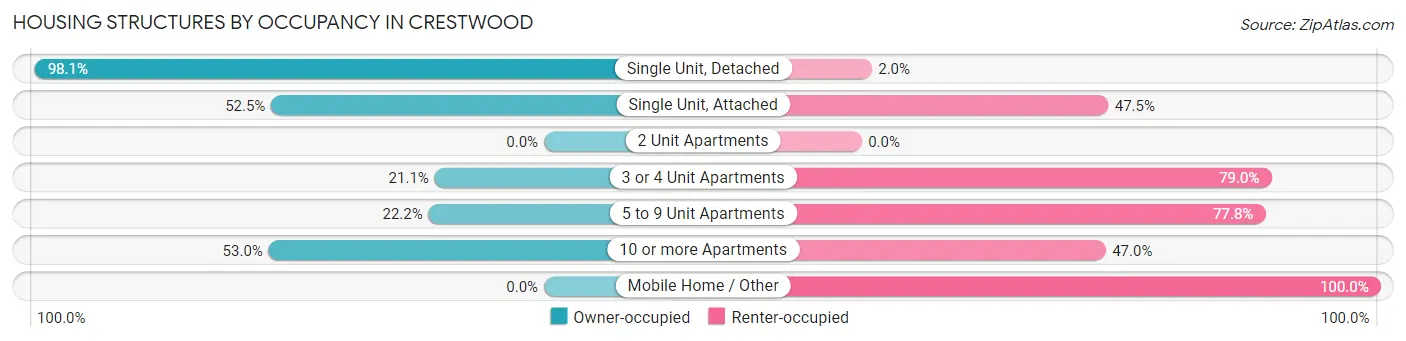
| Structure Type | Owner-occupied | Renter-occupied |
| Single Unit, Detached | 1,461 (98.1%) | 29 (1.9%) |
| Single Unit, Attached | 73 (52.5%) | 66 (47.5%) |
| 2 Unit Apartments | 0 (0.0%) | 0 (0.0%) |
| 3 or 4 Unit Apartments | 16 (21.0%) | 60 (78.9%) |
| 5 to 9 Unit Apartments | 46 (22.2%) | 161 (77.8%) |
| 10 or more Apartments | 97 (53.0%) | 86 (47.0%) |
| Mobile Home / Other | 0 (0.0%) | 25 (100.0%) |
| Total | 1,693 (79.9%) | 427 (20.1%) |
Housing Structures by Number of Rooms in Crestwood
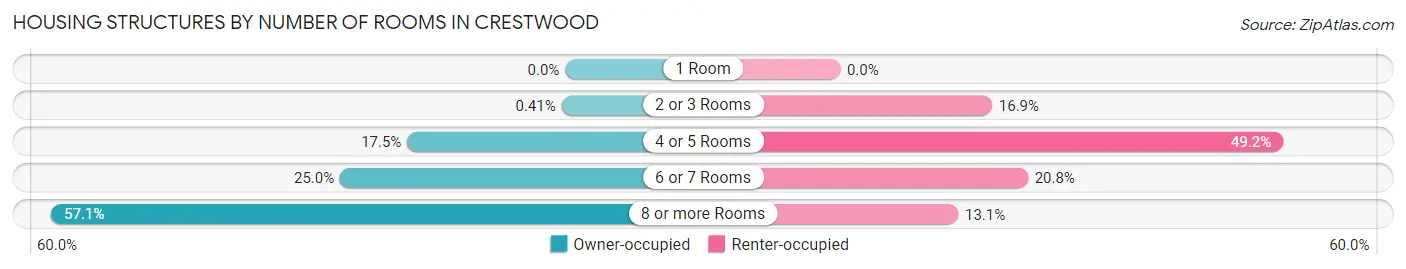
| Number of Rooms | Owner-occupied | Renter-occupied |
| 1 Room | 0 (0.0%) | 0 (0.0%) |
| 2 or 3 Rooms | 7 (0.4%) | 72 (16.9%) |
| 4 or 5 Rooms | 297 (17.5%) | 210 (49.2%) |
| 6 or 7 Rooms | 423 (25.0%) | 89 (20.8%) |
| 8 or more Rooms | 966 (57.1%) | 56 (13.1%) |
| Total | 1,693 (100.0%) | 427 (100.0%) |
Housing Structure by Heating Type in Crestwood
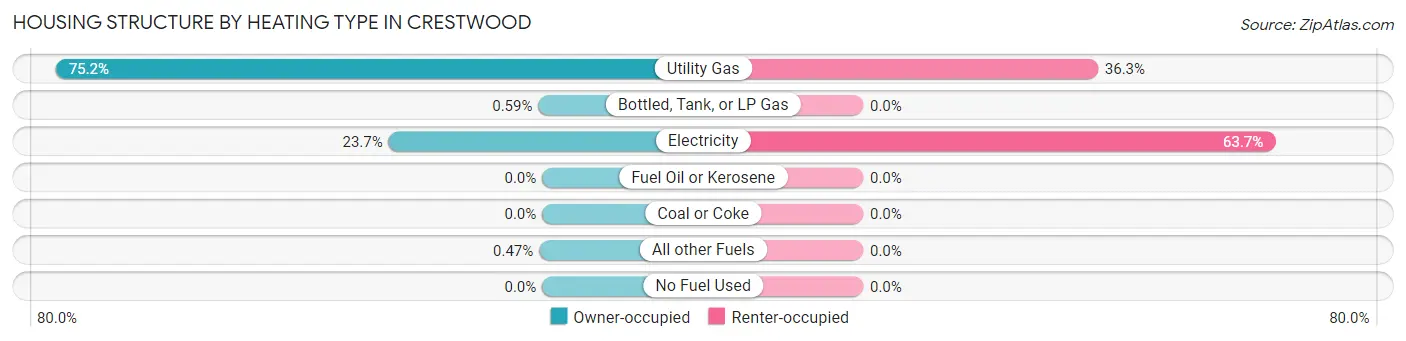
| Heating Type | Owner-occupied | Renter-occupied |
| Utility Gas | 1,273 (75.2%) | 155 (36.3%) |
| Bottled, Tank, or LP Gas | 10 (0.6%) | 0 (0.0%) |
| Electricity | 402 (23.7%) | 272 (63.7%) |
| Fuel Oil or Kerosene | 0 (0.0%) | 0 (0.0%) |
| Coal or Coke | 0 (0.0%) | 0 (0.0%) |
| All other Fuels | 8 (0.5%) | 0 (0.0%) |
| No Fuel Used | 0 (0.0%) | 0 (0.0%) |
| Total | 1,693 (100.0%) | 427 (100.0%) |
Household Vehicle Usage in Crestwood
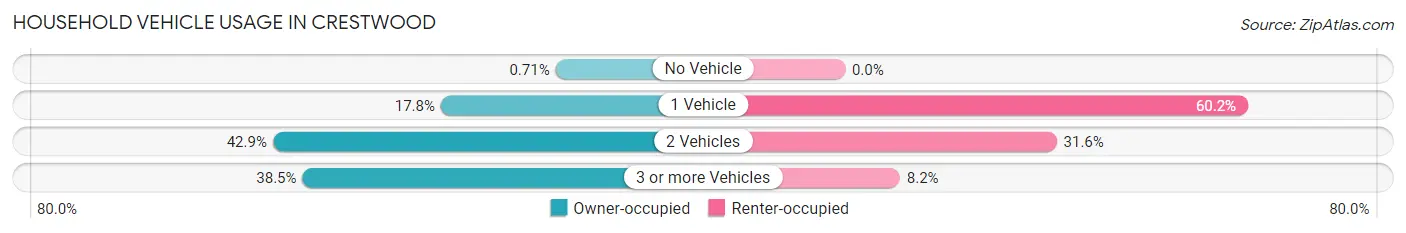
| Vehicles per Household | Owner-occupied | Renter-occupied |
| No Vehicle | 12 (0.7%) | 0 (0.0%) |
| 1 Vehicle | 302 (17.8%) | 257 (60.2%) |
| 2 Vehicles | 727 (42.9%) | 135 (31.6%) |
| 3 or more Vehicles | 652 (38.5%) | 35 (8.2%) |
| Total | 1,693 (100.0%) | 427 (100.0%) |
Real Estate & Mortgages in Crestwood
Real Estate and Mortgage Overview in Crestwood
| Characteristic | Without Mortgage | With Mortgage |
| Housing Units | 411 | 1,282 |
| Median Property Value | $277,600 | $356,200 |
| Median Household Income | $91,023 | $527 |
| Monthly Housing Costs | $704 | $319 |
| Real Estate Taxes | $2,288 | $17 |
Property Value by Mortgage Status in Crestwood
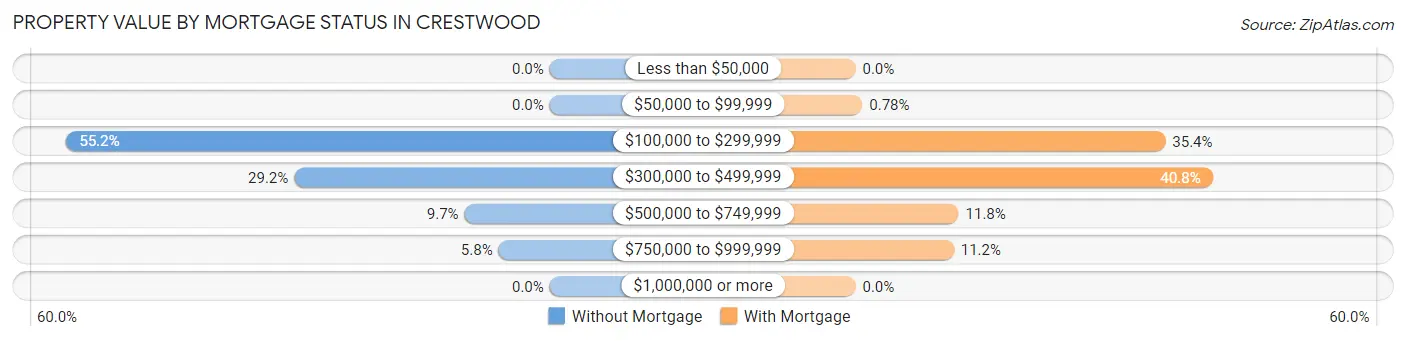
| Property Value | Without Mortgage | With Mortgage |
| Less than $50,000 | 0 (0.0%) | 0 (0.0%) |
| $50,000 to $99,999 | 0 (0.0%) | 10 (0.8%) |
| $100,000 to $299,999 | 227 (55.2%) | 454 (35.4%) |
| $300,000 to $499,999 | 120 (29.2%) | 523 (40.8%) |
| $500,000 to $749,999 | 40 (9.7%) | 151 (11.8%) |
| $750,000 to $999,999 | 24 (5.8%) | 144 (11.2%) |
| $1,000,000 or more | 0 (0.0%) | 0 (0.0%) |
| Total | 411 (100.0%) | 1,282 (100.0%) |
Household Income by Mortgage Status in Crestwood
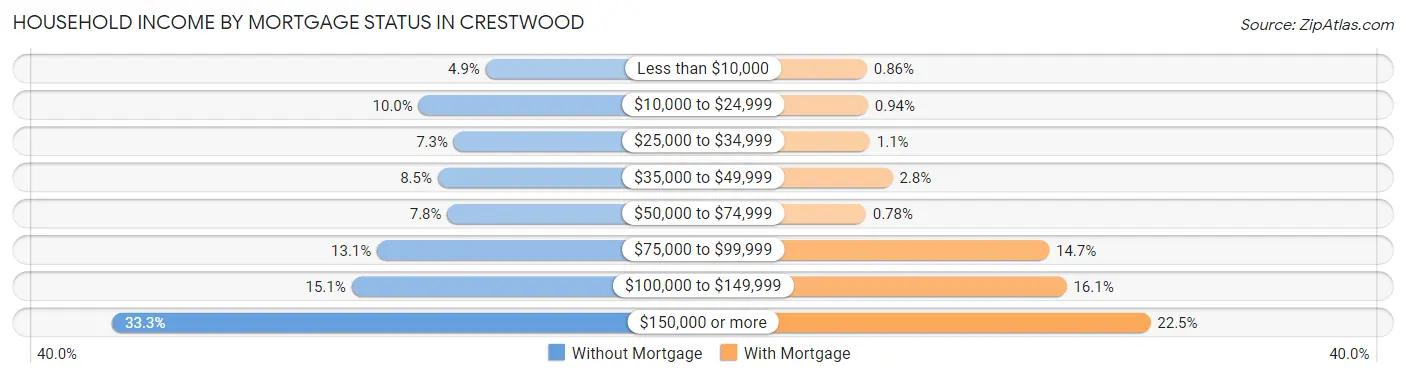
| Household Income | Without Mortgage | With Mortgage |
| Less than $10,000 | 20 (4.9%) | 11 (0.9%) |
| $10,000 to $24,999 | 41 (10.0%) | 12 (0.9%) |
| $25,000 to $34,999 | 30 (7.3%) | 14 (1.1%) |
| $35,000 to $49,999 | 35 (8.5%) | 36 (2.8%) |
| $50,000 to $74,999 | 32 (7.8%) | 10 (0.8%) |
| $75,000 to $99,999 | 54 (13.1%) | 189 (14.7%) |
| $100,000 to $149,999 | 62 (15.1%) | 206 (16.1%) |
| $150,000 or more | 137 (33.3%) | 288 (22.5%) |
| Total | 411 (100.0%) | 1,282 (100.0%) |
Property Value to Household Income Ratio in Crestwood
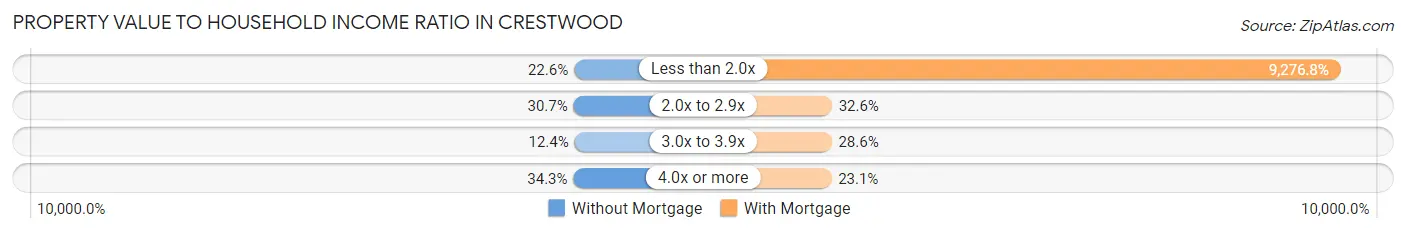
| Value-to-Income Ratio | Without Mortgage | With Mortgage |
| Less than 2.0x | 93 (22.6%) | 118,929 (9,276.8%) |
| 2.0x to 2.9x | 126 (30.7%) | 418 (32.6%) |
| 3.0x to 3.9x | 51 (12.4%) | 366 (28.5%) |
| 4.0x or more | 141 (34.3%) | 296 (23.1%) |
| Total | 411 (100.0%) | 1,282 (100.0%) |
Real Estate Taxes by Mortgage Status in Crestwood
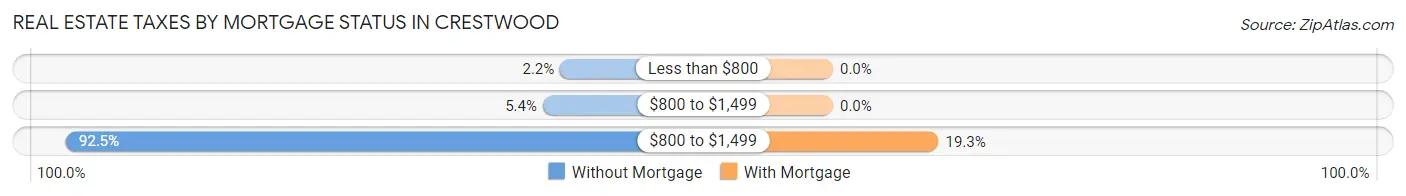
| Property Taxes | Without Mortgage | With Mortgage |
| Less than $800 | 9 (2.2%) | 0 (0.0%) |
| $800 to $1,499 | 22 (5.3%) | 0 (0.0%) |
| $800 to $1,499 | 380 (92.5%) | 247 (19.3%) |
| Total | 411 (100.0%) | 1,282 (100.0%) |
Health & Disability in Crestwood
Health Insurance Coverage by Age in Crestwood
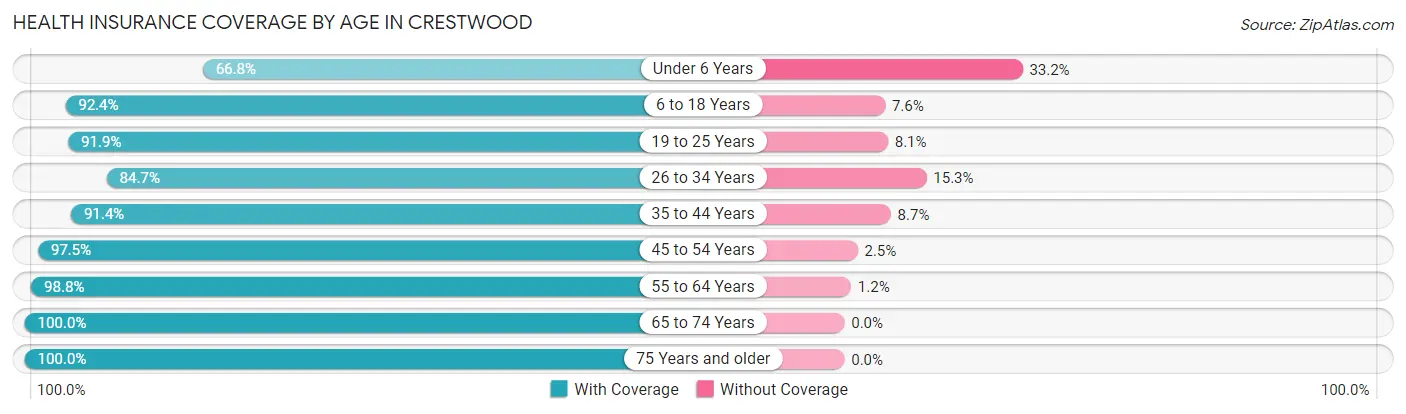
| Age Bracket | With Coverage | Without Coverage |
| Under 6 Years | 195 (66.8%) | 97 (33.2%) |
| 6 to 18 Years | 1,583 (92.4%) | 130 (7.6%) |
| 19 to 25 Years | 340 (91.9%) | 30 (8.1%) |
| 26 to 34 Years | 404 (84.7%) | 73 (15.3%) |
| 35 to 44 Years | 834 (91.3%) | 79 (8.6%) |
| 45 to 54 Years | 1,065 (97.5%) | 27 (2.5%) |
| 55 to 64 Years | 720 (98.8%) | 9 (1.2%) |
| 65 to 74 Years | 348 (100.0%) | 0 (0.0%) |
| 75 Years and older | 236 (100.0%) | 0 (0.0%) |
| Total | 5,725 (92.8%) | 445 (7.2%) |
Health Insurance Coverage by Citizenship Status in Crestwood
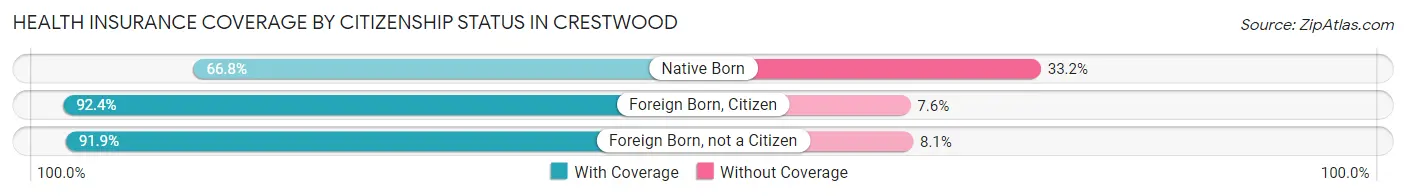
| Citizenship Status | With Coverage | Without Coverage |
| Native Born | 195 (66.8%) | 97 (33.2%) |
| Foreign Born, Citizen | 1,583 (92.4%) | 130 (7.6%) |
| Foreign Born, not a Citizen | 340 (91.9%) | 30 (8.1%) |
Health Insurance Coverage by Household Income in Crestwood
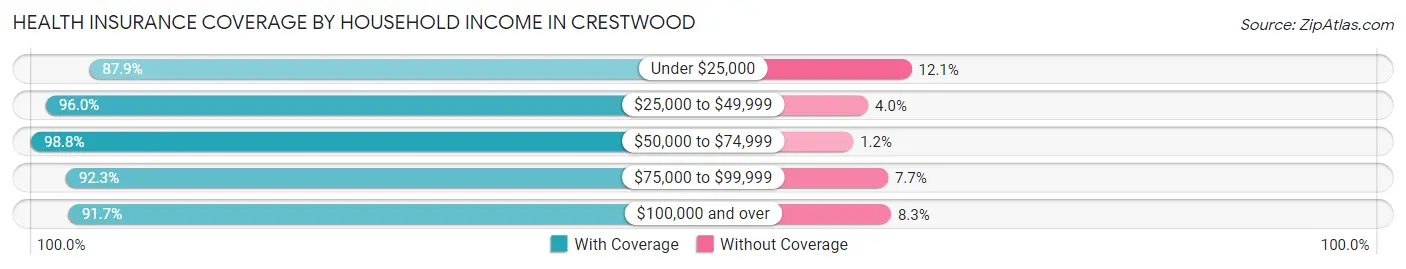
| Household Income | With Coverage | Without Coverage |
| Under $25,000 | 275 (87.9%) | 38 (12.1%) |
| $25,000 to $49,999 | 432 (96.0%) | 18 (4.0%) |
| $50,000 to $74,999 | 733 (98.8%) | 9 (1.2%) |
| $75,000 to $99,999 | 837 (92.3%) | 70 (7.7%) |
| $100,000 and over | 3,438 (91.7%) | 310 (8.3%) |
Public vs Private Health Insurance Coverage by Age in Crestwood
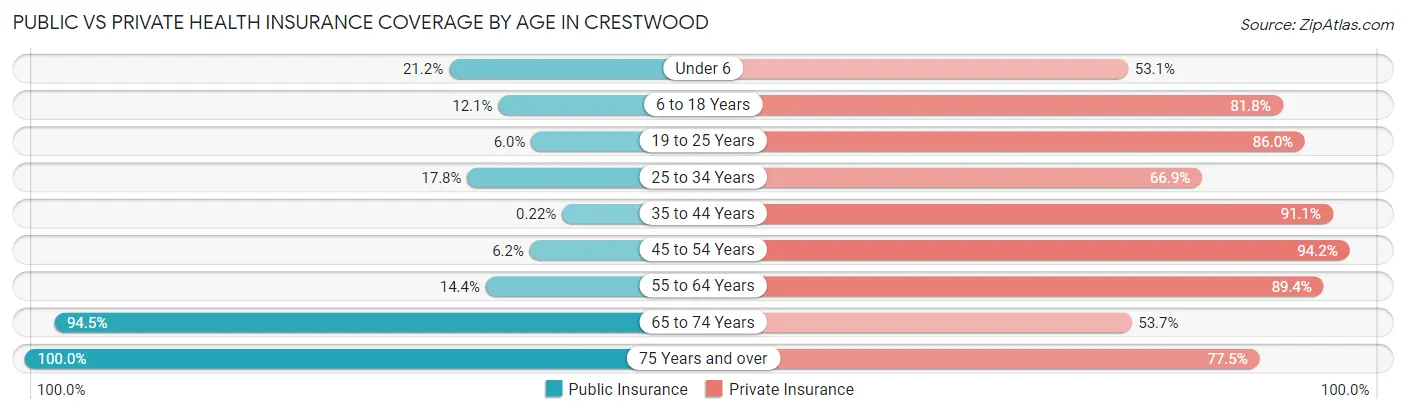
| Age Bracket | Public Insurance | Private Insurance |
| Under 6 | 62 (21.2%) | 155 (53.1%) |
| 6 to 18 Years | 207 (12.1%) | 1,401 (81.8%) |
| 19 to 25 Years | 22 (5.9%) | 318 (86.0%) |
| 25 to 34 Years | 85 (17.8%) | 319 (66.9%) |
| 35 to 44 Years | 2 (0.2%) | 832 (91.1%) |
| 45 to 54 Years | 68 (6.2%) | 1,029 (94.2%) |
| 55 to 64 Years | 105 (14.4%) | 652 (89.4%) |
| 65 to 74 Years | 329 (94.5%) | 187 (53.7%) |
| 75 Years and over | 236 (100.0%) | 183 (77.5%) |
| Total | 1,116 (18.1%) | 5,076 (82.3%) |
Disability Status by Sex by Age in Crestwood
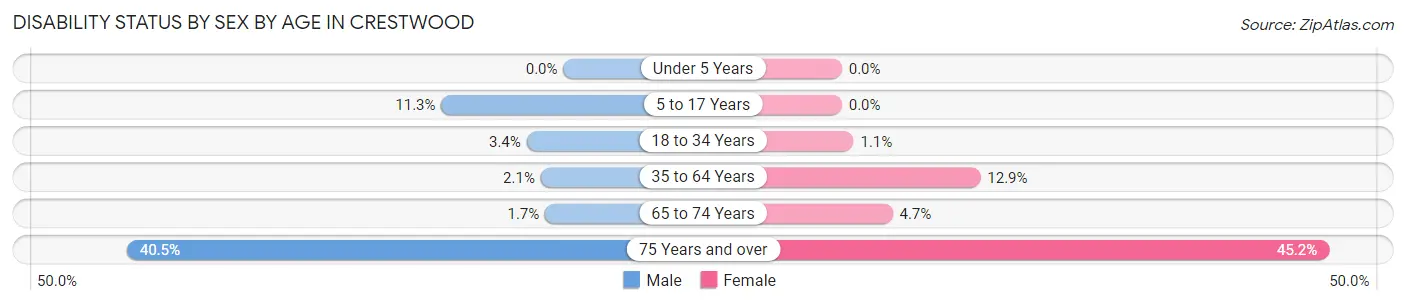
| Age Bracket | Male | Female |
| Under 5 Years | 0 (0.0%) | 0 (0.0%) |
| 5 to 17 Years | 61 (11.3%) | 0 (0.0%) |
| 18 to 34 Years | 15 (3.4%) | 7 (1.1%) |
| 35 to 64 Years | 28 (2.1%) | 180 (12.9%) |
| 65 to 74 Years | 3 (1.7%) | 8 (4.7%) |
| 75 Years and over | 32 (40.5%) | 71 (45.2%) |
Disability Class by Sex by Age in Crestwood
Disability Class: Hearing Difficulty
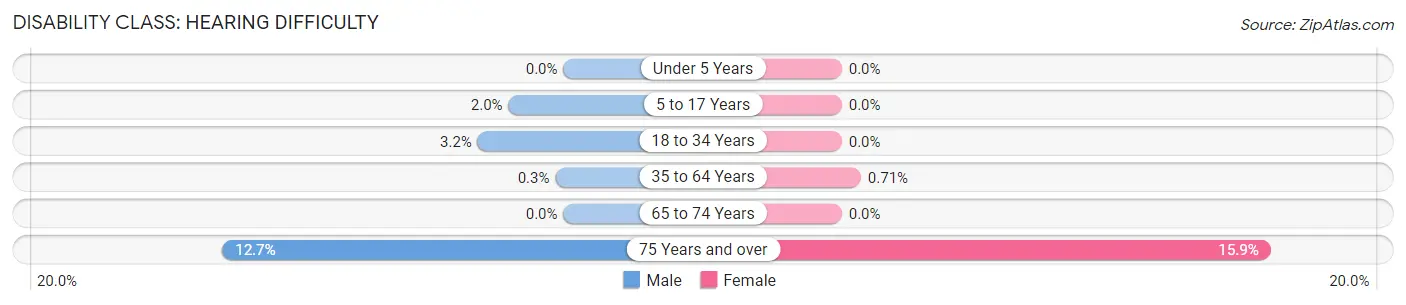
| Age Bracket | Male | Female |
| Under 5 Years | 0 (0.0%) | 0 (0.0%) |
| 5 to 17 Years | 11 (2.0%) | 0 (0.0%) |
| 18 to 34 Years | 14 (3.2%) | 0 (0.0%) |
| 35 to 64 Years | 4 (0.3%) | 10 (0.7%) |
| 65 to 74 Years | 0 (0.0%) | 0 (0.0%) |
| 75 Years and over | 10 (12.7%) | 25 (15.9%) |
Disability Class: Vision Difficulty
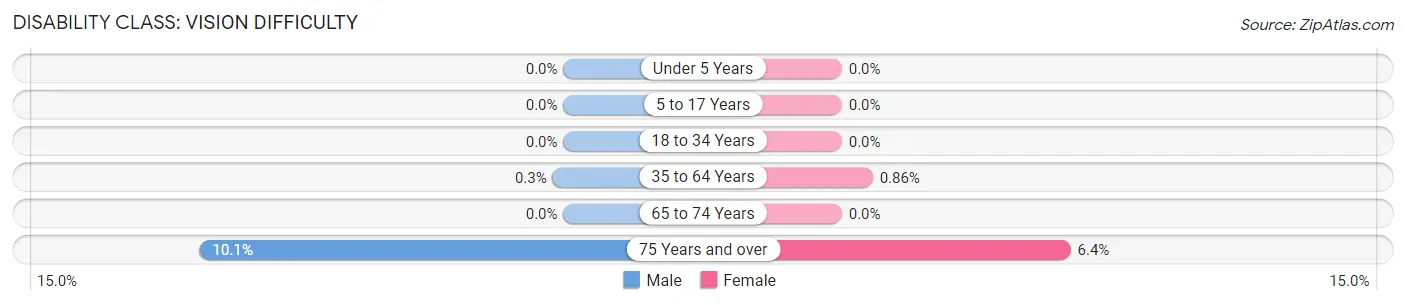
| Age Bracket | Male | Female |
| Under 5 Years | 0 (0.0%) | 0 (0.0%) |
| 5 to 17 Years | 0 (0.0%) | 0 (0.0%) |
| 18 to 34 Years | 0 (0.0%) | 0 (0.0%) |
| 35 to 64 Years | 4 (0.3%) | 12 (0.9%) |
| 65 to 74 Years | 0 (0.0%) | 0 (0.0%) |
| 75 Years and over | 8 (10.1%) | 10 (6.4%) |
Disability Class: Cognitive Difficulty
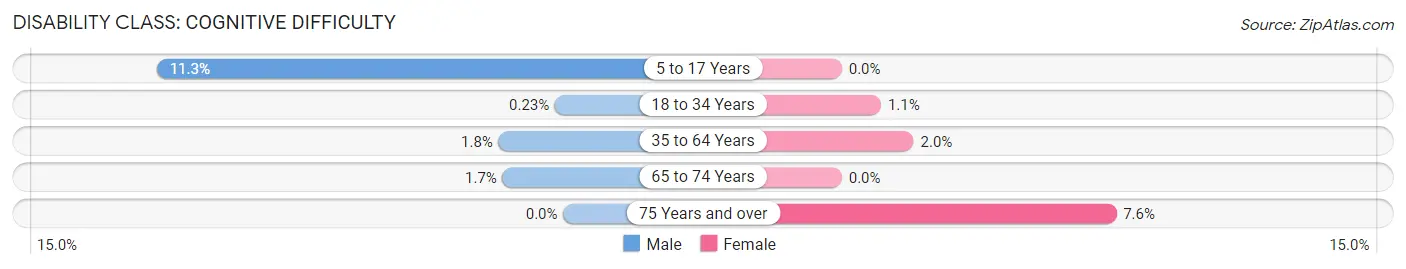
| Age Bracket | Male | Female |
| 5 to 17 Years | 61 (11.3%) | 0 (0.0%) |
| 18 to 34 Years | 1 (0.2%) | 7 (1.1%) |
| 35 to 64 Years | 24 (1.8%) | 28 (2.0%) |
| 65 to 74 Years | 3 (1.7%) | 0 (0.0%) |
| 75 Years and over | 0 (0.0%) | 12 (7.6%) |
Disability Class: Ambulatory Difficulty
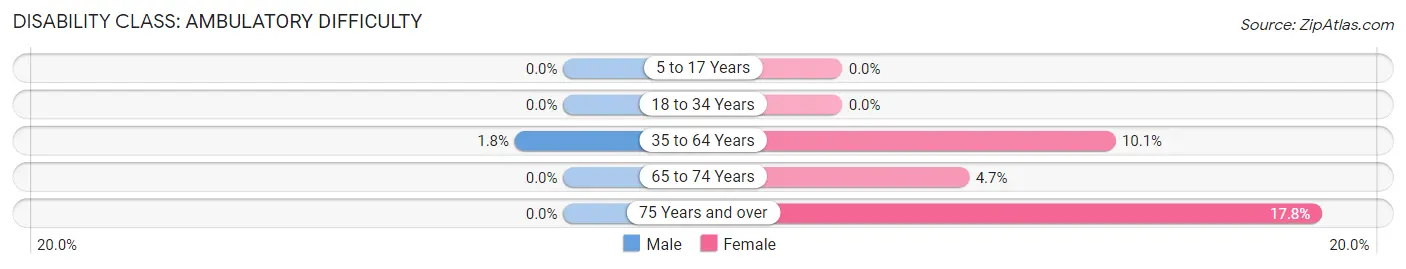
| Age Bracket | Male | Female |
| 5 to 17 Years | 0 (0.0%) | 0 (0.0%) |
| 18 to 34 Years | 0 (0.0%) | 0 (0.0%) |
| 35 to 64 Years | 24 (1.8%) | 142 (10.1%) |
| 65 to 74 Years | 0 (0.0%) | 8 (4.7%) |
| 75 Years and over | 0 (0.0%) | 28 (17.8%) |
Disability Class: Self-Care Difficulty
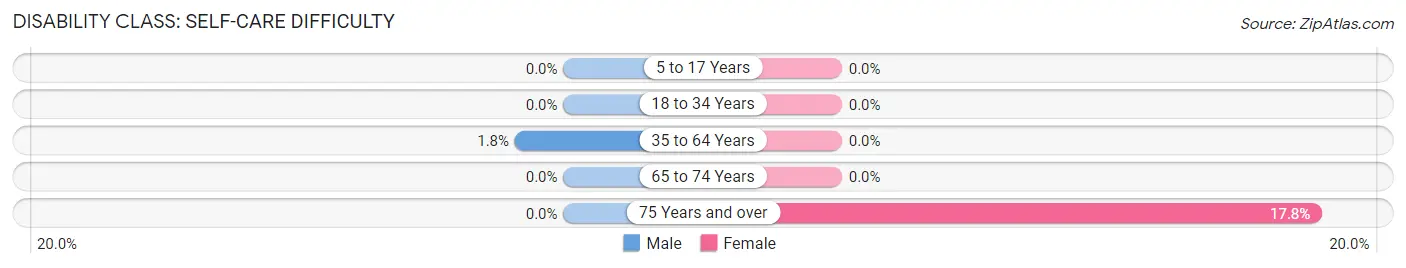
| Age Bracket | Male | Female |
| 5 to 17 Years | 0 (0.0%) | 0 (0.0%) |
| 18 to 34 Years | 0 (0.0%) | 0 (0.0%) |
| 35 to 64 Years | 24 (1.8%) | 0 (0.0%) |
| 65 to 74 Years | 0 (0.0%) | 0 (0.0%) |
| 75 Years and over | 0 (0.0%) | 28 (17.8%) |
Technology Access in Crestwood
Computing Device Access in Crestwood
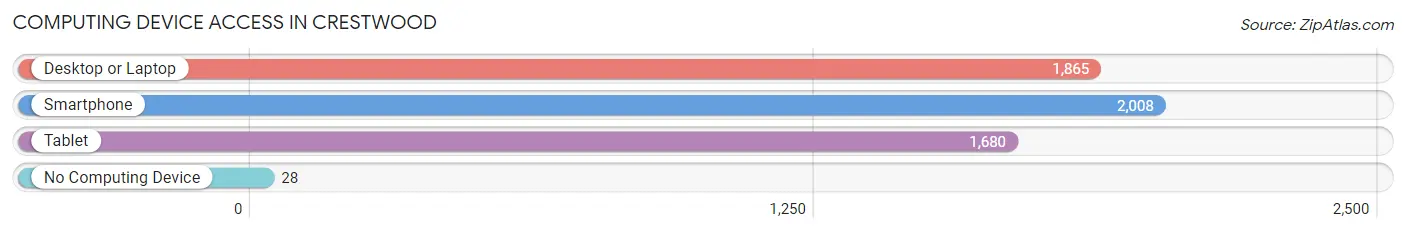
| Device Type | # Households | % Households |
| Desktop or Laptop | 1,865 | 88.0% |
| Smartphone | 2,008 | 94.7% |
| Tablet | 1,680 | 79.2% |
| No Computing Device | 28 | 1.3% |
| Total | 2,120 | 100.0% |
Internet Access in Crestwood
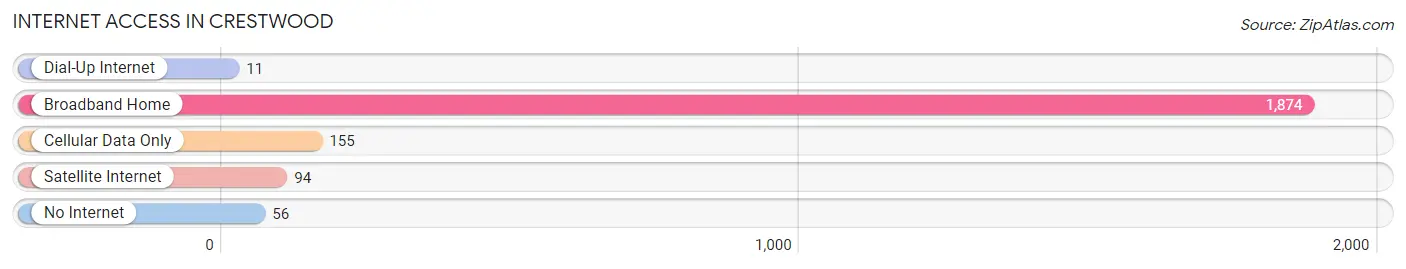
| Internet Type | # Households | % Households |
| Dial-Up Internet | 11 | 0.5% |
| Broadband Home | 1,874 | 88.4% |
| Cellular Data Only | 155 | 7.3% |
| Satellite Internet | 94 | 4.4% |
| No Internet | 56 | 2.6% |
| Total | 2,120 | 100.0% |
Crestwood Summary
Crestwood, Kentucky is a small city located in Oldham County, Kentucky. It is situated about 20 miles northeast of Louisville and is part of the Louisville metropolitan area. The city has a population of approximately 6,000 people and is known for its rural charm and small-town atmosphere.
History
Crestwood was first settled in the early 1800s by a group of settlers from Pennsylvania. The town was originally known as “Crestwood Station” and was a stop on the Louisville and Nashville Railroad. The town was officially incorporated in 1872 and was named after the nearby crest of a hill.
In the late 1800s, Crestwood was a thriving agricultural community. The town was home to several farms, a grist mill, a sawmill, and a general store. The town also had a post office, a school, and a church.
In the early 1900s, Crestwood began to experience a period of growth and development. The town was home to several businesses, including a bank, a hotel, a movie theater, and a variety of stores. The town also had a library, a fire department, and a police department.
Geography
Crestwood is located in Oldham County, Kentucky. The city is situated on the banks of the Ohio River and is surrounded by rolling hills and farmland. The city is located about 20 miles northeast of Louisville and is part of the Louisville metropolitan area.
The city has a total area of 4.2 square miles, all of which is land. The city has a humid subtropical climate, with hot, humid summers and mild winters. The average annual temperature is around 60 degrees Fahrenheit.
Economy
Crestwood’s economy is largely based on agriculture and manufacturing. The city is home to several farms, as well as a variety of manufacturing businesses. The city is also home to a number of retail stores, restaurants, and other businesses.
The city is also home to a number of educational institutions, including a community college and a technical school. The city is also home to a number of medical facilities, including a hospital and several clinics.
Demographics
As of the 2010 census, Crestwood had a population of 6,000 people. The racial makeup of the city was 94.3% White, 2.2% African American, 0.3% Native American, 0.7% Asian, 0.1% Pacific Islander, and 2.4% from other races. Hispanic or Latino of any race were 2.7% of the population.
The median household income in Crestwood was $50,000, and the median family income was $60,000. The per capita income in Crestwood was $25,000. About 8.3% of families and 10.2% of the population were below the poverty line.
Crestwood is a small city with a rural charm and a small-town atmosphere. The city is home to a variety of businesses and educational institutions, as well as a number of farms and manufacturing businesses. The city has a diverse population and a strong economy.
Common Questions
What is Per Capita Income in Crestwood?
Per Capita income in Crestwood is $50,642.
What is the Median Family Income in Crestwood?
Median Family Income in Crestwood is $123,065.
What is the Median Household income in Crestwood?
Median Household Income in Crestwood is $110,147.
What is Income or Wage Gap in Crestwood?
Income or Wage Gap in Crestwood is 36.4%.
Women in Crestwood earn 63.6 cents for every dollar earned by a man.
What is Inequality or Gini Index in Crestwood?
Inequality or Gini Index in Crestwood is 0.43.
What is the Total Population of Crestwood?
Total Population of Crestwood is 6,175.
What is the Total Male Population of Crestwood?
Total Male Population of Crestwood is 2,715.
What is the Total Female Population of Crestwood?
Total Female Population of Crestwood is 3,460.
What is the Ratio of Males per 100 Females in Crestwood?
There are 78.47 Males per 100 Females in Crestwood.
What is the Ratio of Females per 100 Males in Crestwood?
There are 127.44 Females per 100 Males in Crestwood.
What is the Median Population Age in Crestwood?
Median Population Age in Crestwood is 36.5 Years.
What is the Average Family Size in Crestwood
Average Family Size in Crestwood is 3.4 People.
What is the Average Household Size in Crestwood
Average Household Size in Crestwood is 2.9 People.
How Large is the Labor Force in Crestwood?
There are 3,420 People in the Labor Forcein in Crestwood.
What is the Percentage of People in the Labor Force in Crestwood?
75.2% of People are in the Labor Force in Crestwood.
What is the Unemployment Rate in Crestwood?
Unemployment Rate in Crestwood is 5.0%.