Cities with the Highest Percentage of Population Employed in Office & Administration in Kentucky
RELATED REPORTS & OPTIONS
Office & Administration
Kentucky
Compare Cities
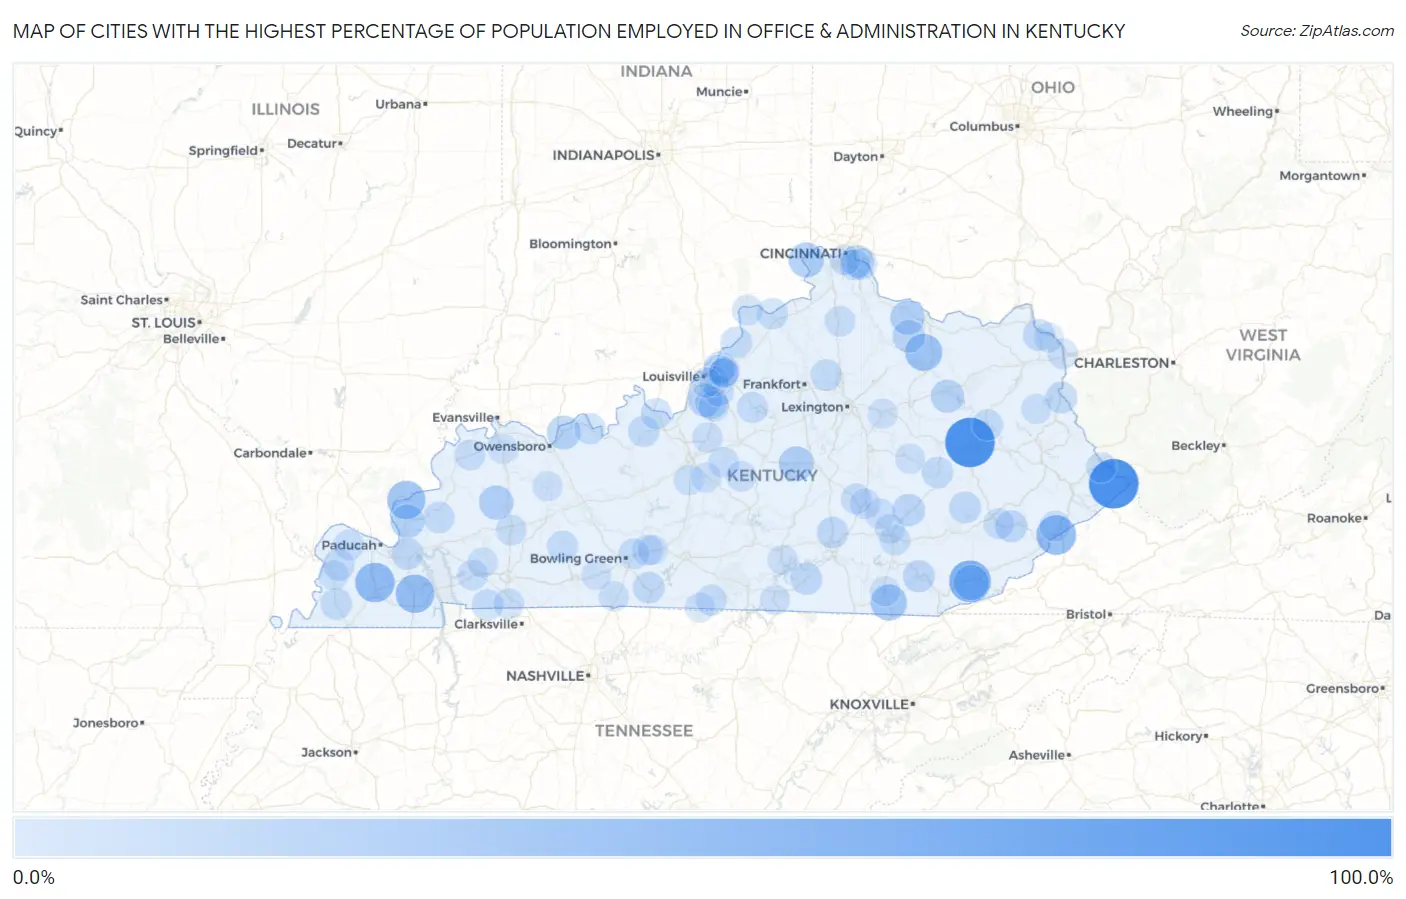
Map of Cities with the Highest Percentage of Population Employed in Office & Administration in Kentucky
0.0%
100.0%
Cities with the Highest Percentage of Population Employed in Office & Administration in Kentucky
| City | % Employed | vs State | vs National | |
| 1. | Phelps | 100.0% | 11.4%(+88.6)#1 | 10.9%(+89.1)#1 |
| 2. | Hazel Green | 100.0% | 11.4%(+88.6)#2 | 10.9%(+89.1)#23 |
| 3. | Wallins Creek | 65.0% | 11.4%(+53.6)#3 | 10.9%(+54.1)#109 |
| 4. | Payne Gap | 56.1% | 11.4%(+44.7)#4 | 10.9%(+45.2)#152 |
| 5. | Hickory | 55.3% | 11.4%(+43.9)#5 | 10.9%(+44.4)#160 |
| 6. | Dexter | 51.7% | 11.4%(+40.3)#6 | 10.9%(+40.9)#191 |
| 7. | Carrsville | 50.0% | 11.4%(+38.6)#7 | 10.9%(+39.1)#215 |
| 8. | Elizaville | 45.2% | 11.4%(+33.9)#8 | 10.9%(+34.4)#286 |
| 9. | Pleasant View | 41.2% | 11.4%(+29.8)#9 | 10.9%(+30.3)#378 |
| 10. | South Wallins | 37.3% | 11.4%(+25.9)#10 | 10.9%(+26.5)#489 |
| 11. | Petersburg | 36.5% | 11.4%(+25.1)#11 | 10.9%(+25.6)#519 |
| 12. | Perryville | 35.0% | 11.4%(+23.7)#12 | 10.9%(+24.2)#576 |
| 13. | Manitou | 33.3% | 11.4%(+22.0)#13 | 10.9%(+22.5)#646 |
| 14. | Stanley | 33.1% | 11.4%(+21.7)#14 | 10.9%(+22.3)#690 |
| 15. | Germantown | 32.8% | 11.4%(+21.4)#15 | 10.9%(+21.9)#699 |
| 16. | Maceo | 31.9% | 11.4%(+20.5)#16 | 10.9%(+21.0)#740 |
| 17. | Burna | 31.6% | 11.4%(+20.2)#17 | 10.9%(+20.7)#756 |
| 18. | Salt Lick | 29.2% | 11.4%(+17.8)#18 | 10.9%(+18.3)#899 |
| 19. | Hollyvilla | 29.0% | 11.4%(+17.6)#19 | 10.9%(+18.1)#920 |
| 20. | Sardis | 27.3% | 11.4%(+15.9)#20 | 10.9%(+16.4)#1,081 |
| 21. | Hunters Hollow | 25.9% | 11.4%(+14.5)#21 | 10.9%(+15.0)#1,209 |
| 22. | Annville | 25.2% | 11.4%(+13.8)#22 | 10.9%(+14.3)#1,285 |
| 23. | Silver Grove | 25.1% | 11.4%(+13.7)#23 | 10.9%(+14.2)#1,294 |
| 24. | Vicco | 23.9% | 11.4%(+12.5)#24 | 10.9%(+13.1)#1,473 |
| 25. | Barbourville | 23.7% | 11.4%(+12.3)#25 | 10.9%(+12.9)#1,510 |
| 26. | Monticello | 23.5% | 11.4%(+12.1)#26 | 10.9%(+12.7)#1,553 |
| 27. | Knottsville | 23.3% | 11.4%(+12.0)#27 | 10.9%(+12.5)#1,579 |
| 28. | Buckhorn | 23.3% | 11.4%(+12.0)#28 | 10.9%(+12.5)#1,582 |
| 29. | Calvert City | 23.2% | 11.4%(+11.8)#29 | 10.9%(+12.3)#1,606 |
| 30. | Greenup | 22.9% | 11.4%(+11.5)#30 | 10.9%(+12.0)#1,656 |
| 31. | Louisa | 22.8% | 11.4%(+11.4)#31 | 10.9%(+11.9)#1,677 |
| 32. | Green Spring | 22.6% | 11.4%(+11.2)#32 | 10.9%(+11.7)#1,708 |
| 33. | Scottsville | 22.5% | 11.4%(+11.1)#33 | 10.9%(+11.6)#1,754 |
| 34. | Science Hill | 22.3% | 11.4%(+10.9)#34 | 10.9%(+11.4)#1,776 |
| 35. | Westport | 22.2% | 11.4%(+10.8)#35 | 10.9%(+11.4)#1,790 |
| 36. | Clinton | 22.1% | 11.4%(+10.7)#36 | 10.9%(+11.3)#1,822 |
| 37. | Thruston | 21.9% | 11.4%(+10.5)#37 | 10.9%(+11.0)#1,873 |
| 38. | Crayne | 21.8% | 11.4%(+10.4)#38 | 10.9%(+10.9)#1,889 |
| 39. | Melbourne | 21.5% | 11.4%(+10.2)#39 | 10.9%(+10.7)#1,954 |
| 40. | Blandville | 21.4% | 11.4%(+10.1)#40 | 10.9%(+10.6)#1,986 |
| 41. | Lafayette | 21.4% | 11.4%(+9.98)#41 | 10.9%(+10.5)#2,006 |
| 42. | Irvington | 21.2% | 11.4%(+9.82)#42 | 10.9%(+10.3)#2,045 |
| 43. | Beattyville | 21.1% | 11.4%(+9.76)#43 | 10.9%(+10.3)#2,065 |
| 44. | Stamping Ground | 21.1% | 11.4%(+9.74)#44 | 10.9%(+10.3)#2,069 |
| 45. | West Liberty | 21.0% | 11.4%(+9.60)#45 | 10.9%(+10.1)#2,108 |
| 46. | Carrollton | 20.6% | 11.4%(+9.19)#46 | 10.9%(+9.71)#2,234 |
| 47. | Taylorsville | 20.1% | 11.4%(+8.72)#47 | 10.9%(+9.24)#2,374 |
| 48. | Hawesville | 20.0% | 11.4%(+8.58)#48 | 10.9%(+9.10)#2,450 |
| 49. | Brandenburg | 19.8% | 11.4%(+8.47)#49 | 10.9%(+8.99)#2,481 |
| 50. | Dunmor | 19.8% | 11.4%(+8.39)#50 | 10.9%(+8.91)#2,512 |
| 51. | Tompkinsville | 19.4% | 11.4%(+7.99)#51 | 10.9%(+8.51)#2,655 |
| 52. | Diablock | 19.1% | 11.4%(+7.75)#52 | 10.9%(+8.27)#2,751 |
| 53. | Cold Spring | 19.1% | 11.4%(+7.69)#53 | 10.9%(+8.21)#2,771 |
| 54. | Waverly | 19.0% | 11.4%(+7.67)#54 | 10.9%(+8.19)#2,778 |
| 55. | Mcroberts | 18.9% | 11.4%(+7.51)#55 | 10.9%(+8.03)#2,860 |
| 56. | London | 18.8% | 11.4%(+7.39)#56 | 10.9%(+7.91)#2,926 |
| 57. | Oakland | 18.8% | 11.4%(+7.37)#57 | 10.9%(+7.89)#2,937 |
| 58. | Plum Springs | 18.7% | 11.4%(+7.34)#58 | 10.9%(+7.86)#2,967 |
| 59. | Nortonville | 18.7% | 11.4%(+7.33)#59 | 10.9%(+7.85)#2,970 |
| 60. | Williamstown | 18.6% | 11.4%(+7.23)#60 | 10.9%(+7.75)#3,012 |
| 61. | Cadiz | 18.4% | 11.4%(+7.07)#61 | 10.9%(+7.59)#3,115 |
| 62. | Kenton Vale | 18.4% | 11.4%(+7.04)#62 | 10.9%(+7.56)#3,122 |
| 63. | Milton | 18.3% | 11.4%(+6.92)#63 | 10.9%(+7.44)#3,177 |
| 64. | Brodhead | 18.2% | 11.4%(+6.84)#64 | 10.9%(+7.36)#3,206 |
| 65. | New Haven | 18.2% | 11.4%(+6.83)#65 | 10.9%(+7.35)#3,213 |
| 66. | Hebron Estates | 18.2% | 11.4%(+6.79)#66 | 10.9%(+7.31)#3,265 |
| 67. | Fort Campbell North | 18.1% | 11.4%(+6.77)#67 | 10.9%(+7.29)#3,273 |
| 68. | Kevil | 18.1% | 11.4%(+6.69)#68 | 10.9%(+7.21)#3,308 |
| 69. | Raywick | 18.0% | 11.4%(+6.66)#69 | 10.9%(+7.18)#3,323 |
| 70. | Livingston | 18.0% | 11.4%(+6.62)#70 | 10.9%(+7.14)#3,343 |
| 71. | Hollow Creek | 17.9% | 11.4%(+6.50)#71 | 10.9%(+7.02)#3,414 |
| 72. | Mount Vernon | 17.7% | 11.4%(+6.28)#72 | 10.9%(+6.80)#3,530 |
| 73. | Hills And Dales | 17.5% | 11.4%(+6.08)#73 | 10.9%(+6.60)#3,663 |
| 74. | West Van Lear | 17.4% | 11.4%(+6.00)#74 | 10.9%(+6.52)#3,723 |
| 75. | Belfry | 17.3% | 11.4%(+5.96)#75 | 10.9%(+6.48)#3,746 |
| 76. | Catlettsburg | 17.1% | 11.4%(+5.71)#76 | 10.9%(+6.23)#3,907 |
| 77. | Lebanon Junction | 17.1% | 11.4%(+5.70)#77 | 10.9%(+6.22)#3,914 |
| 78. | Creekside | 16.9% | 11.4%(+5.52)#78 | 10.9%(+6.04)#4,043 |
| 79. | Franklin | 16.9% | 11.4%(+5.52)#79 | 10.9%(+6.04)#4,049 |
| 80. | Sonora | 16.7% | 11.4%(+5.29)#80 | 10.9%(+5.81)#4,182 |
| 81. | Blaine | 16.7% | 11.4%(+5.29)#81 | 10.9%(+5.81)#4,225 |
| 82. | Cerulean | 16.6% | 11.4%(+5.21)#82 | 10.9%(+5.73)#4,278 |
| 83. | Williamsburg | 16.5% | 11.4%(+5.16)#83 | 10.9%(+5.68)#4,324 |
| 84. | Bardwell | 16.5% | 11.4%(+5.15)#84 | 10.9%(+5.67)#4,329 |
| 85. | Jamestown | 16.4% | 11.4%(+5.05)#85 | 10.9%(+5.57)#4,400 |
| 86. | Kingsley | 16.4% | 11.4%(+5.01)#86 | 10.9%(+5.53)#4,436 |
| 87. | Moorland | 16.3% | 11.4%(+4.95)#87 | 10.9%(+5.47)#4,485 |
| 88. | Anthoston | 16.3% | 11.4%(+4.92)#88 | 10.9%(+5.44)#4,507 |
| 89. | Gamaliel | 16.2% | 11.4%(+4.84)#89 | 10.9%(+5.36)#4,584 |
| 90. | Livermore | 16.2% | 11.4%(+4.83)#90 | 10.9%(+5.35)#4,592 |
| 91. | Albany | 16.1% | 11.4%(+4.76)#91 | 10.9%(+5.28)#4,648 |
| 92. | Auburn | 16.1% | 11.4%(+4.76)#92 | 10.9%(+5.28)#4,651 |
| 93. | Hodgenville | 16.1% | 11.4%(+4.68)#93 | 10.9%(+5.20)#4,723 |
| 94. | Flatwoods | 16.1% | 11.4%(+4.67)#94 | 10.9%(+5.19)#4,730 |
| 95. | Smiths Grove | 16.0% | 11.4%(+4.65)#95 | 10.9%(+5.17)#4,753 |
| 96. | East Bernstadt | 16.0% | 11.4%(+4.62)#96 | 10.9%(+5.14)#4,769 |
| 97. | Ravenna | 16.0% | 11.4%(+4.62)#97 | 10.9%(+5.14)#4,771 |
| 98. | Winchester | 16.0% | 11.4%(+4.62)#98 | 10.9%(+5.14)#4,792 |
| 99. | Parkway Village | 16.0% | 11.4%(+4.60)#99 | 10.9%(+5.12)#4,805 |
| 100. | Westwood | 16.0% | 11.4%(+4.58)#100 | 10.9%(+5.10)#4,834 |
Common Questions
What are the Top 10 Cities with the Highest Percentage of Population Employed in Office & Administration in Kentucky?
Top 10 Cities with the Highest Percentage of Population Employed in Office & Administration in Kentucky are:
#1
100.0%
#2
100.0%
#3
65.0%
#4
56.1%
#5
55.3%
#6
51.7%
#7
50.0%
#8
45.2%
#9
41.2%
#10
37.3%
What city has the Highest Percentage of Population Employed in Office & Administration in Kentucky?
Phelps has the Highest Percentage of Population Employed in Office & Administration in Kentucky with 100.0%.
What is the Percentage of Population Employed in Office & Administration in the State of Kentucky?
Percentage of Population Employed in Office & Administration in Kentucky is 11.4%.
What is the Percentage of Population Employed in Office & Administration in the United States?
Percentage of Population Employed in Office & Administration in the United States is 10.9%.