Pewee Valley, KY Map & Demographics
Pewee Valley Map
Pewee Valley Overview
$60,919
PER CAPITA INCOME
$148,571
AVG FAMILY INCOME
$132,614
AVG HOUSEHOLD INCOME
37.6%
WAGE / INCOME GAP [ % ]
62.4¢/ $1
WAGE / INCOME GAP [ $ ]
0.45
INEQUALITY / GINI INDEX
1,514
TOTAL POPULATION
817
MALE POPULATION
697
FEMALE POPULATION
117.22
MALES / 100 FEMALES
85.31
FEMALES / 100 MALES
47.9
MEDIAN AGE
3.2
AVG FAMILY SIZE
2.8
AVG HOUSEHOLD SIZE
665
LABOR FORCE [ PEOPLE ]
54.4%
PERCENT IN LABOR FORCE
2.3%
UNEMPLOYMENT RATE
Pewee Valley Zip Codes
Pewee Valley Area Codes
Income in Pewee Valley
Income Overview in Pewee Valley
Per Capita Income in Pewee Valley is $60,919, while median incomes of families and households are $148,571 and $132,614 respectively.
| Characteristic | Number | Measure |
| Per Capita Income | 1,514 | $60,919 |
| Median Family Income | 398 | $148,571 |
| Mean Family Income | 398 | $195,847 |
| Median Household Income | 491 | $132,614 |
| Mean Household Income | 491 | $180,859 |
| Income Deficit | 398 | $0 |
| Wage / Income Gap (%) | 1,514 | 37.64% |
| Wage / Income Gap ($) | 1,514 | 62.36¢ per $1 |
| Gini / Inequality Index | 1,514 | 0.45 |
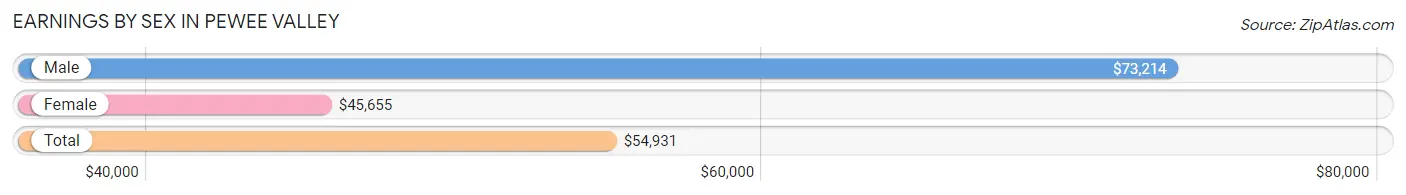
Earnings by Sex in Pewee Valley
Average Earnings in Pewee Valley are $54,931, $73,214 for men and $45,655 for women, a difference of 37.6%.
| Sex | Number | Average Earnings |
| Male | 426 (59.4%) | $73,214 |
| Female | 291 (40.6%) | $45,655 |
| Total | 717 (100.0%) | $54,931 |
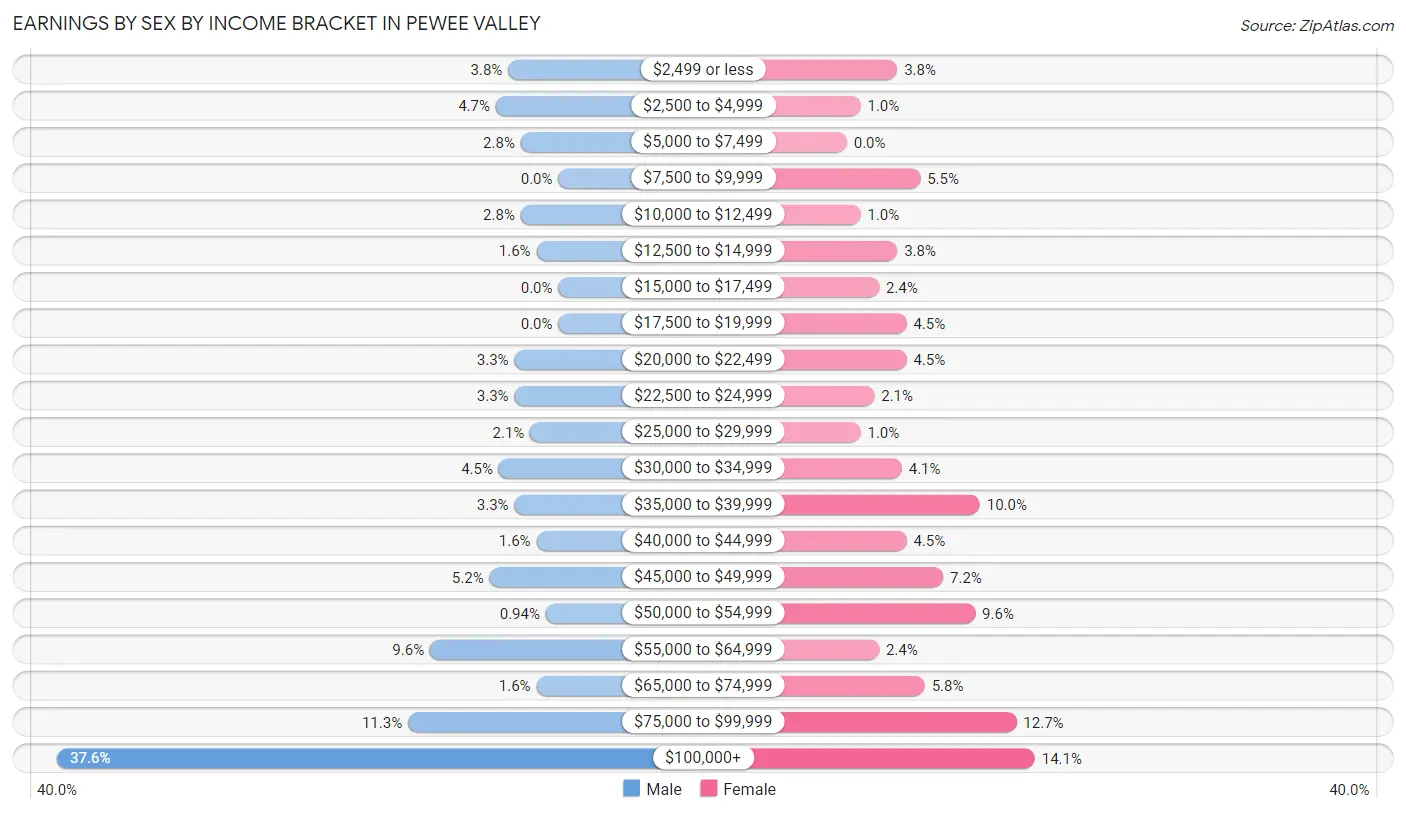
Earnings by Sex by Income Bracket in Pewee Valley
The most common earnings brackets in Pewee Valley are $100,000+ for men (160 | 37.6%) and $100,000+ for women (41 | 14.1%).
| Income | Male | Female |
| $2,499 or less | 16 (3.8%) | 11 (3.8%) |
| $2,500 to $4,999 | 20 (4.7%) | 3 (1.0%) |
| $5,000 to $7,499 | 12 (2.8%) | 0 (0.0%) |
| $7,500 to $9,999 | 0 (0.0%) | 16 (5.5%) |
| $10,000 to $12,499 | 12 (2.8%) | 3 (1.0%) |
| $12,500 to $14,999 | 7 (1.6%) | 11 (3.8%) |
| $15,000 to $17,499 | 0 (0.0%) | 7 (2.4%) |
| $17,500 to $19,999 | 0 (0.0%) | 13 (4.5%) |
| $20,000 to $22,499 | 14 (3.3%) | 13 (4.5%) |
| $22,500 to $24,999 | 14 (3.3%) | 6 (2.1%) |
| $25,000 to $29,999 | 9 (2.1%) | 3 (1.0%) |
| $30,000 to $34,999 | 19 (4.5%) | 12 (4.1%) |
| $35,000 to $39,999 | 14 (3.3%) | 29 (10.0%) |
| $40,000 to $44,999 | 7 (1.6%) | 13 (4.5%) |
| $45,000 to $49,999 | 22 (5.2%) | 21 (7.2%) |
| $50,000 to $54,999 | 4 (0.9%) | 28 (9.6%) |
| $55,000 to $64,999 | 41 (9.6%) | 7 (2.4%) |
| $65,000 to $74,999 | 7 (1.6%) | 17 (5.8%) |
| $75,000 to $99,999 | 48 (11.3%) | 37 (12.7%) |
| $100,000+ | 160 (37.6%) | 41 (14.1%) |
| Total | 426 (100.0%) | 291 (100.0%) |
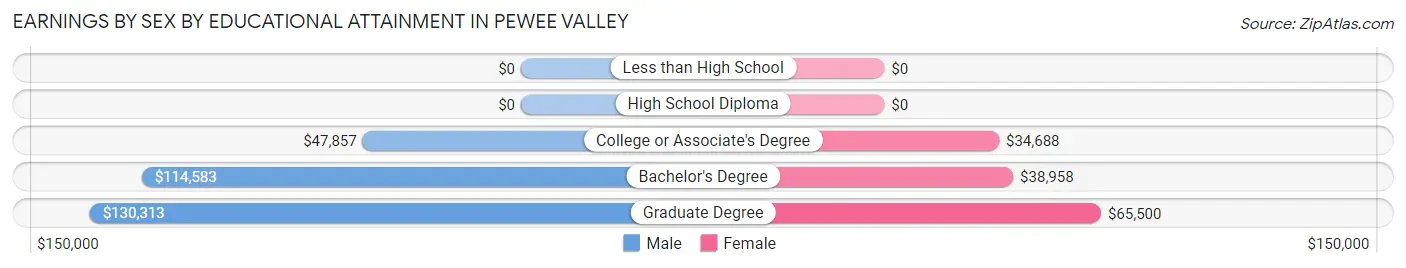
Earnings by Sex by Educational Attainment in Pewee Valley
Average earnings in Pewee Valley are $84,464 for men and $47,381 for women, a difference of 43.9%. Men with an educational attainment of graduate degree enjoy the highest average annual earnings of $130,313, while those with college or associate's degree education earn the least with $47,857. Women with an educational attainment of graduate degree earn the most with the average annual earnings of $65,500, while those with college or associate's degree education have the smallest earnings of $34,688.
| Educational Attainment | Male Income | Female Income |
| Less than High School | - | - |
| High School Diploma | - | - |
| College or Associate's Degree | $47,857 | $34,688 |
| Bachelor's Degree | $114,583 | $38,958 |
| Graduate Degree | $130,313 | $65,500 |
| Total | $84,464 | $47,381 |
Family Income in Pewee Valley
Family Income Brackets in Pewee Valley
According to the Pewee Valley family income data, there are 108 families falling into the $200,000+ income range, which is the most common income bracket and makes up 27.1% of all families.
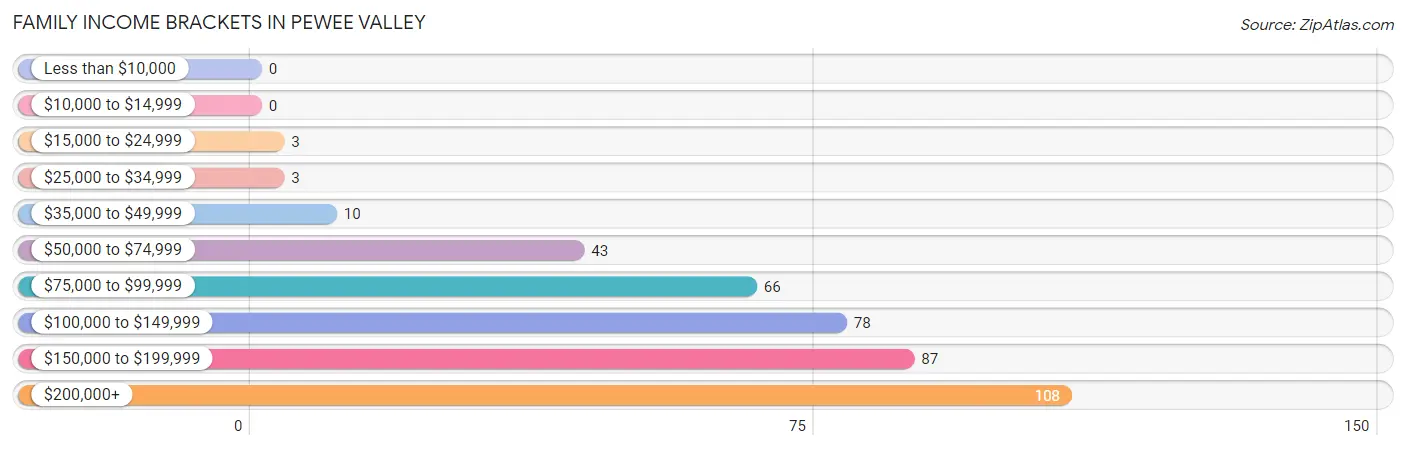
| Income Bracket | # Families | % Families |
| Less than $10,000 | 0 | 0.0% |
| $10,000 to $14,999 | 0 | 0.0% |
| $15,000 to $24,999 | 3 | 0.8% |
| $25,000 to $34,999 | 3 | 0.8% |
| $35,000 to $49,999 | 10 | 2.5% |
| $50,000 to $74,999 | 43 | 10.8% |
| $75,000 to $99,999 | 66 | 16.6% |
| $100,000 to $149,999 | 78 | 19.6% |
| $150,000 to $199,999 | 87 | 21.9% |
| $200,000+ | 108 | 27.1% |
Family Income by Famaliy Size in Pewee Valley
4-person families (74 | 18.6%) account for the highest median family income in Pewee Valley with $192,778 per family, while 2-person families (203 | 51.0%) have the highest median income of $63,304 per family member.
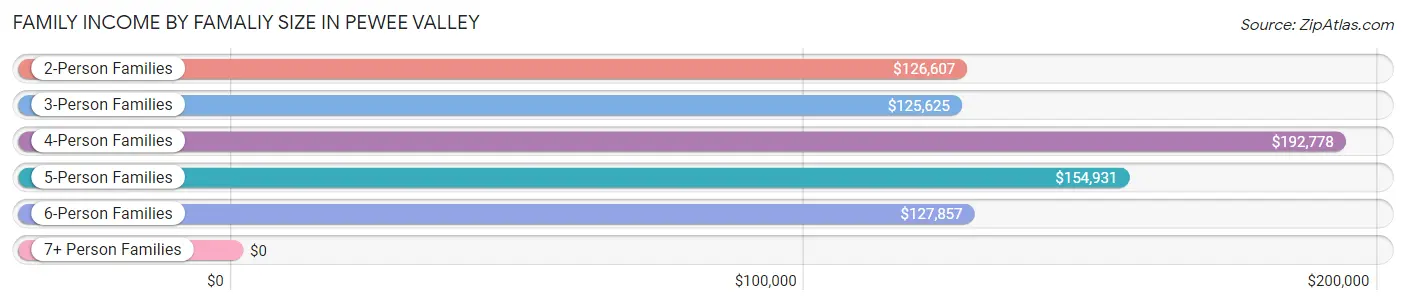
| Income Bracket | # Families | Median Income |
| 2-Person Families | 203 (51.0%) | $126,607 |
| 3-Person Families | 49 (12.3%) | $125,625 |
| 4-Person Families | 74 (18.6%) | $192,778 |
| 5-Person Families | 51 (12.8%) | $154,931 |
| 6-Person Families | 18 (4.5%) | $127,857 |
| 7+ Person Families | 3 (0.7%) | $0 |
| Total | 398 (100.0%) | $148,571 |
Family Income by Number of Earners in Pewee Valley
The median family income in Pewee Valley is $148,571, with families comprising 3+ earners (36) having the highest median family income of $201,250, while families with no earners (57) have the lowest median family income of $93,750, accounting for 9.0% and 14.3% of families, respectively.
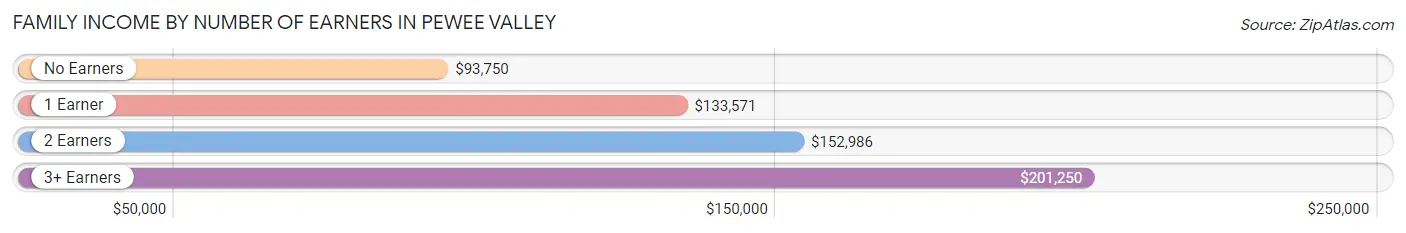
| Number of Earners | # Families | Median Income |
| No Earners | 57 (14.3%) | $93,750 |
| 1 Earner | 110 (27.6%) | $133,571 |
| 2 Earners | 195 (49.0%) | $152,986 |
| 3+ Earners | 36 (9.0%) | $201,250 |
| Total | 398 (100.0%) | $148,571 |
Household Income in Pewee Valley
Household Income Brackets in Pewee Valley
With 115 households falling in the category, the $200,000+ income range is the most frequent in Pewee Valley, accounting for 23.4% of all households. In contrast, only 2 households (0.4%) fall into the less than $10,000 income bracket, making it the least populous group.
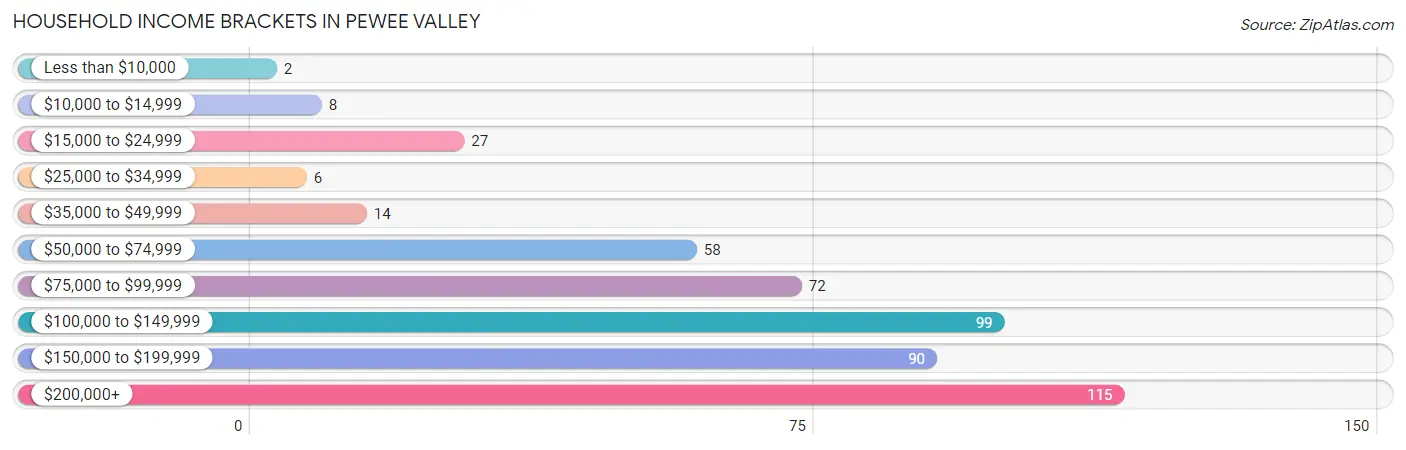
| Income Bracket | # Households | % Households |
| Less than $10,000 | 2 | 0.4% |
| $10,000 to $14,999 | 8 | 1.6% |
| $15,000 to $24,999 | 27 | 5.5% |
| $25,000 to $34,999 | 6 | 1.2% |
| $35,000 to $49,999 | 14 | 2.9% |
| $50,000 to $74,999 | 58 | 11.8% |
| $75,000 to $99,999 | 72 | 14.7% |
| $100,000 to $149,999 | 99 | 20.2% |
| $150,000 to $199,999 | 90 | 18.3% |
| $200,000+ | 115 | 23.4% |
Household Income by Householder Age in Pewee Valley
The median household income in Pewee Valley is $132,614, with the highest median household income of $149,688 found in the 45 to 64 years age bracket for the primary householder. A total of 219 households (44.6%) fall into this category.
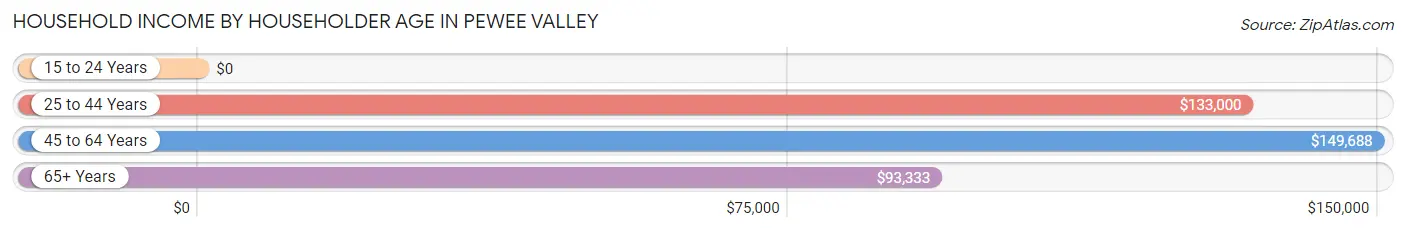
| Income Bracket | # Households | Median Income |
| 15 to 24 Years | 0 (0.0%) | $0 |
| 25 to 44 Years | 108 (22.0%) | $133,000 |
| 45 to 64 Years | 219 (44.6%) | $149,688 |
| 65+ Years | 164 (33.4%) | $93,333 |
| Total | 491 (100.0%) | $132,614 |
Poverty in Pewee Valley
Income Below Poverty by Sex and Age in Pewee Valley
With 1.1% poverty level for males and 0.9% for females among the residents of Pewee Valley, 65 to 74 year old males and 18 to 24 year old females are the most vulnerable to poverty, with 8 males (12.5%) and 4 females (10.8%) in their respective age groups living below the poverty level.
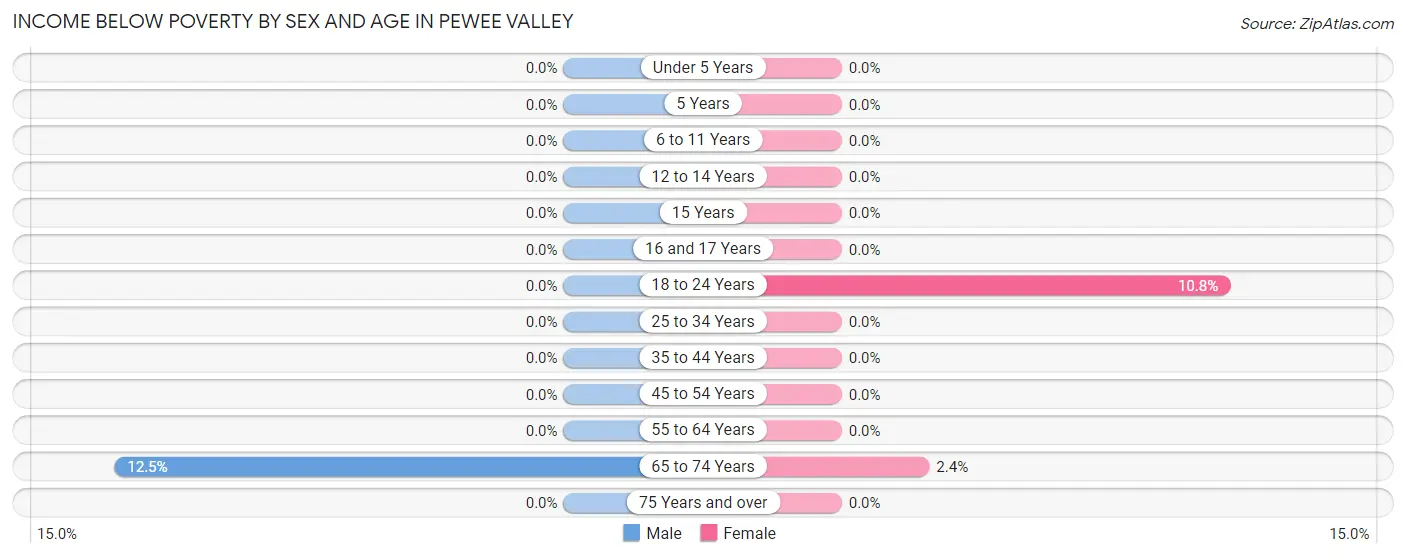
| Age Bracket | Male | Female |
| Under 5 Years | 0 (0.0%) | 0 (0.0%) |
| 5 Years | 0 (0.0%) | 0 (0.0%) |
| 6 to 11 Years | 0 (0.0%) | 0 (0.0%) |
| 12 to 14 Years | 0 (0.0%) | 0 (0.0%) |
| 15 Years | 0 (0.0%) | 0 (0.0%) |
| 16 and 17 Years | 0 (0.0%) | 0 (0.0%) |
| 18 to 24 Years | 0 (0.0%) | 4 (10.8%) |
| 25 to 34 Years | 0 (0.0%) | 0 (0.0%) |
| 35 to 44 Years | 0 (0.0%) | 0 (0.0%) |
| 45 to 54 Years | 0 (0.0%) | 0 (0.0%) |
| 55 to 64 Years | 0 (0.0%) | 0 (0.0%) |
| 65 to 74 Years | 8 (12.5%) | 2 (2.4%) |
| 75 Years and over | 0 (0.0%) | 0 (0.0%) |
| Total | 8 (1.1%) | 6 (0.9%) |
Income Above Poverty by Sex and Age in Pewee Valley
According to the poverty statistics in Pewee Valley, males aged under 5 years and females aged under 5 years are the age groups that are most secure financially, with 100.0% of males and 100.0% of females in these age groups living above the poverty line.
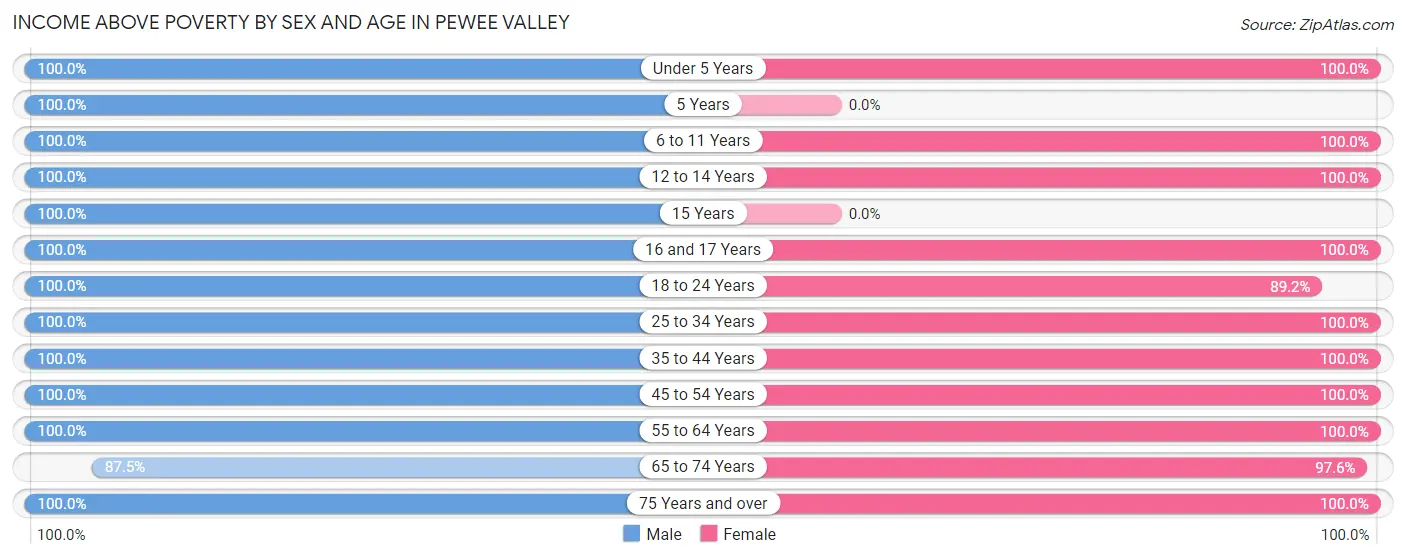
| Age Bracket | Male | Female |
| Under 5 Years | 17 (100.0%) | 30 (100.0%) |
| 5 Years | 6 (100.0%) | 0 (0.0%) |
| 6 to 11 Years | 72 (100.0%) | 52 (100.0%) |
| 12 to 14 Years | 62 (100.0%) | 22 (100.0%) |
| 15 Years | 20 (100.0%) | 0 (0.0%) |
| 16 and 17 Years | 38 (100.0%) | 15 (100.0%) |
| 18 to 24 Years | 55 (100.0%) | 33 (89.2%) |
| 25 to 34 Years | 45 (100.0%) | 28 (100.0%) |
| 35 to 44 Years | 80 (100.0%) | 81 (100.0%) |
| 45 to 54 Years | 117 (100.0%) | 122 (100.0%) |
| 55 to 64 Years | 123 (100.0%) | 87 (100.0%) |
| 65 to 74 Years | 56 (87.5%) | 80 (97.6%) |
| 75 Years and over | 47 (100.0%) | 75 (100.0%) |
| Total | 738 (98.9%) | 625 (99.1%) |
Income Below Poverty Among Married-Couple Families in Pewee Valley
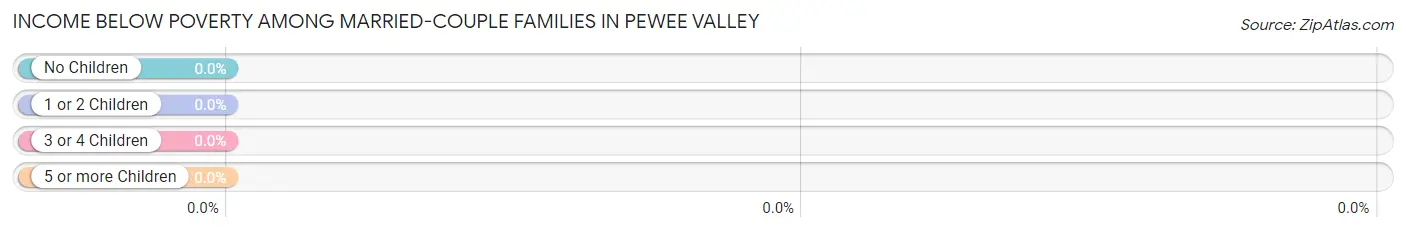
| Children | Above Poverty | Below Poverty |
| No Children | 235 (100.0%) | 0 (0.0%) |
| 1 or 2 Children | 75 (100.0%) | 0 (0.0%) |
| 3 or 4 Children | 64 (100.0%) | 0 (0.0%) |
| 5 or more Children | 3 (100.0%) | 0 (0.0%) |
| Total | 377 (100.0%) | 0 (0.0%) |
Income Below Poverty Among Single-Parent Households in Pewee Valley
| Children | Single Father | Single Mother |
| No Children | 0 (0.0%) | 0 (0.0%) |
| 1 or 2 Children | 0 (0.0%) | 0 (0.0%) |
| 3 or 4 Children | 0 (0.0%) | 0 (0.0%) |
| 5 or more Children | 0 (0.0%) | 0 (0.0%) |
| Total | 0 (0.0%) | 0 (0.0%) |
Income Below Poverty Among Married-Couple vs Single-Parent Households in Pewee Valley
| Children | Married-Couple Families | Single-Parent Households |
| No Children | 0 (0.0%) | 0 (0.0%) |
| 1 or 2 Children | 0 (0.0%) | 0 (0.0%) |
| 3 or 4 Children | 0 (0.0%) | 0 (0.0%) |
| 5 or more Children | 0 (0.0%) | 0 (0.0%) |
| Total | 0 (0.0%) | 0 (0.0%) |
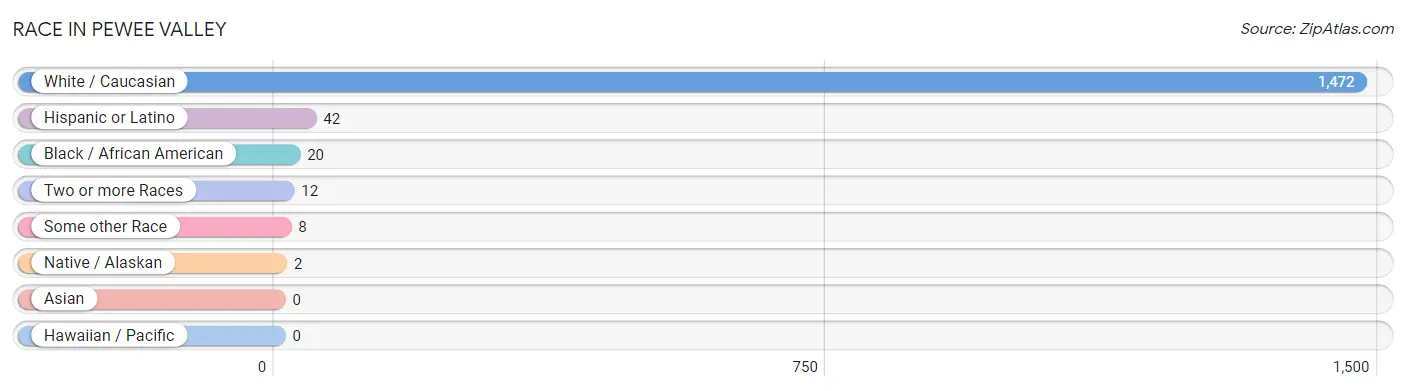
Race in Pewee Valley
The most populous races in Pewee Valley are White / Caucasian (1,472 | 97.2%), Hispanic or Latino (42 | 2.8%), and Black / African American (20 | 1.3%).
| Race | # Population | % Population |
| Asian | 0 | 0.0% |
| Black / African American | 20 | 1.3% |
| Hawaiian / Pacific | 0 | 0.0% |
| Hispanic or Latino | 42 | 2.8% |
| Native / Alaskan | 2 | 0.1% |
| White / Caucasian | 1,472 | 97.2% |
| Two or more Races | 12 | 0.8% |
| Some other Race | 8 | 0.5% |
| Total | 1,514 | 100.0% |
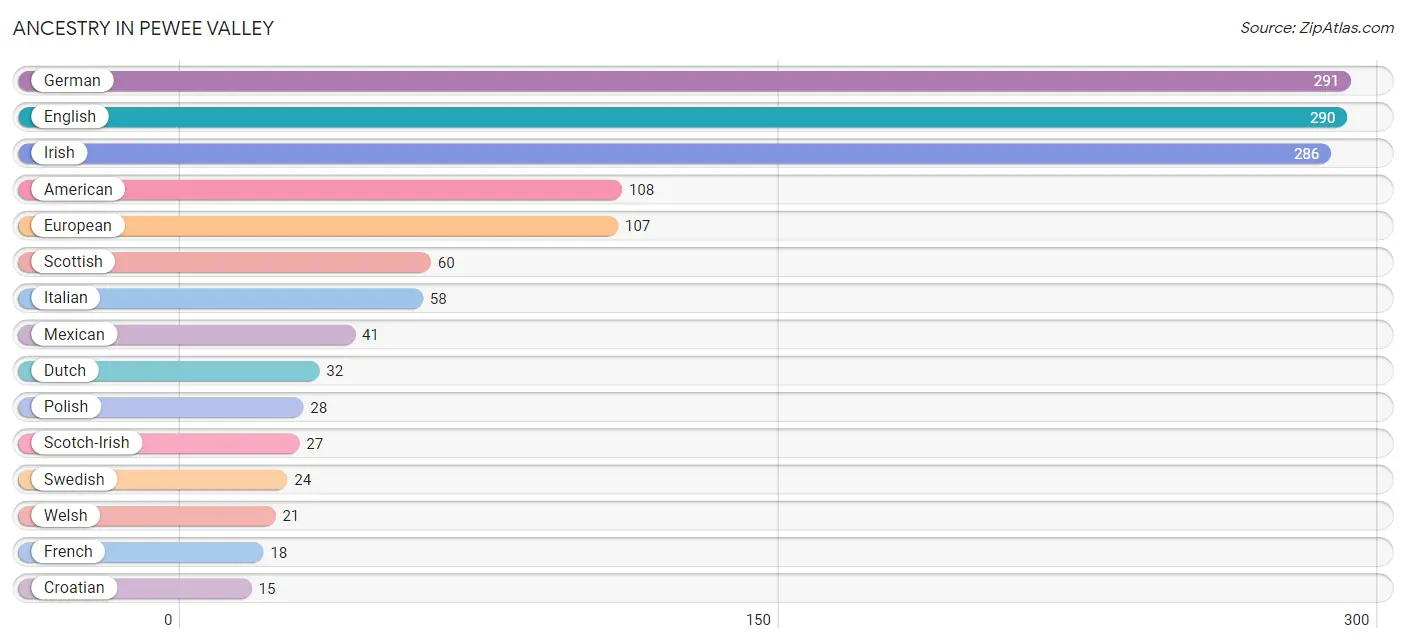
Ancestry in Pewee Valley
The most populous ancestries reported in Pewee Valley are German (291 | 19.2%), English (290 | 19.2%), Irish (286 | 18.9%), American (108 | 7.1%), and European (107 | 7.1%), together accounting for 71.5% of all Pewee Valley residents.
| Ancestry | # Population | % Population |
| African | 3 | 0.2% |
| American | 108 | 7.1% |
| Arab | 9 | 0.6% |
| Austrian | 11 | 0.7% |
| Belgian | 4 | 0.3% |
| British | 4 | 0.3% |
| Canadian | 3 | 0.2% |
| Cherokee | 9 | 0.6% |
| Croatian | 15 | 1.0% |
| Czech | 3 | 0.2% |
| Danish | 11 | 0.7% |
| Dutch | 32 | 2.1% |
| English | 290 | 19.2% |
| European | 107 | 7.1% |
| Finnish | 4 | 0.3% |
| French | 18 | 1.2% |
| French Canadian | 2 | 0.1% |
| German | 291 | 19.2% |
| Haitian | 6 | 0.4% |
| Irish | 286 | 18.9% |
| Italian | 58 | 3.8% |
| Jamaican | 3 | 0.2% |
| Lithuanian | 3 | 0.2% |
| Mexican | 41 | 2.7% |
| Norwegian | 3 | 0.2% |
| Polish | 28 | 1.8% |
| Scandinavian | 11 | 0.7% |
| Scotch-Irish | 27 | 1.8% |
| Scottish | 60 | 4.0% |
| Slavic | 7 | 0.5% |
| Spaniard | 1 | 0.1% |
| Subsaharan African | 3 | 0.2% |
| Swedish | 24 | 1.6% |
| Swiss | 3 | 0.2% |
| Ukrainian | 3 | 0.2% |
| Welsh | 21 | 1.4% |
| Yugoslavian | 4 | 0.3% | View All 37 Rows |
Immigrants in Pewee Valley
The most numerous immigrant groups reported in Pewee Valley came from Europe (10 | 0.7%), Asia (9 | 0.6%), Eastern Europe (7 | 0.5%), Caribbean (6 | 0.4%), and Haiti (6 | 0.4%), together accounting for 2.5% of all Pewee Valley residents.
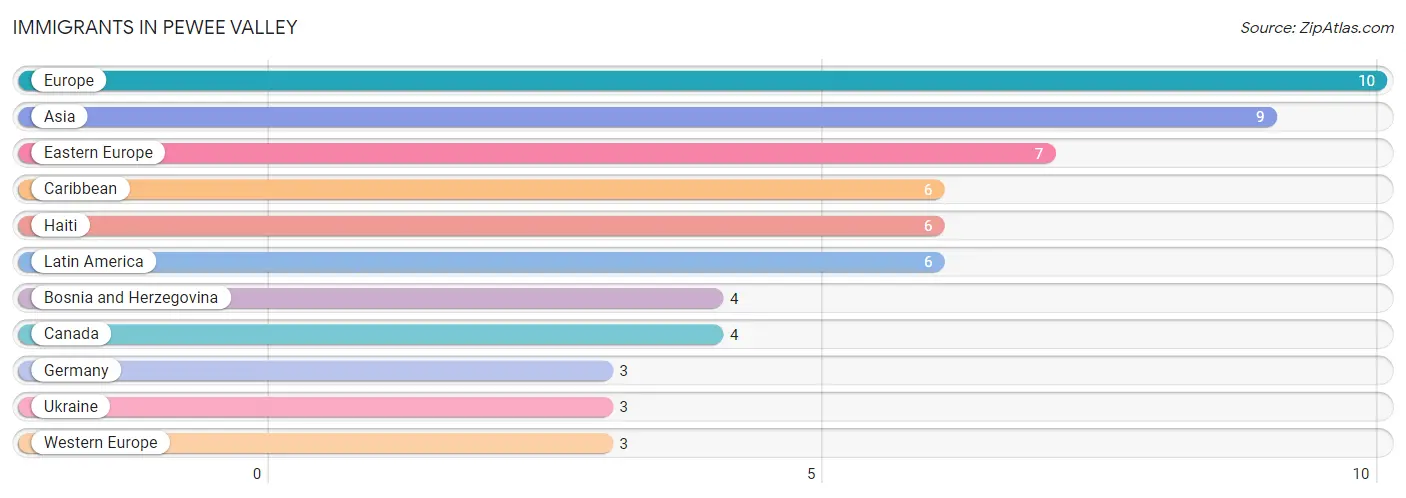
| Immigration Origin | # Population | % Population |
| Asia | 9 | 0.6% |
| Bosnia and Herzegovina | 4 | 0.3% |
| Canada | 4 | 0.3% |
| Caribbean | 6 | 0.4% |
| Eastern Europe | 7 | 0.5% |
| Europe | 10 | 0.7% |
| Germany | 3 | 0.2% |
| Haiti | 6 | 0.4% |
| Latin America | 6 | 0.4% |
| Ukraine | 3 | 0.2% |
| Western Europe | 3 | 0.2% | View All 11 Rows |
Sex and Age in Pewee Valley
Sex and Age in Pewee Valley
The most populous age groups in Pewee Valley are 10 to 14 Years (98 | 12.0%) for men and 50 to 54 Years (74 | 10.6%) for women.
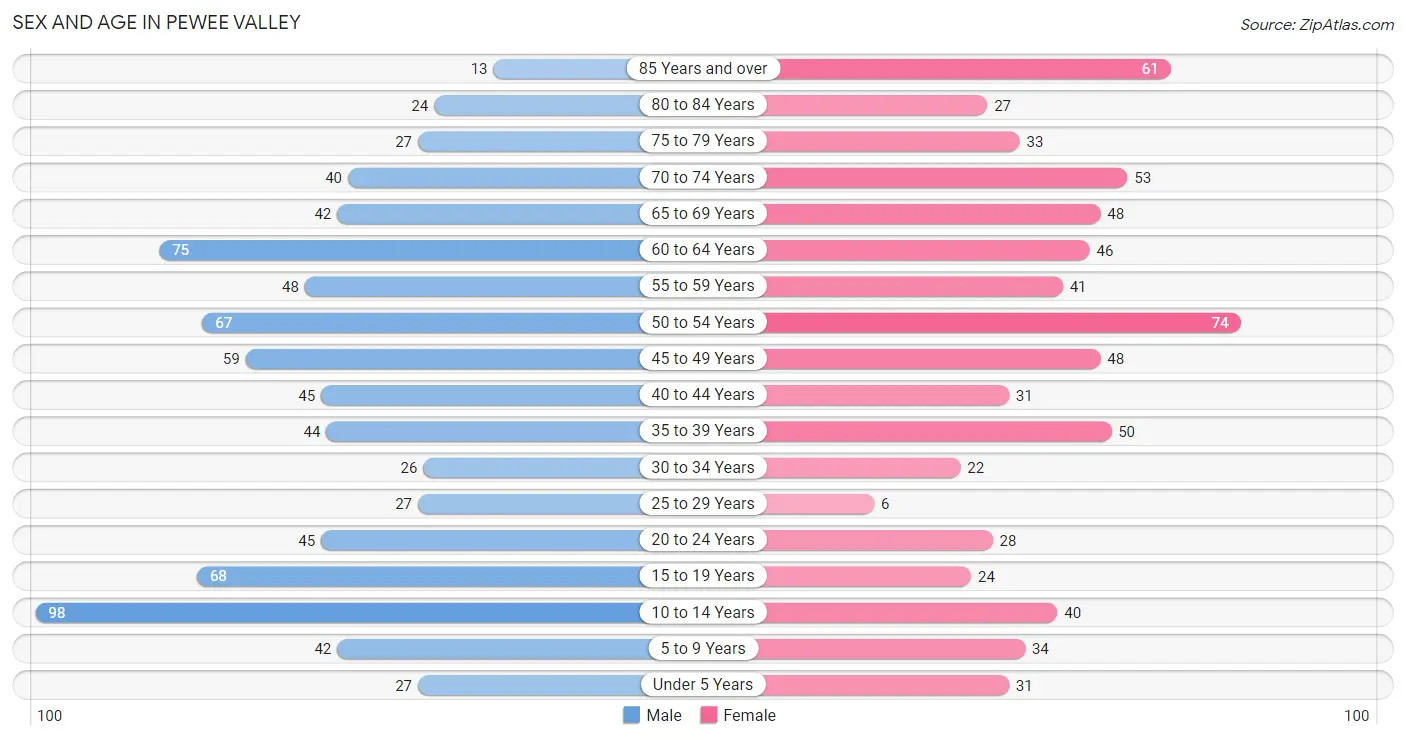
| Age Bracket | Male | Female |
| Under 5 Years | 27 (3.3%) | 31 (4.4%) |
| 5 to 9 Years | 42 (5.1%) | 34 (4.9%) |
| 10 to 14 Years | 98 (12.0%) | 40 (5.7%) |
| 15 to 19 Years | 68 (8.3%) | 24 (3.4%) |
| 20 to 24 Years | 45 (5.5%) | 28 (4.0%) |
| 25 to 29 Years | 27 (3.3%) | 6 (0.9%) |
| 30 to 34 Years | 26 (3.2%) | 22 (3.2%) |
| 35 to 39 Years | 44 (5.4%) | 50 (7.2%) |
| 40 to 44 Years | 45 (5.5%) | 31 (4.4%) |
| 45 to 49 Years | 59 (7.2%) | 48 (6.9%) |
| 50 to 54 Years | 67 (8.2%) | 74 (10.6%) |
| 55 to 59 Years | 48 (5.9%) | 41 (5.9%) |
| 60 to 64 Years | 75 (9.2%) | 46 (6.6%) |
| 65 to 69 Years | 42 (5.1%) | 48 (6.9%) |
| 70 to 74 Years | 40 (4.9%) | 53 (7.6%) |
| 75 to 79 Years | 27 (3.3%) | 33 (4.7%) |
| 80 to 84 Years | 24 (2.9%) | 27 (3.9%) |
| 85 Years and over | 13 (1.6%) | 61 (8.7%) |
| Total | 817 (100.0%) | 697 (100.0%) |
Families and Households in Pewee Valley
Median Family Size in Pewee Valley
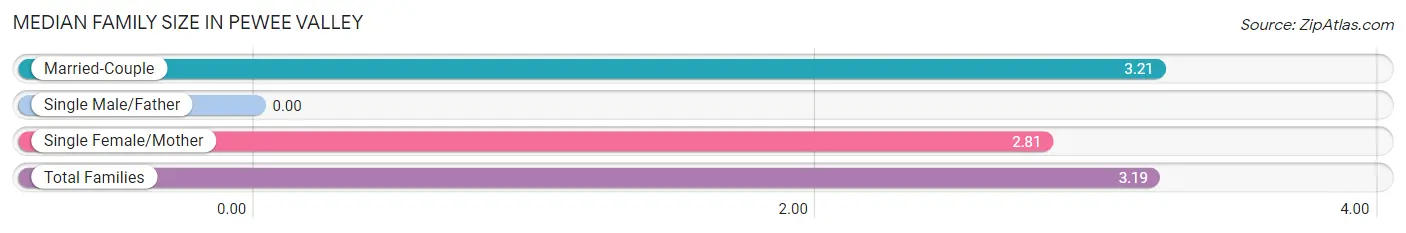
| Family Type | # Families | Family Size |
| Married-Couple | 377 (94.7%) | 3.21 |
| Single Male/Father | 0 (0.0%) | - |
| Single Female/Mother | 21 (5.3%) | 2.81 |
| Total Families | 398 (100.0%) | 3.19 |
Median Household Size in Pewee Valley
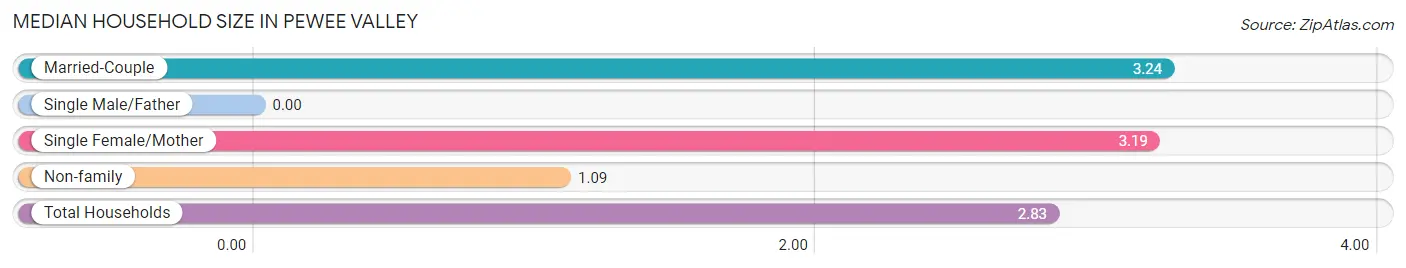
| Household Type | # Households | Household Size |
| Married-Couple | 377 (76.8%) | 3.24 |
| Single Male/Father | 0 (0.0%) | - |
| Single Female/Mother | 21 (4.3%) | 3.19 |
| Non-family | 93 (18.9%) | 1.09 |
| Total Households | 491 (100.0%) | 2.83 |
Household Size by Marriage Status in Pewee Valley
Out of a total of 491 households in Pewee Valley, 398 (81.1%) are family households, while 93 (18.9%) are nonfamily households. The most numerous type of family households are 2-person households, comprising 203, and the most common type of nonfamily households are 1-person households, comprising 85.
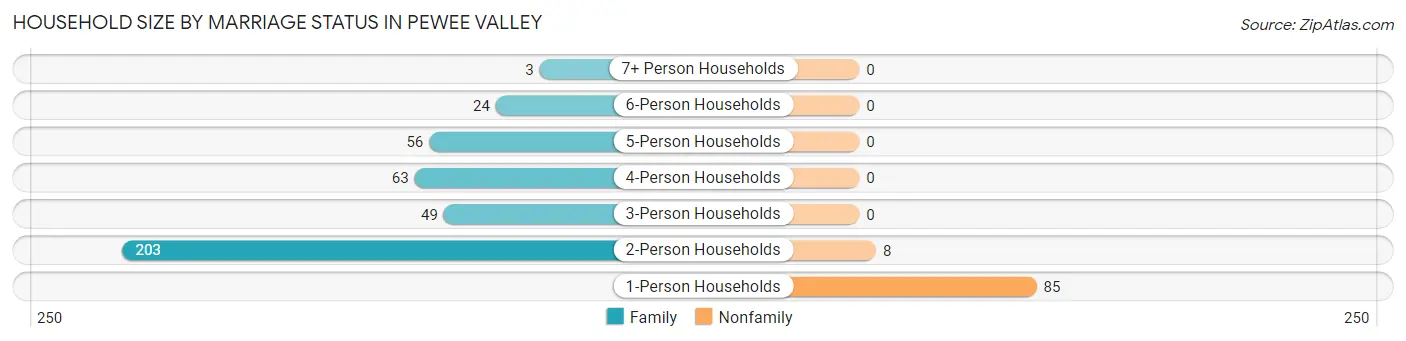
| Household Size | Family Households | Nonfamily Households |
| 1-Person Households | - | 85 (17.3%) |
| 2-Person Households | 203 (41.3%) | 8 (1.6%) |
| 3-Person Households | 49 (10.0%) | 0 (0.0%) |
| 4-Person Households | 63 (12.8%) | 0 (0.0%) |
| 5-Person Households | 56 (11.4%) | 0 (0.0%) |
| 6-Person Households | 24 (4.9%) | 0 (0.0%) |
| 7+ Person Households | 3 (0.6%) | 0 (0.0%) |
| Total | 398 (81.1%) | 93 (18.9%) |
Female Fertility in Pewee Valley
Fertility by Age in Pewee Valley
Average fertility rate in Pewee Valley is 14.0 births per 1,000 women. Women in the age bracket of 20 to 34 years have the highest fertility rate with 54.0 births per 1,000 women. Women in the age bracket of 20 to 34 years acount for 100.0% of all women with births.
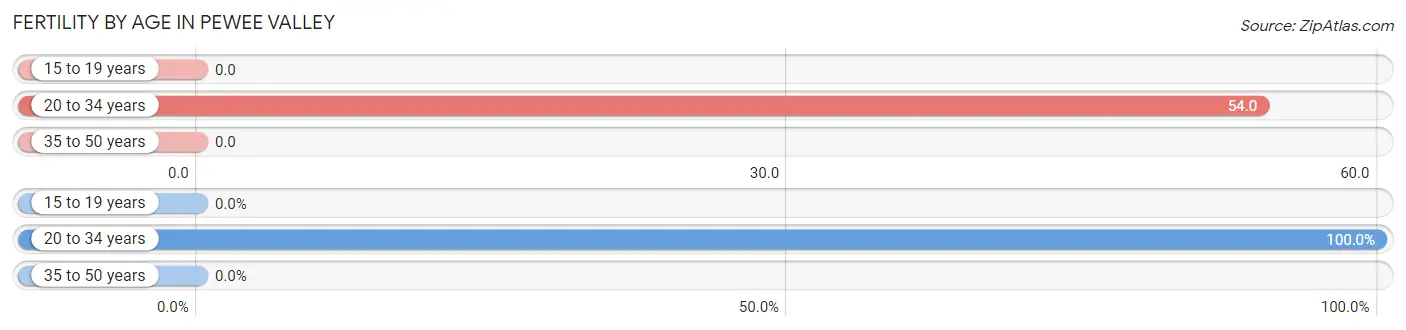
| Age Bracket | Women with Births | Births / 1,000 Women |
| 15 to 19 years | 0 (0.0%) | 0.0 |
| 20 to 34 years | 3 (100.0%) | 54.0 |
| 35 to 50 years | 0 (0.0%) | 0.0 |
| Total | 3 (100.0%) | 14.0 |
Fertility by Age by Marriage Status in Pewee Valley
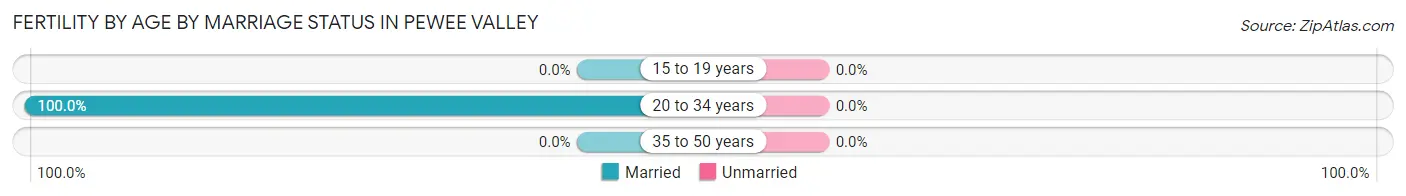
| Age Bracket | Married | Unmarried |
| 15 to 19 years | 0 (0.0%) | 0 (0.0%) |
| 20 to 34 years | 3 (100.0%) | 0 (0.0%) |
| 35 to 50 years | 0 (0.0%) | 0 (0.0%) |
| Total | 3 (100.0%) | 0 (0.0%) |
Fertility by Education in Pewee Valley
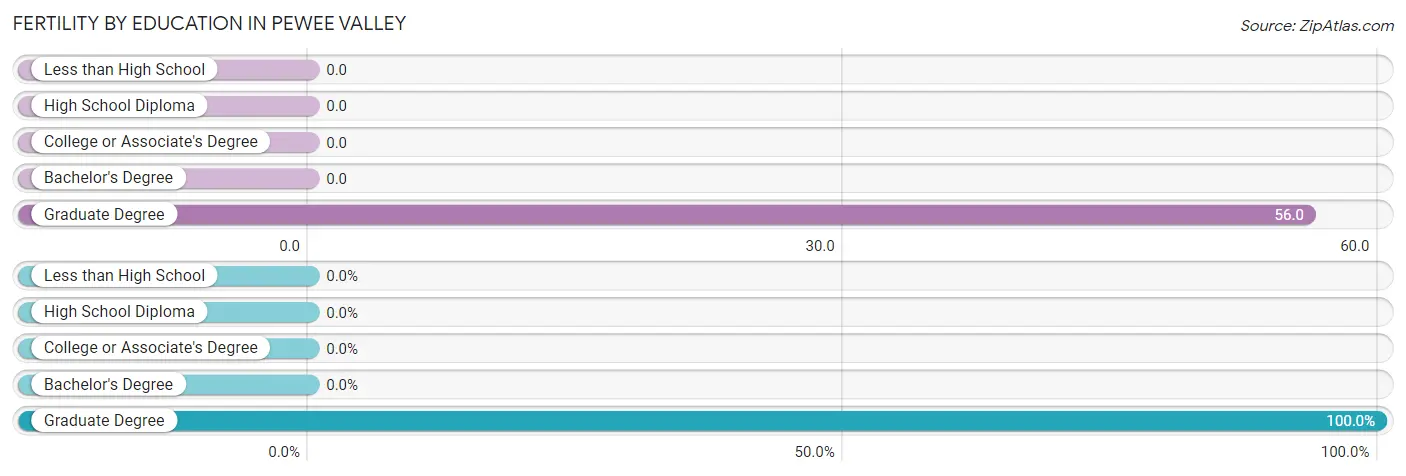
| Educational Attainment | Women with Births | Births / 1,000 Women |
| Less than High School | 0 (0.0%) | 0.0 |
| High School Diploma | 0 (0.0%) | 0.0 |
| College or Associate's Degree | 0 (0.0%) | 0.0 |
| Bachelor's Degree | 0 (0.0%) | 0.0 |
| Graduate Degree | 3 (100.0%) | 56.0 |
| Total | 3 (100.0%) | 14.0 |
Fertility by Education by Marriage Status in Pewee Valley
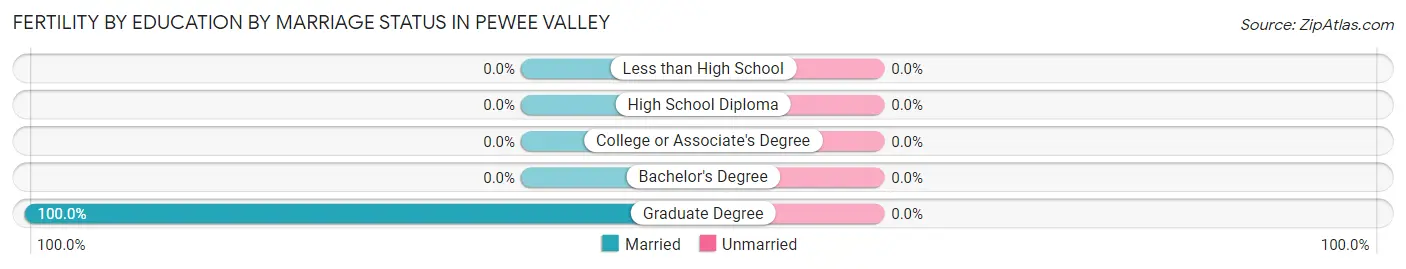
| Educational Attainment | Married | Unmarried |
| Less than High School | 0 (0.0%) | 0 (0.0%) |
| High School Diploma | 0 (0.0%) | 0 (0.0%) |
| College or Associate's Degree | 0 (0.0%) | 0 (0.0%) |
| Bachelor's Degree | 0 (0.0%) | 0 (0.0%) |
| Graduate Degree | 3 (100.0%) | 0 (0.0%) |
| Total | 3 (100.0%) | 0 (0.0%) |
Employment Characteristics in Pewee Valley
Employment by Class of Employer in Pewee Valley
Among the 643 employed individuals in Pewee Valley, private company employees (408 | 63.4%), not-for-profit organizations (57 | 8.9%), and self-employed (not incorporated) (54 | 8.4%) make up the most common classes of employment.
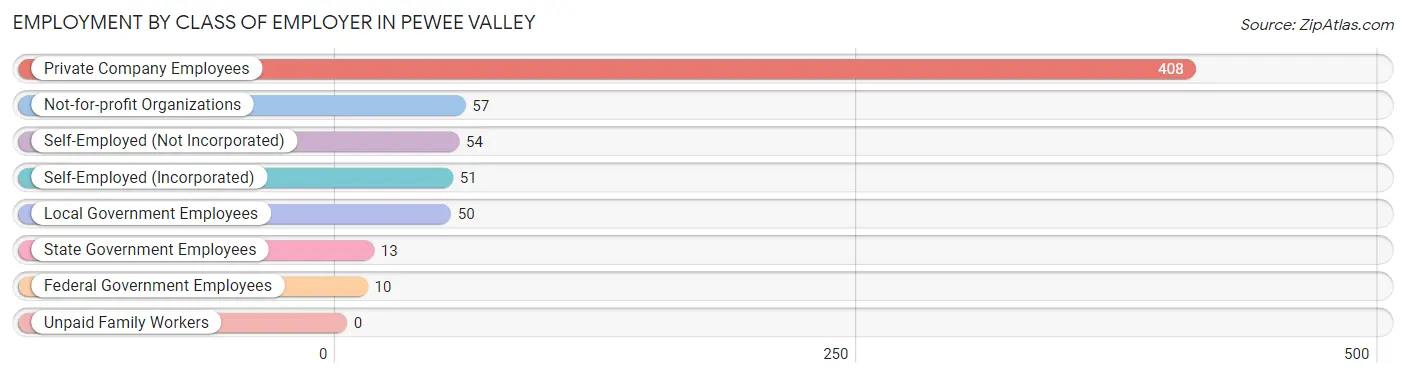
| Employer Class | # Employees | % Employees |
| Private Company Employees | 408 | 63.4% |
| Self-Employed (Incorporated) | 51 | 7.9% |
| Self-Employed (Not Incorporated) | 54 | 8.4% |
| Not-for-profit Organizations | 57 | 8.9% |
| Local Government Employees | 50 | 7.8% |
| State Government Employees | 13 | 2.0% |
| Federal Government Employees | 10 | 1.6% |
| Unpaid Family Workers | 0 | 0.0% |
| Total | 643 | 100.0% |
Employment Status by Age in Pewee Valley
According to the labor force statistics for Pewee Valley, out of the total population over 16 years of age (1,222), 54.4% or 665 individuals are in the labor force, with 2.3% or 15 of them unemployed. The age group with the highest labor force participation rate is 25 to 29 years, with 100.0% or 33 individuals in the labor force. Within the labor force, the 20 to 24 years age range has the highest percentage of unemployed individuals, with 10.3% or 6 of them being unemployed.
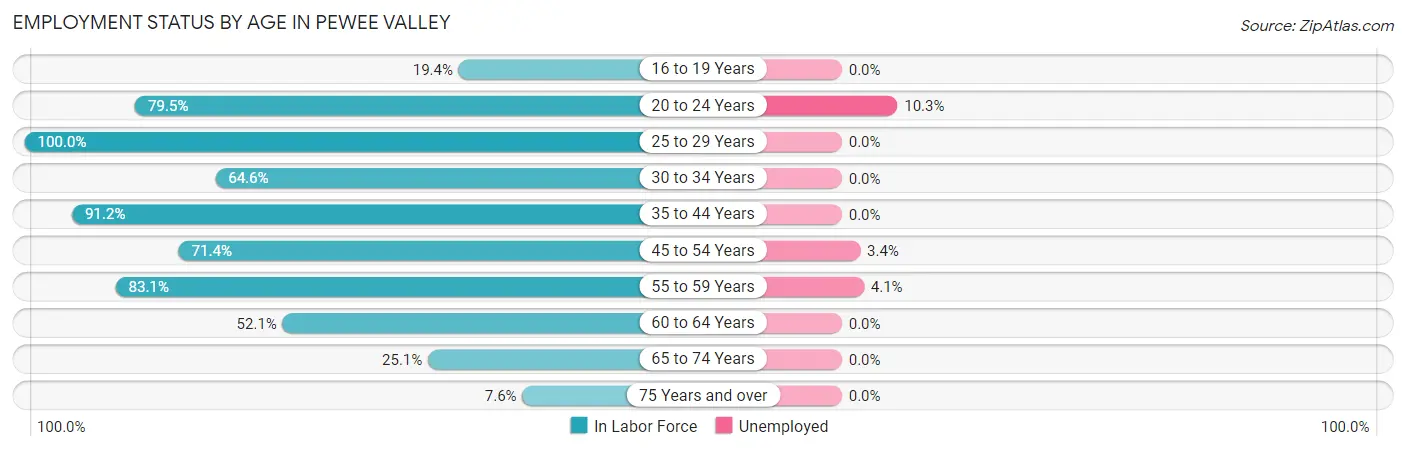
| Age Bracket | In Labor Force | Unemployed |
| 16 to 19 Years | 14 (19.4%) | 0 (0.0%) |
| 20 to 24 Years | 58 (79.5%) | 6 (10.3%) |
| 25 to 29 Years | 33 (100.0%) | 0 (0.0%) |
| 30 to 34 Years | 31 (64.6%) | 0 (0.0%) |
| 35 to 44 Years | 155 (91.2%) | 0 (0.0%) |
| 45 to 54 Years | 177 (71.4%) | 6 (3.4%) |
| 55 to 59 Years | 74 (83.1%) | 3 (4.1%) |
| 60 to 64 Years | 63 (52.1%) | 0 (0.0%) |
| 65 to 74 Years | 46 (25.1%) | 0 (0.0%) |
| 75 Years and over | 14 (7.6%) | 0 (0.0%) |
| Total | 665 (54.4%) | 15 (2.3%) |
Employment Status by Educational Attainment in Pewee Valley
According to labor force statistics for Pewee Valley, 75.2% of individuals (533) out of the total population between 25 and 64 years of age (709) are in the labor force, with 1.7% or 9 of them being unemployed. The group with the highest labor force participation rate are those with the educational attainment of less than high school, with 100.0% or 5 individuals in the labor force. Within the labor force, individuals with college / associate degree education have the highest percentage of unemployment, with 2.2% or 3 of them being unemployed.
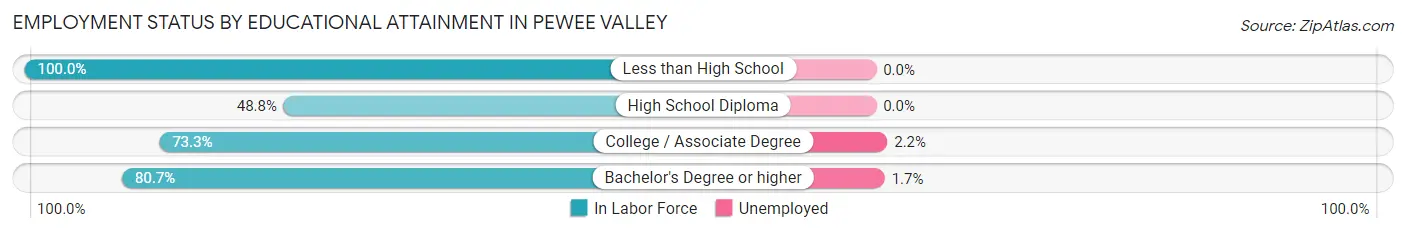
| Educational Attainment | In Labor Force | Unemployed |
| Less than High School | 5 (100.0%) | 0 (0.0%) |
| High School Diploma | 40 (48.8%) | 0 (0.0%) |
| College / Associate Degree | 137 (73.3%) | 4 (2.2%) |
| Bachelor's Degree or higher | 351 (80.7%) | 7 (1.7%) |
| Total | 533 (75.2%) | 12 (1.7%) |
Employment Occupations by Sex in Pewee Valley
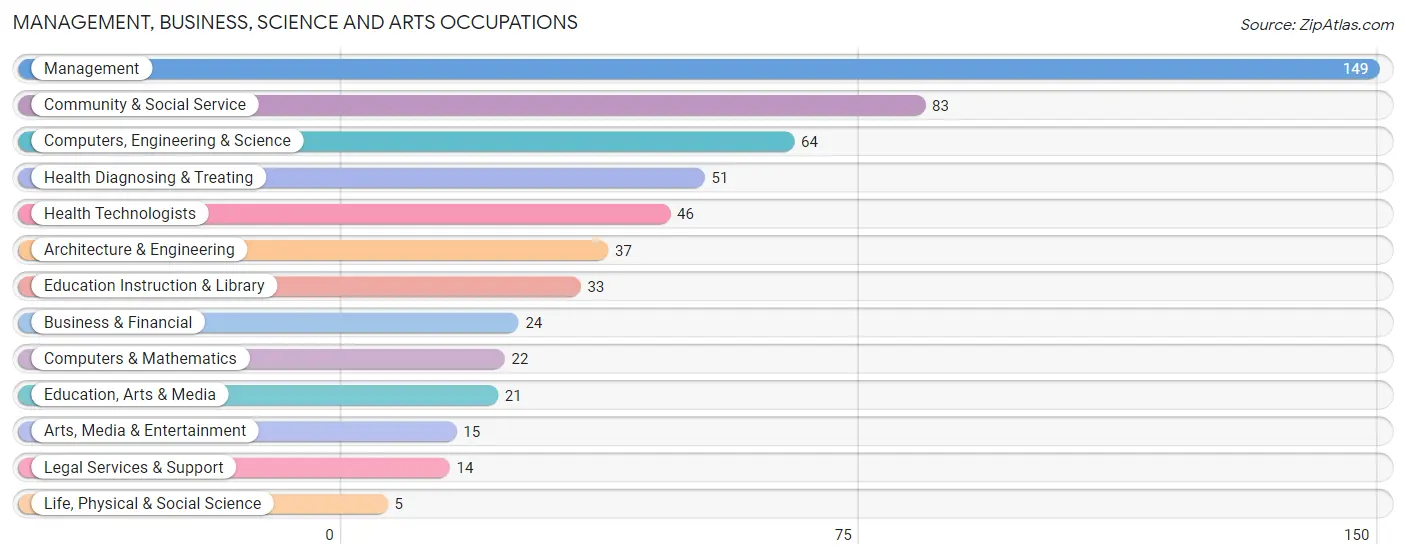
Management, Business, Science and Arts Occupations
The most common Management, Business, Science and Arts occupations in Pewee Valley are Management (149 | 22.9%), Community & Social Service (83 | 12.8%), Computers, Engineering & Science (64 | 9.9%), Health Diagnosing & Treating (51 | 7.9%), and Health Technologists (46 | 7.1%).
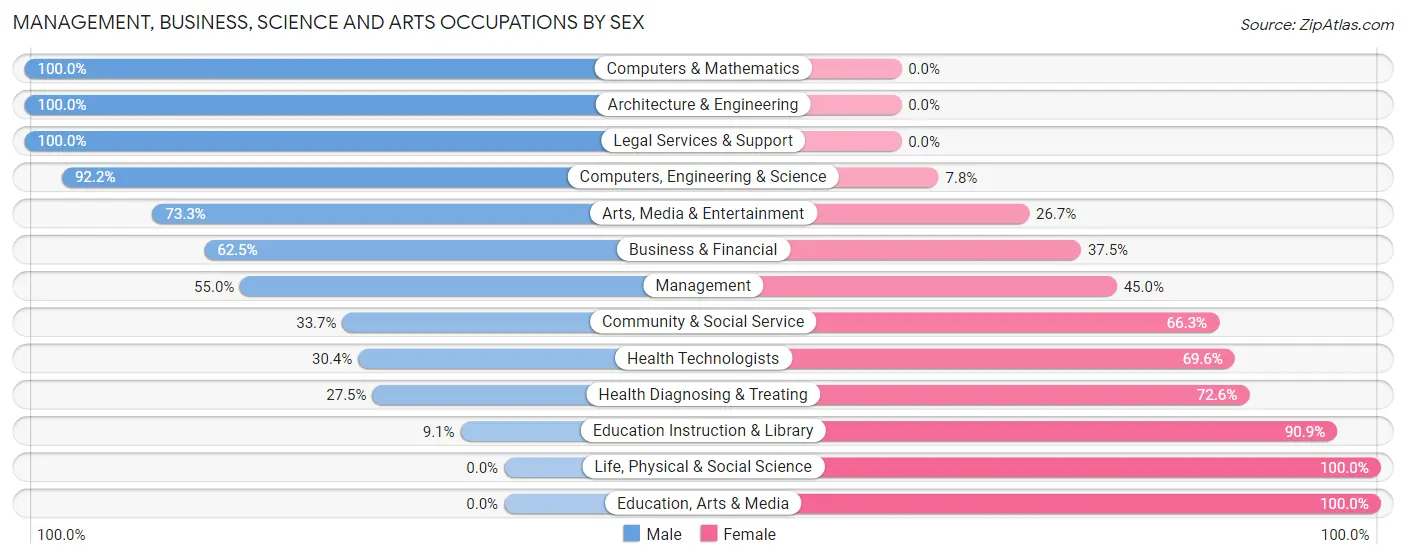
Management, Business, Science and Arts Occupations by Sex
Within the Management, Business, Science and Arts occupations in Pewee Valley, the most male-oriented occupations are Computers & Mathematics (100.0%), Architecture & Engineering (100.0%), and Legal Services & Support (100.0%), while the most female-oriented occupations are Life, Physical & Social Science (100.0%), Education, Arts & Media (100.0%), and Education Instruction & Library (90.9%).
| Occupation | Male | Female |
| Management | 82 (55.0%) | 67 (45.0%) |
| Business & Financial | 15 (62.5%) | 9 (37.5%) |
| Computers, Engineering & Science | 59 (92.2%) | 5 (7.8%) |
| Computers & Mathematics | 22 (100.0%) | 0 (0.0%) |
| Architecture & Engineering | 37 (100.0%) | 0 (0.0%) |
| Life, Physical & Social Science | 0 (0.0%) | 5 (100.0%) |
| Community & Social Service | 28 (33.7%) | 55 (66.3%) |
| Education, Arts & Media | 0 (0.0%) | 21 (100.0%) |
| Legal Services & Support | 14 (100.0%) | 0 (0.0%) |
| Education Instruction & Library | 3 (9.1%) | 30 (90.9%) |
| Arts, Media & Entertainment | 11 (73.3%) | 4 (26.7%) |
| Health Diagnosing & Treating | 14 (27.5%) | 37 (72.6%) |
| Health Technologists | 14 (30.4%) | 32 (69.6%) |
| Total (Category) | 198 (53.4%) | 173 (46.6%) |
| Total (Overall) | 386 (59.4%) | 264 (40.6%) |
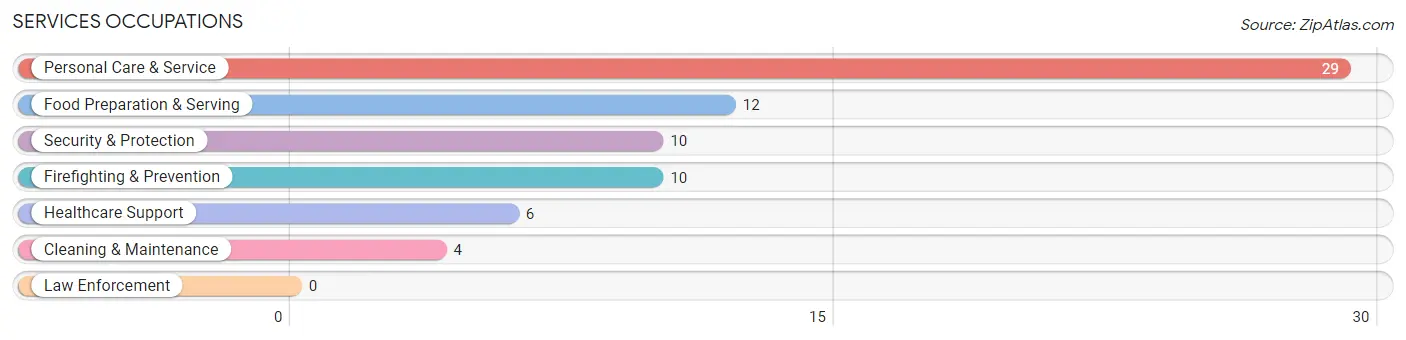
Services Occupations
The most common Services occupations in Pewee Valley are Personal Care & Service (29 | 4.5%), Food Preparation & Serving (12 | 1.8%), Security & Protection (10 | 1.5%), Firefighting & Prevention (10 | 1.5%), and Healthcare Support (6 | 0.9%).
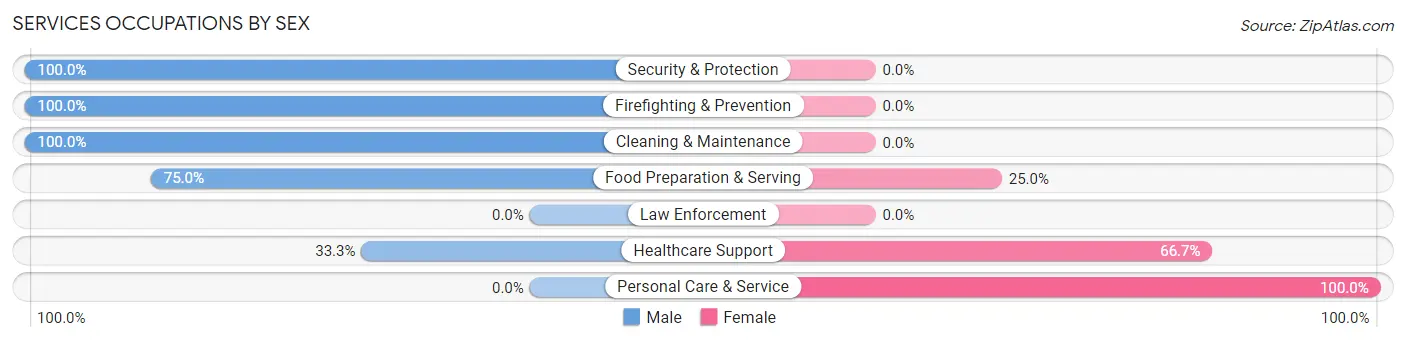
Services Occupations by Sex
Within the Services occupations in Pewee Valley, the most male-oriented occupations are Security & Protection (100.0%), Firefighting & Prevention (100.0%), and Cleaning & Maintenance (100.0%), while the most female-oriented occupations are Personal Care & Service (100.0%), Healthcare Support (66.7%), and Food Preparation & Serving (25.0%).
| Occupation | Male | Female |
| Healthcare Support | 2 (33.3%) | 4 (66.7%) |
| Security & Protection | 10 (100.0%) | 0 (0.0%) |
| Firefighting & Prevention | 10 (100.0%) | 0 (0.0%) |
| Law Enforcement | 0 (0.0%) | 0 (0.0%) |
| Food Preparation & Serving | 9 (75.0%) | 3 (25.0%) |
| Cleaning & Maintenance | 4 (100.0%) | 0 (0.0%) |
| Personal Care & Service | 0 (0.0%) | 29 (100.0%) |
| Total (Category) | 25 (41.0%) | 36 (59.0%) |
| Total (Overall) | 386 (59.4%) | 264 (40.6%) |
Sales and Office Occupations
The most common Sales and Office occupations in Pewee Valley are Sales & Related (58 | 8.9%), and Office & Administration (54 | 8.3%).
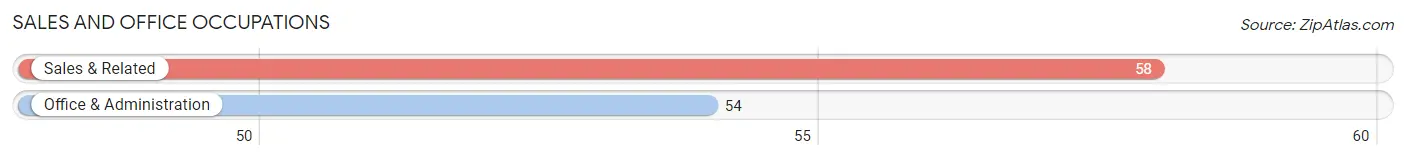
Sales and Office Occupations by Sex
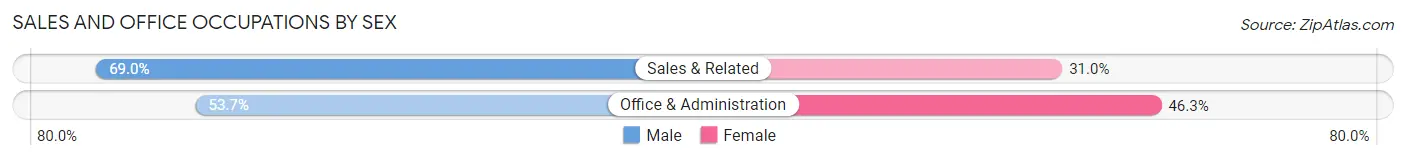
| Occupation | Male | Female |
| Sales & Related | 40 (69.0%) | 18 (31.0%) |
| Office & Administration | 29 (53.7%) | 25 (46.3%) |
| Total (Category) | 69 (61.6%) | 43 (38.4%) |
| Total (Overall) | 386 (59.4%) | 264 (40.6%) |
Natural Resources, Construction and Maintenance Occupations
The most common Natural Resources, Construction and Maintenance occupations in Pewee Valley are Construction & Extraction (25 | 3.8%), and Installation, Maintenance & Repair (23 | 3.5%).
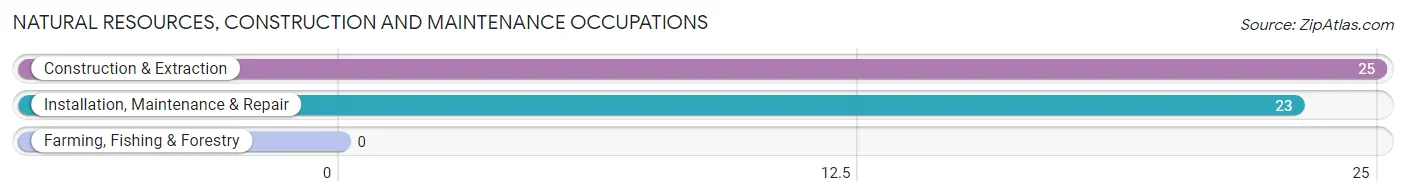
Natural Resources, Construction and Maintenance Occupations by Sex
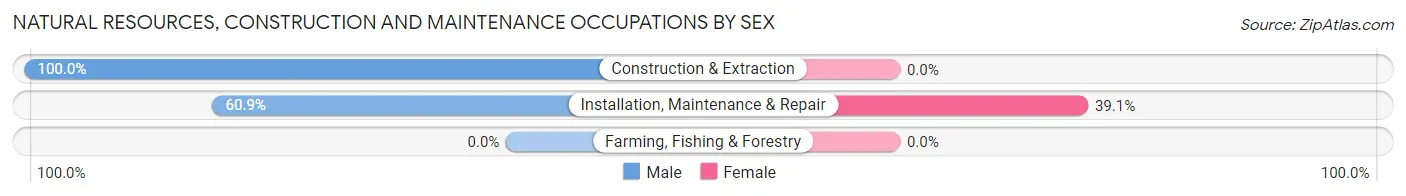
| Occupation | Male | Female |
| Farming, Fishing & Forestry | 0 (0.0%) | 0 (0.0%) |
| Construction & Extraction | 25 (100.0%) | 0 (0.0%) |
| Installation, Maintenance & Repair | 14 (60.9%) | 9 (39.1%) |
| Total (Category) | 39 (81.2%) | 9 (18.8%) |
| Total (Overall) | 386 (59.4%) | 264 (40.6%) |
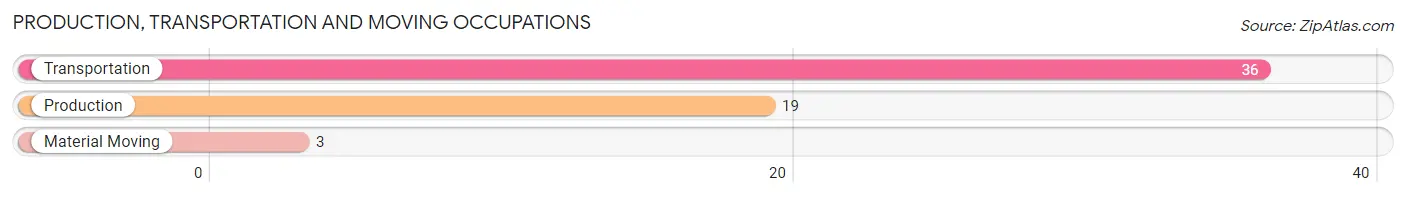
Production, Transportation and Moving Occupations
The most common Production, Transportation and Moving occupations in Pewee Valley are Transportation (36 | 5.5%), Production (19 | 2.9%), and Material Moving (3 | 0.5%).
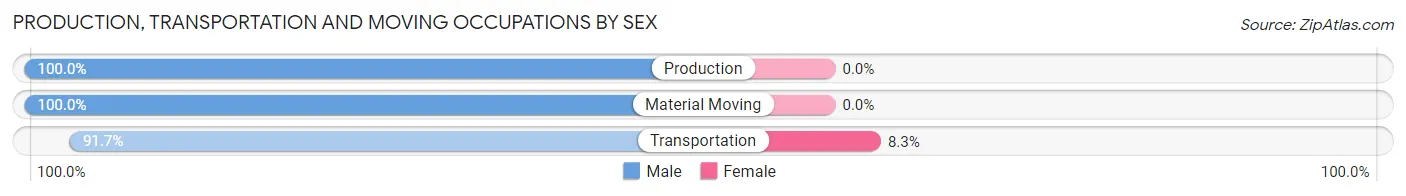
Production, Transportation and Moving Occupations by Sex
| Occupation | Male | Female |
| Production | 19 (100.0%) | 0 (0.0%) |
| Transportation | 33 (91.7%) | 3 (8.3%) |
| Material Moving | 3 (100.0%) | 0 (0.0%) |
| Total (Category) | 55 (94.8%) | 3 (5.2%) |
| Total (Overall) | 386 (59.4%) | 264 (40.6%) |
Employment Industries by Sex in Pewee Valley
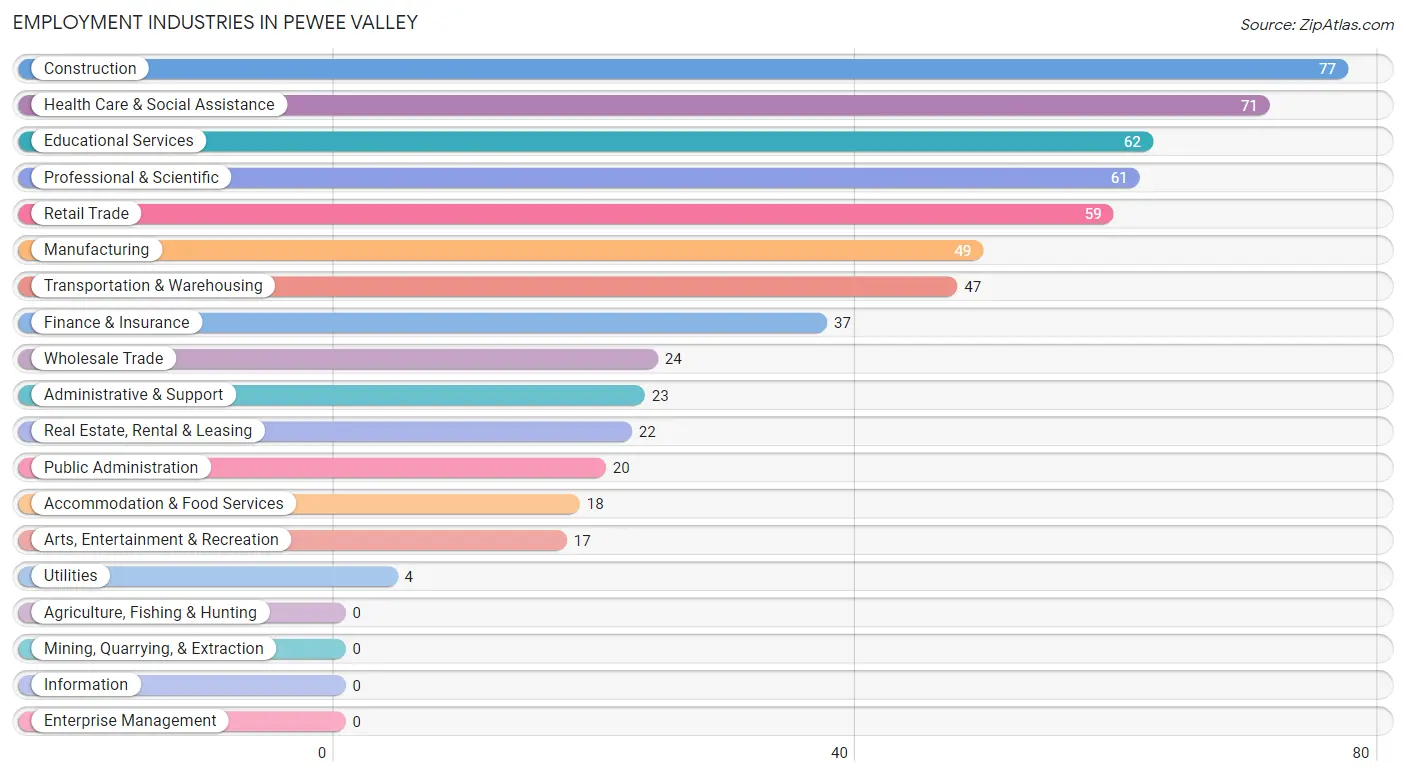
Employment Industries in Pewee Valley
The major employment industries in Pewee Valley include Construction (77 | 11.8%), Health Care & Social Assistance (71 | 10.9%), Educational Services (62 | 9.5%), Professional & Scientific (61 | 9.4%), and Retail Trade (59 | 9.1%).
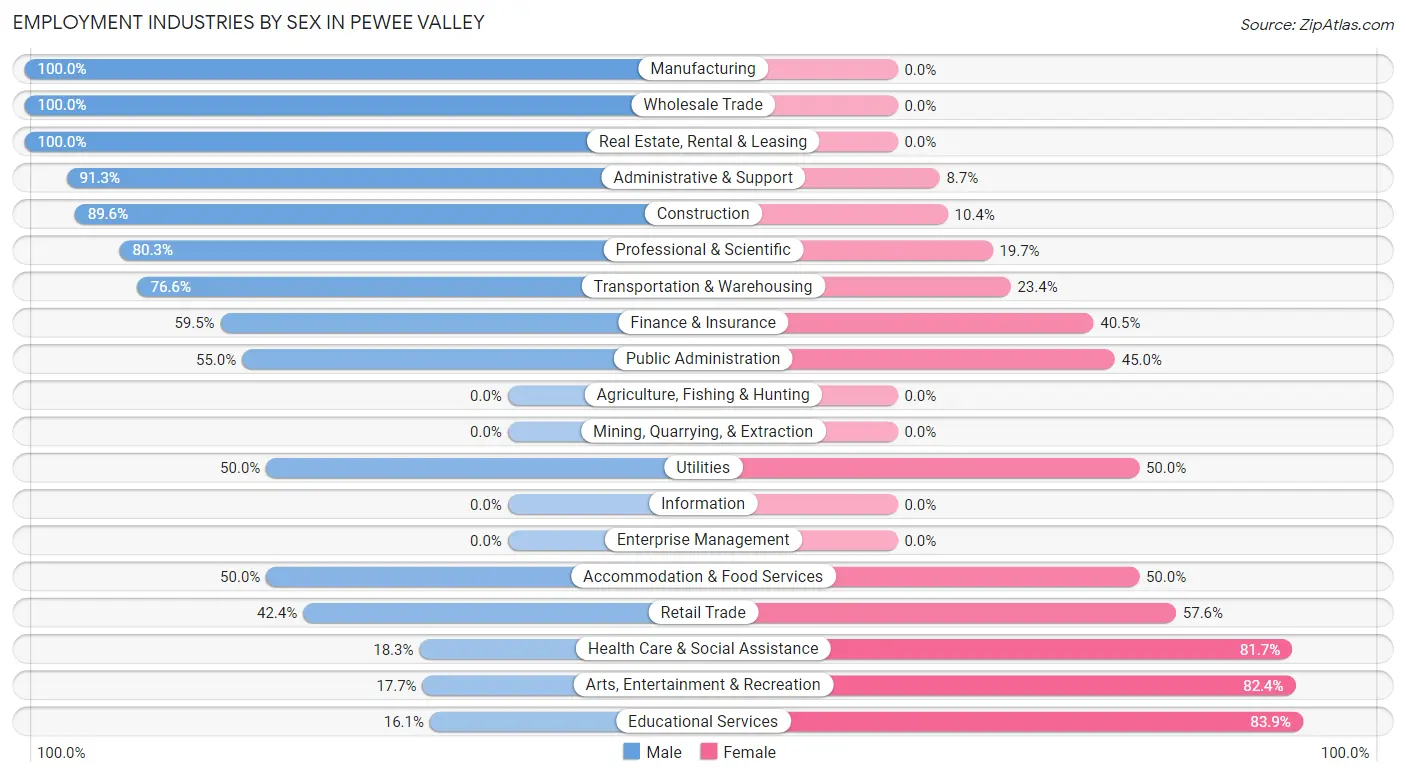
Employment Industries by Sex in Pewee Valley
The Pewee Valley industries that see more men than women are Manufacturing (100.0%), Wholesale Trade (100.0%), and Real Estate, Rental & Leasing (100.0%), whereas the industries that tend to have a higher number of women are Educational Services (83.9%), Arts, Entertainment & Recreation (82.4%), and Health Care & Social Assistance (81.7%).
| Industry | Male | Female |
| Agriculture, Fishing & Hunting | 0 (0.0%) | 0 (0.0%) |
| Mining, Quarrying, & Extraction | 0 (0.0%) | 0 (0.0%) |
| Construction | 69 (89.6%) | 8 (10.4%) |
| Manufacturing | 49 (100.0%) | 0 (0.0%) |
| Wholesale Trade | 24 (100.0%) | 0 (0.0%) |
| Retail Trade | 25 (42.4%) | 34 (57.6%) |
| Transportation & Warehousing | 36 (76.6%) | 11 (23.4%) |
| Utilities | 2 (50.0%) | 2 (50.0%) |
| Information | 0 (0.0%) | 0 (0.0%) |
| Finance & Insurance | 22 (59.5%) | 15 (40.5%) |
| Real Estate, Rental & Leasing | 22 (100.0%) | 0 (0.0%) |
| Professional & Scientific | 49 (80.3%) | 12 (19.7%) |
| Enterprise Management | 0 (0.0%) | 0 (0.0%) |
| Administrative & Support | 21 (91.3%) | 2 (8.7%) |
| Educational Services | 10 (16.1%) | 52 (83.9%) |
| Health Care & Social Assistance | 13 (18.3%) | 58 (81.7%) |
| Arts, Entertainment & Recreation | 3 (17.6%) | 14 (82.4%) |
| Accommodation & Food Services | 9 (50.0%) | 9 (50.0%) |
| Public Administration | 11 (55.0%) | 9 (45.0%) |
| Total | 386 (59.4%) | 264 (40.6%) |
Education in Pewee Valley
School Enrollment in Pewee Valley
The most common levels of schooling among the 374 students in Pewee Valley are middle school (129 | 34.5%), high school (88 | 23.5%), and elementary school (60 | 16.0%).
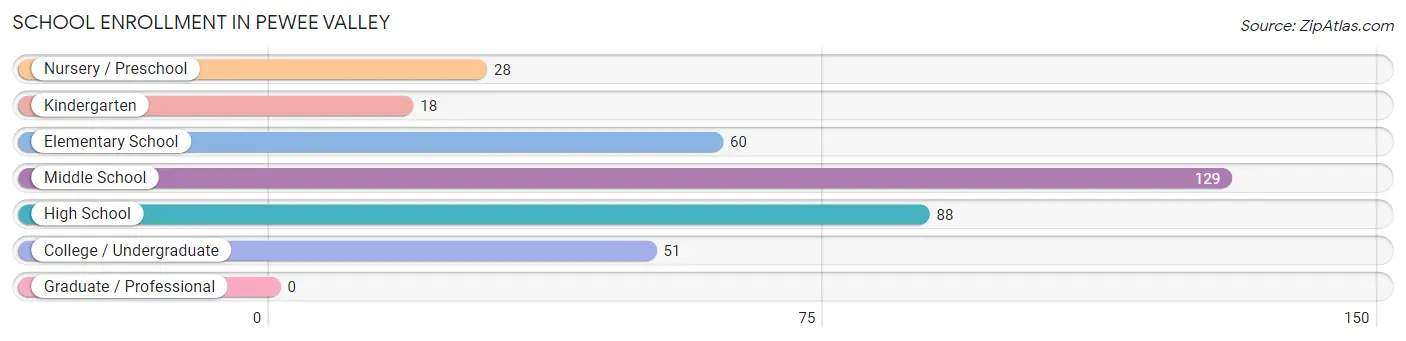
| School Level | # Students | % Students |
| Nursery / Preschool | 28 | 7.5% |
| Kindergarten | 18 | 4.8% |
| Elementary School | 60 | 16.0% |
| Middle School | 129 | 34.5% |
| High School | 88 | 23.5% |
| College / Undergraduate | 51 | 13.6% |
| Graduate / Professional | 0 | 0.0% |
| Total | 374 | 100.0% |
School Enrollment by Age by Funding Source in Pewee Valley
Out of a total of 374 students who are enrolled in schools in Pewee Valley, 134 (35.8%) attend a private institution, while the remaining 240 (64.2%) are enrolled in public schools. The age group of 25 to 34 year olds has the highest likelihood of being enrolled in private schools, with 18 (100.0% in the age bracket) enrolled. Conversely, the age group of 10 to 14 year olds has the lowest likelihood of being enrolled in a private school, with 122 (88.4% in the age bracket) attending a public institution.
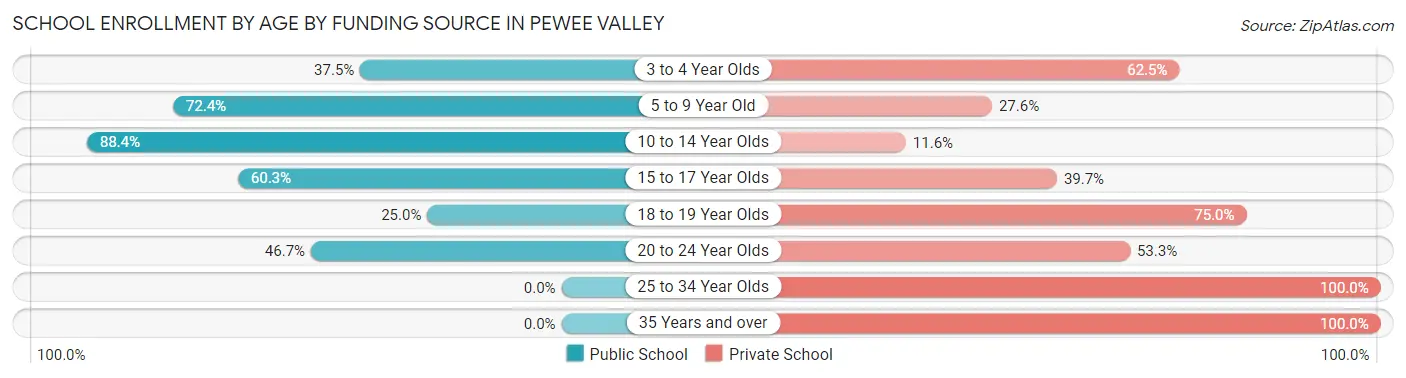
| Age Bracket | Public School | Private School |
| 3 to 4 Year Olds | 9 (37.5%) | 15 (62.5%) |
| 5 to 9 Year Old | 55 (72.4%) | 21 (27.6%) |
| 10 to 14 Year Olds | 122 (88.4%) | 16 (11.6%) |
| 15 to 17 Year Olds | 44 (60.3%) | 29 (39.7%) |
| 18 to 19 Year Olds | 3 (25.0%) | 9 (75.0%) |
| 20 to 24 Year Olds | 7 (46.7%) | 8 (53.3%) |
| 25 to 34 Year Olds | 0 (0.0%) | 18 (100.0%) |
| 35 Years and over | 0 (0.0%) | 18 (100.0%) |
| Total | 240 (64.2%) | 134 (35.8%) |
Educational Attainment by Field of Study in Pewee Valley
Business (120 | 20.5%), education (94 | 16.1%), engineering (54 | 9.2%), science & technology (48 | 8.2%), and literature & languages (45 | 7.7%) are the most common fields of study among 584 individuals in Pewee Valley who have obtained a bachelor's degree or higher.
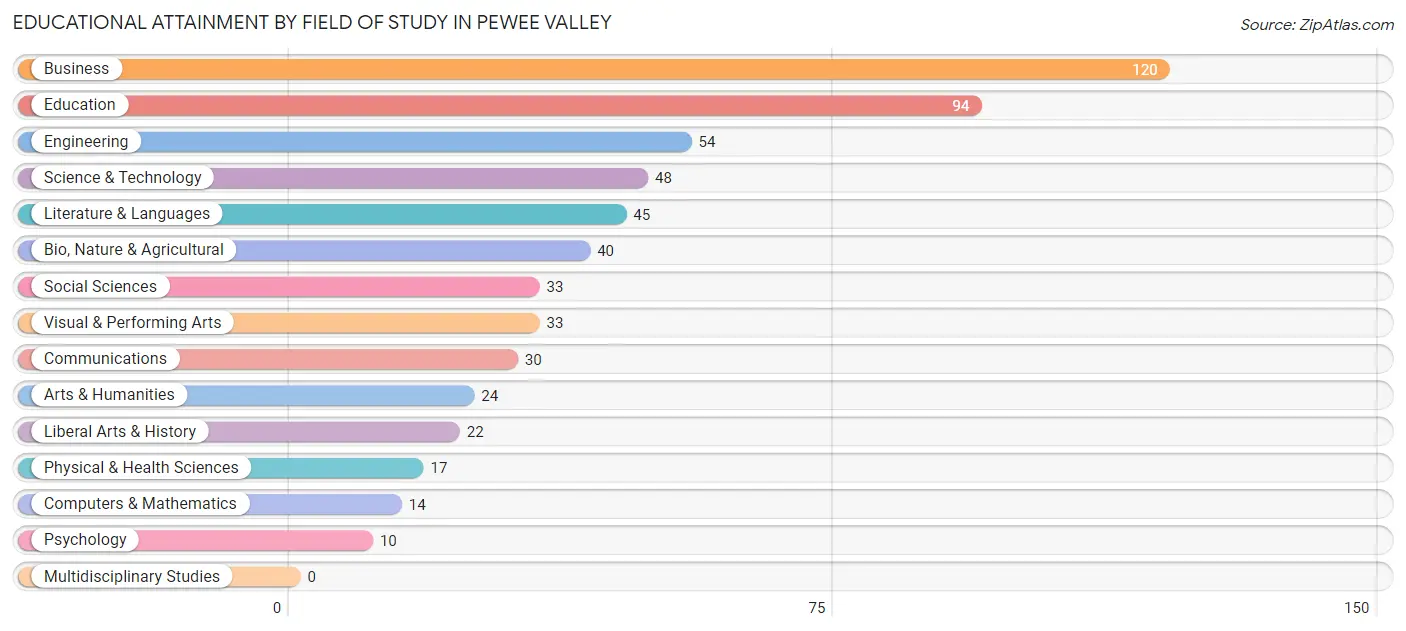
| Field of Study | # Graduates | % Graduates |
| Computers & Mathematics | 14 | 2.4% |
| Bio, Nature & Agricultural | 40 | 6.9% |
| Physical & Health Sciences | 17 | 2.9% |
| Psychology | 10 | 1.7% |
| Social Sciences | 33 | 5.7% |
| Engineering | 54 | 9.2% |
| Multidisciplinary Studies | 0 | 0.0% |
| Science & Technology | 48 | 8.2% |
| Business | 120 | 20.5% |
| Education | 94 | 16.1% |
| Literature & Languages | 45 | 7.7% |
| Liberal Arts & History | 22 | 3.8% |
| Visual & Performing Arts | 33 | 5.7% |
| Communications | 30 | 5.1% |
| Arts & Humanities | 24 | 4.1% |
| Total | 584 | 100.0% |
Transportation & Commute in Pewee Valley
Vehicle Availability by Sex in Pewee Valley
The most prevalent vehicle ownership categories in Pewee Valley are males with 2 vehicles (182, accounting for 47.8%) and females with 2 vehicles (159, making up 69.5%).
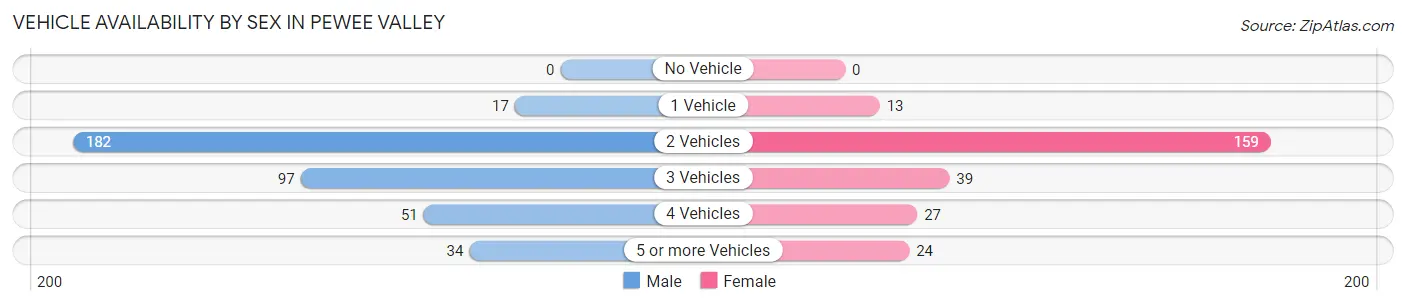
| Vehicles Available | Male | Female |
| No Vehicle | 0 (0.0%) | 0 (0.0%) |
| 1 Vehicle | 17 (4.5%) | 13 (5.0%) |
| 2 Vehicles | 182 (47.8%) | 159 (60.7%) |
| 3 Vehicles | 97 (25.5%) | 39 (14.9%) |
| 4 Vehicles | 51 (13.4%) | 27 (10.3%) |
| 5 or more Vehicles | 34 (8.9%) | 24 (9.2%) |
| Total | 381 (100.0%) | 262 (100.0%) |
Commute Time in Pewee Valley
The most frequently occuring commute durations in Pewee Valley are 30 to 34 minutes (107 commuters, 19.2%), 20 to 24 minutes (94 commuters, 16.9%), and 15 to 19 minutes (90 commuters, 16.1%).
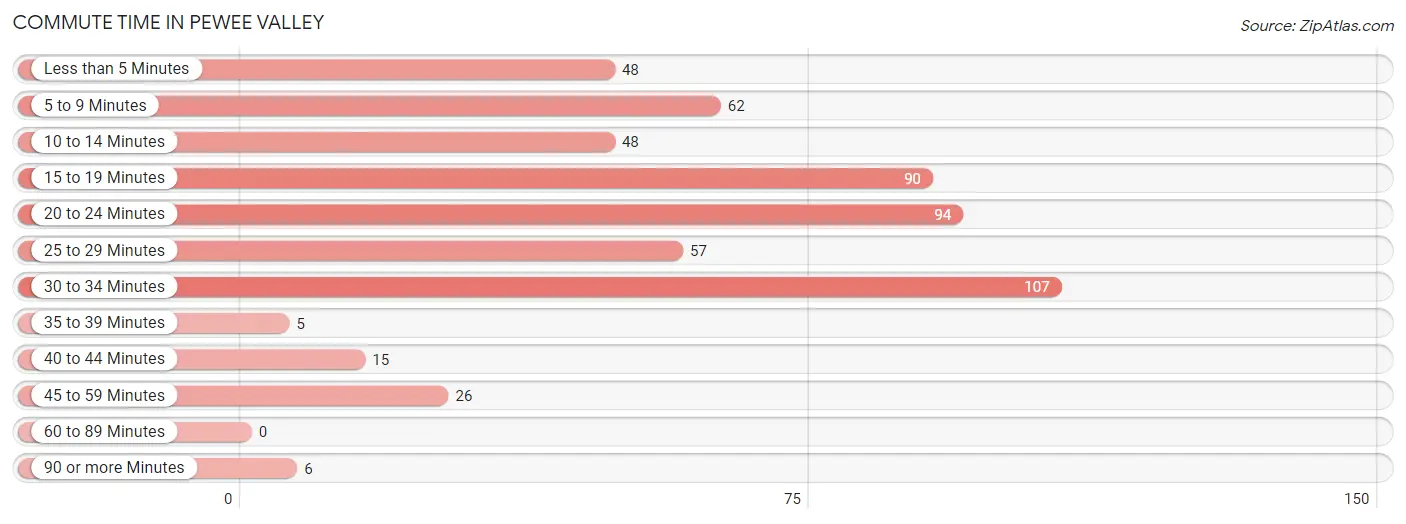
| Commute Time | # Commuters | % Commuters |
| Less than 5 Minutes | 48 | 8.6% |
| 5 to 9 Minutes | 62 | 11.1% |
| 10 to 14 Minutes | 48 | 8.6% |
| 15 to 19 Minutes | 90 | 16.1% |
| 20 to 24 Minutes | 94 | 16.9% |
| 25 to 29 Minutes | 57 | 10.2% |
| 30 to 34 Minutes | 107 | 19.2% |
| 35 to 39 Minutes | 5 | 0.9% |
| 40 to 44 Minutes | 15 | 2.7% |
| 45 to 59 Minutes | 26 | 4.7% |
| 60 to 89 Minutes | 0 | 0.0% |
| 90 or more Minutes | 6 | 1.1% |
Commute Time by Sex in Pewee Valley
The most common commute times in Pewee Valley are 15 to 19 minutes (54 commuters, 16.1%) for males and 20 to 24 minutes (55 commuters, 24.7%) for females.
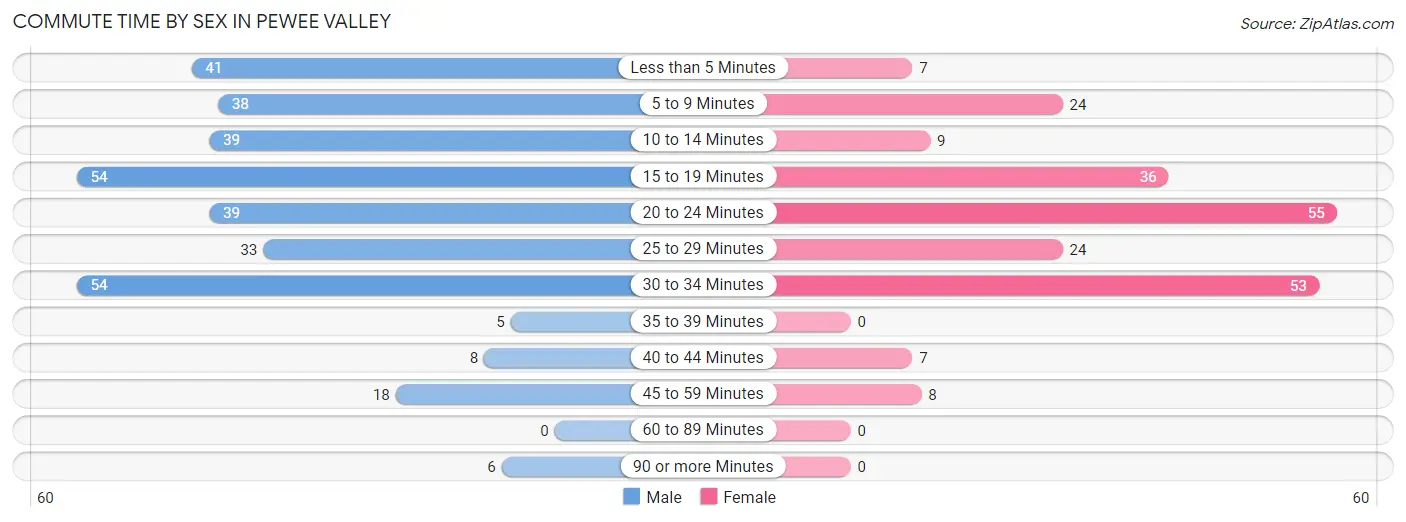
| Commute Time | Male | Female |
| Less than 5 Minutes | 41 (12.2%) | 7 (3.1%) |
| 5 to 9 Minutes | 38 (11.3%) | 24 (10.8%) |
| 10 to 14 Minutes | 39 (11.6%) | 9 (4.0%) |
| 15 to 19 Minutes | 54 (16.1%) | 36 (16.1%) |
| 20 to 24 Minutes | 39 (11.6%) | 55 (24.7%) |
| 25 to 29 Minutes | 33 (9.9%) | 24 (10.8%) |
| 30 to 34 Minutes | 54 (16.1%) | 53 (23.8%) |
| 35 to 39 Minutes | 5 (1.5%) | 0 (0.0%) |
| 40 to 44 Minutes | 8 (2.4%) | 7 (3.1%) |
| 45 to 59 Minutes | 18 (5.4%) | 8 (3.6%) |
| 60 to 89 Minutes | 0 (0.0%) | 0 (0.0%) |
| 90 or more Minutes | 6 (1.8%) | 0 (0.0%) |
Time of Departure to Work by Sex in Pewee Valley
The most frequent times of departure to work in Pewee Valley are 9:00 AM to 9:59 AM (82, 24.5%) for males and 7:00 AM to 7:29 AM (45, 20.2%) for females.
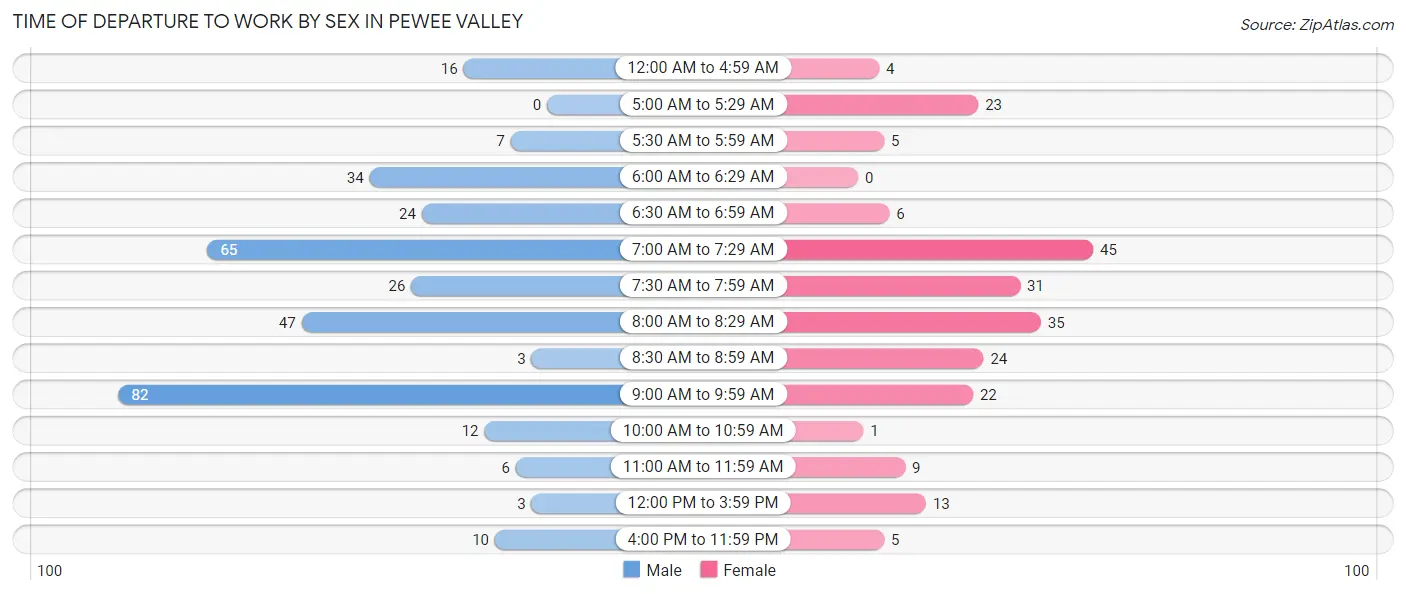
| Time of Departure | Male | Female |
| 12:00 AM to 4:59 AM | 16 (4.8%) | 4 (1.8%) |
| 5:00 AM to 5:29 AM | 0 (0.0%) | 23 (10.3%) |
| 5:30 AM to 5:59 AM | 7 (2.1%) | 5 (2.2%) |
| 6:00 AM to 6:29 AM | 34 (10.2%) | 0 (0.0%) |
| 6:30 AM to 6:59 AM | 24 (7.2%) | 6 (2.7%) |
| 7:00 AM to 7:29 AM | 65 (19.4%) | 45 (20.2%) |
| 7:30 AM to 7:59 AM | 26 (7.8%) | 31 (13.9%) |
| 8:00 AM to 8:29 AM | 47 (14.0%) | 35 (15.7%) |
| 8:30 AM to 8:59 AM | 3 (0.9%) | 24 (10.8%) |
| 9:00 AM to 9:59 AM | 82 (24.5%) | 22 (9.9%) |
| 10:00 AM to 10:59 AM | 12 (3.6%) | 1 (0.4%) |
| 11:00 AM to 11:59 AM | 6 (1.8%) | 9 (4.0%) |
| 12:00 PM to 3:59 PM | 3 (0.9%) | 13 (5.8%) |
| 4:00 PM to 11:59 PM | 10 (3.0%) | 5 (2.2%) |
| Total | 335 (100.0%) | 223 (100.0%) |
Housing Occupancy in Pewee Valley
Occupancy by Ownership in Pewee Valley
Of the total 491 dwellings in Pewee Valley, owner-occupied units account for 462 (94.1%), while renter-occupied units make up 29 (5.9%).
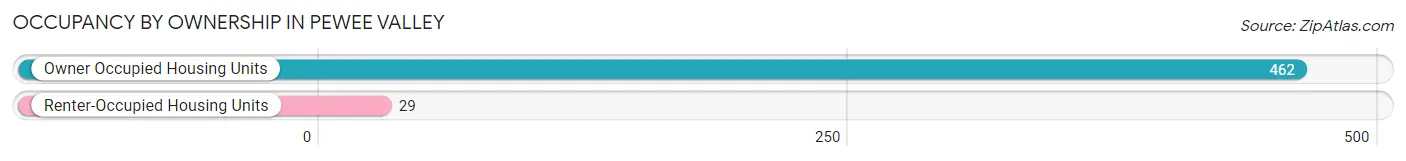
| Occupancy | # Housing Units | % Housing Units |
| Owner Occupied Housing Units | 462 | 94.1% |
| Renter-Occupied Housing Units | 29 | 5.9% |
| Total Occupied Housing Units | 491 | 100.0% |
Occupancy by Household Size in Pewee Valley
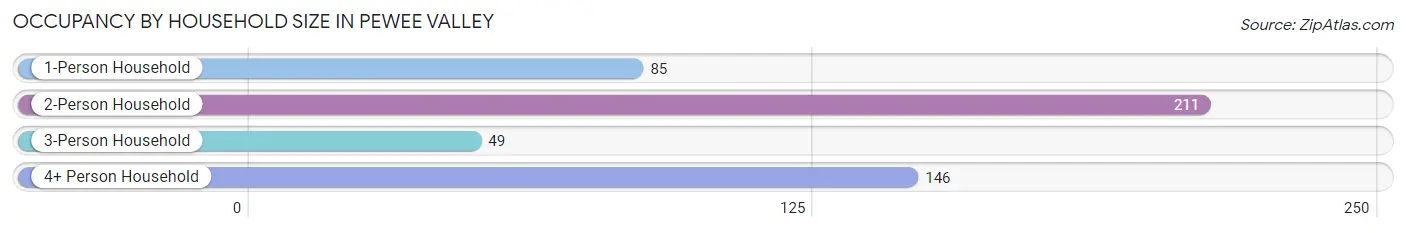
| Household Size | # Housing Units | % Housing Units |
| 1-Person Household | 85 | 17.3% |
| 2-Person Household | 211 | 43.0% |
| 3-Person Household | 49 | 10.0% |
| 4+ Person Household | 146 | 29.7% |
| Total Housing Units | 491 | 100.0% |
Occupancy by Ownership by Household Size in Pewee Valley
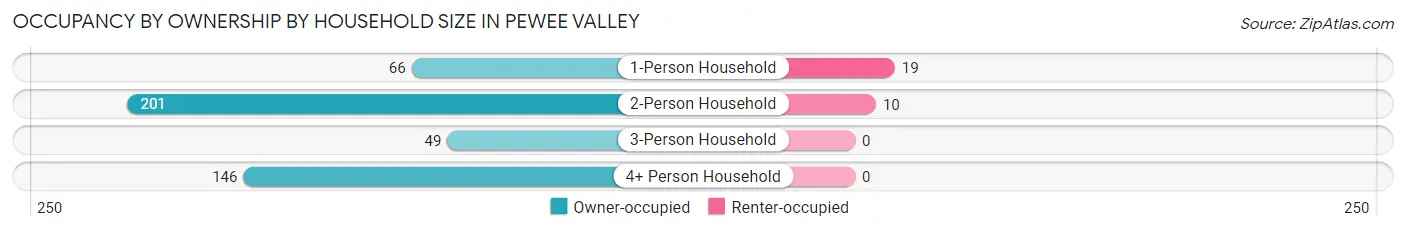
| Household Size | Owner-occupied | Renter-occupied |
| 1-Person Household | 66 (77.6%) | 19 (22.4%) |
| 2-Person Household | 201 (95.3%) | 10 (4.7%) |
| 3-Person Household | 49 (100.0%) | 0 (0.0%) |
| 4+ Person Household | 146 (100.0%) | 0 (0.0%) |
| Total Housing Units | 462 (94.1%) | 29 (5.9%) |
Occupancy by Educational Attainment in Pewee Valley
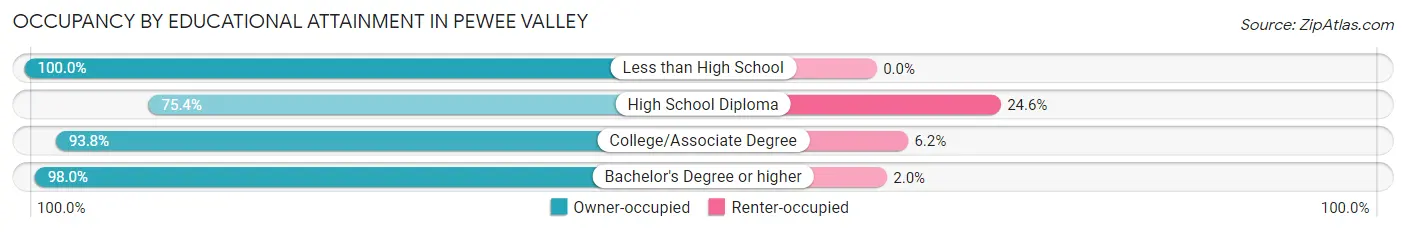
| Household Size | Owner-occupied | Renter-occupied |
| Less than High School | 2 (100.0%) | 0 (0.0%) |
| High School Diploma | 46 (75.4%) | 15 (24.6%) |
| College/Associate Degree | 121 (93.8%) | 8 (6.2%) |
| Bachelor's Degree or higher | 293 (98.0%) | 6 (2.0%) |
Occupancy by Age of Householder in Pewee Valley
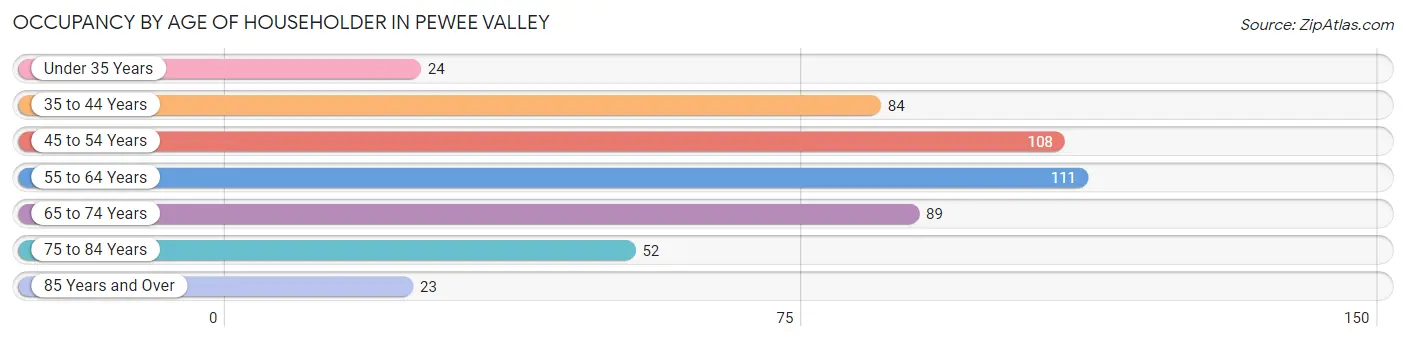
| Age Bracket | # Households | % Households |
| Under 35 Years | 24 | 4.9% |
| 35 to 44 Years | 84 | 17.1% |
| 45 to 54 Years | 108 | 22.0% |
| 55 to 64 Years | 111 | 22.6% |
| 65 to 74 Years | 89 | 18.1% |
| 75 to 84 Years | 52 | 10.6% |
| 85 Years and Over | 23 | 4.7% |
| Total | 491 | 100.0% |
Housing Finances in Pewee Valley
Median Income by Occupancy in Pewee Valley
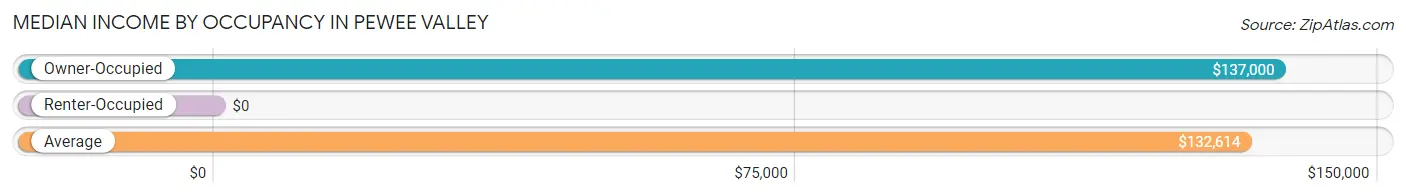
| Occupancy Type | # Households | Median Income |
| Owner-Occupied | 462 (94.1%) | $137,000 |
| Renter-Occupied | 29 (5.9%) | $0 |
| Average | 491 (100.0%) | $132,614 |
Occupancy by Householder Income Bracket in Pewee Valley
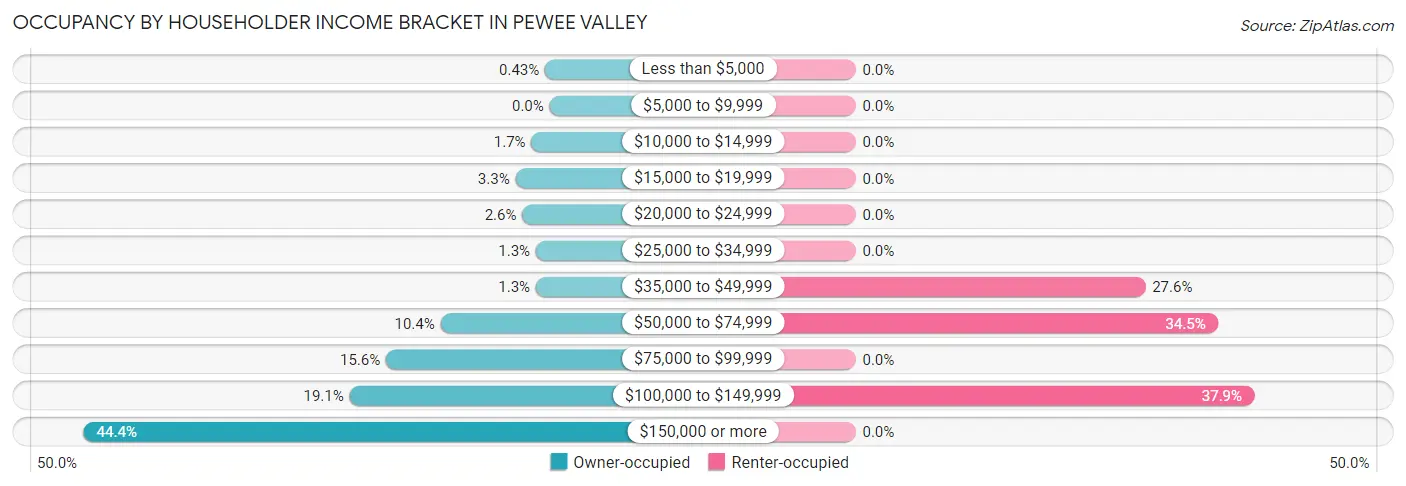
| Income Bracket | Owner-occupied | Renter-occupied |
| Less than $5,000 | 2 (0.4%) | 0 (0.0%) |
| $5,000 to $9,999 | 0 (0.0%) | 0 (0.0%) |
| $10,000 to $14,999 | 8 (1.7%) | 0 (0.0%) |
| $15,000 to $19,999 | 15 (3.3%) | 0 (0.0%) |
| $20,000 to $24,999 | 12 (2.6%) | 0 (0.0%) |
| $25,000 to $34,999 | 6 (1.3%) | 0 (0.0%) |
| $35,000 to $49,999 | 6 (1.3%) | 8 (27.6%) |
| $50,000 to $74,999 | 48 (10.4%) | 10 (34.5%) |
| $75,000 to $99,999 | 72 (15.6%) | 0 (0.0%) |
| $100,000 to $149,999 | 88 (19.1%) | 11 (37.9%) |
| $150,000 or more | 205 (44.4%) | 0 (0.0%) |
| Total | 462 (100.0%) | 29 (100.0%) |
Monthly Housing Cost Tiers in Pewee Valley
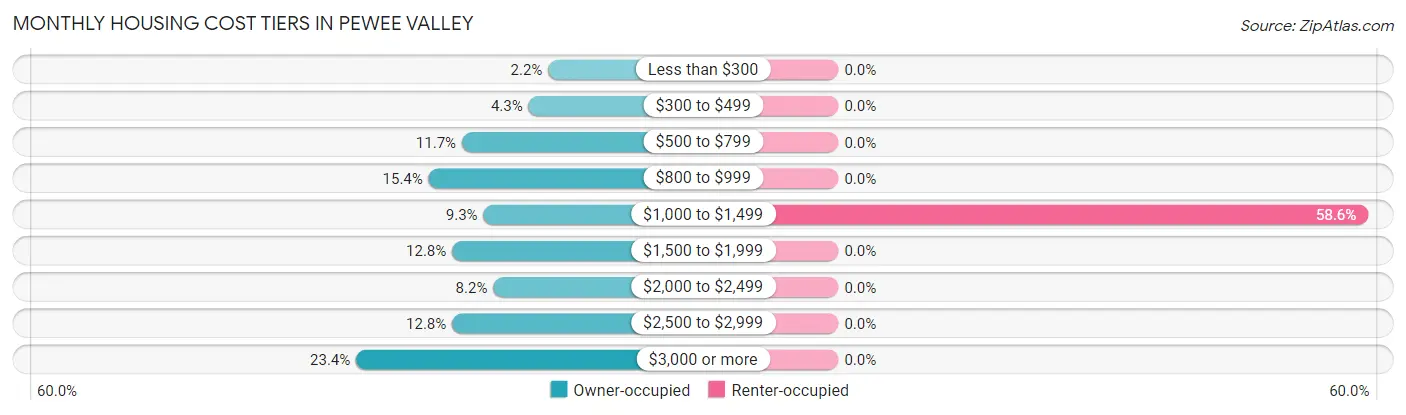
| Monthly Cost | Owner-occupied | Renter-occupied |
| Less than $300 | 10 (2.2%) | 0 (0.0%) |
| $300 to $499 | 20 (4.3%) | 0 (0.0%) |
| $500 to $799 | 54 (11.7%) | 0 (0.0%) |
| $800 to $999 | 71 (15.4%) | 0 (0.0%) |
| $1,000 to $1,499 | 43 (9.3%) | 17 (58.6%) |
| $1,500 to $1,999 | 59 (12.8%) | 0 (0.0%) |
| $2,000 to $2,499 | 38 (8.2%) | 0 (0.0%) |
| $2,500 to $2,999 | 59 (12.8%) | 0 (0.0%) |
| $3,000 or more | 108 (23.4%) | 0 (0.0%) |
| Total | 462 (100.0%) | 29 (100.0%) |
Physical Housing Characteristics in Pewee Valley
Housing Structures in Pewee Valley
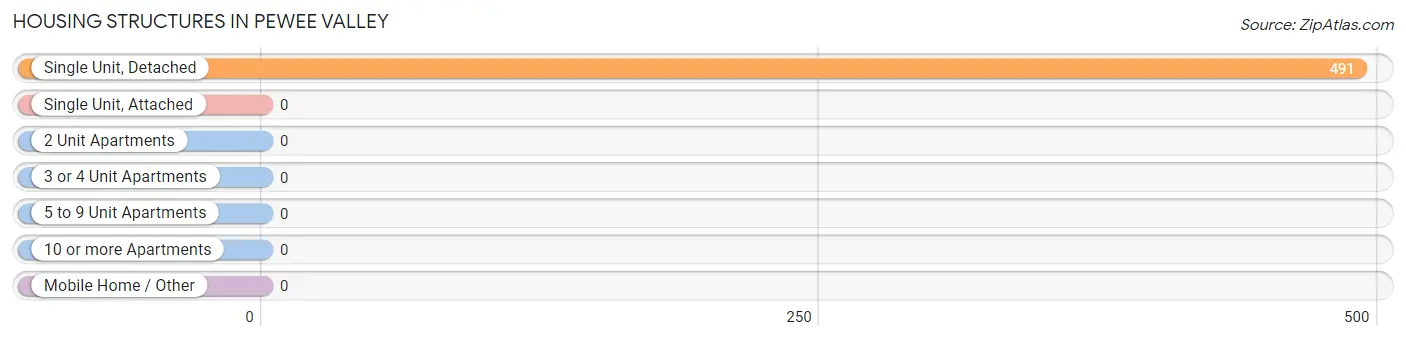
| Structure Type | # Housing Units | % Housing Units |
| Single Unit, Detached | 491 | 100.0% |
| Single Unit, Attached | 0 | 0.0% |
| 2 Unit Apartments | 0 | 0.0% |
| 3 or 4 Unit Apartments | 0 | 0.0% |
| 5 to 9 Unit Apartments | 0 | 0.0% |
| 10 or more Apartments | 0 | 0.0% |
| Mobile Home / Other | 0 | 0.0% |
| Total | 491 | 100.0% |
Housing Structures by Occupancy in Pewee Valley
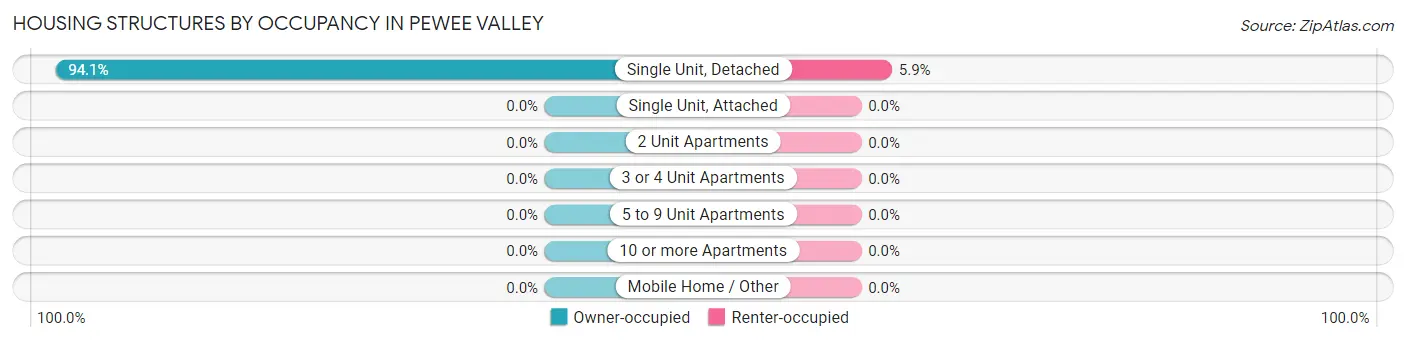
| Structure Type | Owner-occupied | Renter-occupied |
| Single Unit, Detached | 462 (94.1%) | 29 (5.9%) |
| Single Unit, Attached | 0 (0.0%) | 0 (0.0%) |
| 2 Unit Apartments | 0 (0.0%) | 0 (0.0%) |
| 3 or 4 Unit Apartments | 0 (0.0%) | 0 (0.0%) |
| 5 to 9 Unit Apartments | 0 (0.0%) | 0 (0.0%) |
| 10 or more Apartments | 0 (0.0%) | 0 (0.0%) |
| Mobile Home / Other | 0 (0.0%) | 0 (0.0%) |
| Total | 462 (94.1%) | 29 (5.9%) |
Housing Structures by Number of Rooms in Pewee Valley
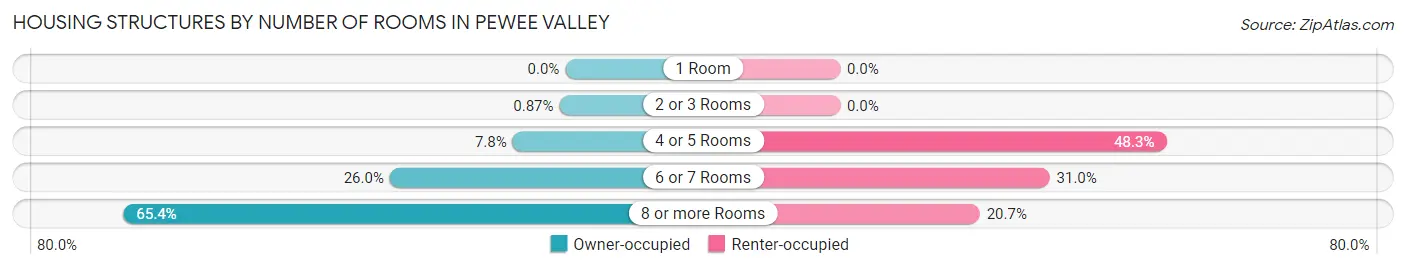
| Number of Rooms | Owner-occupied | Renter-occupied |
| 1 Room | 0 (0.0%) | 0 (0.0%) |
| 2 or 3 Rooms | 4 (0.9%) | 0 (0.0%) |
| 4 or 5 Rooms | 36 (7.8%) | 14 (48.3%) |
| 6 or 7 Rooms | 120 (26.0%) | 9 (31.0%) |
| 8 or more Rooms | 302 (65.4%) | 6 (20.7%) |
| Total | 462 (100.0%) | 29 (100.0%) |
Housing Structure by Heating Type in Pewee Valley
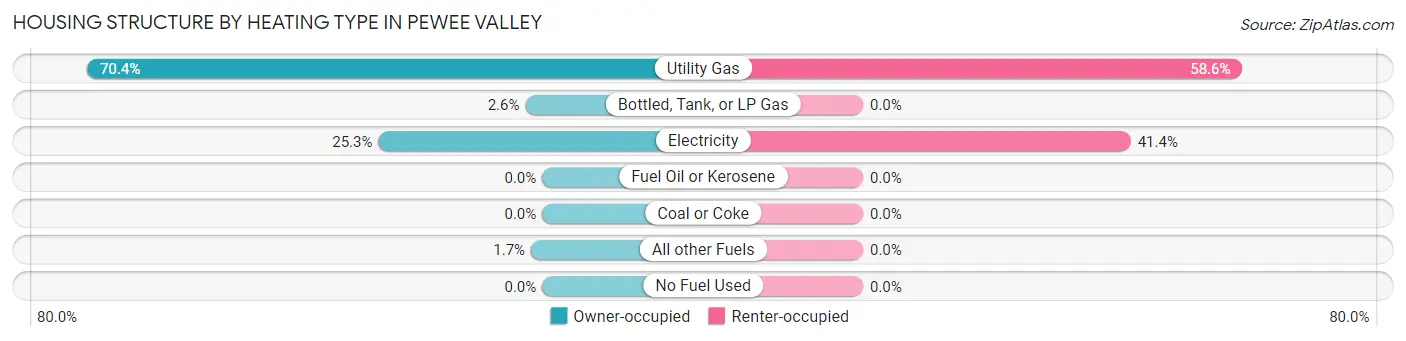
| Heating Type | Owner-occupied | Renter-occupied |
| Utility Gas | 325 (70.4%) | 17 (58.6%) |
| Bottled, Tank, or LP Gas | 12 (2.6%) | 0 (0.0%) |
| Electricity | 117 (25.3%) | 12 (41.4%) |
| Fuel Oil or Kerosene | 0 (0.0%) | 0 (0.0%) |
| Coal or Coke | 0 (0.0%) | 0 (0.0%) |
| All other Fuels | 8 (1.7%) | 0 (0.0%) |
| No Fuel Used | 0 (0.0%) | 0 (0.0%) |
| Total | 462 (100.0%) | 29 (100.0%) |
Household Vehicle Usage in Pewee Valley
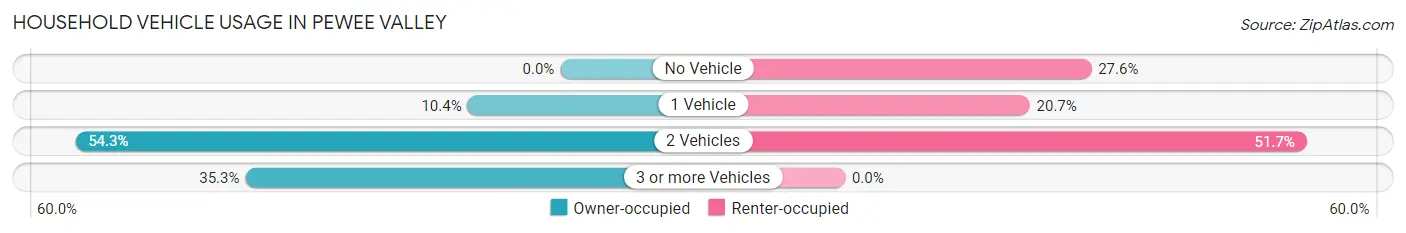
| Vehicles per Household | Owner-occupied | Renter-occupied |
| No Vehicle | 0 (0.0%) | 8 (27.6%) |
| 1 Vehicle | 48 (10.4%) | 6 (20.7%) |
| 2 Vehicles | 251 (54.3%) | 15 (51.7%) |
| 3 or more Vehicles | 163 (35.3%) | 0 (0.0%) |
| Total | 462 (100.0%) | 29 (100.0%) |
Real Estate & Mortgages in Pewee Valley
Real Estate and Mortgage Overview in Pewee Valley
| Characteristic | Without Mortgage | With Mortgage |
| Housing Units | 168 | 294 |
| Median Property Value | $405,700 | $479,200 |
| Median Household Income | $98,750 | $144 |
| Monthly Housing Costs | $800 | $108 |
| Real Estate Taxes | $3,653 | $0 |
Property Value by Mortgage Status in Pewee Valley
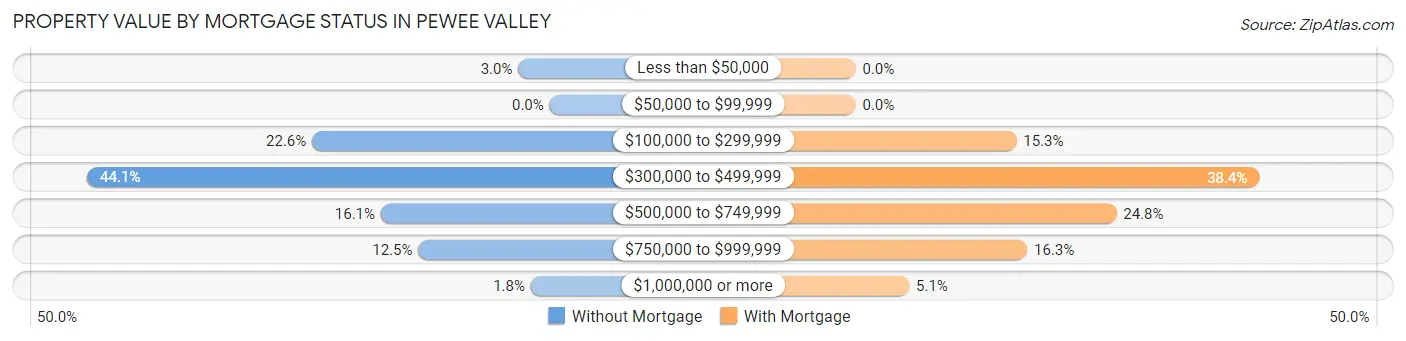
| Property Value | Without Mortgage | With Mortgage |
| Less than $50,000 | 5 (3.0%) | 0 (0.0%) |
| $50,000 to $99,999 | 0 (0.0%) | 0 (0.0%) |
| $100,000 to $299,999 | 38 (22.6%) | 45 (15.3%) |
| $300,000 to $499,999 | 74 (44.1%) | 113 (38.4%) |
| $500,000 to $749,999 | 27 (16.1%) | 73 (24.8%) |
| $750,000 to $999,999 | 21 (12.5%) | 48 (16.3%) |
| $1,000,000 or more | 3 (1.8%) | 15 (5.1%) |
| Total | 168 (100.0%) | 294 (100.0%) |
Household Income by Mortgage Status in Pewee Valley
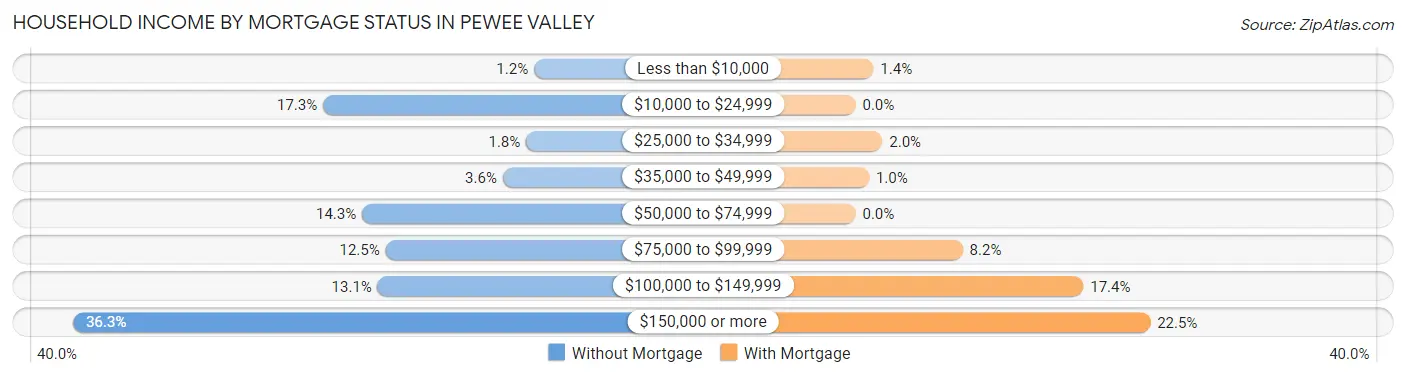
| Household Income | Without Mortgage | With Mortgage |
| Less than $10,000 | 2 (1.2%) | 4 (1.4%) |
| $10,000 to $24,999 | 29 (17.3%) | 0 (0.0%) |
| $25,000 to $34,999 | 3 (1.8%) | 6 (2.0%) |
| $35,000 to $49,999 | 6 (3.6%) | 3 (1.0%) |
| $50,000 to $74,999 | 24 (14.3%) | 0 (0.0%) |
| $75,000 to $99,999 | 21 (12.5%) | 24 (8.2%) |
| $100,000 to $149,999 | 22 (13.1%) | 51 (17.3%) |
| $150,000 or more | 61 (36.3%) | 66 (22.5%) |
| Total | 168 (100.0%) | 294 (100.0%) |
Property Value to Household Income Ratio in Pewee Valley
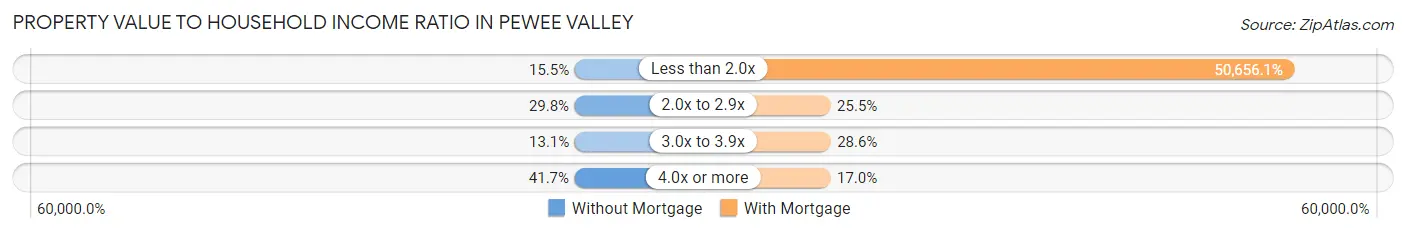
| Value-to-Income Ratio | Without Mortgage | With Mortgage |
| Less than 2.0x | 26 (15.5%) | 148,929 (50,656.1%) |
| 2.0x to 2.9x | 50 (29.8%) | 75 (25.5%) |
| 3.0x to 3.9x | 22 (13.1%) | 84 (28.6%) |
| 4.0x or more | 70 (41.7%) | 50 (17.0%) |
| Total | 168 (100.0%) | 294 (100.0%) |
Real Estate Taxes by Mortgage Status in Pewee Valley
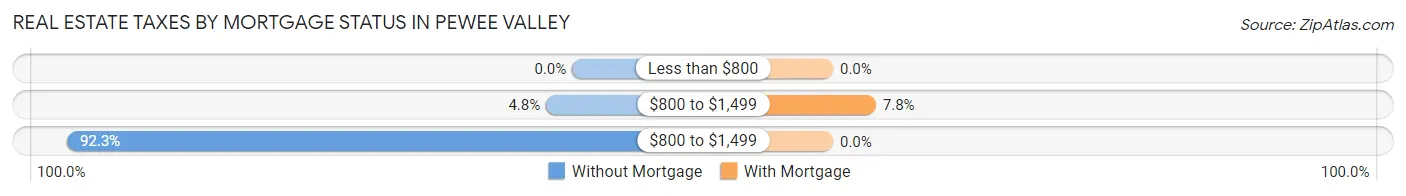
| Property Taxes | Without Mortgage | With Mortgage |
| Less than $800 | 0 (0.0%) | 0 (0.0%) |
| $800 to $1,499 | 8 (4.8%) | 23 (7.8%) |
| $800 to $1,499 | 155 (92.3%) | 0 (0.0%) |
| Total | 168 (100.0%) | 294 (100.0%) |
Health & Disability in Pewee Valley
Health Insurance Coverage by Age in Pewee Valley
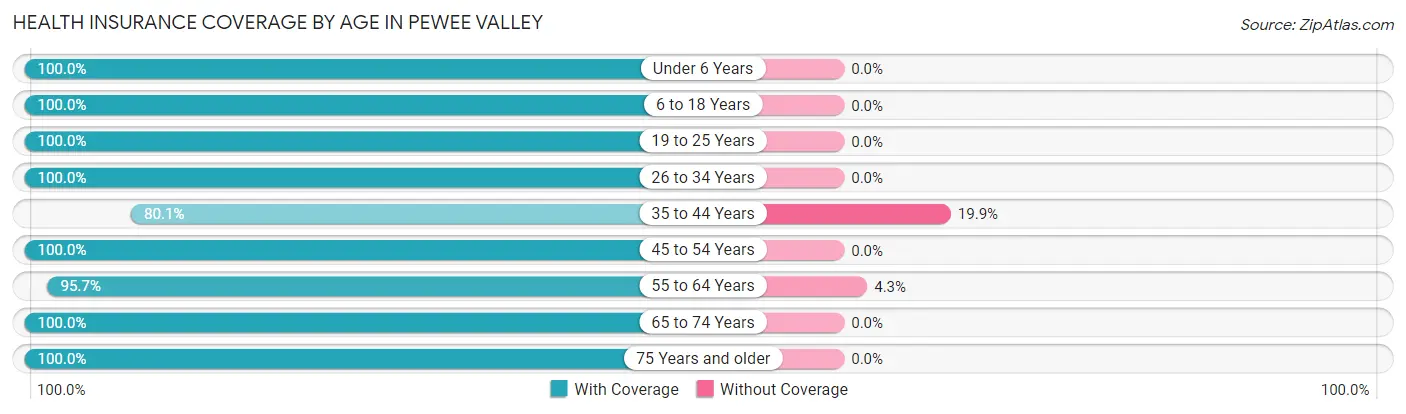
| Age Bracket | With Coverage | Without Coverage |
| Under 6 Years | 64 (100.0%) | 0 (0.0%) |
| 6 to 18 Years | 293 (100.0%) | 0 (0.0%) |
| 19 to 25 Years | 84 (100.0%) | 0 (0.0%) |
| 26 to 34 Years | 69 (100.0%) | 0 (0.0%) |
| 35 to 44 Years | 129 (80.1%) | 32 (19.9%) |
| 45 to 54 Years | 239 (100.0%) | 0 (0.0%) |
| 55 to 64 Years | 201 (95.7%) | 9 (4.3%) |
| 65 to 74 Years | 146 (100.0%) | 0 (0.0%) |
| 75 Years and older | 122 (100.0%) | 0 (0.0%) |
| Total | 1,347 (97.1%) | 41 (2.9%) |
Health Insurance Coverage by Citizenship Status in Pewee Valley
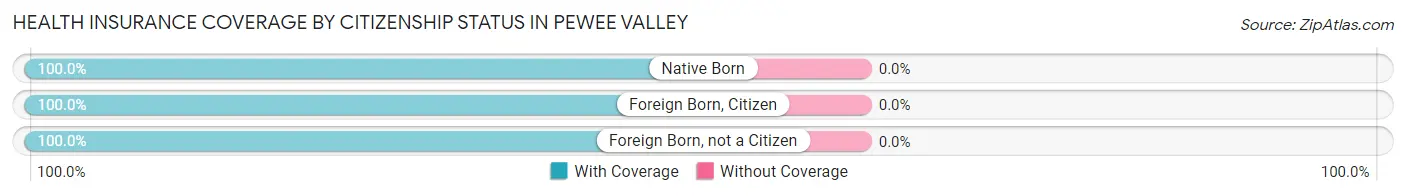
| Citizenship Status | With Coverage | Without Coverage |
| Native Born | 64 (100.0%) | 0 (0.0%) |
| Foreign Born, Citizen | 293 (100.0%) | 0 (0.0%) |
| Foreign Born, not a Citizen | 84 (100.0%) | 0 (0.0%) |
Health Insurance Coverage by Household Income in Pewee Valley
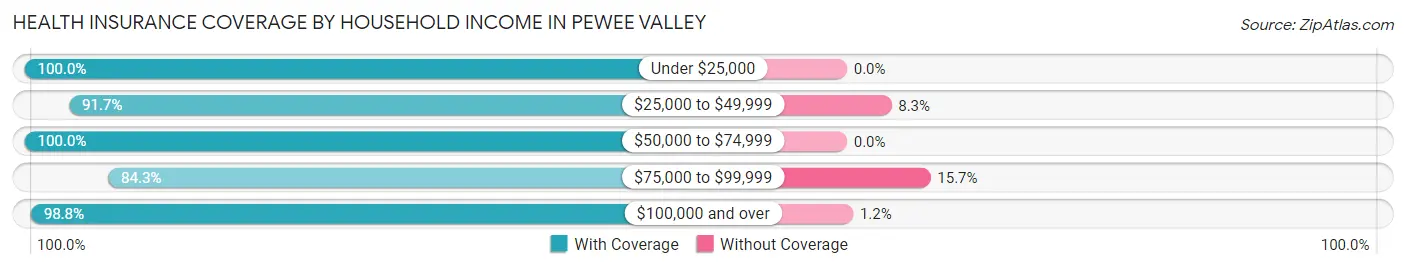
| Household Income | With Coverage | Without Coverage |
| Under $25,000 | 40 (100.0%) | 0 (0.0%) |
| $25,000 to $49,999 | 33 (91.7%) | 3 (8.3%) |
| $50,000 to $74,999 | 111 (100.0%) | 0 (0.0%) |
| $75,000 to $99,999 | 140 (84.3%) | 26 (15.7%) |
| $100,000 and over | 1,023 (98.8%) | 12 (1.2%) |
Public vs Private Health Insurance Coverage by Age in Pewee Valley
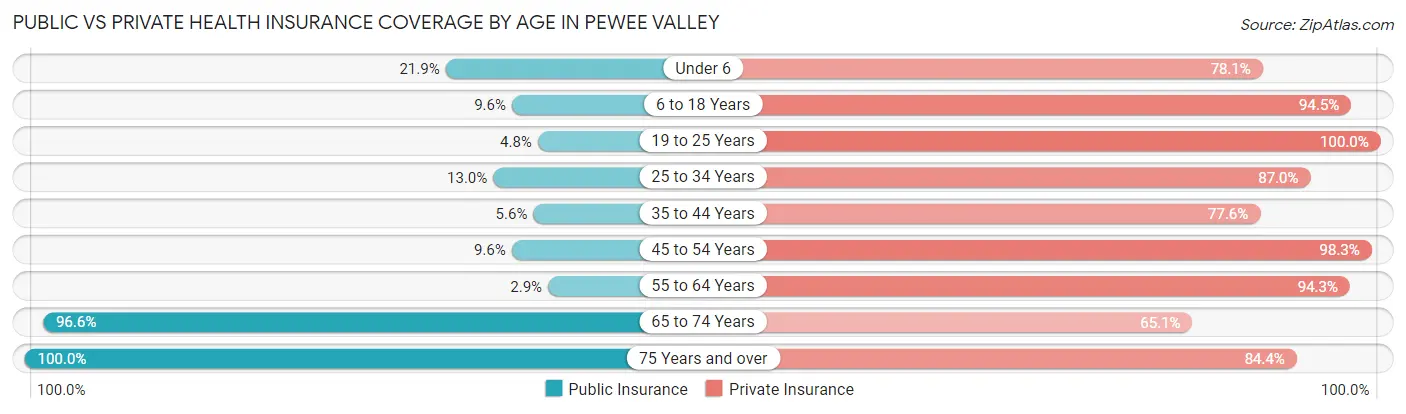
| Age Bracket | Public Insurance | Private Insurance |
| Under 6 | 14 (21.9%) | 50 (78.1%) |
| 6 to 18 Years | 28 (9.6%) | 277 (94.5%) |
| 19 to 25 Years | 4 (4.8%) | 84 (100.0%) |
| 25 to 34 Years | 9 (13.0%) | 60 (87.0%) |
| 35 to 44 Years | 9 (5.6%) | 125 (77.6%) |
| 45 to 54 Years | 23 (9.6%) | 235 (98.3%) |
| 55 to 64 Years | 6 (2.9%) | 198 (94.3%) |
| 65 to 74 Years | 141 (96.6%) | 95 (65.1%) |
| 75 Years and over | 122 (100.0%) | 103 (84.4%) |
| Total | 356 (25.7%) | 1,227 (88.4%) |
Disability Status by Sex by Age in Pewee Valley
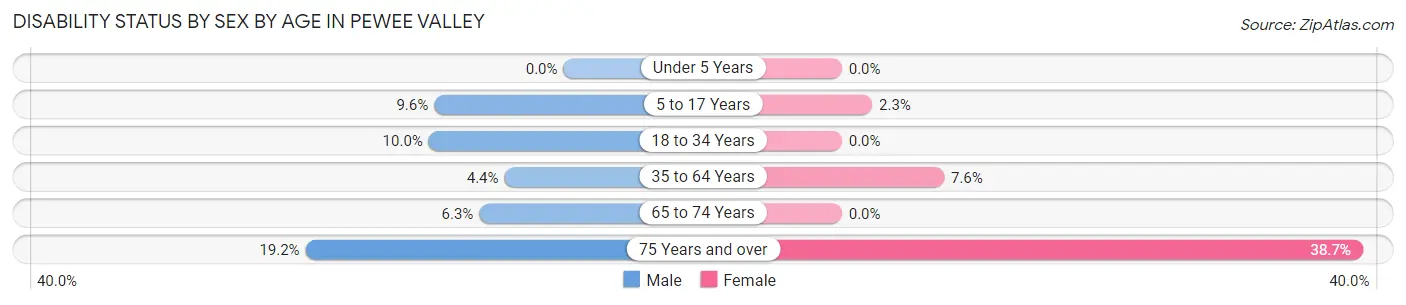
| Age Bracket | Male | Female |
| Under 5 Years | 0 (0.0%) | 0 (0.0%) |
| 5 to 17 Years | 19 (9.6%) | 2 (2.2%) |
| 18 to 34 Years | 10 (10.0%) | 0 (0.0%) |
| 35 to 64 Years | 14 (4.4%) | 22 (7.6%) |
| 65 to 74 Years | 4 (6.2%) | 0 (0.0%) |
| 75 Years and over | 9 (19.2%) | 29 (38.7%) |
Disability Class by Sex by Age in Pewee Valley
Disability Class: Hearing Difficulty
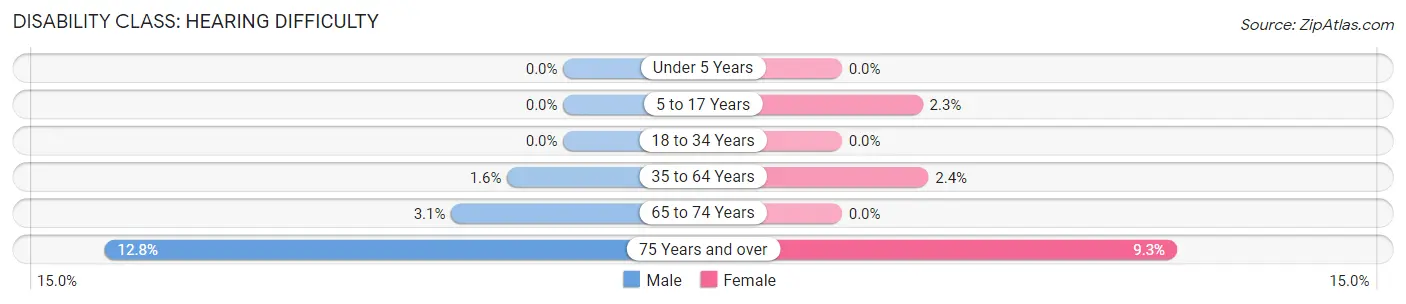
| Age Bracket | Male | Female |
| Under 5 Years | 0 (0.0%) | 0 (0.0%) |
| 5 to 17 Years | 0 (0.0%) | 2 (2.2%) |
| 18 to 34 Years | 0 (0.0%) | 0 (0.0%) |
| 35 to 64 Years | 5 (1.6%) | 7 (2.4%) |
| 65 to 74 Years | 2 (3.1%) | 0 (0.0%) |
| 75 Years and over | 6 (12.8%) | 7 (9.3%) |
Disability Class: Vision Difficulty
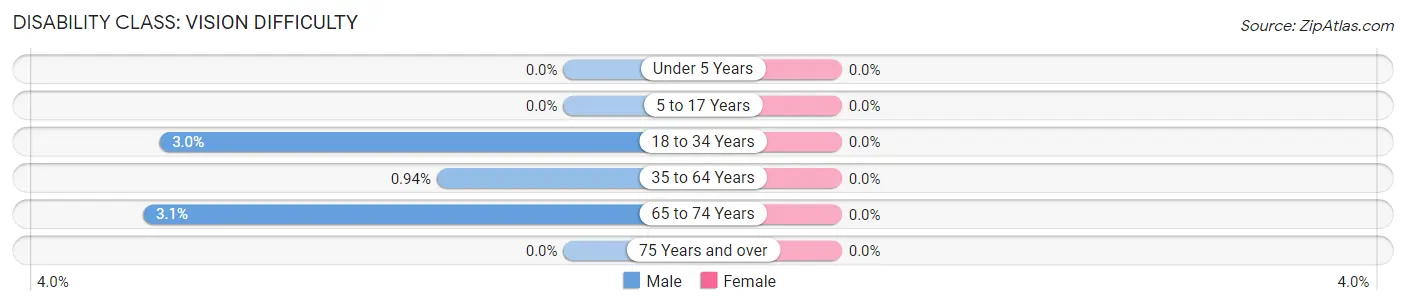
| Age Bracket | Male | Female |
| Under 5 Years | 0 (0.0%) | 0 (0.0%) |
| 5 to 17 Years | 0 (0.0%) | 0 (0.0%) |
| 18 to 34 Years | 3 (3.0%) | 0 (0.0%) |
| 35 to 64 Years | 3 (0.9%) | 0 (0.0%) |
| 65 to 74 Years | 2 (3.1%) | 0 (0.0%) |
| 75 Years and over | 0 (0.0%) | 0 (0.0%) |
Disability Class: Cognitive Difficulty
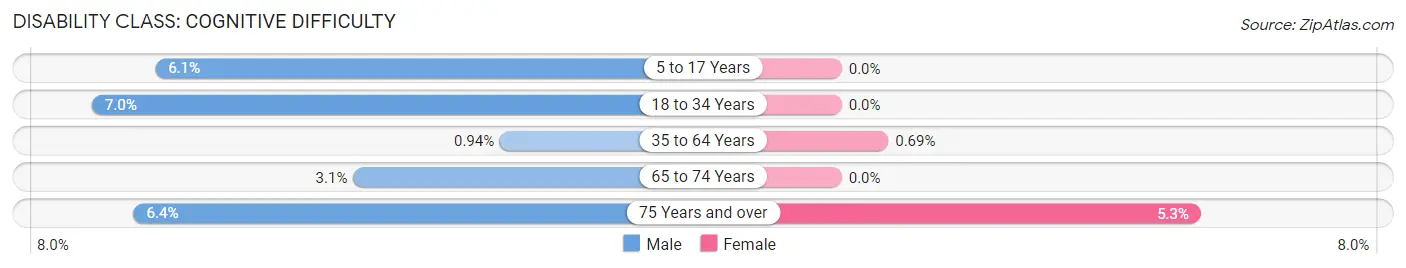
| Age Bracket | Male | Female |
| 5 to 17 Years | 12 (6.1%) | 0 (0.0%) |
| 18 to 34 Years | 7 (7.0%) | 0 (0.0%) |
| 35 to 64 Years | 3 (0.9%) | 2 (0.7%) |
| 65 to 74 Years | 2 (3.1%) | 0 (0.0%) |
| 75 Years and over | 3 (6.4%) | 4 (5.3%) |
Disability Class: Ambulatory Difficulty
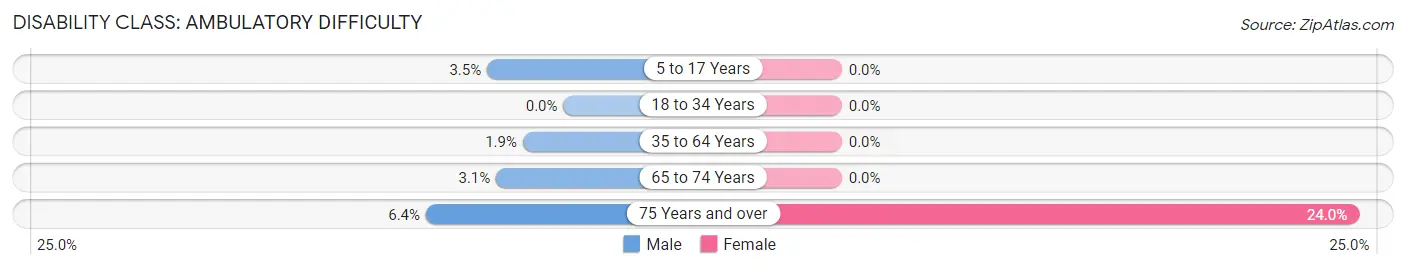
| Age Bracket | Male | Female |
| 5 to 17 Years | 7 (3.5%) | 0 (0.0%) |
| 18 to 34 Years | 0 (0.0%) | 0 (0.0%) |
| 35 to 64 Years | 6 (1.9%) | 0 (0.0%) |
| 65 to 74 Years | 2 (3.1%) | 0 (0.0%) |
| 75 Years and over | 3 (6.4%) | 18 (24.0%) |
Disability Class: Self-Care Difficulty
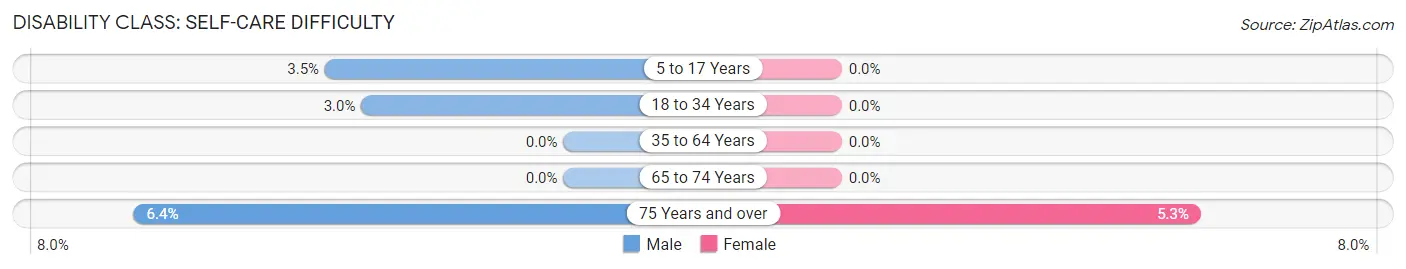
| Age Bracket | Male | Female |
| 5 to 17 Years | 7 (3.5%) | 0 (0.0%) |
| 18 to 34 Years | 3 (3.0%) | 0 (0.0%) |
| 35 to 64 Years | 0 (0.0%) | 0 (0.0%) |
| 65 to 74 Years | 0 (0.0%) | 0 (0.0%) |
| 75 Years and over | 3 (6.4%) | 4 (5.3%) |
Technology Access in Pewee Valley
Computing Device Access in Pewee Valley
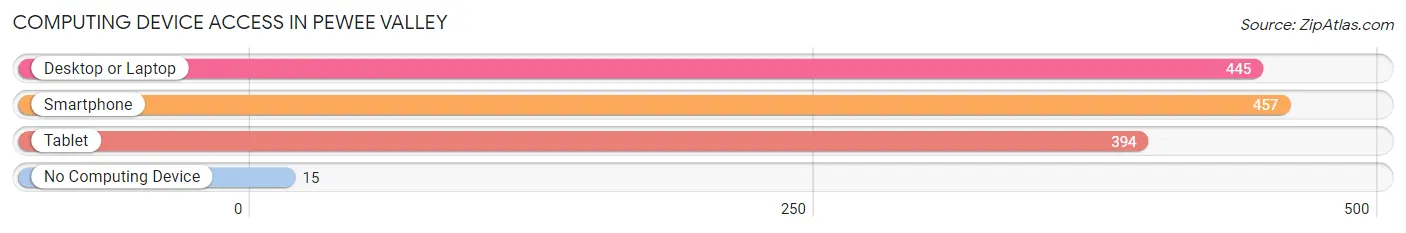
| Device Type | # Households | % Households |
| Desktop or Laptop | 445 | 90.6% |
| Smartphone | 457 | 93.1% |
| Tablet | 394 | 80.2% |
| No Computing Device | 15 | 3.0% |
| Total | 491 | 100.0% |
Internet Access in Pewee Valley
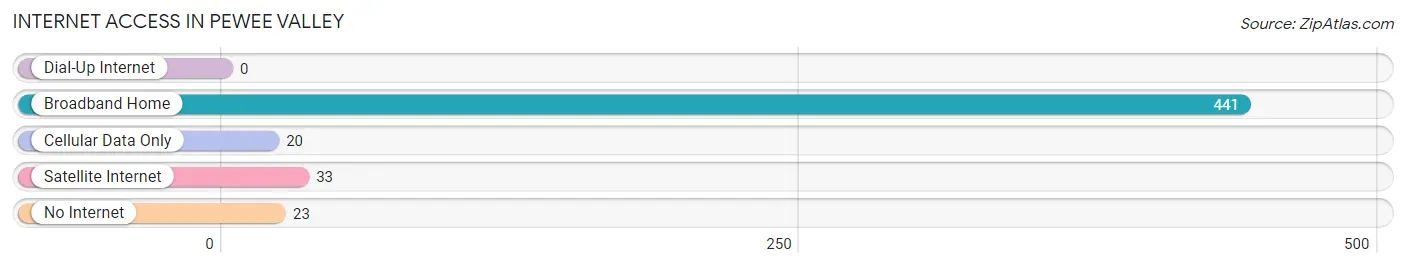
| Internet Type | # Households | % Households |
| Dial-Up Internet | 0 | 0.0% |
| Broadband Home | 441 | 89.8% |
| Cellular Data Only | 20 | 4.1% |
| Satellite Internet | 33 | 6.7% |
| No Internet | 23 | 4.7% |
| Total | 491 | 100.0% |
Pewee Valley Summary
Pewee Valley is a small city located in Oldham County, Kentucky, United States. It is situated in the Louisville metropolitan area, approximately 20 miles northeast of downtown Louisville. The city is known for its historic buildings, quaint downtown, and its proximity to the Louisville International Airport.
History
Pewee Valley was founded in 1817 by a group of settlers from Pennsylvania. The town was named after the nearby Pee Wee Creek, which was named after a Native American chief. The town was originally a farming community, but it soon became a popular stop for travelers on the Louisville and Nashville Railroad. The railroad brought new businesses and people to the area, and the town grew rapidly.
In 1867, the Louisville and Nashville Railroad built a station in Pewee Valley, which helped to further spur the town’s growth. The town was incorporated in 1872, and the first mayor was elected in 1873.
In the late 19th century, Pewee Valley became a popular summer resort for wealthy Louisvillians. The town was home to several large resorts, including the Pewee Valley Hotel, which was built in 1887. The hotel was a popular destination for wealthy Louisvillians, and it was the site of many social events.
In the early 20th century, Pewee Valley began to decline as a resort town. The Great Depression and World War II caused many of the resorts to close, and the town’s population began to decline.
Geography
Pewee Valley is located in Oldham County, Kentucky, approximately 20 miles northeast of downtown Louisville. The city is situated in the Louisville metropolitan area, and it is bordered by the cities of Prospect, Crestwood, and La Grange.
The city has a total area of 2.2 square miles, all of which is land. The city is located in the rolling hills of the Bluegrass region of Kentucky, and it is surrounded by farmland. The city is located near the Louisville International Airport, and it is also close to several major highways, including Interstate 71 and Interstate 265.
Economy
Pewee Valley’s economy is largely based on tourism and retail. The city is home to several historic buildings, including the Pewee Valley Hotel, which is now a popular bed and breakfast. The city is also home to several antique shops, art galleries, and restaurants.
The city is also home to several corporate offices, including the headquarters of the Louisville and Nashville Railroad. The city is also home to several manufacturing companies, including a paper mill and a furniture factory.
Demographics
As of the 2010 census, Pewee Valley had a population of 2,845. The racial makeup of the city was 95.3% White, 1.2% African American, 0.3% Native American, 0.7% Asian, 0.1% Pacific Islander, 0.7% from other races, and 1.9% from two or more races. Hispanic or Latino of any race were 2.2% of the population.
The median income for a household in Pewee Valley was $50,972, and the median income for a family was $60,972. The per capita income for the city was $25,972. About 4.3% of families and 5.7% of the population were below the poverty line, including 6.3% of those under age 18 and 4.3% of those age 65 or over.
Pewee Valley is a small city with a rich history and a vibrant economy. The city is home to several historic buildings, and it is a popular destination for tourists and locals alike. The city is also home to several corporate offices and manufacturing companies, and it is close to several major highways and the Louisville International Airport. The city has a diverse population, and it is a great place to live and work.
Common Questions
What is Per Capita Income in Pewee Valley?
Per Capita income in Pewee Valley is $60,919.
What is the Median Family Income in Pewee Valley?
Median Family Income in Pewee Valley is $148,571.
What is the Median Household income in Pewee Valley?
Median Household Income in Pewee Valley is $132,614.
What is Income or Wage Gap in Pewee Valley?
Income or Wage Gap in Pewee Valley is 37.6%.
Women in Pewee Valley earn 62.4 cents for every dollar earned by a man.
What is Inequality or Gini Index in Pewee Valley?
Inequality or Gini Index in Pewee Valley is 0.45.
What is the Total Population of Pewee Valley?
Total Population of Pewee Valley is 1,514.
What is the Total Male Population of Pewee Valley?
Total Male Population of Pewee Valley is 817.
What is the Total Female Population of Pewee Valley?
Total Female Population of Pewee Valley is 697.
What is the Ratio of Males per 100 Females in Pewee Valley?
There are 117.22 Males per 100 Females in Pewee Valley.
What is the Ratio of Females per 100 Males in Pewee Valley?
There are 85.31 Females per 100 Males in Pewee Valley.
What is the Median Population Age in Pewee Valley?
Median Population Age in Pewee Valley is 47.9 Years.
What is the Average Family Size in Pewee Valley
Average Family Size in Pewee Valley is 3.2 People.
What is the Average Household Size in Pewee Valley
Average Household Size in Pewee Valley is 2.8 People.
How Large is the Labor Force in Pewee Valley?
There are 665 People in the Labor Forcein in Pewee Valley.
What is the Percentage of People in the Labor Force in Pewee Valley?
54.4% of People are in the Labor Force in Pewee Valley.
What is the Unemployment Rate in Pewee Valley?
Unemployment Rate in Pewee Valley is 2.3%.