Cities with the Highest Percentage of Swiss Population in Kentucky
RELATED REPORTS & OPTIONS
Swiss
Kentucky
Compare Cities
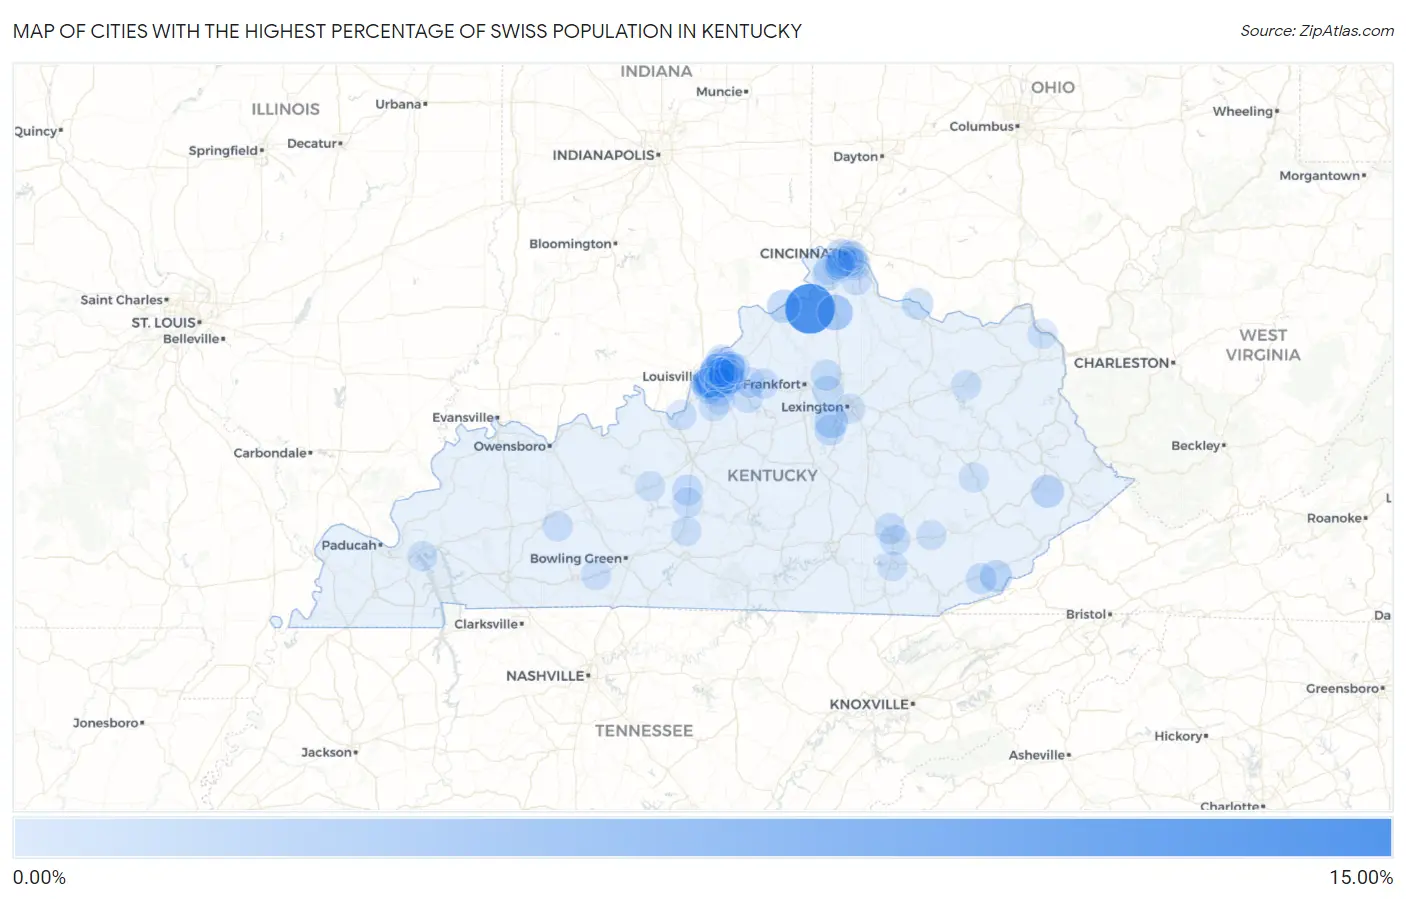
Map of Cities with the Highest Percentage of Swiss Population in Kentucky
0.00%
15.00%
Cities with the Highest Percentage of Swiss Population in Kentucky
| City | Swiss | vs State | vs National | |
| 1. | Glencoe | 11.21% | 0.23%(+11.0)#1 | 0.26%(+10.9)#108 |
| 2. | Dry Ridge | 3.19% | 0.23%(+2.96)#2 | 0.26%(+2.92)#549 |
| 3. | Old Brownsboro Place | 3.12% | 0.23%(+2.89)#3 | 0.26%(+2.86)#562 |
| 4. | Wellington | 2.71% | 0.23%(+2.48)#4 | 0.26%(+2.44)#682 |
| 5. | Seneca Gardens | 2.46% | 0.23%(+2.22)#5 | 0.26%(+2.19)#762 |
| 6. | Goose Creek | 2.44% | 0.23%(+2.21)#6 | 0.26%(+2.17)#764 |
| 7. | Wildwood | 2.10% | 0.23%(+1.87)#7 | 0.26%(+1.84)#908 |
| 8. | Keene | 2.02% | 0.23%(+1.79)#8 | 0.26%(+1.76)#955 |
| 9. | Ghent | 1.92% | 0.23%(+1.69)#9 | 0.26%(+1.65)#1,017 |
| 10. | Mcdowell | 1.74% | 0.23%(+1.51)#10 | 0.26%(+1.48)#1,145 |
| 11. | Strathmoor Village | 1.71% | 0.23%(+1.48)#11 | 0.26%(+1.45)#1,177 |
| 12. | Windy Hills | 1.69% | 0.23%(+1.46)#12 | 0.26%(+1.42)#1,207 |
| 13. | Druid Hills | 1.58% | 0.23%(+1.35)#13 | 0.26%(+1.31)#1,293 |
| 14. | Woodlawn Park | 1.55% | 0.23%(+1.31)#14 | 0.26%(+1.28)#1,323 |
| 15. | Lynnview | 1.40% | 0.23%(+1.17)#15 | 0.26%(+1.14)#1,503 |
| 16. | Evarts | 1.37% | 0.23%(+1.14)#16 | 0.26%(+1.11)#1,544 |
| 17. | Brownsboro Village | 1.23% | 0.23%(+0.995)#17 | 0.26%(+0.962)#1,751 |
| 18. | Ludlow | 1.21% | 0.23%(+0.977)#18 | 0.26%(+0.944)#1,779 |
| 19. | Parkway Village | 1.13% | 0.23%(+0.894)#19 | 0.26%(+0.861)#1,913 |
| 20. | Brownsboro Farm | 1.08% | 0.23%(+0.853)#20 | 0.26%(+0.820)#1,998 |
| 21. | Norbourne Estates | 1.08% | 0.23%(+0.846)#21 | 0.26%(+0.813)#2,016 |
| 22. | Middletown | 1.06% | 0.23%(+0.831)#22 | 0.26%(+0.798)#2,047 |
| 23. | Rolling Hills | 1.00% | 0.23%(+0.767)#23 | 0.26%(+0.734)#2,193 |
| 24. | Beechwood Village | 1.00% | 0.23%(+0.767)#24 | 0.26%(+0.734)#2,198 |
| 25. | Dover | 0.99% | 0.23%(+0.762)#25 | 0.26%(+0.729)#2,210 |
| 26. | Green Spring | 0.86% | 0.23%(+0.632)#26 | 0.26%(+0.599)#2,529 |
| 27. | Union | 0.83% | 0.23%(+0.596)#27 | 0.26%(+0.563)#2,636 |
| 28. | East Bernstadt | 0.82% | 0.23%(+0.592)#28 | 0.26%(+0.559)#2,652 |
| 29. | Westwood | 0.81% | 0.23%(+0.575)#29 | 0.26%(+0.542)#2,717 |
| 30. | Coldstream | 0.80% | 0.23%(+0.569)#30 | 0.26%(+0.536)#2,735 |
| 31. | Riverwood | 0.80% | 0.23%(+0.567)#31 | 0.26%(+0.534)#2,747 |
| 32. | Jeffersontown | 0.78% | 0.23%(+0.553)#32 | 0.26%(+0.520)#2,789 |
| 33. | Indian Hills | 0.76% | 0.23%(+0.529)#33 | 0.26%(+0.496)#2,886 |
| 34. | Wilmore | 0.75% | 0.23%(+0.516)#34 | 0.26%(+0.483)#2,944 |
| 35. | Hollow Creek | 0.71% | 0.23%(+0.480)#35 | 0.26%(+0.447)#3,076 |
| 36. | Blue Ridge Manor | 0.70% | 0.23%(+0.471)#36 | 0.26%(+0.438)#3,108 |
| 37. | Hurstbourne | 0.69% | 0.23%(+0.456)#37 | 0.26%(+0.423)#3,173 |
| 38. | Midway | 0.69% | 0.23%(+0.455)#38 | 0.26%(+0.422)#3,178 |
| 39. | Murray Hill | 0.68% | 0.23%(+0.452)#39 | 0.26%(+0.419)#3,193 |
| 40. | Harlan | 0.68% | 0.23%(+0.449)#40 | 0.26%(+0.417)#3,205 |
| 41. | Upton | 0.67% | 0.23%(+0.435)#41 | 0.26%(+0.402)#3,267 |
| 42. | Stamping Ground | 0.66% | 0.23%(+0.429)#42 | 0.26%(+0.396)#3,304 |
| 43. | Woodland Hills | 0.64% | 0.23%(+0.412)#43 | 0.26%(+0.379)#3,383 |
| 44. | Audubon Park | 0.64% | 0.23%(+0.406)#44 | 0.26%(+0.373)#3,422 |
| 45. | Spring Valley | 0.58% | 0.23%(+0.350)#45 | 0.26%(+0.317)#3,728 |
| 46. | Thornhill | 0.56% | 0.23%(+0.333)#46 | 0.26%(+0.300)#3,811 |
| 47. | London | 0.55% | 0.23%(+0.320)#47 | 0.26%(+0.287)#3,897 |
| 48. | Edgewood | 0.54% | 0.23%(+0.313)#48 | 0.26%(+0.280)#3,941 |
| 49. | Northfield | 0.54% | 0.23%(+0.311)#49 | 0.26%(+0.278)#3,948 |
| 50. | Langdon Place | 0.54% | 0.23%(+0.304)#50 | 0.26%(+0.271)#3,988 |
| 51. | Cold Spring | 0.53% | 0.23%(+0.295)#51 | 0.26%(+0.263)#4,041 |
| 52. | Elk Creek | 0.52% | 0.23%(+0.291)#52 | 0.26%(+0.258)#4,071 |
| 53. | Briarwood | 0.52% | 0.23%(+0.288)#53 | 0.26%(+0.255)#4,088 |
| 54. | Highland Heights | 0.52% | 0.23%(+0.286)#54 | 0.26%(+0.253)#4,104 |
| 55. | Crossgate | 0.51% | 0.23%(+0.278)#55 | 0.26%(+0.245)#4,157 |
| 56. | St Matthews | 0.50% | 0.23%(+0.271)#56 | 0.26%(+0.238)#4,204 |
| 57. | Prospect | 0.50% | 0.23%(+0.266)#57 | 0.26%(+0.233)#4,233 |
| 58. | Graymoor Devondale | 0.49% | 0.23%(+0.260)#58 | 0.26%(+0.227)#4,265 |
| 59. | Wilder | 0.48% | 0.23%(+0.244)#59 | 0.26%(+0.211)#4,368 |
| 60. | Forest Hills | 0.45% | 0.23%(+0.223)#60 | 0.26%(+0.190)#4,532 |
| 61. | Simpsonville | 0.44% | 0.23%(+0.205)#61 | 0.26%(+0.172)#4,658 |
| 62. | Meadow Vale | 0.43% | 0.23%(+0.202)#62 | 0.26%(+0.169)#4,685 |
| 63. | Auburn | 0.43% | 0.23%(+0.194)#63 | 0.26%(+0.161)#4,746 |
| 64. | Bellewood | 0.43% | 0.23%(+0.194)#64 | 0.26%(+0.161)#4,747 |
| 65. | Bellemeade | 0.42% | 0.23%(+0.192)#65 | 0.26%(+0.159)#4,766 |
| 66. | Drakesboro | 0.41% | 0.23%(+0.175)#66 | 0.26%(+0.143)#4,900 |
| 67. | River Bluff | 0.40% | 0.23%(+0.171)#67 | 0.26%(+0.138)#4,938 |
| 68. | Claryville | 0.39% | 0.23%(+0.155)#68 | 0.26%(+0.122)#5,108 |
| 69. | Bonnieville | 0.38% | 0.23%(+0.148)#69 | 0.26%(+0.115)#5,172 |
| 70. | West Point | 0.37% | 0.23%(+0.141)#70 | 0.26%(+0.108)#5,217 |
| 71. | Shelbyville | 0.36% | 0.23%(+0.128)#71 | 0.26%(+0.095)#5,329 |
| 72. | Fort Wright | 0.36% | 0.23%(+0.128)#72 | 0.26%(+0.095)#5,330 |
| 73. | St Regis Park | 0.36% | 0.23%(+0.127)#73 | 0.26%(+0.094)#5,333 |
| 74. | Glenview | 0.35% | 0.23%(+0.117)#74 | 0.26%(+0.084)#5,434 |
| 75. | Louisville | 0.31% | 0.23%(+0.082)#75 | 0.26%(+0.049)#5,801 |
| 76. | Erlanger | 0.31% | 0.23%(+0.080)#76 | 0.26%(+0.047)#5,824 |
| 77. | Orchard Grass Hills | 0.31% | 0.23%(+0.078)#77 | 0.26%(+0.045)#5,853 |
| 78. | Worthington Hills | 0.29% | 0.23%(+0.062)#78 | 0.26%(+0.029)#6,034 |
| 79. | Florence | 0.29% | 0.23%(+0.061)#79 | 0.26%(+0.028)#6,048 |
| 80. | Newport | 0.27% | 0.23%(+0.043)#80 | 0.26%(+0.010)#6,286 |
| 81. | Douglass Hills | 0.27% | 0.23%(+0.043)#81 | 0.26%(+0.010)#6,299 |
| 82. | Heritage Creek | 0.27% | 0.23%(+0.039)#82 | 0.26%(+0.006)#6,355 |
| 83. | Houston Acres | 0.27% | 0.23%(+0.034)#83 | 0.26%(+0.001)#6,406 |
| 84. | Fort Thomas | 0.27% | 0.23%(+0.034)#84 | 0.26%(+0.001)#6,415 |
| 85. | Wurtland | 0.26% | 0.23%(+0.033)#85 | 0.26%(-0.000)#6,430 |
| 86. | Horse Cave | 0.25% | 0.23%(+0.023)#86 | 0.26%(-0.010)#6,600 |
| 87. | Anchorage | 0.25% | 0.23%(+0.016)#87 | 0.26%(-0.017)#6,702 |
| 88. | Clarkson | 0.25% | 0.23%(+0.014)#88 | 0.26%(-0.019)#6,719 |
| 89. | Lexington | 0.25% | 0.23%(+0.014)#89 | 0.26%(-0.019)#6,721 |
| 90. | Grand Rivers | 0.23% | 0.23%(-0.000)#90 | 0.26%(-0.033)#6,937 |
| 91. | Hebron Estates | 0.23% | 0.23%(-0.002)#91 | 0.26%(-0.035)#6,966 |
| 92. | Manchester | 0.23% | 0.23%(-0.004)#92 | 0.26%(-0.037)#6,991 |
| 93. | Plantation | 0.22% | 0.23%(-0.007)#93 | 0.26%(-0.040)#7,024 |
| 94. | Jackson | 0.22% | 0.23%(-0.013)#94 | 0.26%(-0.046)#7,135 |
| 95. | Crestview Hills | 0.22% | 0.23%(-0.014)#95 | 0.26%(-0.047)#7,149 |
| 96. | Lyndon | 0.21% | 0.23%(-0.023)#96 | 0.26%(-0.056)#7,290 |
| 97. | Corbin | 0.21% | 0.23%(-0.023)#97 | 0.26%(-0.056)#7,292 |
| 98. | Bancroft | 0.20% | 0.23%(-0.031)#98 | 0.26%(-0.064)#7,448 |
| 99. | Morehead | 0.20% | 0.23%(-0.032)#99 | 0.26%(-0.065)#7,461 |
| 100. | Pewee Valley | 0.20% | 0.23%(-0.034)#100 | 0.26%(-0.067)#7,493 |
Common Questions
What are the Top 10 Cities with the Highest Percentage of Swiss Population in Kentucky?
Top 10 Cities with the Highest Percentage of Swiss Population in Kentucky are:
#1
11.21%
#2
3.19%
#3
3.12%
#4
2.71%
#5
2.46%
#6
2.44%
#7
2.10%
#8
2.02%
#9
1.92%
#10
1.74%
What city has the Highest Percentage of Swiss Population in Kentucky?
Glencoe has the Highest Percentage of Swiss Population in Kentucky with 11.21%.
What is the Percentage of Swiss Population in the State of Kentucky?
Percentage of Swiss Population in Kentucky is 0.23%.
What is the Percentage of Swiss Population in the United States?
Percentage of Swiss Population in the United States is 0.26%.