Cities with the Lowest Percentage of Births to Unmarried Women over the Age of 35 in Kentucky

RELATED REPORTS & OPTIONS

Lowest Illegitimacy | Women 35+
Population
Families and Households
Female Fertility
Female Fertility (Unmarried)
Race (Community Size)
Race (Percentage)
Ancestry (Community Size)
AfghanAfricanAlaska NativeAlaskan AthabascanAlbanianAleutAlsatianAmericanApacheArabArapahoArgentineanArmenianAssyrian / Chaldean / SyriacAustralianAustrianBahamianBangladeshiBarbadianBasqueBelgianBelizeanBermudanBhutaneseBlackfeetBolivianBrazilianBritishBritish West IndianBulgarianBurmeseCajunCambodianCanadianCape VerdeanCarpatho RusynCelticCentral AmericanCentral American IndianCherokeeCheyenneChickasawChileanChineseChippewaChoctawColombianColvilleComancheCosta RicanCreeCreekCroatianCrowCubanCypriotCzechCzechoslovakianDanishDelawareDominicanDutchDutch West IndianEastern EuropeanEcuadorianEgyptianEnglishEstonianEthiopianEuropeanFijianFilipinoFinnishFrenchFrench American IndianFrench CanadianGermanGerman RussianGhanaianGreekGuamanian / ChamorroGuatemalanGuyaneseHaitianHmongHonduranHopiHoumaHungarianIcelanderIndian (Asian)IndonesianInupiatIranianIraqiIrishIroquoisIsraeliItalianJamaicanJapaneseJordanianKenyanKiowaKoreanLaotianLatvianLebaneseLiberianLithuanianLumbeeLuxembourgerMacedonianMalaysianMalteseMarshalleseMenomineeMexicanMexican American IndianMongolianMoroccanNative HawaiianNavajoNepaleseNew ZealanderNicaraguanNigerianNorthern EuropeanNorwegianOkinawanOsageOttawaPaiutePakistaniPalestinianPanamanianParaguayanPennsylvania GermanPeruvianPimaPolishPortuguesePotawatomiPuebloPuerto RicanPuget Sound SalishRomanianRussianSalvadoranSamoanScandinavianScotch-IrishScottishSeminoleSenegaleseSerbianShoshoneSierra LeoneanSiouxSlavicSlovakSloveneSomaliSouth AfricanSouth AmericanSouth American IndianSoviet UnionSpaniardSpanishSpanish AmericanSpanish American IndianSri LankanSubsaharan AfricanSudaneseSwedishSwissSyrianTaiwaneseThaiTlingit-HaidaTohono O'OdhamTonganTrinidadian and TobagonianTsimshianTurkishU.S. Virgin IslanderUgandanUkrainianUruguayanUteVenezuelanVietnameseWelshWest IndianYakamaYaquiYugoslavianYumanYup'ikZimbabwean
Ancestry (Percentage)
AfghanAfricanAlaska NativeAlaskan AthabascanAlbanianAleutAlsatianAmericanApacheArabArapahoArgentineanArmenianAssyrian / Chaldean / SyriacAustralianAustrianBahamianBangladeshiBarbadianBasqueBelgianBelizeanBermudanBhutaneseBlackfeetBolivianBrazilianBritishBritish West IndianBulgarianBurmeseCajunCambodianCanadianCape VerdeanCarpatho RusynCelticCentral AmericanCentral American IndianCherokeeCheyenneChickasawChileanChineseChippewaChoctawColombianColvilleComancheCosta RicanCreeCreekCroatianCrowCubanCypriotCzechCzechoslovakianDanishDelawareDominicanDutchDutch West IndianEastern EuropeanEcuadorianEgyptianEnglishEstonianEthiopianEuropeanFijianFilipinoFinnishFrenchFrench American IndianFrench CanadianGermanGerman RussianGhanaianGreekGuamanian / ChamorroGuatemalanGuyaneseHaitianHmongHonduranHopiHoumaHungarianIcelanderIndian (Asian)IndonesianInupiatIranianIraqiIrishIroquoisIsraeliItalianJamaicanJapaneseJordanianKenyanKiowaKoreanLaotianLatvianLebaneseLiberianLithuanianLumbeeLuxembourgerMacedonianMalaysianMalteseMarshalleseMenomineeMexicanMexican American IndianMongolianMoroccanNative HawaiianNavajoNepaleseNew ZealanderNicaraguanNigerianNorthern EuropeanNorwegianOkinawanOsageOttawaPaiutePakistaniPalestinianPanamanianParaguayanPennsylvania GermanPeruvianPimaPolishPortuguesePotawatomiPuebloPuerto RicanPuget Sound SalishRomanianRussianSalvadoranSamoanScandinavianScotch-IrishScottishSeminoleSenegaleseSerbianShoshoneSierra LeoneanSiouxSlavicSlovakSloveneSomaliSouth AfricanSouth AmericanSouth American IndianSoviet UnionSpaniardSpanishSpanish AmericanSpanish American IndianSri LankanSubsaharan AfricanSudaneseSwedishSwissSyrianTaiwaneseThaiTlingit-HaidaTohono O'OdhamTonganTrinidadian and TobagonianTsimshianTurkishU.S. Virgin IslanderUgandanUkrainianUruguayanUteVenezuelanVietnameseWelshWest IndianYakamaYaquiYugoslavianYumanYup'ikZimbabwean
Immigrant Origin (Total)
AfghanistanAfricaAlbaniaArgentinaArmeniaAsiaAustraliaAustriaAzoresBahamasBangladeshBarbadosBelarusBelgiumBelizeBoliviaBosnia and HerzegovinaBrazilBulgariaBurma / MyanmarCabo VerdeCambodiaCameroonCanadaCaribbeanCentral AmericaChileChinaColombiaCongoCosta RicaCroatiaCubaCzechoslovakiaDenmarkDominicaDominican RepublicEastern AfricaEastern AsiaEastern EuropeEcuadorEgyptEl SalvadorEnglandEritreaEthiopiaEuropeFijiFranceGermanyGhanaGreeceGrenadaGuatemalaGuyanaHaitiHondurasHong KongHungaryIndiaIndonesiaIranIraqIrelandIsraelItalyJamaicaJapanJordanKazakhstanKenyaKoreaKuwaitLaosLatin AmericaLatviaLebanonLiberiaLithuaniaMalaysiaMexicoMicronesiaMiddle AfricaMoldovaMoroccoNepalNetherlandsNicaraguaNigeriaNorth MacedoniaNorthern AfricaNorthern EuropeNorwayOceaniaPakistanPanamaPeruPhilippinesPolandPortugalRomaniaRussiaSaudi ArabiaScotlandSenegalSerbiaSierra LeoneSingaporeSomaliaSouth AfricaSouth AmericaSouth Central AsiaSouth Eastern AsiaSouthern EuropeSpainSri LankaSt. Vincent and the GrenadinesSudanSwedenSwitzerlandSyriaTaiwanThailandTrinidad and TobagoTurkeyUgandaUkraineUruguayUzbekistanVenezuelaVietnamWest IndiesWestern AfricaWestern AsiaWestern EuropeYemenZaireZimbabwe
Immigrant Origin (Percentage)
AfghanistanAfricaAlbaniaArgentinaArmeniaAsiaAustraliaAustriaAzoresBahamasBangladeshBarbadosBelarusBelgiumBelizeBoliviaBosnia and HerzegovinaBrazilBulgariaBurma / MyanmarCabo VerdeCambodiaCameroonCanadaCaribbeanCentral AmericaChileChinaColombiaCongoCosta RicaCroatiaCubaCzechoslovakiaDenmarkDominicaDominican RepublicEastern AfricaEastern AsiaEastern EuropeEcuadorEgyptEl SalvadorEnglandEritreaEthiopiaEuropeFijiFranceGermanyGhanaGreeceGrenadaGuatemalaGuyanaHaitiHondurasHong KongHungaryIndiaIndonesiaIranIraqIrelandIsraelItalyJamaicaJapanJordanKazakhstanKenyaKoreaKuwaitLaosLatin AmericaLatviaLebanonLiberiaLithuaniaMalaysiaMexicoMicronesiaMiddle AfricaMoldovaMoroccoNepalNetherlandsNicaraguaNigeriaNorth MacedoniaNorthern AfricaNorthern EuropeNorwayOceaniaPakistanPanamaPeruPhilippinesPolandPortugalRomaniaRussiaSaudi ArabiaScotlandSenegalSerbiaSierra LeoneSingaporeSomaliaSouth AfricaSouth AmericaSouth Central AsiaSouth Eastern AsiaSouthern EuropeSpainSri LankaSt. Vincent and the GrenadinesSudanSwedenSwitzerlandSyriaTaiwanThailandTrinidad and TobagoTurkeyUgandaUkraineUruguayUzbekistanVenezuelaVietnamWest IndiesWestern AfricaWestern AsiaWestern EuropeYemenZaireZimbabwe
Income
Income (Families)
Income (Households)
Poverty
Poverty (Families)
Unemployment
Employment Occupations
Employment Industries
Employer Class
Commute Time
Commute Means
School Enrollment
Education by Degree Field
Occupancy
Finances
Physical Characteristics
Kentucky
Compare Cities
Comparison Subject

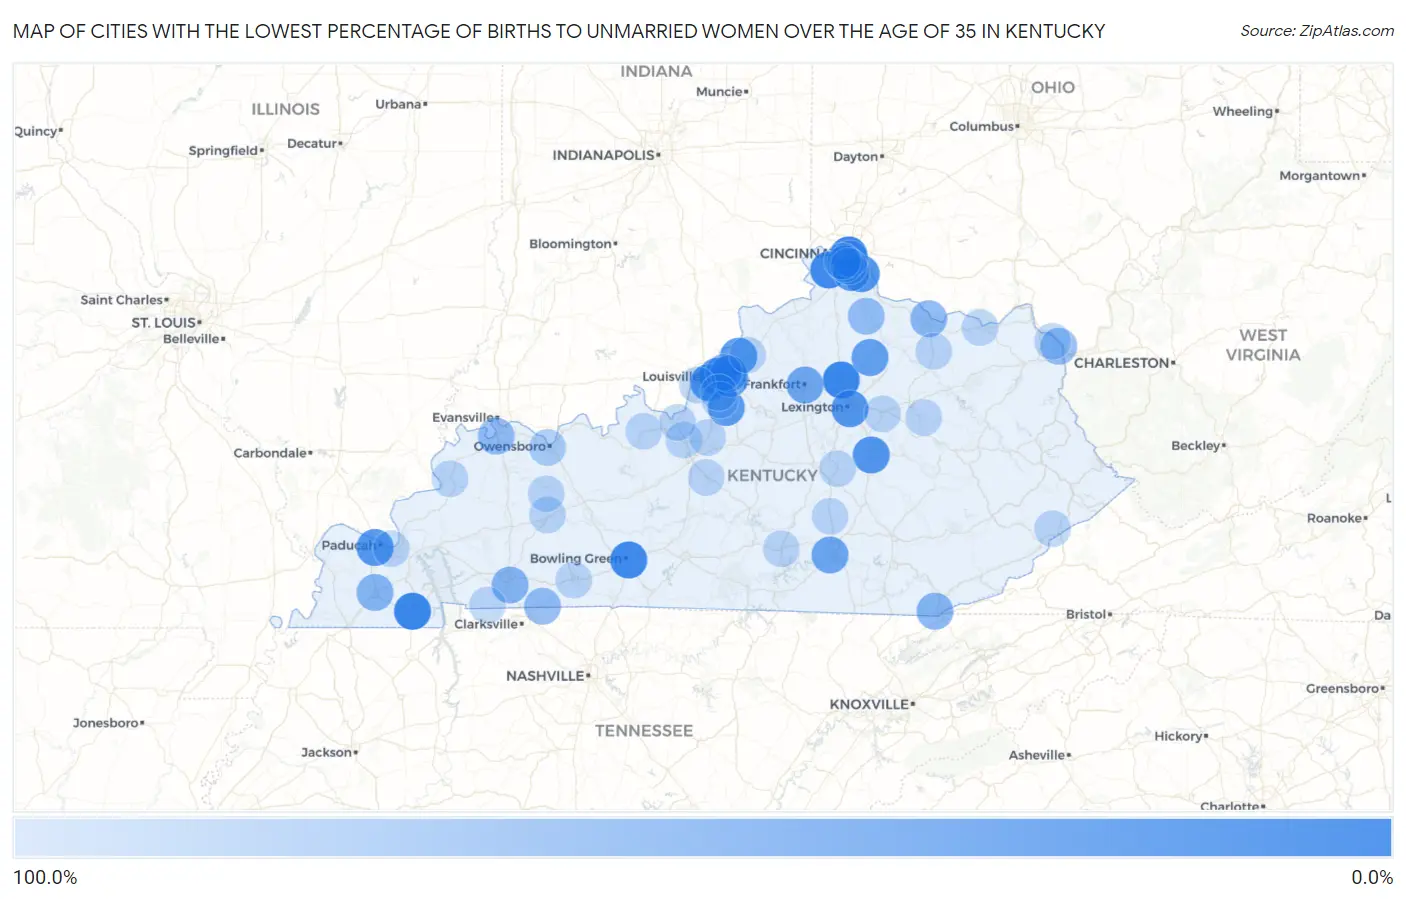
Map of Cities with the Lowest Percentage of Births to Unmarried Women over the Age of 35 in Kentucky

100.0%
0.0%
Cities with the Lowest Percentage of Births to Unmarried Women over the Age of 35 in Kentucky Map

Cities with the Lowest Percentage of Births to Unmarried Women over the Age of 35 in Kentucky

City % Unmarried vs State vs National
1.Newport4.9%21.0%(-16.1)#120.1%(-15.2)#116
2.Murray6.1%21.0%(-14.9)#220.1%(-14.0)#169
3.Georgetown6.2%21.0%(-14.8)#320.1%(-13.9)#171
4.Florence10.8%21.0%(-10.2)#420.1%(-9.30)#382
5.Bowling Green11.8%21.0%(-9.20)#520.1%(-8.30)#423
6.Richlawn14.3%21.0%(-6.70)#620.1%(-5.80)#572
7.Alexandria21.6%21.0%(+0.600)#720.1%(+1.50)#965
8.Richmond23.2%21.0%(+2.20)#820.1%(+3.10)#1,029
9.Lexington25.1%21.0%(+4.10)#920.1%(+5.00)#1,118
10.Paducah25.5%21.0%(+4.50)#1020.1%(+5.40)#1,130
11.Louisville26.3%21.0%(+5.30)#1120.1%(+6.20)#1,169
12.Mount Washington30.4%21.0%(+9.40)#1220.1%(+10.3)#1,362
13.Buckner30.8%21.0%(+9.80)#1320.1%(+10.7)#1,374
14.Ryland Heights33.3%21.0%(+12.3)#1420.1%(+13.2)#1,499
15.Cynthiana36.8%21.0%(+15.8)#1520.1%(+16.7)#1,628
16.Middletown40.7%21.0%(+19.7)#1620.1%(+20.6)#1,777
17.Anchorage42.9%21.0%(+21.9)#1720.1%(+22.8)#1,836
18.Burnside44.4%21.0%(+23.4)#1820.1%(+24.3)#1,892
19.Frankfort45.8%21.0%(+24.8)#1920.1%(+25.7)#1,933
20.Hopkinsville61.5%21.0%(+40.5)#2020.1%(+41.4)#2,329
21.Mayfield61.8%21.0%(+40.8)#2120.1%(+41.7)#2,339
22.Middlesborough62.5%21.0%(+41.5)#2220.1%(+42.4)#2,358
23.Maysville65.2%21.0%(+44.2)#2320.1%(+45.1)#2,426
24.Guthrie70.0%21.0%(+49.0)#2420.1%(+49.9)#2,511
25.Henderson70.9%21.0%(+49.9)#2520.1%(+50.8)#2,515
26.Ashland71.4%21.0%(+50.4)#2620.1%(+51.3)#2,521
27.Falmouth73.1%21.0%(+52.1)#2720.1%(+53.0)#2,548
28.Rolling Hills81.8%21.0%(+60.8)#2820.1%(+61.7)#2,646
29.Southgate87.5%21.0%(+66.5)#2920.1%(+67.4)#2,688
30.Covington88.5%21.0%(+67.5)#3020.1%(+68.4)#2,696
31.Owensboro89.0%21.0%(+68.0)#3120.1%(+68.9)#2,699
32.Radcliff100.0%21.0%(+79.0)#3220.1%(+79.9)#2,766
33.Winchester100.0%21.0%(+79.0)#3320.1%(+79.9)#2,782
34.Shively100.0%21.0%(+79.0)#3420.1%(+79.9)#2,815
35.La Grange100.0%21.0%(+79.0)#3520.1%(+79.9)#2,919
36.Russellville100.0%21.0%(+79.0)#3620.1%(+79.9)#3,004
37.Taylor Mill100.0%21.0%(+79.0)#3720.1%(+79.9)#3,022
38.Fort Wright100.0%21.0%(+79.0)#3820.1%(+79.9)#3,067
39.Central City100.0%21.0%(+79.0)#3920.1%(+79.9)#3,075
40.Lancaster100.0%21.0%(+79.0)#4020.1%(+79.9)#3,197
41.Hodgenville100.0%21.0%(+79.0)#4120.1%(+79.9)#3,255
42.Flemingsburg100.0%21.0%(+79.0)#4220.1%(+79.9)#3,286
43.Russell Springs100.0%21.0%(+79.0)#4320.1%(+79.9)#3,326
44.Lebanon Junction100.0%21.0%(+79.0)#4420.1%(+79.9)#3,429
45.Jeffersonville100.0%21.0%(+79.0)#4520.1%(+79.9)#3,484
46.Ledbetter100.0%21.0%(+79.0)#4620.1%(+79.9)#3,489
47.Sturgis100.0%21.0%(+79.0)#4720.1%(+79.9)#3,517
48.Irvington100.0%21.0%(+79.0)#4820.1%(+79.9)#3,590
49.Vanceburg100.0%21.0%(+79.0)#4920.1%(+79.9)#3,618
50.Muldraugh100.0%21.0%(+79.0)#5020.1%(+79.9)#3,641
51.Bellefonte100.0%21.0%(+79.0)#5120.1%(+79.9)#3,643
52.Heritage Creek100.0%21.0%(+79.0)#5220.1%(+79.9)#3,672
53.Fleming Neon100.0%21.0%(+79.0)#5320.1%(+79.9)#3,771
54.Island100.0%21.0%(+79.0)#5420.1%(+79.9)#3,878
55.Eubank100.0%21.0%(+79.0)#5520.1%(+79.9)#3,964
56.Spring Mill100.0%21.0%(+79.0)#5620.1%(+79.9)#4,035
57.Lafayette100.0%21.0%(+79.0)#5720.1%(+79.9)#4,124

Common Questions

What are the Top 10 Cities with the Lowest Percentage of Births to Unmarried Women over the Age of 35 in Kentucky?
Top 10 Cities with the Lowest Percentage of Births to Unmarried Women over the Age of 35 in Kentucky are:
What city has the Lowest Percentage of Births to Unmarried Women over the Age of 35 in Kentucky?
Newport has the Lowest Percentage of Births to Unmarried Women over the Age of 35 in Kentucky with 4.9%.
What is the Percentage of Births to Unmarried Women over the Age of 35 in the State of Kentucky?
Percentage of Births to Unmarried Women over the Age of 35 in Kentucky is 21.0%.
What is the Percentage of Births to Unmarried Women over the Age of 35 in the United States?
Percentage of Births to Unmarried Women over the Age of 35 in the United States is 20.1%.