Wellington, KY Map & Demographics
Wellington Map
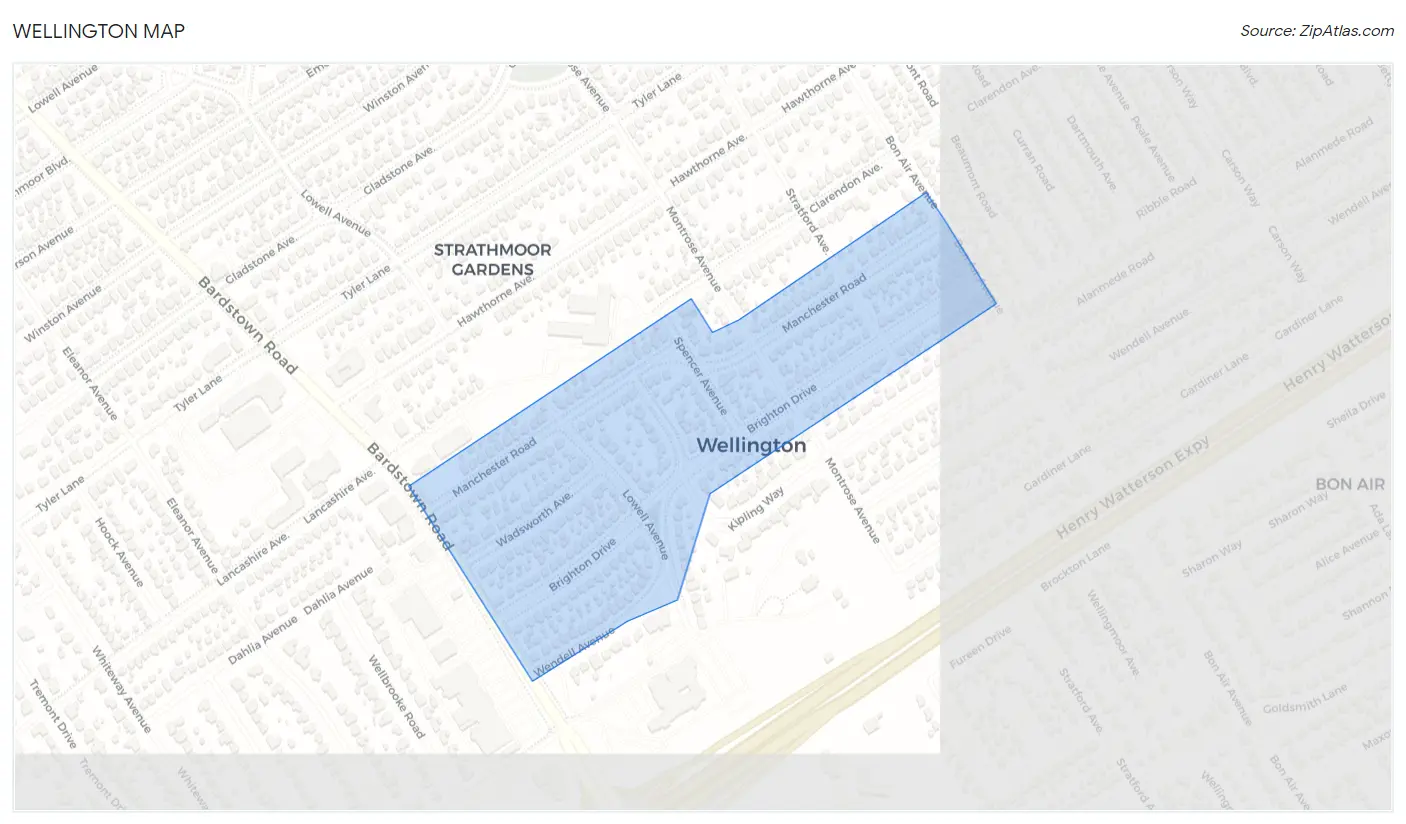
Wellington Overview
$63,370
PER CAPITA INCOME
$136,250
AVG FAMILY INCOME
$103,333
AVG HOUSEHOLD INCOME
0.4%
WAGE / INCOME GAP [ % ]
99.6¢/ $1
WAGE / INCOME GAP [ $ ]
0.37
INEQUALITY / GINI INDEX
443
TOTAL POPULATION
199
MALE POPULATION
244
FEMALE POPULATION
81.56
MALES / 100 FEMALES
122.61
FEMALES / 100 MALES
47.5
MEDIAN AGE
2.6
AVG FAMILY SIZE
1.9
AVG HOUSEHOLD SIZE
262
LABOR FORCE [ PEOPLE ]
70.4%
PERCENT IN LABOR FORCE
1.5%
UNEMPLOYMENT RATE
Wellington Zip Codes
Wellington Area Codes
Income in Wellington
Income Overview in Wellington
Per Capita Income in Wellington is $63,370, while median incomes of families and households are $136,250 and $103,333 respectively.
| Characteristic | Number | Measure |
| Per Capita Income | 443 | $63,370 |
| Median Family Income | 127 | $136,250 |
| Mean Family Income | 127 | $147,551 |
| Median Household Income | 228 | $103,333 |
| Mean Household Income | 228 | $122,667 |
| Income Deficit | 127 | $0 |
| Wage / Income Gap (%) | 443 | 0.37% |
| Wage / Income Gap ($) | 443 | 99.63¢ per $1 |
| Gini / Inequality Index | 443 | 0.37 |
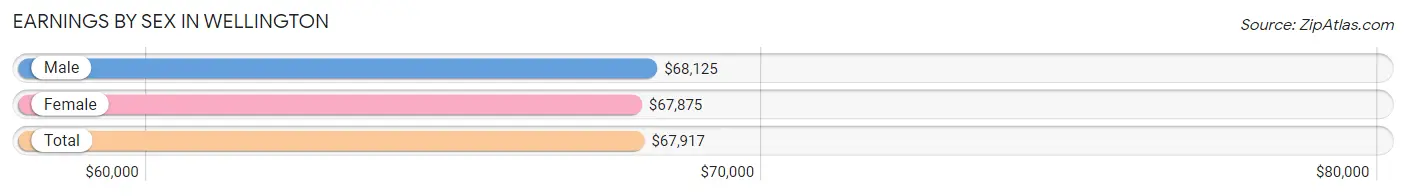
Earnings by Sex in Wellington
Average Earnings in Wellington are $67,917, $68,125 for men and $67,875 for women, a difference of 0.4%.
| Sex | Number | Average Earnings |
| Male | 129 (45.4%) | $68,125 |
| Female | 155 (54.6%) | $67,875 |
| Total | 284 (100.0%) | $67,917 |
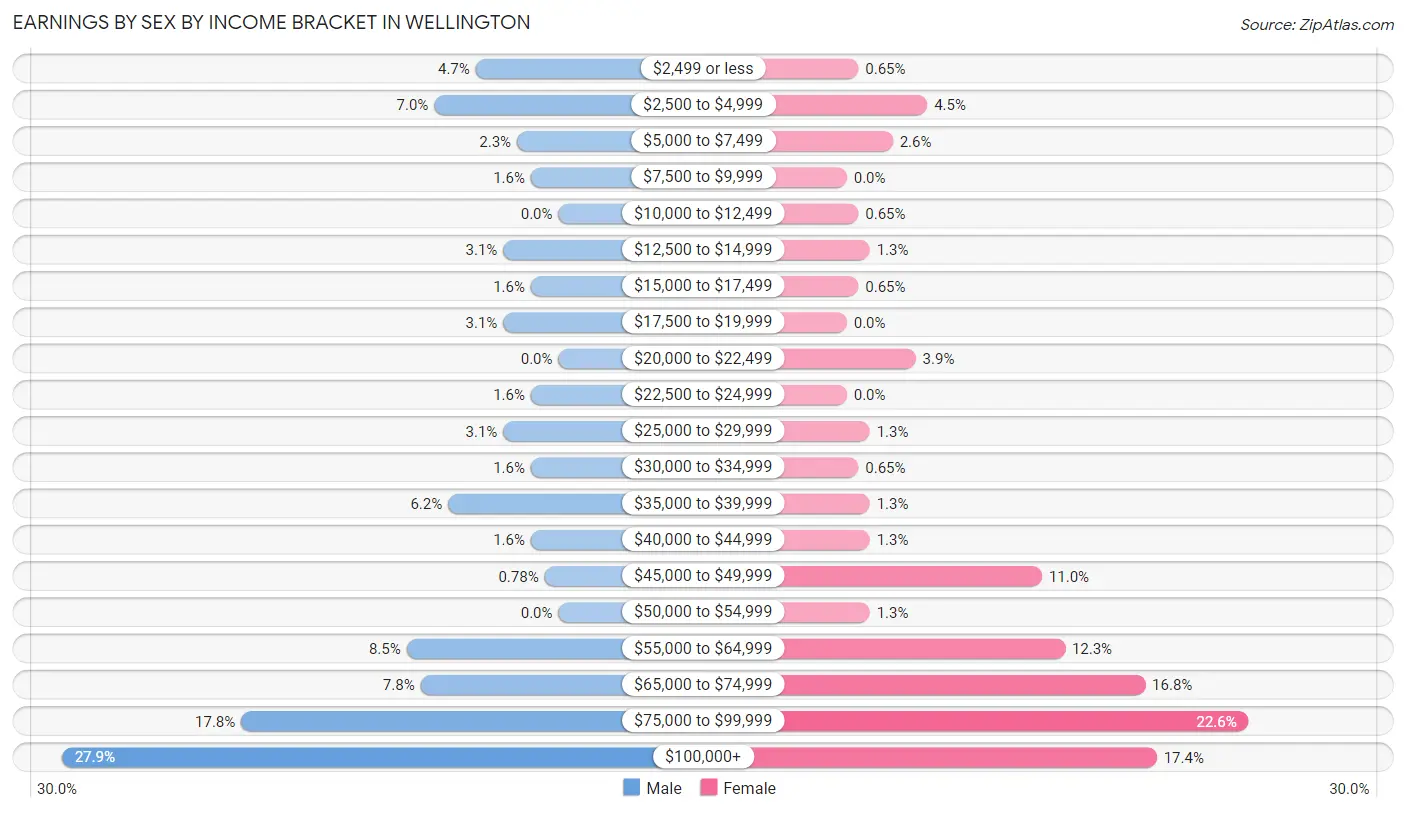
Earnings by Sex by Income Bracket in Wellington
The most common earnings brackets in Wellington are $100,000+ for men (36 | 27.9%) and $75,000 to $99,999 for women (35 | 22.6%).
| Income | Male | Female |
| $2,499 or less | 6 (4.6%) | 1 (0.6%) |
| $2,500 to $4,999 | 9 (7.0%) | 7 (4.5%) |
| $5,000 to $7,499 | 3 (2.3%) | 4 (2.6%) |
| $7,500 to $9,999 | 2 (1.5%) | 0 (0.0%) |
| $10,000 to $12,499 | 0 (0.0%) | 1 (0.6%) |
| $12,500 to $14,999 | 4 (3.1%) | 2 (1.3%) |
| $15,000 to $17,499 | 2 (1.5%) | 1 (0.6%) |
| $17,500 to $19,999 | 4 (3.1%) | 0 (0.0%) |
| $20,000 to $22,499 | 0 (0.0%) | 6 (3.9%) |
| $22,500 to $24,999 | 2 (1.5%) | 0 (0.0%) |
| $25,000 to $29,999 | 4 (3.1%) | 2 (1.3%) |
| $30,000 to $34,999 | 2 (1.5%) | 1 (0.6%) |
| $35,000 to $39,999 | 8 (6.2%) | 2 (1.3%) |
| $40,000 to $44,999 | 2 (1.5%) | 2 (1.3%) |
| $45,000 to $49,999 | 1 (0.8%) | 17 (11.0%) |
| $50,000 to $54,999 | 0 (0.0%) | 2 (1.3%) |
| $55,000 to $64,999 | 11 (8.5%) | 19 (12.3%) |
| $65,000 to $74,999 | 10 (7.7%) | 26 (16.8%) |
| $75,000 to $99,999 | 23 (17.8%) | 35 (22.6%) |
| $100,000+ | 36 (27.9%) | 27 (17.4%) |
| Total | 129 (100.0%) | 155 (100.0%) |
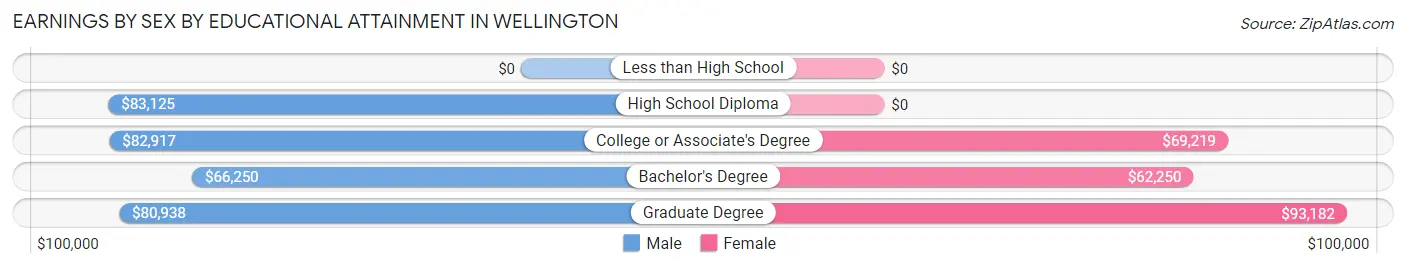
Earnings by Sex by Educational Attainment in Wellington
Average earnings in Wellington are $79,583 for men and $69,250 for women, a difference of 13.0%. Men with an educational attainment of high school diploma enjoy the highest average annual earnings of $83,125, while those with bachelor's degree education earn the least with $66,250. Women with an educational attainment of graduate degree earn the most with the average annual earnings of $93,182, while those with bachelor's degree education have the smallest earnings of $62,250.
| Educational Attainment | Male Income | Female Income |
| Less than High School | - | - |
| High School Diploma | $83,125 | $0 |
| College or Associate's Degree | $82,917 | $69,219 |
| Bachelor's Degree | $66,250 | $62,250 |
| Graduate Degree | $80,938 | $93,182 |
| Total | $79,583 | $69,250 |
Family Income in Wellington
Family Income Brackets in Wellington
According to the Wellington family income data, there are 38 families falling into the $100,000 to $149,999 income range, which is the most common income bracket and makes up 29.9% of all families.
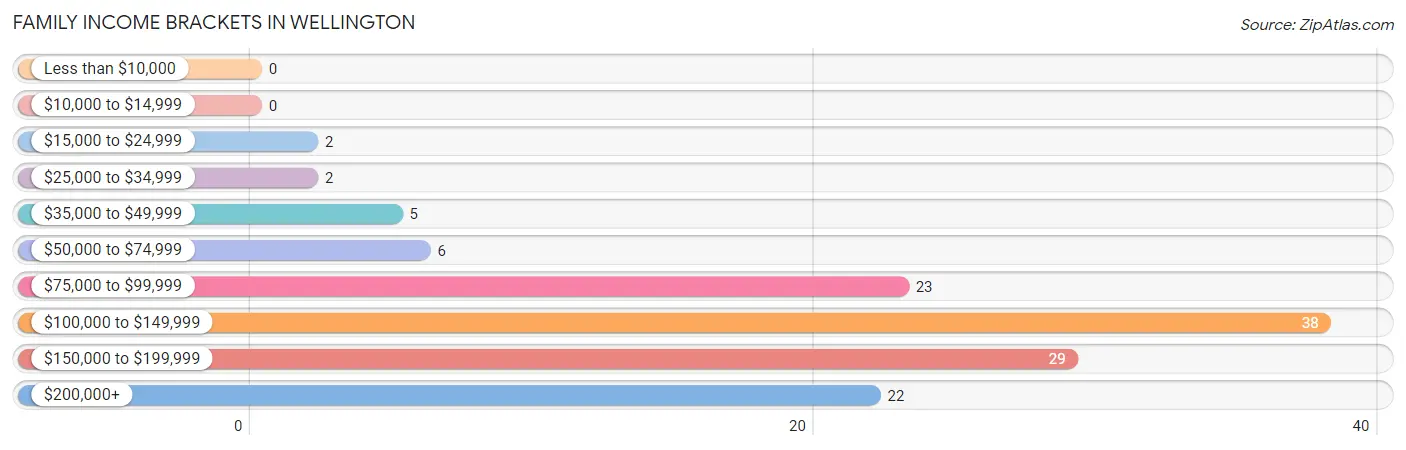
| Income Bracket | # Families | % Families |
| Less than $10,000 | 0 | 0.0% |
| $10,000 to $14,999 | 0 | 0.0% |
| $15,000 to $24,999 | 2 | 1.6% |
| $25,000 to $34,999 | 2 | 1.6% |
| $35,000 to $49,999 | 5 | 3.9% |
| $50,000 to $74,999 | 6 | 4.7% |
| $75,000 to $99,999 | 23 | 18.1% |
| $100,000 to $149,999 | 38 | 29.9% |
| $150,000 to $199,999 | 29 | 22.8% |
| $200,000+ | 22 | 17.3% |
Family Income by Famaliy Size in Wellington
4-person families (25 | 19.7%) account for the highest median family income in Wellington with $183,438 per family, while 3-person families (23 | 18.1%) have the highest median income of $47,708 per family member.
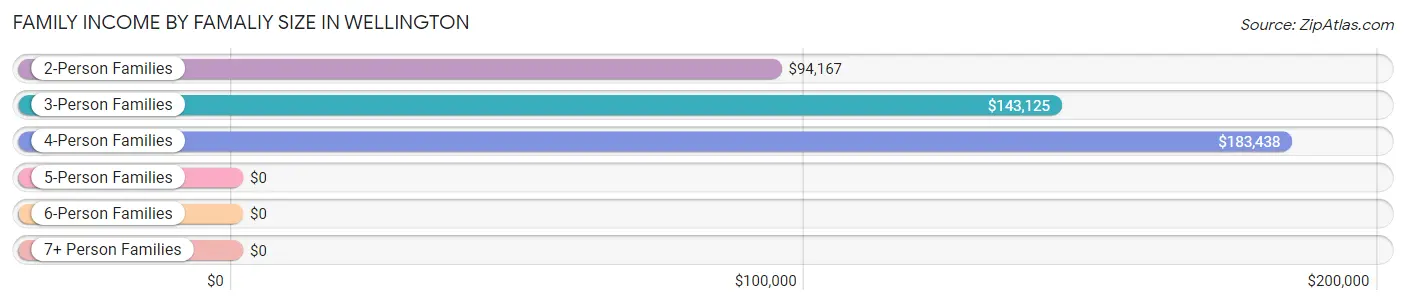
| Income Bracket | # Families | Median Income |
| 2-Person Families | 74 (58.3%) | $94,167 |
| 3-Person Families | 23 (18.1%) | $143,125 |
| 4-Person Families | 25 (19.7%) | $183,438 |
| 5-Person Families | 5 (3.9%) | $0 |
| 6-Person Families | 0 (0.0%) | $0 |
| 7+ Person Families | 0 (0.0%) | $0 |
| Total | 127 (100.0%) | $136,250 |
Family Income by Number of Earners in Wellington
The median family income in Wellington is $136,250, with families comprising 3+ earners (9) having the highest median family income of $217,917, while families with no earners (21) have the lowest median family income of $84,063, accounting for 7.1% and 16.5% of families, respectively.
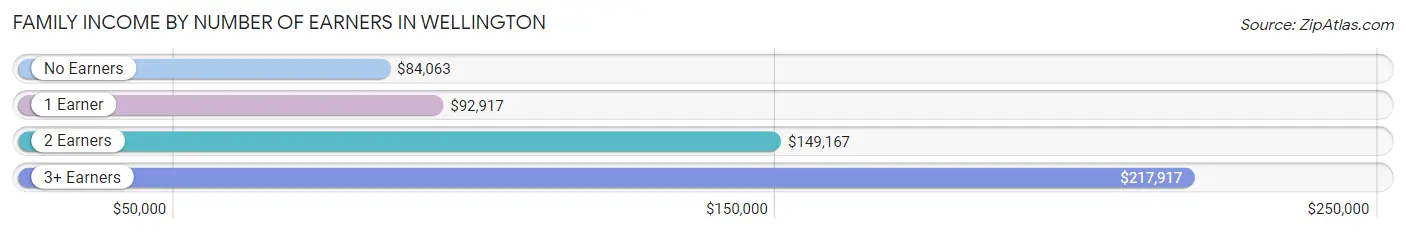
| Number of Earners | # Families | Median Income |
| No Earners | 21 (16.5%) | $84,063 |
| 1 Earner | 17 (13.4%) | $92,917 |
| 2 Earners | 80 (63.0%) | $149,167 |
| 3+ Earners | 9 (7.1%) | $217,917 |
| Total | 127 (100.0%) | $136,250 |
Household Income in Wellington
Household Income Brackets in Wellington
With 49 households falling in the category, the $100,000 to $149,999 income range is the most frequent in Wellington, accounting for 21.5% of all households.
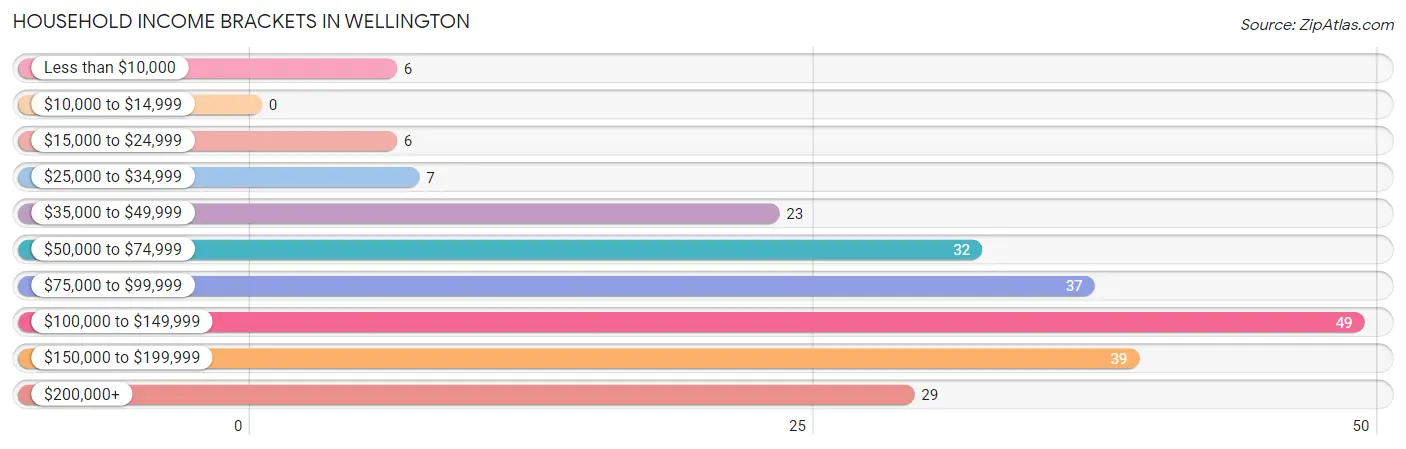
| Income Bracket | # Households | % Households |
| Less than $10,000 | 6 | 2.6% |
| $10,000 to $14,999 | 0 | 0.0% |
| $15,000 to $24,999 | 6 | 2.6% |
| $25,000 to $34,999 | 7 | 3.1% |
| $35,000 to $49,999 | 23 | 10.1% |
| $50,000 to $74,999 | 32 | 14.0% |
| $75,000 to $99,999 | 37 | 16.2% |
| $100,000 to $149,999 | 49 | 21.5% |
| $150,000 to $199,999 | 39 | 17.1% |
| $200,000+ | 29 | 12.7% |
Household Income by Householder Age in Wellington
The median household income in Wellington is $103,333, with the highest median household income of $127,083 found in the 25 to 44 years age bracket for the primary householder. A total of 51 households (22.4%) fall into this category. Meanwhile, the 15 to 24 years age bracket for the primary householder has the lowest median household income of $0, with 6 households (2.6%) in this group.
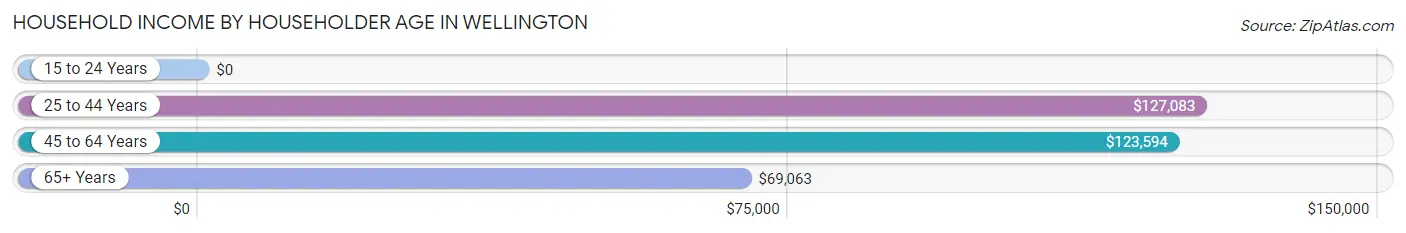
| Income Bracket | # Households | Median Income |
| 15 to 24 Years | 6 (2.6%) | $0 |
| 25 to 44 Years | 51 (22.4%) | $127,083 |
| 45 to 64 Years | 99 (43.4%) | $123,594 |
| 65+ Years | 72 (31.6%) | $69,063 |
| Total | 228 (100.0%) | $103,333 |
Poverty in Wellington
Income Below Poverty by Sex and Age in Wellington
With 4.0% poverty level for males and 1.2% for females among the residents of Wellington, 75 year old and over males and 6 to 11 year old females are the most vulnerable to poverty, with 5 males (27.8%) and 2 females (10.5%) in their respective age groups living below the poverty level.
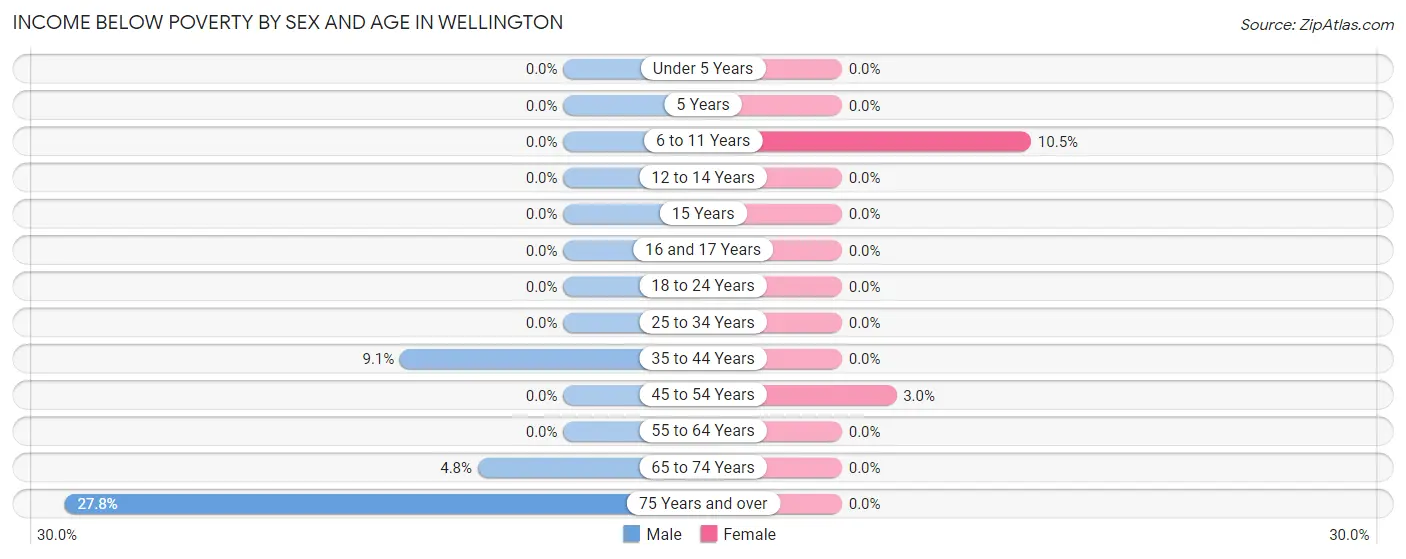
| Age Bracket | Male | Female |
| Under 5 Years | 0 (0.0%) | 0 (0.0%) |
| 5 Years | 0 (0.0%) | 0 (0.0%) |
| 6 to 11 Years | 0 (0.0%) | 2 (10.5%) |
| 12 to 14 Years | 0 (0.0%) | 0 (0.0%) |
| 15 Years | 0 (0.0%) | 0 (0.0%) |
| 16 and 17 Years | 0 (0.0%) | 0 (0.0%) |
| 18 to 24 Years | 0 (0.0%) | 0 (0.0%) |
| 25 to 34 Years | 0 (0.0%) | 0 (0.0%) |
| 35 to 44 Years | 2 (9.1%) | 0 (0.0%) |
| 45 to 54 Years | 0 (0.0%) | 1 (3.0%) |
| 55 to 64 Years | 0 (0.0%) | 0 (0.0%) |
| 65 to 74 Years | 1 (4.8%) | 0 (0.0%) |
| 75 Years and over | 5 (27.8%) | 0 (0.0%) |
| Total | 8 (4.0%) | 3 (1.2%) |
Income Above Poverty by Sex and Age in Wellington
According to the poverty statistics in Wellington, males aged under 5 years and females aged under 5 years are the age groups that are most secure financially, with 100.0% of males and 100.0% of females in these age groups living above the poverty line.
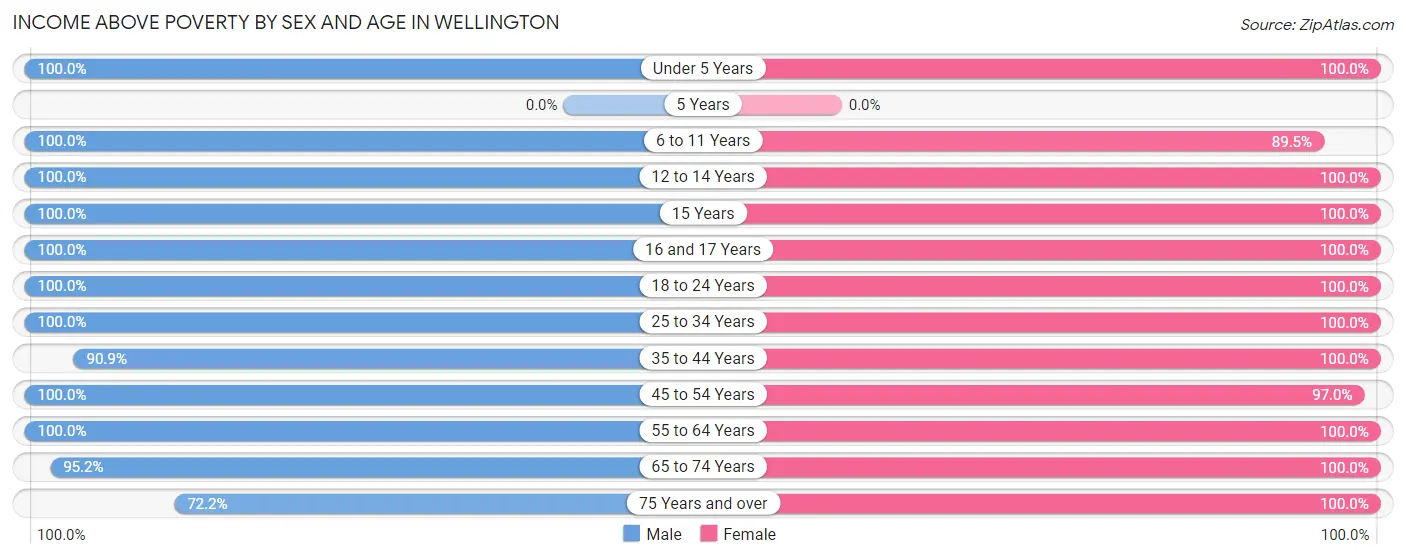
| Age Bracket | Male | Female |
| Under 5 Years | 15 (100.0%) | 3 (100.0%) |
| 5 Years | 0 (0.0%) | 0 (0.0%) |
| 6 to 11 Years | 14 (100.0%) | 17 (89.5%) |
| 12 to 14 Years | 4 (100.0%) | 7 (100.0%) |
| 15 Years | 7 (100.0%) | 2 (100.0%) |
| 16 and 17 Years | 6 (100.0%) | 3 (100.0%) |
| 18 to 24 Years | 16 (100.0%) | 13 (100.0%) |
| 25 to 34 Years | 23 (100.0%) | 33 (100.0%) |
| 35 to 44 Years | 20 (90.9%) | 18 (100.0%) |
| 45 to 54 Years | 32 (100.0%) | 32 (97.0%) |
| 55 to 64 Years | 21 (100.0%) | 61 (100.0%) |
| 65 to 74 Years | 20 (95.2%) | 32 (100.0%) |
| 75 Years and over | 13 (72.2%) | 20 (100.0%) |
| Total | 191 (96.0%) | 241 (98.8%) |
Income Below Poverty Among Married-Couple Families in Wellington
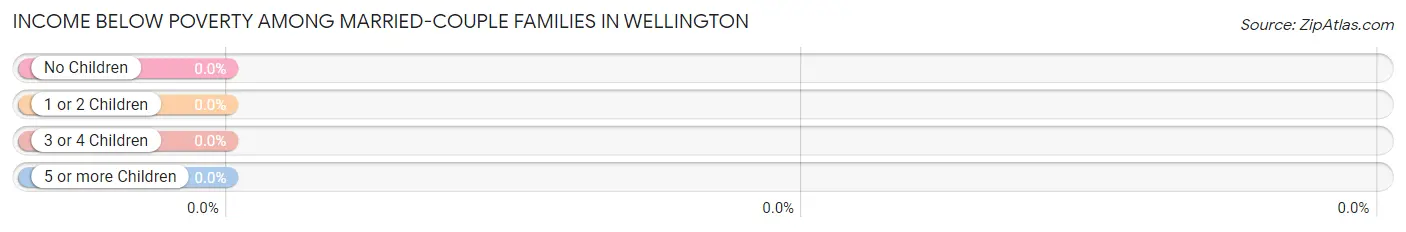
| Children | Above Poverty | Below Poverty |
| No Children | 55 (100.0%) | 0 (0.0%) |
| 1 or 2 Children | 38 (100.0%) | 0 (0.0%) |
| 3 or 4 Children | 2 (100.0%) | 0 (0.0%) |
| 5 or more Children | 0 (0.0%) | 0 (0.0%) |
| Total | 95 (100.0%) | 0 (0.0%) |
Income Below Poverty Among Single-Parent Households in Wellington
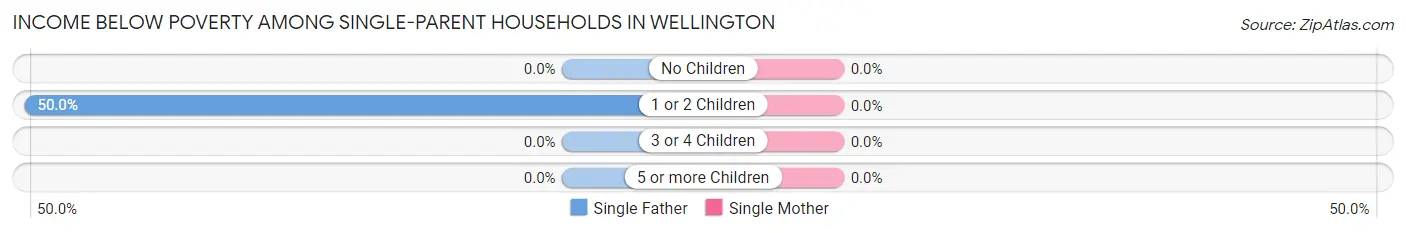
| Children | Single Father | Single Mother |
| No Children | 0 (0.0%) | 0 (0.0%) |
| 1 or 2 Children | 2 (50.0%) | 0 (0.0%) |
| 3 or 4 Children | 0 (0.0%) | 0 (0.0%) |
| 5 or more Children | 0 (0.0%) | 0 (0.0%) |
| Total | 2 (33.3%) | 0 (0.0%) |
Income Below Poverty Among Married-Couple vs Single-Parent Households in Wellington
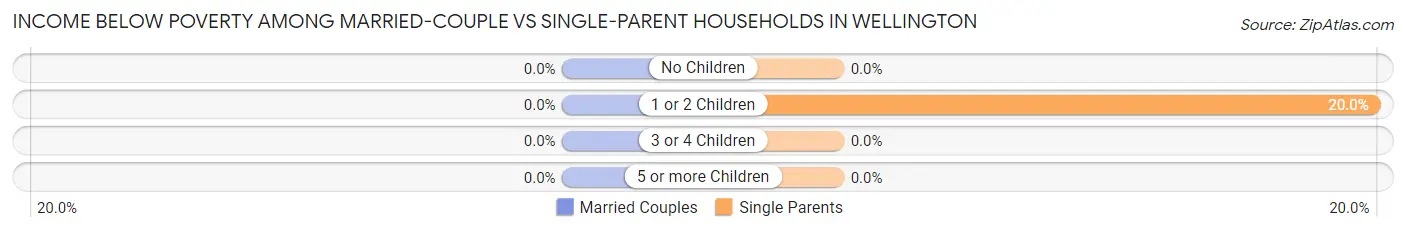
| Children | Married-Couple Families | Single-Parent Households |
| No Children | 0 (0.0%) | 0 (0.0%) |
| 1 or 2 Children | 0 (0.0%) | 2 (20.0%) |
| 3 or 4 Children | 0 (0.0%) | 0 (0.0%) |
| 5 or more Children | 0 (0.0%) | 0 (0.0%) |
| Total | 0 (0.0%) | 2 (6.2%) |
Race in Wellington
The most populous races in Wellington are White / Caucasian (420 | 94.8%), Two or more Races (21 | 4.7%), and Hispanic or Latino (13 | 2.9%).
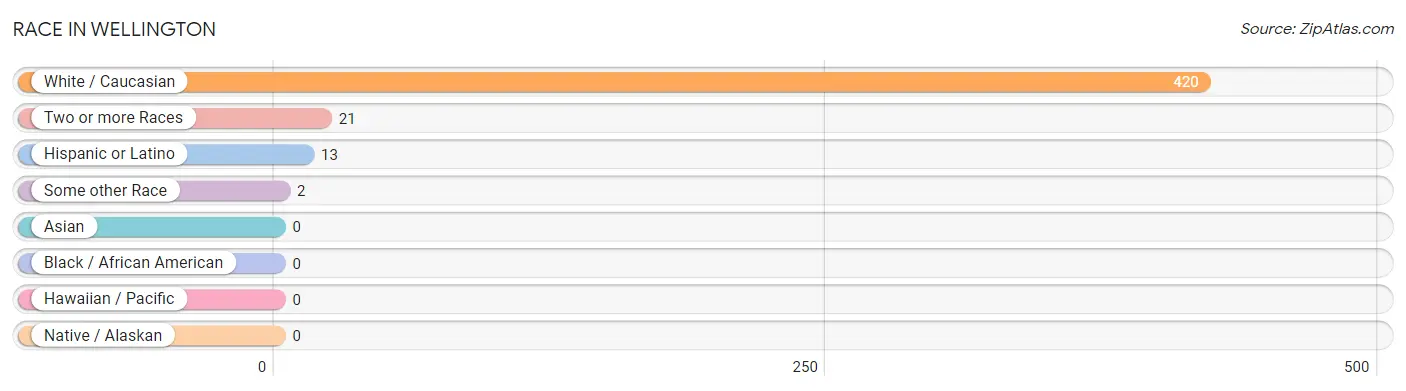
| Race | # Population | % Population |
| Asian | 0 | 0.0% |
| Black / African American | 0 | 0.0% |
| Hawaiian / Pacific | 0 | 0.0% |
| Hispanic or Latino | 13 | 2.9% |
| Native / Alaskan | 0 | 0.0% |
| White / Caucasian | 420 | 94.8% |
| Two or more Races | 21 | 4.7% |
| Some other Race | 2 | 0.4% |
| Total | 443 | 100.0% |
Ancestry in Wellington
The most populous ancestries reported in Wellington are German (165 | 37.2%), Irish (103 | 23.3%), English (77 | 17.4%), American (29 | 6.6%), and Scottish (17 | 3.8%), together accounting for 88.3% of all Wellington residents.
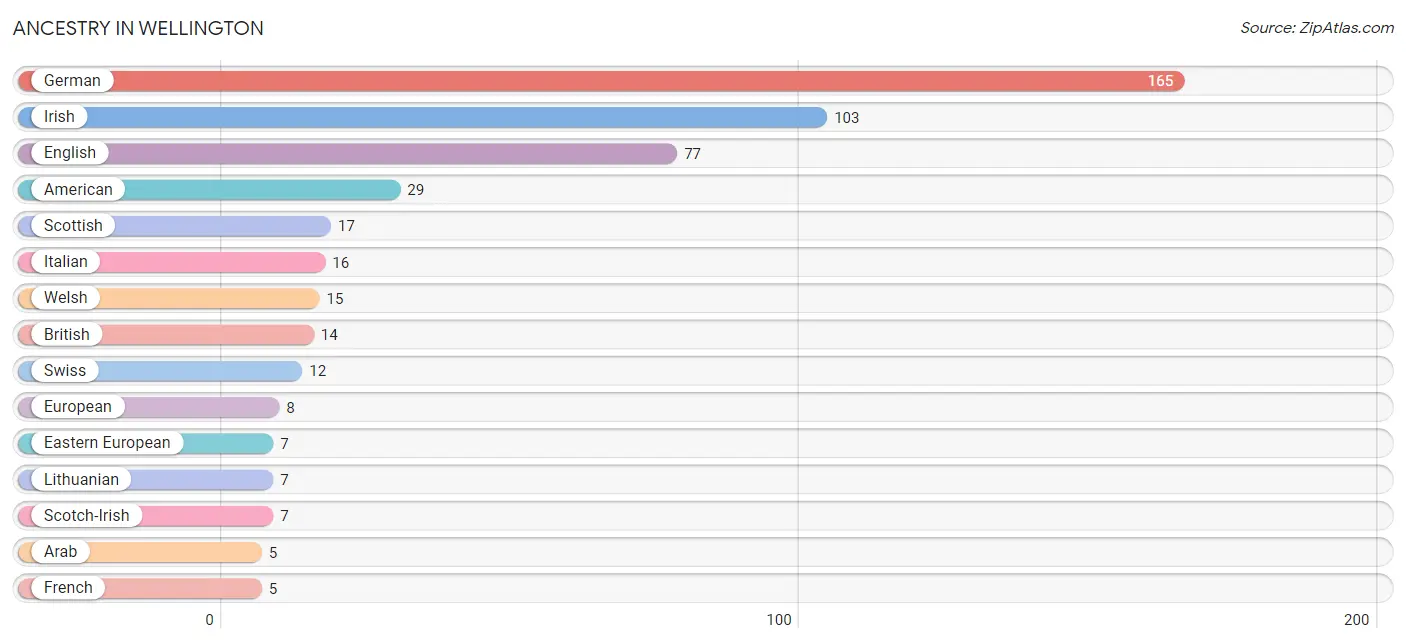
| Ancestry | # Population | % Population |
| American | 29 | 6.6% |
| Arab | 5 | 1.1% |
| British | 14 | 3.2% |
| Canadian | 2 | 0.4% |
| Central American | 2 | 0.4% |
| Cherokee | 1 | 0.2% |
| Colombian | 3 | 0.7% |
| Cuban | 4 | 0.9% |
| Dutch | 3 | 0.7% |
| Eastern European | 7 | 1.6% |
| English | 77 | 17.4% |
| European | 8 | 1.8% |
| Finnish | 2 | 0.4% |
| French | 5 | 1.1% |
| French Canadian | 3 | 0.7% |
| German | 165 | 37.2% |
| Greek | 4 | 0.9% |
| Guatemalan | 2 | 0.4% |
| Irish | 103 | 23.3% |
| Italian | 16 | 3.6% |
| Lebanese | 3 | 0.7% |
| Lithuanian | 7 | 1.6% |
| Mexican | 1 | 0.2% |
| Northern European | 2 | 0.4% |
| Norwegian | 3 | 0.7% |
| Polish | 2 | 0.4% |
| Russian | 2 | 0.4% |
| Scandinavian | 3 | 0.7% |
| Scotch-Irish | 7 | 1.6% |
| Scottish | 17 | 3.8% |
| South American | 3 | 0.7% |
| Spaniard | 3 | 0.7% |
| Swedish | 5 | 1.1% |
| Swiss | 12 | 2.7% |
| Welsh | 15 | 3.4% | View All 35 Rows |
Immigrants in Wellington
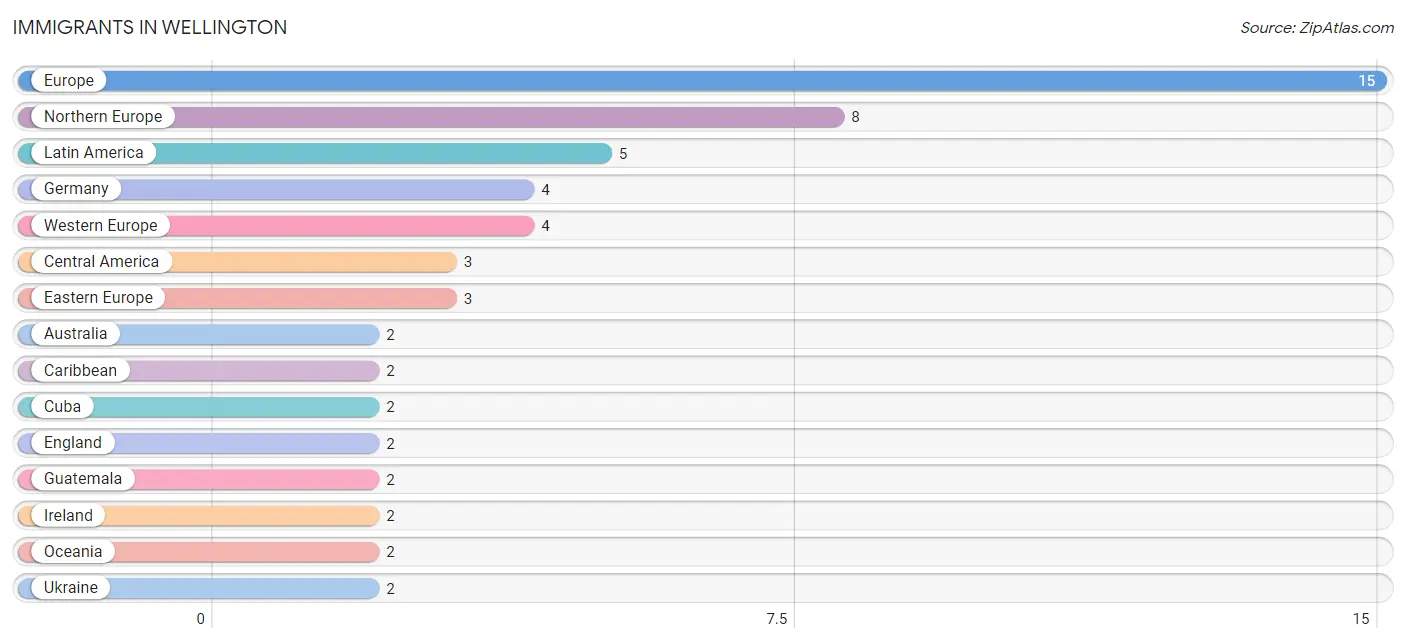
The most numerous immigrant groups reported in Wellington came from Europe (15 | 3.4%), Northern Europe (8 | 1.8%), Latin America (5 | 1.1%), Germany (4 | 0.9%), and Western Europe (4 | 0.9%), together accounting for 8.1% of all Wellington residents.
| Immigration Origin | # Population | % Population |
| Australia | 2 | 0.4% |
| Caribbean | 2 | 0.4% |
| Central America | 3 | 0.7% |
| Cuba | 2 | 0.4% |
| Eastern Europe | 3 | 0.7% |
| England | 2 | 0.4% |
| Europe | 15 | 3.4% |
| Germany | 4 | 0.9% |
| Guatemala | 2 | 0.4% |
| Ireland | 2 | 0.4% |
| Latin America | 5 | 1.1% |
| Mexico | 1 | 0.2% |
| Northern Europe | 8 | 1.8% |
| Oceania | 2 | 0.4% |
| Russia | 1 | 0.2% |
| Ukraine | 2 | 0.4% |
| Western Europe | 4 | 0.9% | View All 17 Rows |
Sex and Age in Wellington
Sex and Age in Wellington
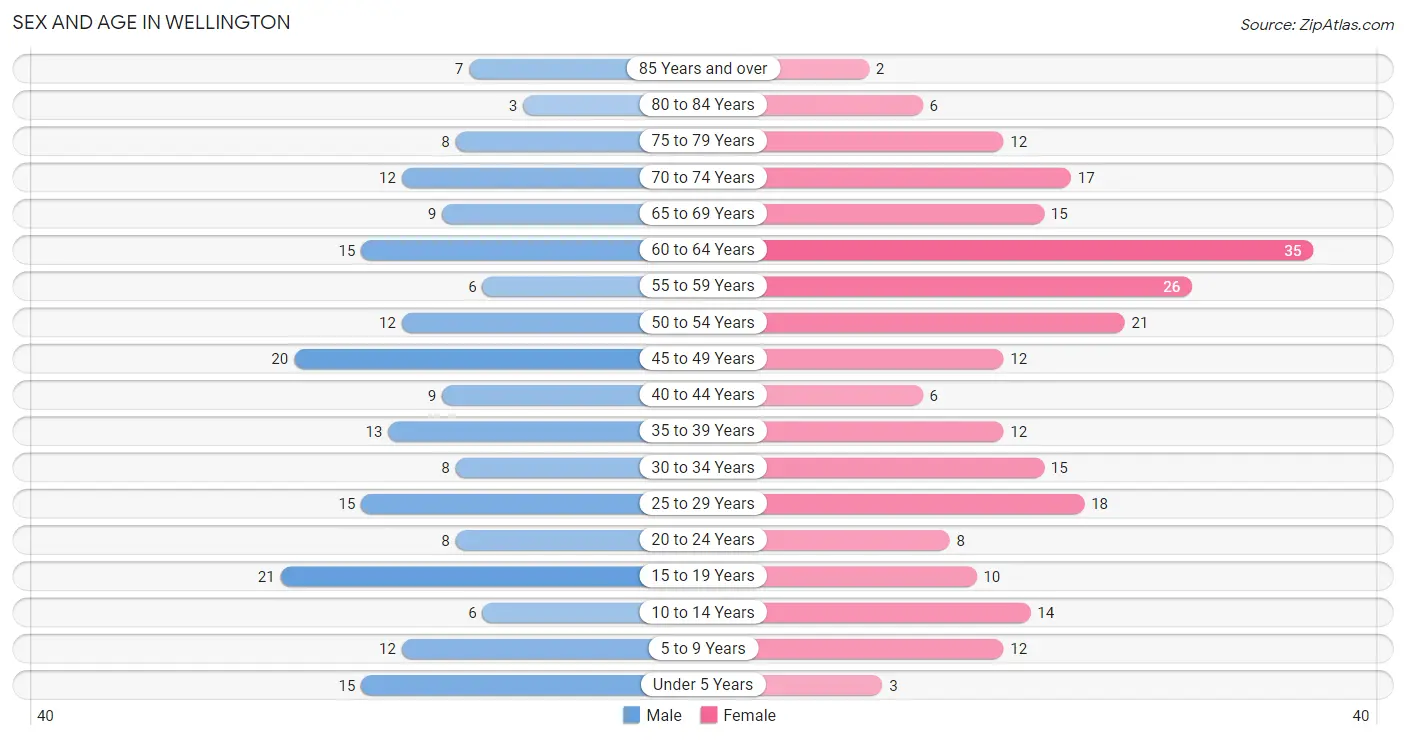
The most populous age groups in Wellington are 15 to 19 Years (21 | 10.5%) for men and 60 to 64 Years (35 | 14.3%) for women.
| Age Bracket | Male | Female |
| Under 5 Years | 15 (7.5%) | 3 (1.2%) |
| 5 to 9 Years | 12 (6.0%) | 12 (4.9%) |
| 10 to 14 Years | 6 (3.0%) | 14 (5.7%) |
| 15 to 19 Years | 21 (10.5%) | 10 (4.1%) |
| 20 to 24 Years | 8 (4.0%) | 8 (3.3%) |
| 25 to 29 Years | 15 (7.5%) | 18 (7.4%) |
| 30 to 34 Years | 8 (4.0%) | 15 (6.1%) |
| 35 to 39 Years | 13 (6.5%) | 12 (4.9%) |
| 40 to 44 Years | 9 (4.5%) | 6 (2.5%) |
| 45 to 49 Years | 20 (10.1%) | 12 (4.9%) |
| 50 to 54 Years | 12 (6.0%) | 21 (8.6%) |
| 55 to 59 Years | 6 (3.0%) | 26 (10.7%) |
| 60 to 64 Years | 15 (7.5%) | 35 (14.3%) |
| 65 to 69 Years | 9 (4.5%) | 15 (6.1%) |
| 70 to 74 Years | 12 (6.0%) | 17 (7.0%) |
| 75 to 79 Years | 8 (4.0%) | 12 (4.9%) |
| 80 to 84 Years | 3 (1.5%) | 6 (2.5%) |
| 85 Years and over | 7 (3.5%) | 2 (0.8%) |
| Total | 199 (100.0%) | 244 (100.0%) |
Families and Households in Wellington
Median Family Size in Wellington
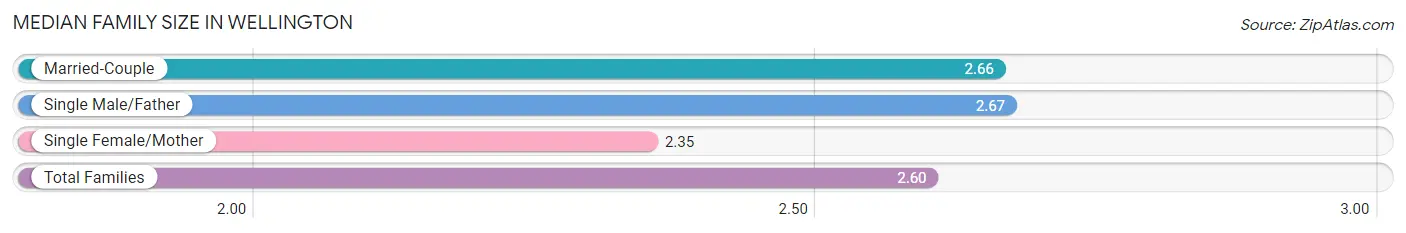
The median family size in Wellington is 2.60 persons per family, with single male/father families (6 | 4.7%) accounting for the largest median family size of 2.67 persons per family. On the other hand, single female/mother families (26 | 20.5%) represent the smallest median family size with 2.35 persons per family.
| Family Type | # Families | Family Size |
| Married-Couple | 95 (74.8%) | 2.66 |
| Single Male/Father | 6 (4.7%) | 2.67 |
| Single Female/Mother | 26 (20.5%) | 2.35 |
| Total Families | 127 (100.0%) | 2.60 |
Median Household Size in Wellington
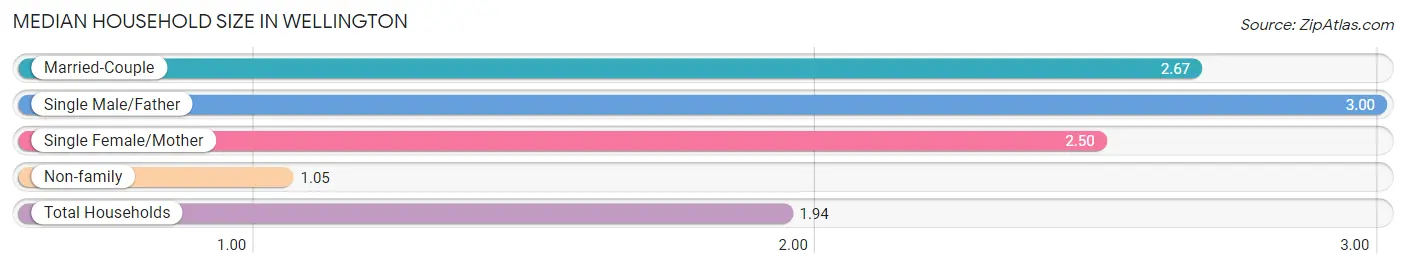
The median household size in Wellington is 1.94 persons per household, with single male/father households (6 | 2.6%) accounting for the largest median household size of 3 persons per household. non-family households (101 | 44.3%) represent the smallest median household size with 1.05 persons per household.
| Household Type | # Households | Household Size |
| Married-Couple | 95 (41.7%) | 2.67 |
| Single Male/Father | 6 (2.6%) | 3.00 |
| Single Female/Mother | 26 (11.4%) | 2.50 |
| Non-family | 101 (44.3%) | 1.05 |
| Total Households | 228 (100.0%) | 1.94 |
Household Size by Marriage Status in Wellington
Out of a total of 228 households in Wellington, 127 (55.7%) are family households, while 101 (44.3%) are nonfamily households. The most numerous type of family households are 2-person households, comprising 70, and the most common type of nonfamily households are 1-person households, comprising 96.
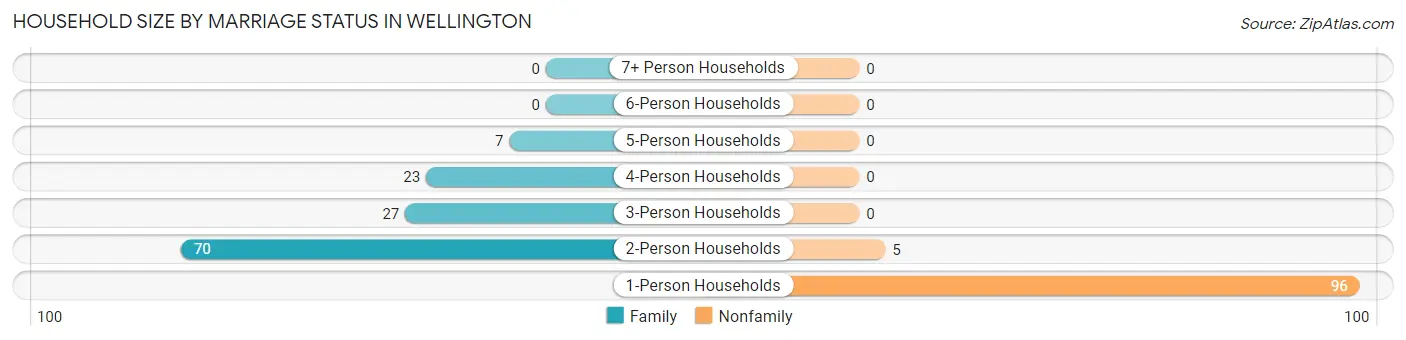
| Household Size | Family Households | Nonfamily Households |
| 1-Person Households | - | 96 (42.1%) |
| 2-Person Households | 70 (30.7%) | 5 (2.2%) |
| 3-Person Households | 27 (11.8%) | 0 (0.0%) |
| 4-Person Households | 23 (10.1%) | 0 (0.0%) |
| 5-Person Households | 7 (3.1%) | 0 (0.0%) |
| 6-Person Households | 0 (0.0%) | 0 (0.0%) |
| 7+ Person Households | 0 (0.0%) | 0 (0.0%) |
| Total | 127 (55.7%) | 101 (44.3%) |
Female Fertility in Wellington
Fertility by Age in Wellington
Average fertility rate in Wellington is 118.0 births per 1,000 women. Women in the age bracket of 20 to 34 years have the highest fertility rate with 195.0 births per 1,000 women. Women in the age bracket of 20 to 34 years acount for 80.0% of all women with births.
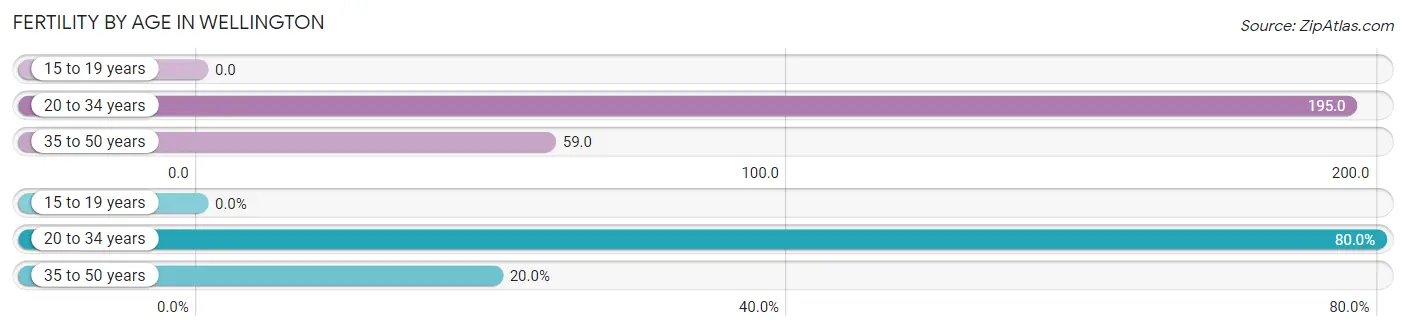
| Age Bracket | Women with Births | Births / 1,000 Women |
| 15 to 19 years | 0 (0.0%) | 0.0 |
| 20 to 34 years | 8 (80.0%) | 195.0 |
| 35 to 50 years | 2 (20.0%) | 59.0 |
| Total | 10 (100.0%) | 118.0 |
Fertility by Age by Marriage Status in Wellington
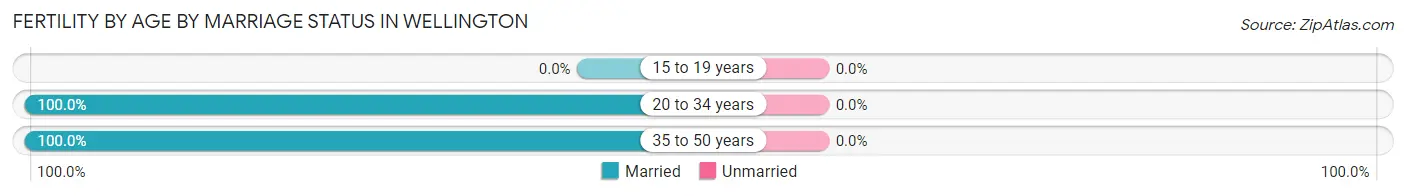
| Age Bracket | Married | Unmarried |
| 15 to 19 years | 0 (0.0%) | 0 (0.0%) |
| 20 to 34 years | 8 (100.0%) | 0 (0.0%) |
| 35 to 50 years | 2 (100.0%) | 0 (0.0%) |
| Total | 10 (100.0%) | 0 (0.0%) |
Fertility by Education in Wellington
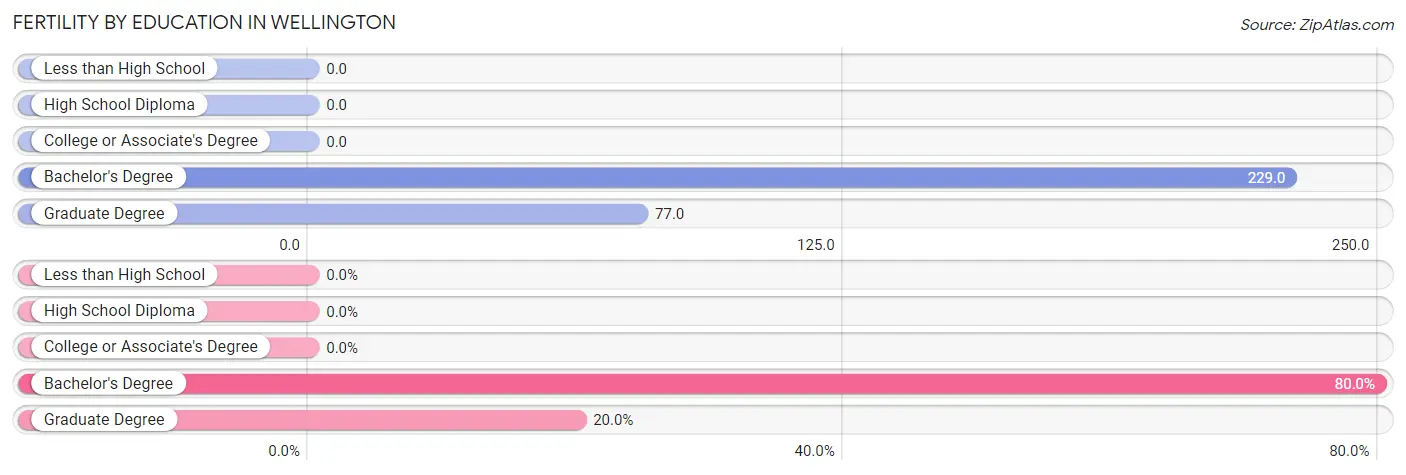
| Educational Attainment | Women with Births | Births / 1,000 Women |
| Less than High School | 0 (0.0%) | 0.0 |
| High School Diploma | 0 (0.0%) | 0.0 |
| College or Associate's Degree | 0 (0.0%) | 0.0 |
| Bachelor's Degree | 8 (80.0%) | 229.0 |
| Graduate Degree | 2 (20.0%) | 77.0 |
| Total | 10 (100.0%) | 118.0 |
Fertility by Education by Marriage Status in Wellington
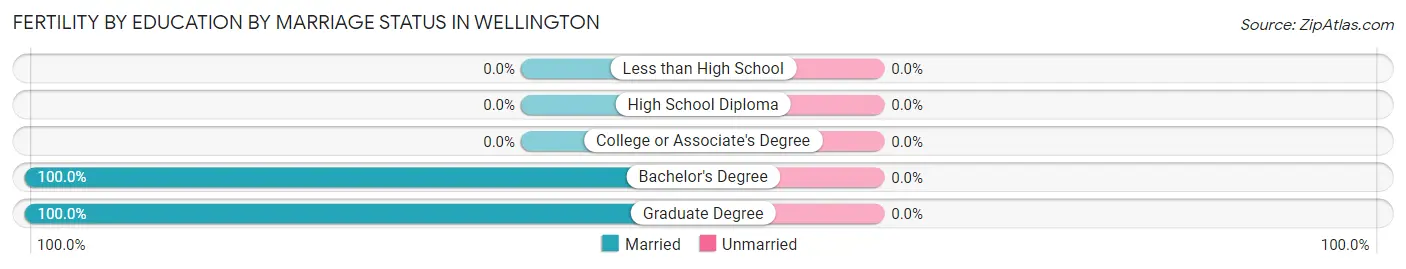
| Educational Attainment | Married | Unmarried |
| Less than High School | 0 (0.0%) | 0 (0.0%) |
| High School Diploma | 0 (0.0%) | 0 (0.0%) |
| College or Associate's Degree | 0 (0.0%) | 0 (0.0%) |
| Bachelor's Degree | 8 (100.0%) | 0 (0.0%) |
| Graduate Degree | 2 (100.0%) | 0 (0.0%) |
| Total | 10 (100.0%) | 0 (0.0%) |
Employment Characteristics in Wellington
Employment by Class of Employer in Wellington
Among the 253 employed individuals in Wellington, private company employees (149 | 58.9%), not-for-profit organizations (64 | 25.3%), and local government employees (16 | 6.3%) make up the most common classes of employment.
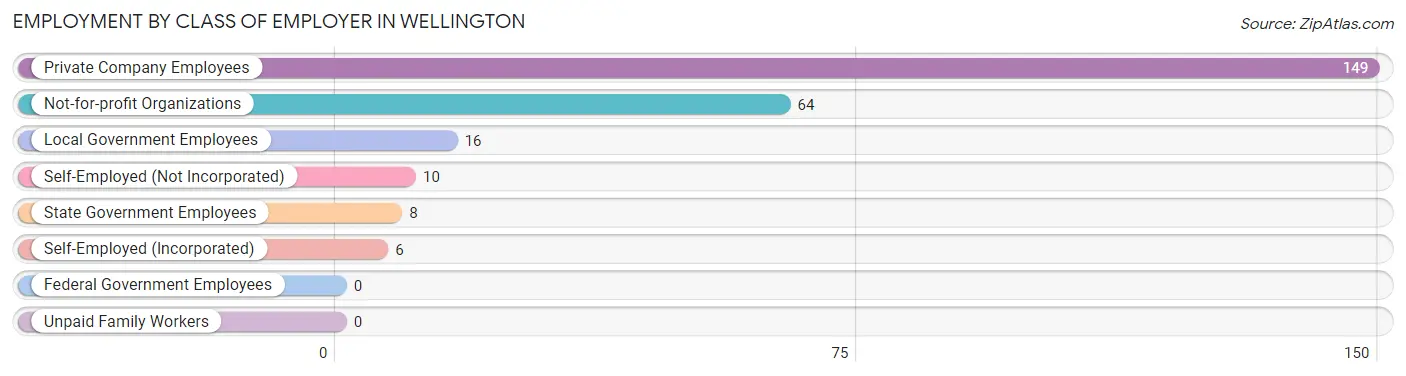
| Employer Class | # Employees | % Employees |
| Private Company Employees | 149 | 58.9% |
| Self-Employed (Incorporated) | 6 | 2.4% |
| Self-Employed (Not Incorporated) | 10 | 4.0% |
| Not-for-profit Organizations | 64 | 25.3% |
| Local Government Employees | 16 | 6.3% |
| State Government Employees | 8 | 3.2% |
| Federal Government Employees | 0 | 0.0% |
| Unpaid Family Workers | 0 | 0.0% |
| Total | 253 | 100.0% |
Employment Status by Age in Wellington
According to the labor force statistics for Wellington, out of the total population over 16 years of age (372), 70.4% or 262 individuals are in the labor force, with 1.5% or 4 of them unemployed. The age group with the highest labor force participation rate is 25 to 29 years, with 100.0% or 33 individuals in the labor force. Within the labor force, the 16 to 19 years age range has the highest percentage of unemployed individuals, with 30.0% or 3 of them being unemployed.
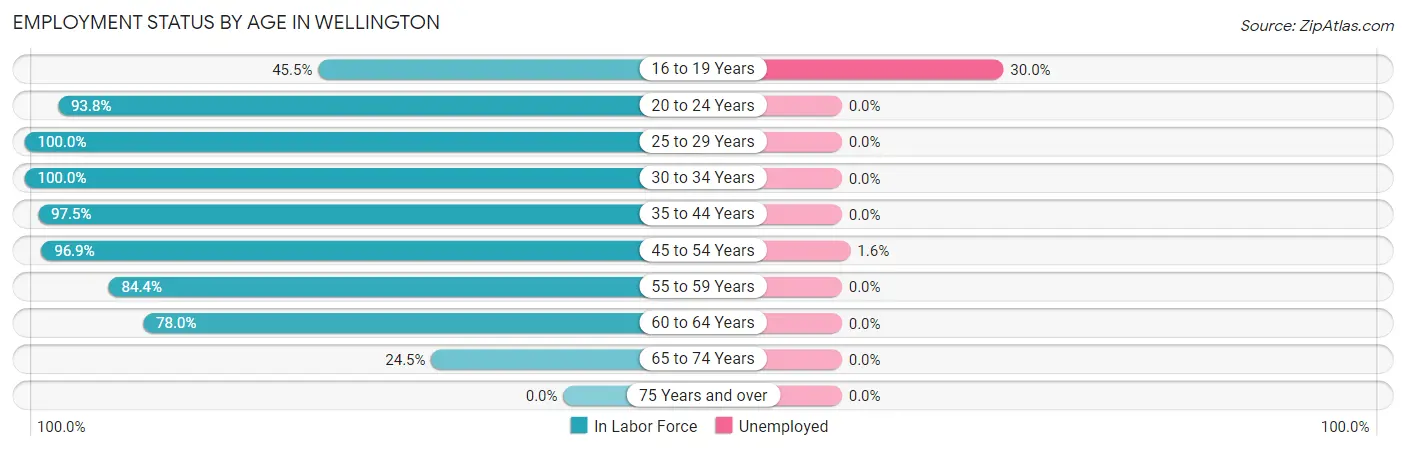
| Age Bracket | In Labor Force | Unemployed |
| 16 to 19 Years | 10 (45.5%) | 3 (30.0%) |
| 20 to 24 Years | 15 (93.8%) | 0 (0.0%) |
| 25 to 29 Years | 33 (100.0%) | 0 (0.0%) |
| 30 to 34 Years | 23 (100.0%) | 0 (0.0%) |
| 35 to 44 Years | 39 (97.5%) | 0 (0.0%) |
| 45 to 54 Years | 63 (96.9%) | 1 (1.6%) |
| 55 to 59 Years | 27 (84.4%) | 0 (0.0%) |
| 60 to 64 Years | 39 (78.0%) | 0 (0.0%) |
| 65 to 74 Years | 13 (24.5%) | 0 (0.0%) |
| 75 Years and over | 0 (0.0%) | 0 (0.0%) |
| Total | 262 (70.4%) | 4 (1.5%) |
Employment Status by Educational Attainment in Wellington
According to labor force statistics for Wellington, 92.2% of individuals (224) out of the total population between 25 and 64 years of age (243) are in the labor force, with 0.4% or 1 of them being unemployed. The group with the highest labor force participation rate are those with the educational attainment of bachelor's degree or higher, with 99.4% or 174 individuals in the labor force. Within the labor force, individuals with bachelor's degree or higher education have the highest percentage of unemployment, with 0.6% or 1 of them being unemployed.
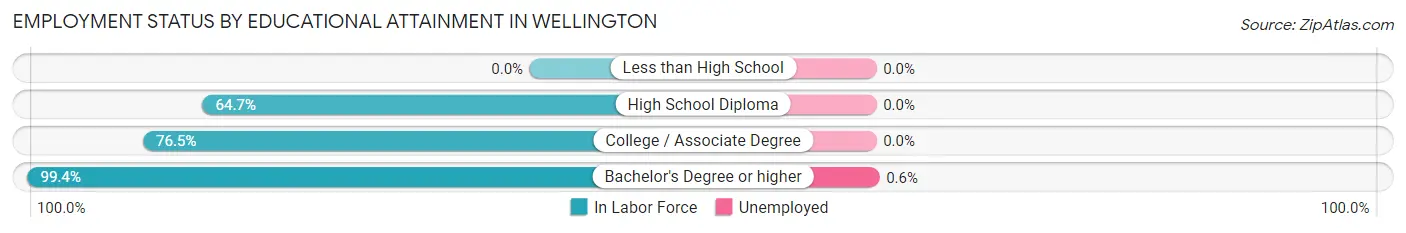
| Educational Attainment | In Labor Force | Unemployed |
| Less than High School | 0 (0.0%) | 0 (0.0%) |
| High School Diploma | 11 (64.7%) | 0 (0.0%) |
| College / Associate Degree | 39 (76.5%) | 0 (0.0%) |
| Bachelor's Degree or higher | 174 (99.4%) | 1 (0.6%) |
| Total | 224 (92.2%) | 1 (0.4%) |
Employment Occupations by Sex in Wellington
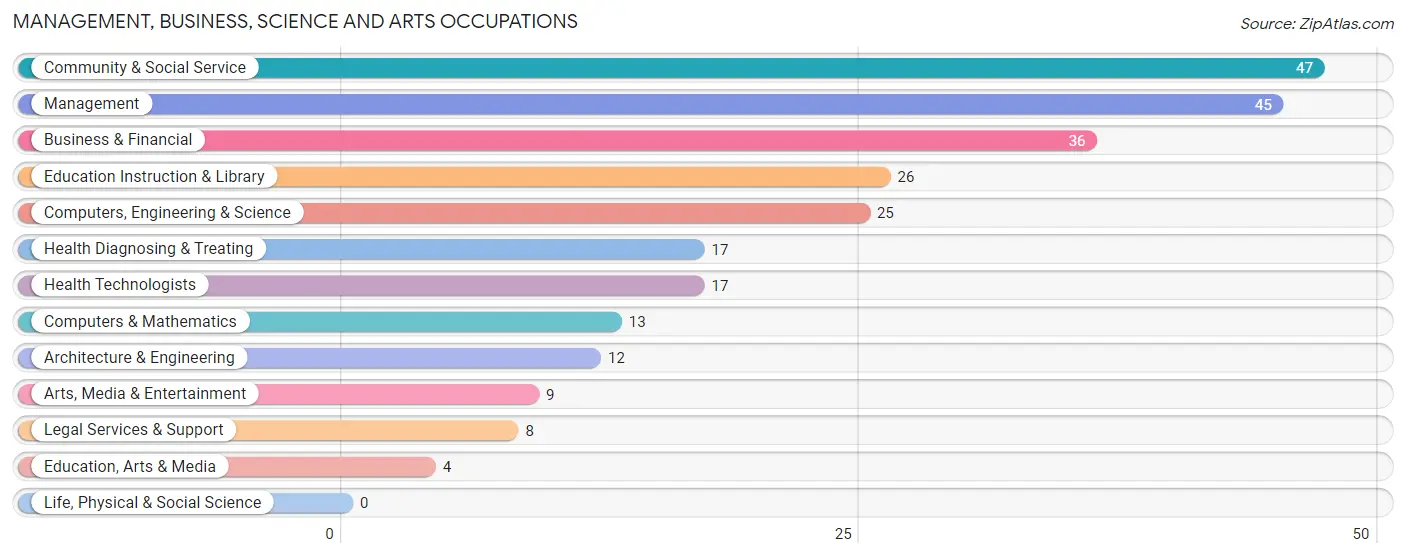
Management, Business, Science and Arts Occupations
The most common Management, Business, Science and Arts occupations in Wellington are Community & Social Service (47 | 18.2%), Management (45 | 17.4%), Business & Financial (36 | 14.0%), Education Instruction & Library (26 | 10.1%), and Computers, Engineering & Science (25 | 9.7%).
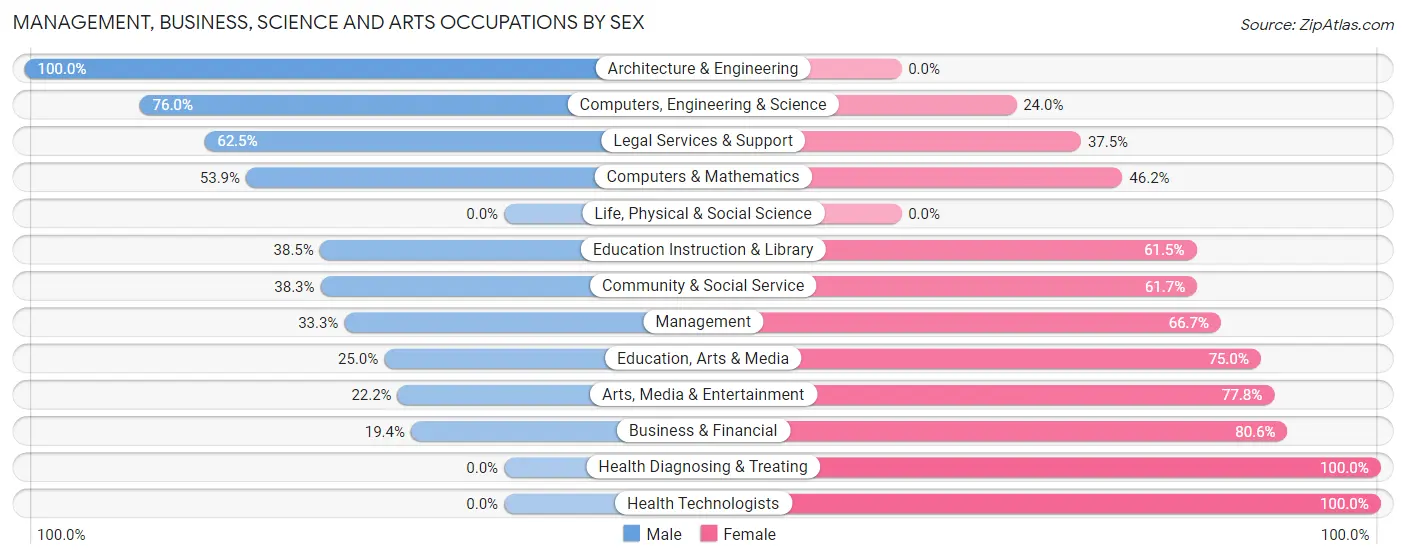
Management, Business, Science and Arts Occupations by Sex
Within the Management, Business, Science and Arts occupations in Wellington, the most male-oriented occupations are Architecture & Engineering (100.0%), Computers, Engineering & Science (76.0%), and Legal Services & Support (62.5%), while the most female-oriented occupations are Health Diagnosing & Treating (100.0%), Health Technologists (100.0%), and Business & Financial (80.6%).
| Occupation | Male | Female |
| Management | 15 (33.3%) | 30 (66.7%) |
| Business & Financial | 7 (19.4%) | 29 (80.6%) |
| Computers, Engineering & Science | 19 (76.0%) | 6 (24.0%) |
| Computers & Mathematics | 7 (53.8%) | 6 (46.2%) |
| Architecture & Engineering | 12 (100.0%) | 0 (0.0%) |
| Life, Physical & Social Science | 0 (0.0%) | 0 (0.0%) |
| Community & Social Service | 18 (38.3%) | 29 (61.7%) |
| Education, Arts & Media | 1 (25.0%) | 3 (75.0%) |
| Legal Services & Support | 5 (62.5%) | 3 (37.5%) |
| Education Instruction & Library | 10 (38.5%) | 16 (61.5%) |
| Arts, Media & Entertainment | 2 (22.2%) | 7 (77.8%) |
| Health Diagnosing & Treating | 0 (0.0%) | 17 (100.0%) |
| Health Technologists | 0 (0.0%) | 17 (100.0%) |
| Total (Category) | 59 (34.7%) | 111 (65.3%) |
| Total (Overall) | 116 (45.0%) | 142 (55.0%) |
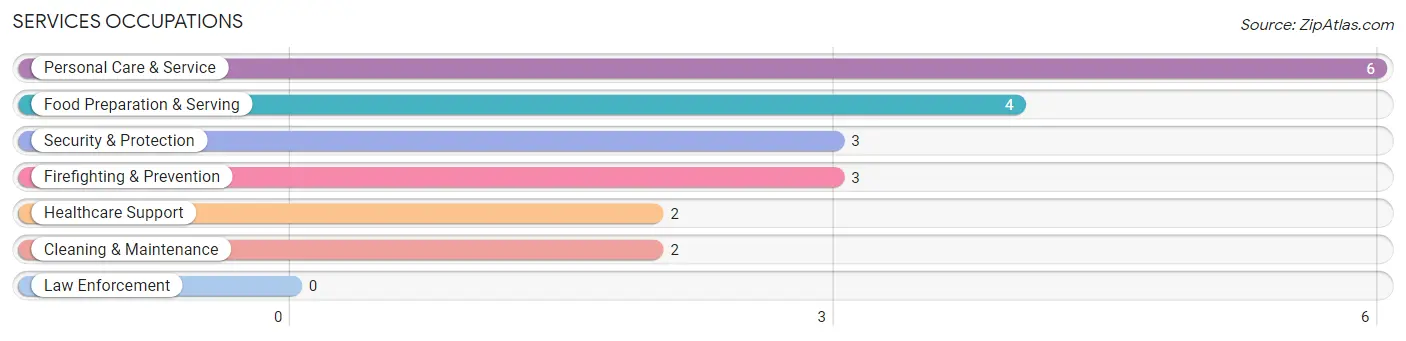
Services Occupations
The most common Services occupations in Wellington are Personal Care & Service (6 | 2.3%), Food Preparation & Serving (4 | 1.5%), Security & Protection (3 | 1.2%), Firefighting & Prevention (3 | 1.2%), and Healthcare Support (2 | 0.8%).
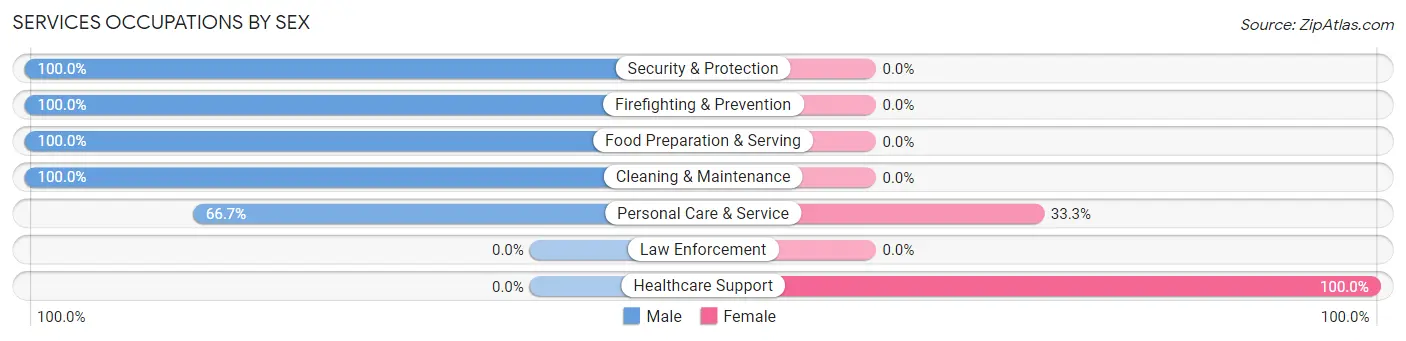
Services Occupations by Sex
Within the Services occupations in Wellington, the most male-oriented occupations are Security & Protection (100.0%), Firefighting & Prevention (100.0%), and Food Preparation & Serving (100.0%), while the most female-oriented occupations are Healthcare Support (100.0%), and Personal Care & Service (33.3%).
| Occupation | Male | Female |
| Healthcare Support | 0 (0.0%) | 2 (100.0%) |
| Security & Protection | 3 (100.0%) | 0 (0.0%) |
| Firefighting & Prevention | 3 (100.0%) | 0 (0.0%) |
| Law Enforcement | 0 (0.0%) | 0 (0.0%) |
| Food Preparation & Serving | 4 (100.0%) | 0 (0.0%) |
| Cleaning & Maintenance | 2 (100.0%) | 0 (0.0%) |
| Personal Care & Service | 4 (66.7%) | 2 (33.3%) |
| Total (Category) | 13 (76.5%) | 4 (23.5%) |
| Total (Overall) | 116 (45.0%) | 142 (55.0%) |
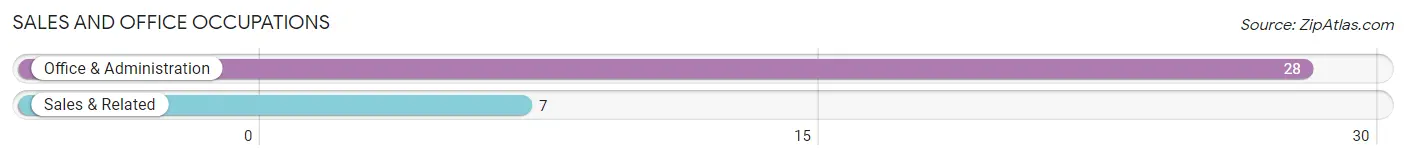
Sales and Office Occupations
The most common Sales and Office occupations in Wellington are Office & Administration (28 | 10.8%), and Sales & Related (7 | 2.7%).
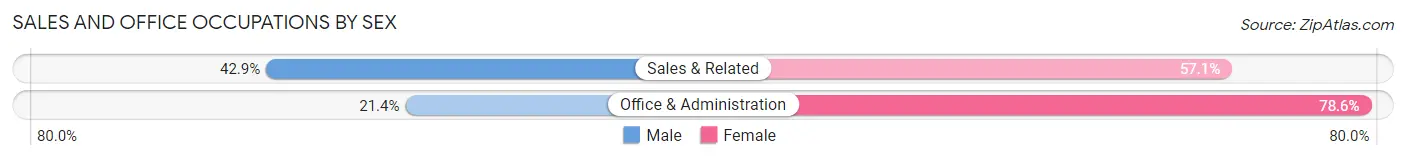
Sales and Office Occupations by Sex
| Occupation | Male | Female |
| Sales & Related | 3 (42.9%) | 4 (57.1%) |
| Office & Administration | 6 (21.4%) | 22 (78.6%) |
| Total (Category) | 9 (25.7%) | 26 (74.3%) |
| Total (Overall) | 116 (45.0%) | 142 (55.0%) |
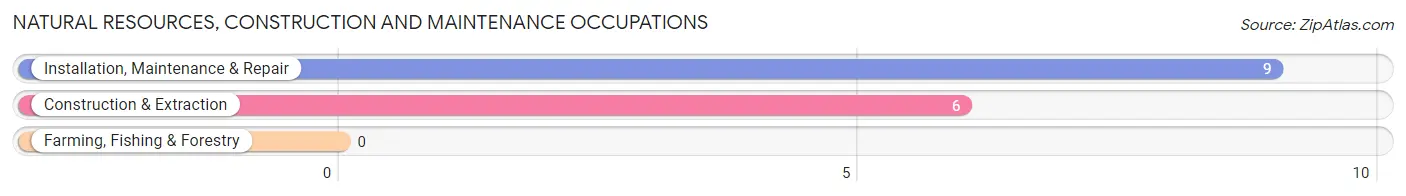
Natural Resources, Construction and Maintenance Occupations
The most common Natural Resources, Construction and Maintenance occupations in Wellington are Installation, Maintenance & Repair (9 | 3.5%), and Construction & Extraction (6 | 2.3%).
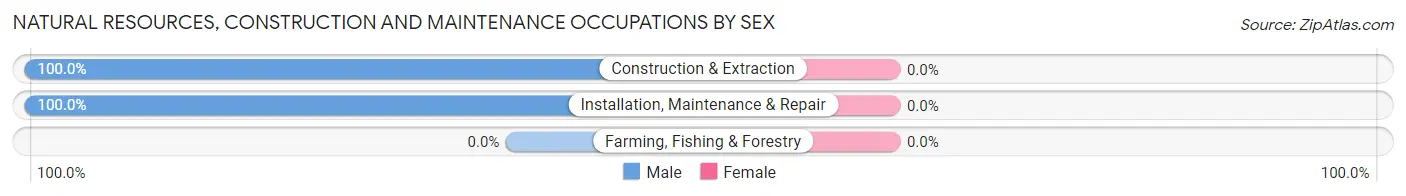
Natural Resources, Construction and Maintenance Occupations by Sex
| Occupation | Male | Female |
| Farming, Fishing & Forestry | 0 (0.0%) | 0 (0.0%) |
| Construction & Extraction | 6 (100.0%) | 0 (0.0%) |
| Installation, Maintenance & Repair | 9 (100.0%) | 0 (0.0%) |
| Total (Category) | 15 (100.0%) | 0 (0.0%) |
| Total (Overall) | 116 (45.0%) | 142 (55.0%) |
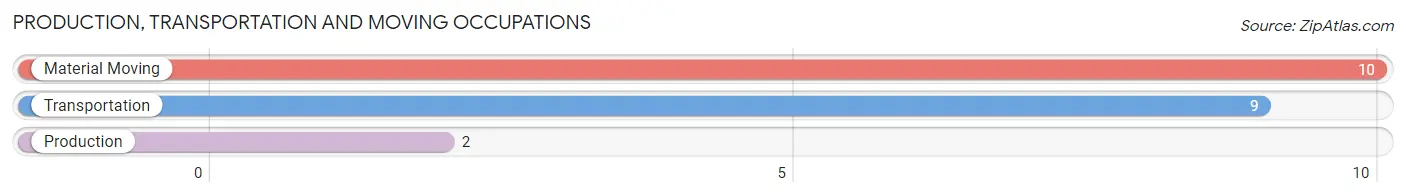
Production, Transportation and Moving Occupations
The most common Production, Transportation and Moving occupations in Wellington are Material Moving (10 | 3.9%), Transportation (9 | 3.5%), and Production (2 | 0.8%).
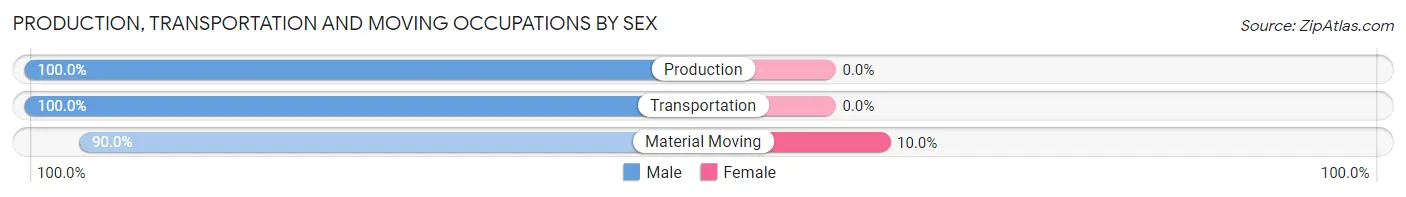
Production, Transportation and Moving Occupations by Sex
| Occupation | Male | Female |
| Production | 2 (100.0%) | 0 (0.0%) |
| Transportation | 9 (100.0%) | 0 (0.0%) |
| Material Moving | 9 (90.0%) | 1 (10.0%) |
| Total (Category) | 20 (95.2%) | 1 (4.8%) |
| Total (Overall) | 116 (45.0%) | 142 (55.0%) |
Employment Industries by Sex in Wellington
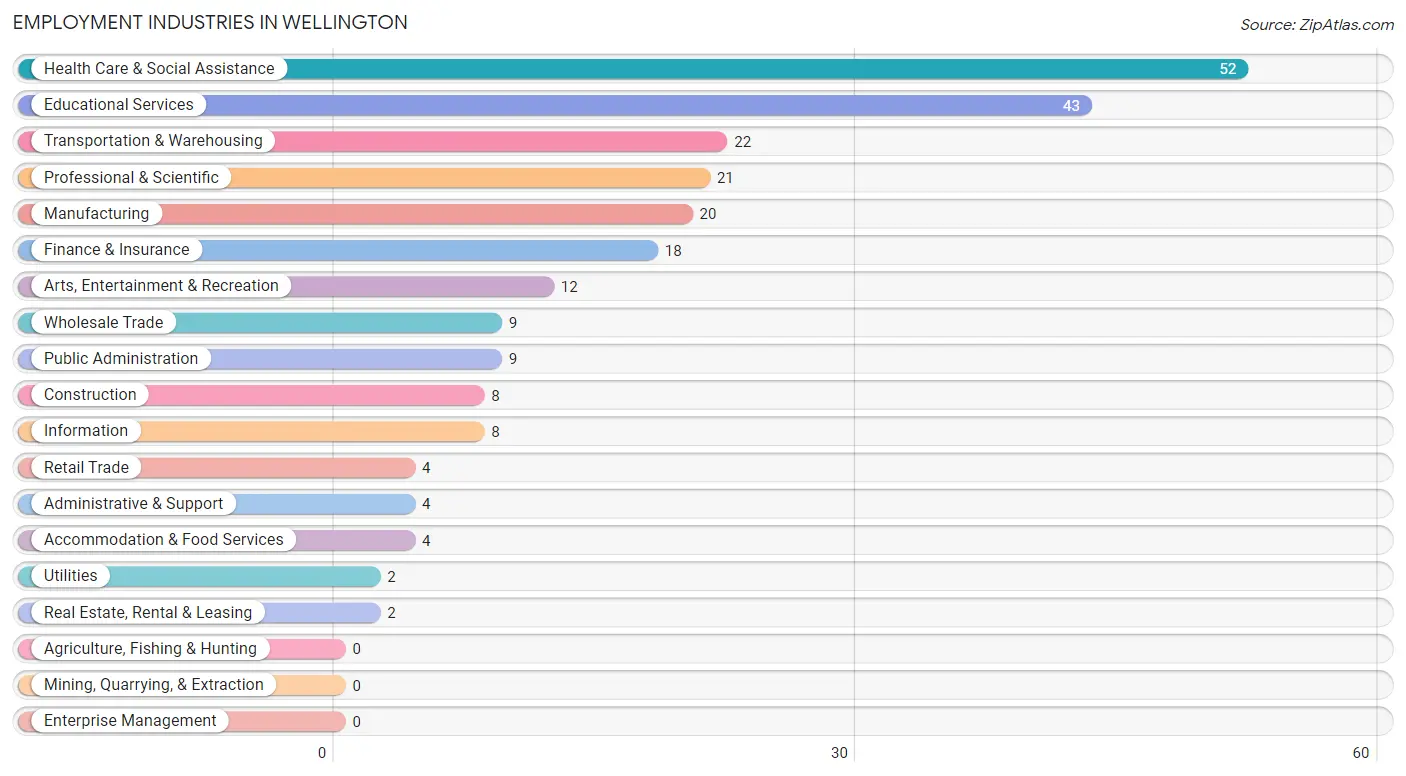
Employment Industries in Wellington
The major employment industries in Wellington include Health Care & Social Assistance (52 | 20.2%), Educational Services (43 | 16.7%), Transportation & Warehousing (22 | 8.5%), Professional & Scientific (21 | 8.1%), and Manufacturing (20 | 7.7%).
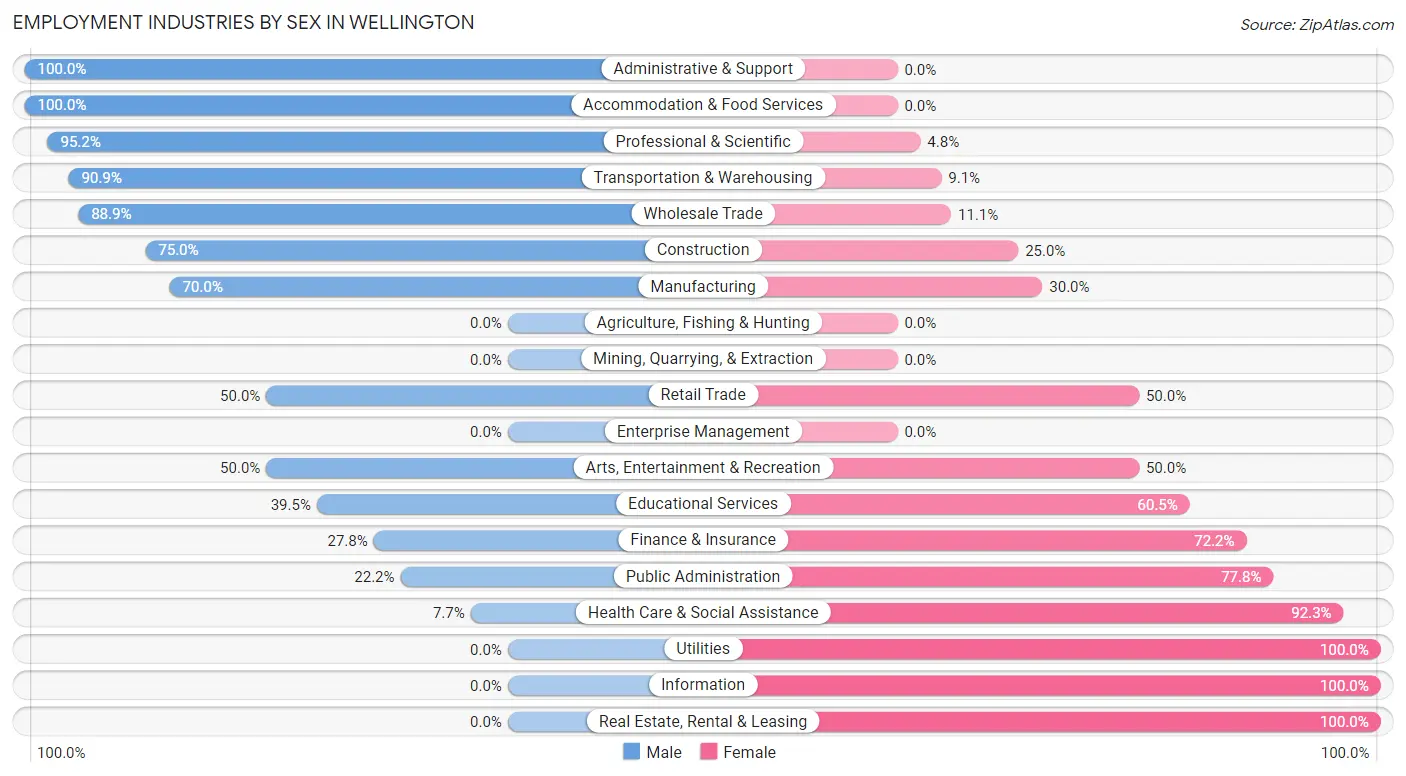
Employment Industries by Sex in Wellington
The Wellington industries that see more men than women are Administrative & Support (100.0%), Accommodation & Food Services (100.0%), and Professional & Scientific (95.2%), whereas the industries that tend to have a higher number of women are Utilities (100.0%), Information (100.0%), and Real Estate, Rental & Leasing (100.0%).
| Industry | Male | Female |
| Agriculture, Fishing & Hunting | 0 (0.0%) | 0 (0.0%) |
| Mining, Quarrying, & Extraction | 0 (0.0%) | 0 (0.0%) |
| Construction | 6 (75.0%) | 2 (25.0%) |
| Manufacturing | 14 (70.0%) | 6 (30.0%) |
| Wholesale Trade | 8 (88.9%) | 1 (11.1%) |
| Retail Trade | 2 (50.0%) | 2 (50.0%) |
| Transportation & Warehousing | 20 (90.9%) | 2 (9.1%) |
| Utilities | 0 (0.0%) | 2 (100.0%) |
| Information | 0 (0.0%) | 8 (100.0%) |
| Finance & Insurance | 5 (27.8%) | 13 (72.2%) |
| Real Estate, Rental & Leasing | 0 (0.0%) | 2 (100.0%) |
| Professional & Scientific | 20 (95.2%) | 1 (4.8%) |
| Enterprise Management | 0 (0.0%) | 0 (0.0%) |
| Administrative & Support | 4 (100.0%) | 0 (0.0%) |
| Educational Services | 17 (39.5%) | 26 (60.5%) |
| Health Care & Social Assistance | 4 (7.7%) | 48 (92.3%) |
| Arts, Entertainment & Recreation | 6 (50.0%) | 6 (50.0%) |
| Accommodation & Food Services | 4 (100.0%) | 0 (0.0%) |
| Public Administration | 2 (22.2%) | 7 (77.8%) |
| Total | 116 (45.0%) | 142 (55.0%) |
Education in Wellington
School Enrollment in Wellington
The most common levels of schooling among the 92 students in Wellington are high school (21 | 22.8%), college / undergraduate (21 | 22.8%), and middle school (20 | 21.7%).
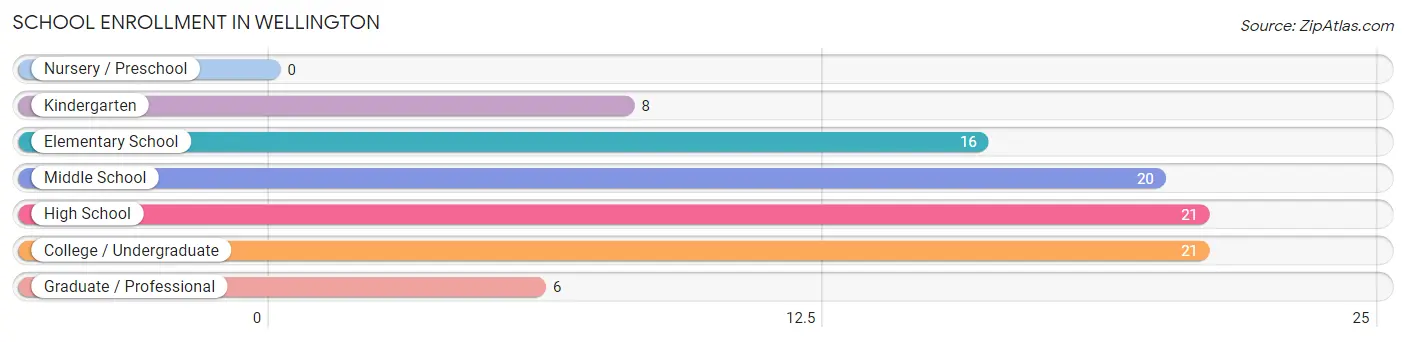
| School Level | # Students | % Students |
| Nursery / Preschool | 0 | 0.0% |
| Kindergarten | 8 | 8.7% |
| Elementary School | 16 | 17.4% |
| Middle School | 20 | 21.7% |
| High School | 21 | 22.8% |
| College / Undergraduate | 21 | 22.8% |
| Graduate / Professional | 6 | 6.5% |
| Total | 92 | 100.0% |
School Enrollment by Age by Funding Source in Wellington
Out of a total of 92 students who are enrolled in schools in Wellington, 32 (34.8%) attend a private institution, while the remaining 60 (65.2%) are enrolled in public schools. The age group of 20 to 24 year olds has the highest likelihood of being enrolled in private schools, with 9 (100.0% in the age bracket) enrolled. Conversely, the age group of 25 to 34 year olds has the lowest likelihood of being enrolled in a private school, with 3 (100.0% in the age bracket) attending a public institution.
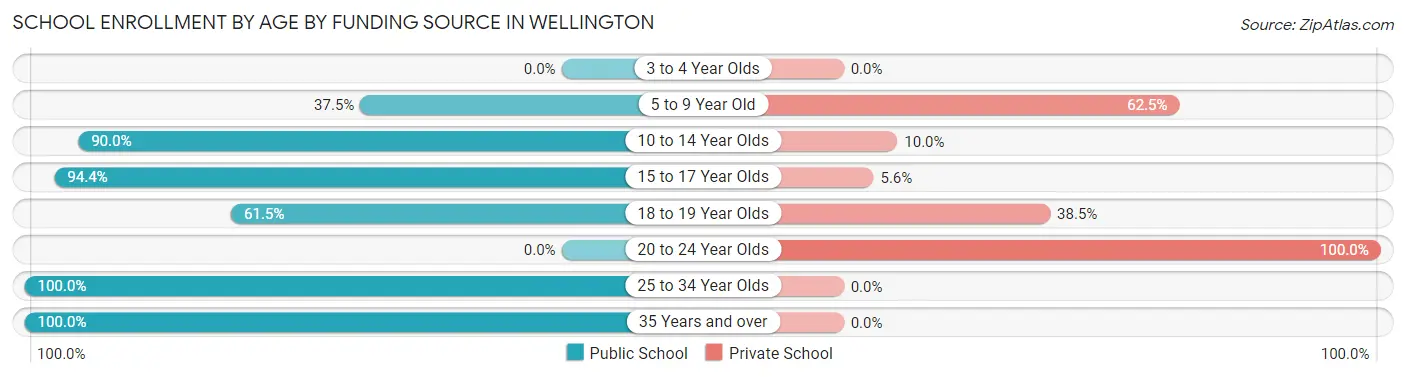
| Age Bracket | Public School | Private School |
| 3 to 4 Year Olds | 0 (0.0%) | 0 (0.0%) |
| 5 to 9 Year Old | 9 (37.5%) | 15 (62.5%) |
| 10 to 14 Year Olds | 18 (90.0%) | 2 (10.0%) |
| 15 to 17 Year Olds | 17 (94.4%) | 1 (5.6%) |
| 18 to 19 Year Olds | 8 (61.5%) | 5 (38.5%) |
| 20 to 24 Year Olds | 0 (0.0%) | 9 (100.0%) |
| 25 to 34 Year Olds | 3 (100.0%) | 0 (0.0%) |
| 35 Years and over | 5 (100.0%) | 0 (0.0%) |
| Total | 60 (65.2%) | 32 (34.8%) |
Educational Attainment by Field of Study in Wellington
Business (35 | 14.1%), social sciences (30 | 12.1%), communications (26 | 10.5%), literature & languages (20 | 8.1%), and liberal arts & history (20 | 8.1%) are the most common fields of study among 248 individuals in Wellington who have obtained a bachelor's degree or higher.
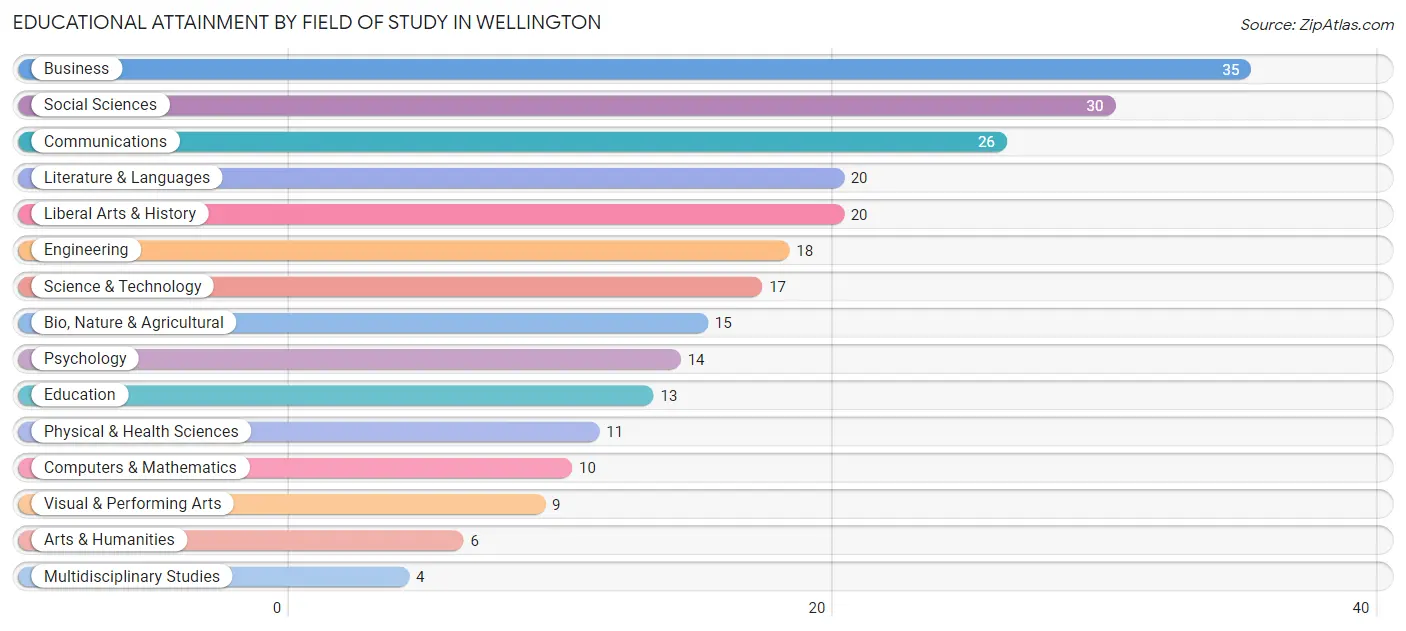
| Field of Study | # Graduates | % Graduates |
| Computers & Mathematics | 10 | 4.0% |
| Bio, Nature & Agricultural | 15 | 6.0% |
| Physical & Health Sciences | 11 | 4.4% |
| Psychology | 14 | 5.7% |
| Social Sciences | 30 | 12.1% |
| Engineering | 18 | 7.3% |
| Multidisciplinary Studies | 4 | 1.6% |
| Science & Technology | 17 | 6.9% |
| Business | 35 | 14.1% |
| Education | 13 | 5.2% |
| Literature & Languages | 20 | 8.1% |
| Liberal Arts & History | 20 | 8.1% |
| Visual & Performing Arts | 9 | 3.6% |
| Communications | 26 | 10.5% |
| Arts & Humanities | 6 | 2.4% |
| Total | 248 | 100.0% |
Transportation & Commute in Wellington
Vehicle Availability by Sex in Wellington
The most prevalent vehicle ownership categories in Wellington are males with 2 vehicles (72, accounting for 63.7%) and females with 2 vehicles (81, making up 51.4%).
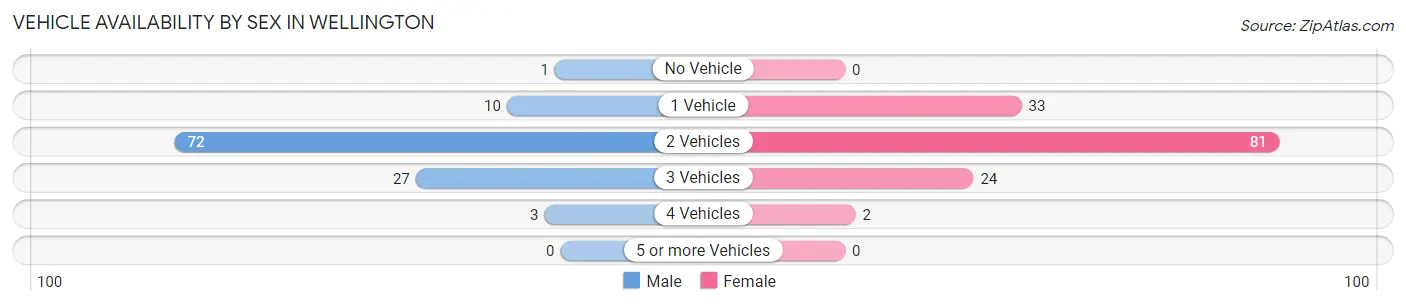
| Vehicles Available | Male | Female |
| No Vehicle | 1 (0.9%) | 0 (0.0%) |
| 1 Vehicle | 10 (8.8%) | 33 (23.6%) |
| 2 Vehicles | 72 (63.7%) | 81 (57.9%) |
| 3 Vehicles | 27 (23.9%) | 24 (17.1%) |
| 4 Vehicles | 3 (2.6%) | 2 (1.4%) |
| 5 or more Vehicles | 0 (0.0%) | 0 (0.0%) |
| Total | 113 (100.0%) | 140 (100.0%) |
Commute Time in Wellington
The most frequently occuring commute durations in Wellington are 15 to 19 minutes (64 commuters, 31.5%), 10 to 14 minutes (59 commuters, 29.1%), and 20 to 24 minutes (47 commuters, 23.2%).
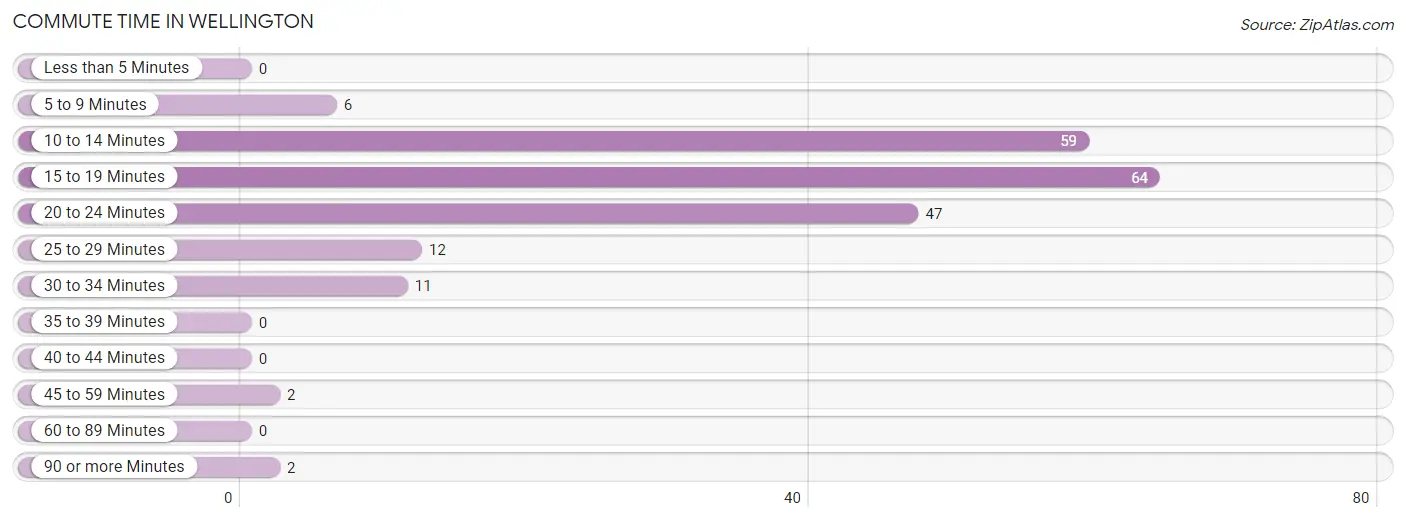
| Commute Time | # Commuters | % Commuters |
| Less than 5 Minutes | 0 | 0.0% |
| 5 to 9 Minutes | 6 | 3.0% |
| 10 to 14 Minutes | 59 | 29.1% |
| 15 to 19 Minutes | 64 | 31.5% |
| 20 to 24 Minutes | 47 | 23.2% |
| 25 to 29 Minutes | 12 | 5.9% |
| 30 to 34 Minutes | 11 | 5.4% |
| 35 to 39 Minutes | 0 | 0.0% |
| 40 to 44 Minutes | 0 | 0.0% |
| 45 to 59 Minutes | 2 | 1.0% |
| 60 to 89 Minutes | 0 | 0.0% |
| 90 or more Minutes | 2 | 1.0% |
Commute Time by Sex in Wellington
The most common commute times in Wellington are 15 to 19 minutes (30 commuters, 30.9%) for males and 10 to 14 minutes (37 commuters, 34.9%) for females.
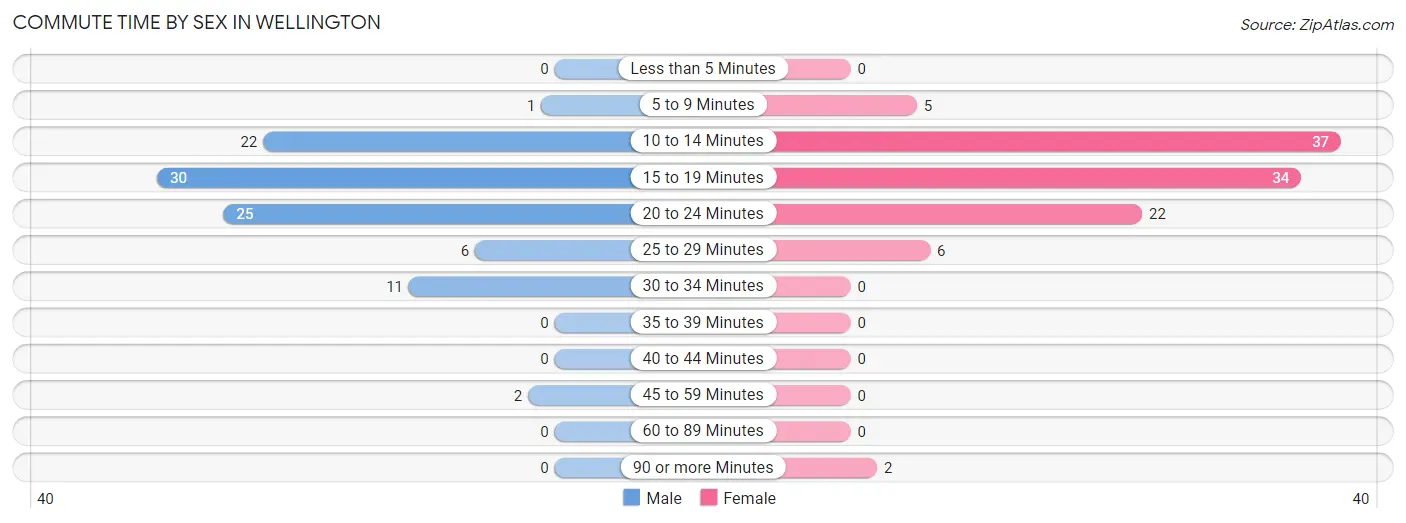
| Commute Time | Male | Female |
| Less than 5 Minutes | 0 (0.0%) | 0 (0.0%) |
| 5 to 9 Minutes | 1 (1.0%) | 5 (4.7%) |
| 10 to 14 Minutes | 22 (22.7%) | 37 (34.9%) |
| 15 to 19 Minutes | 30 (30.9%) | 34 (32.1%) |
| 20 to 24 Minutes | 25 (25.8%) | 22 (20.7%) |
| 25 to 29 Minutes | 6 (6.2%) | 6 (5.7%) |
| 30 to 34 Minutes | 11 (11.3%) | 0 (0.0%) |
| 35 to 39 Minutes | 0 (0.0%) | 0 (0.0%) |
| 40 to 44 Minutes | 0 (0.0%) | 0 (0.0%) |
| 45 to 59 Minutes | 2 (2.1%) | 0 (0.0%) |
| 60 to 89 Minutes | 0 (0.0%) | 0 (0.0%) |
| 90 or more Minutes | 0 (0.0%) | 2 (1.9%) |
Time of Departure to Work by Sex in Wellington
The most frequent times of departure to work in Wellington are 7:00 AM to 7:29 AM (31, 32.0%) for males and 8:30 AM to 8:59 AM (29, 27.4%) for females.
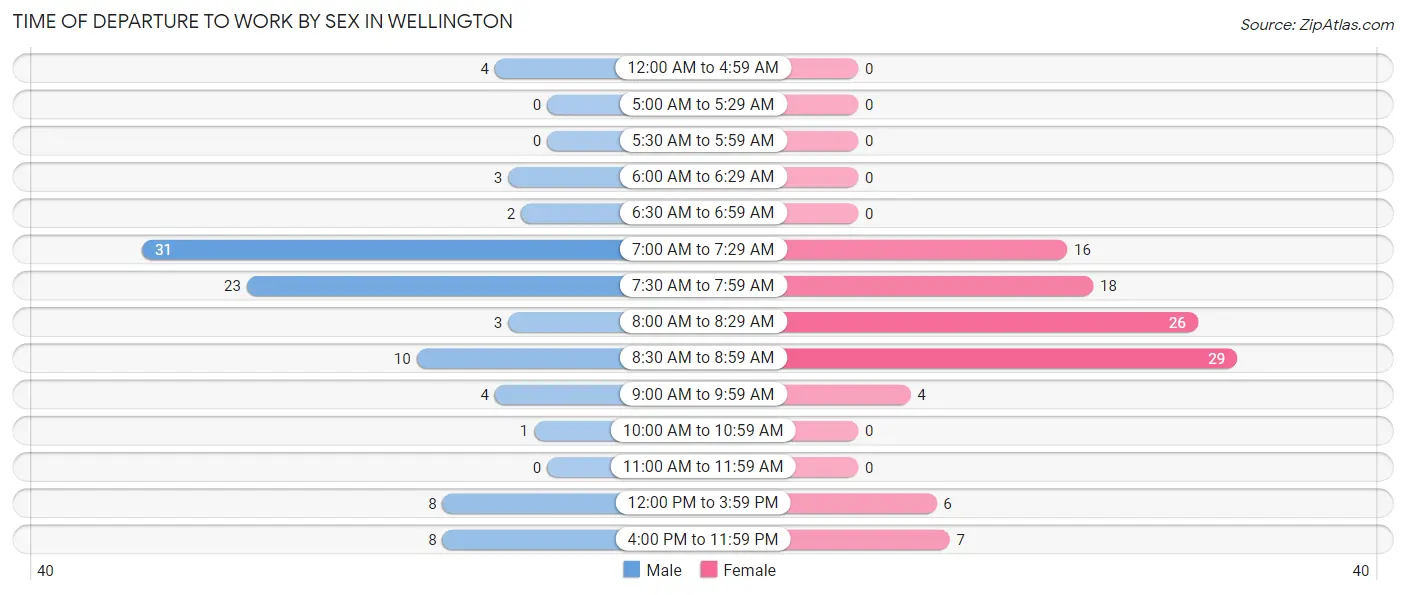
| Time of Departure | Male | Female |
| 12:00 AM to 4:59 AM | 4 (4.1%) | 0 (0.0%) |
| 5:00 AM to 5:29 AM | 0 (0.0%) | 0 (0.0%) |
| 5:30 AM to 5:59 AM | 0 (0.0%) | 0 (0.0%) |
| 6:00 AM to 6:29 AM | 3 (3.1%) | 0 (0.0%) |
| 6:30 AM to 6:59 AM | 2 (2.1%) | 0 (0.0%) |
| 7:00 AM to 7:29 AM | 31 (32.0%) | 16 (15.1%) |
| 7:30 AM to 7:59 AM | 23 (23.7%) | 18 (17.0%) |
| 8:00 AM to 8:29 AM | 3 (3.1%) | 26 (24.5%) |
| 8:30 AM to 8:59 AM | 10 (10.3%) | 29 (27.4%) |
| 9:00 AM to 9:59 AM | 4 (4.1%) | 4 (3.8%) |
| 10:00 AM to 10:59 AM | 1 (1.0%) | 0 (0.0%) |
| 11:00 AM to 11:59 AM | 0 (0.0%) | 0 (0.0%) |
| 12:00 PM to 3:59 PM | 8 (8.3%) | 6 (5.7%) |
| 4:00 PM to 11:59 PM | 8 (8.3%) | 7 (6.6%) |
| Total | 97 (100.0%) | 106 (100.0%) |
Housing Occupancy in Wellington
Occupancy by Ownership in Wellington
Of the total 228 dwellings in Wellington, owner-occupied units account for 202 (88.6%), while renter-occupied units make up 26 (11.4%).
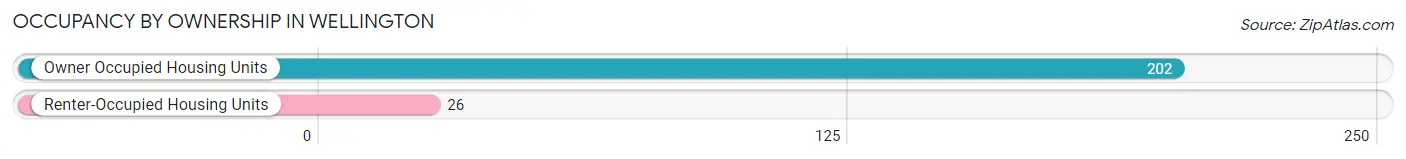
| Occupancy | # Housing Units | % Housing Units |
| Owner Occupied Housing Units | 202 | 88.6% |
| Renter-Occupied Housing Units | 26 | 11.4% |
| Total Occupied Housing Units | 228 | 100.0% |
Occupancy by Household Size in Wellington
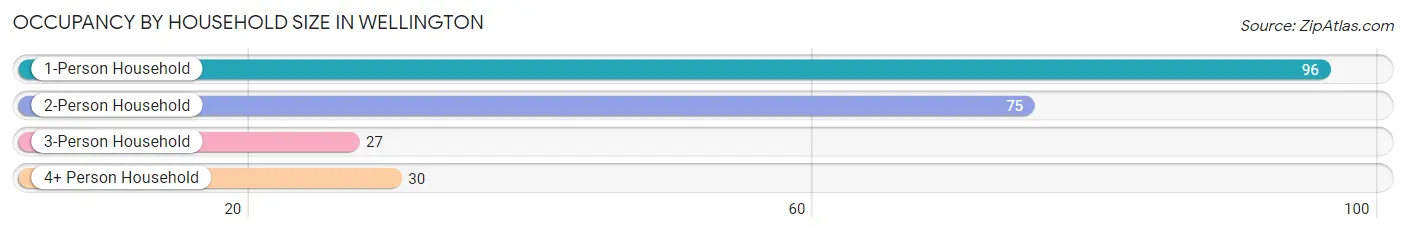
| Household Size | # Housing Units | % Housing Units |
| 1-Person Household | 96 | 42.1% |
| 2-Person Household | 75 | 32.9% |
| 3-Person Household | 27 | 11.8% |
| 4+ Person Household | 30 | 13.2% |
| Total Housing Units | 228 | 100.0% |
Occupancy by Ownership by Household Size in Wellington
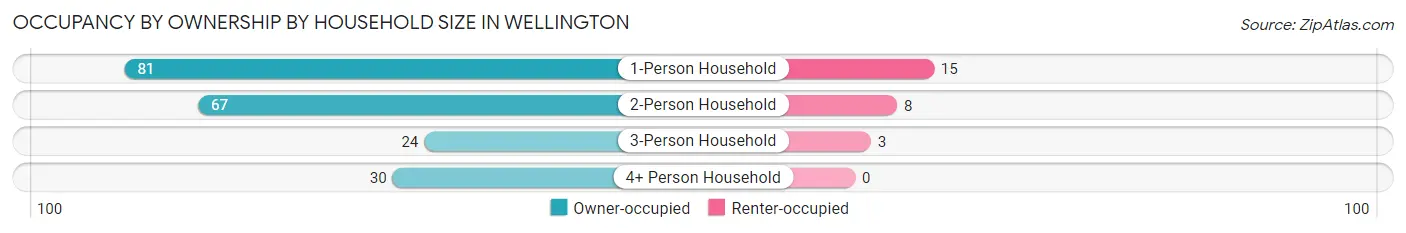
| Household Size | Owner-occupied | Renter-occupied |
| 1-Person Household | 81 (84.4%) | 15 (15.6%) |
| 2-Person Household | 67 (89.3%) | 8 (10.7%) |
| 3-Person Household | 24 (88.9%) | 3 (11.1%) |
| 4+ Person Household | 30 (100.0%) | 0 (0.0%) |
| Total Housing Units | 202 (88.6%) | 26 (11.4%) |
Occupancy by Educational Attainment in Wellington
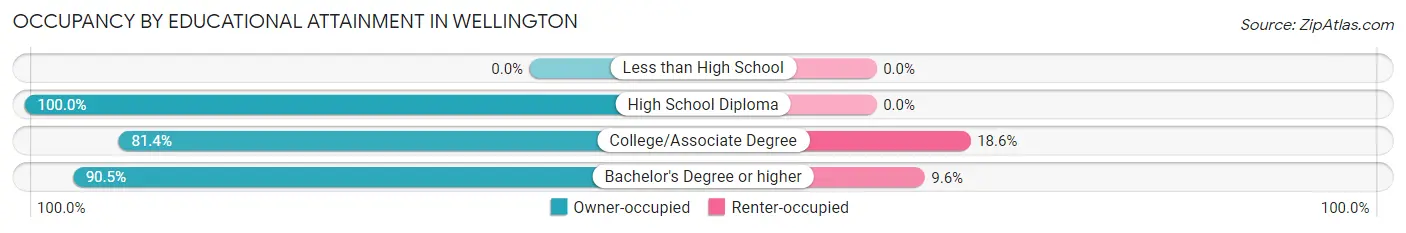
| Household Size | Owner-occupied | Renter-occupied |
| Less than High School | 0 (0.0%) | 0 (0.0%) |
| High School Diploma | 12 (100.0%) | 0 (0.0%) |
| College/Associate Degree | 48 (81.4%) | 11 (18.6%) |
| Bachelor's Degree or higher | 142 (90.4%) | 15 (9.6%) |
Occupancy by Age of Householder in Wellington
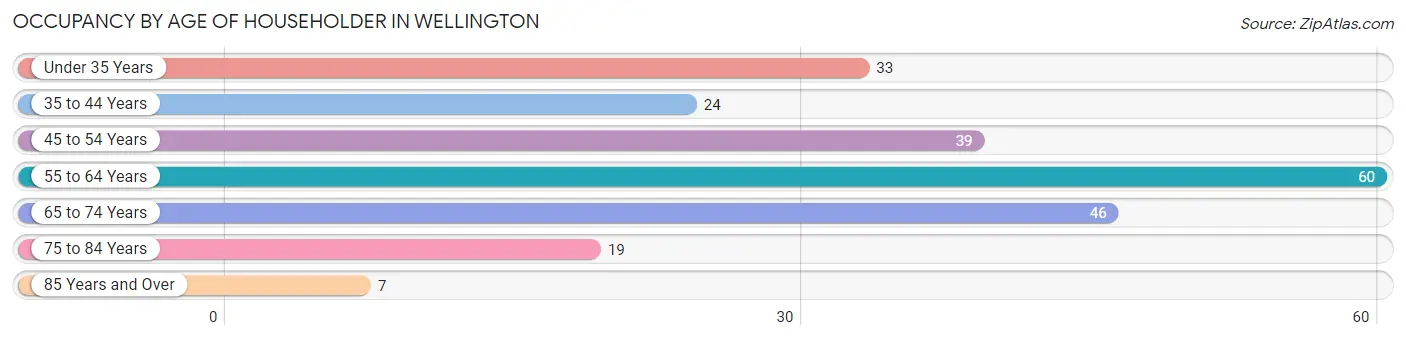
| Age Bracket | # Households | % Households |
| Under 35 Years | 33 | 14.5% |
| 35 to 44 Years | 24 | 10.5% |
| 45 to 54 Years | 39 | 17.1% |
| 55 to 64 Years | 60 | 26.3% |
| 65 to 74 Years | 46 | 20.2% |
| 75 to 84 Years | 19 | 8.3% |
| 85 Years and Over | 7 | 3.1% |
| Total | 228 | 100.0% |
Housing Finances in Wellington
Median Income by Occupancy in Wellington
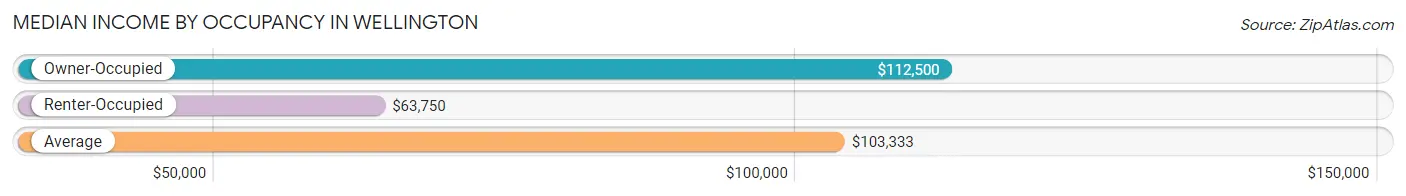
| Occupancy Type | # Households | Median Income |
| Owner-Occupied | 202 (88.6%) | $112,500 |
| Renter-Occupied | 26 (11.4%) | $63,750 |
| Average | 228 (100.0%) | $103,333 |
Occupancy by Householder Income Bracket in Wellington
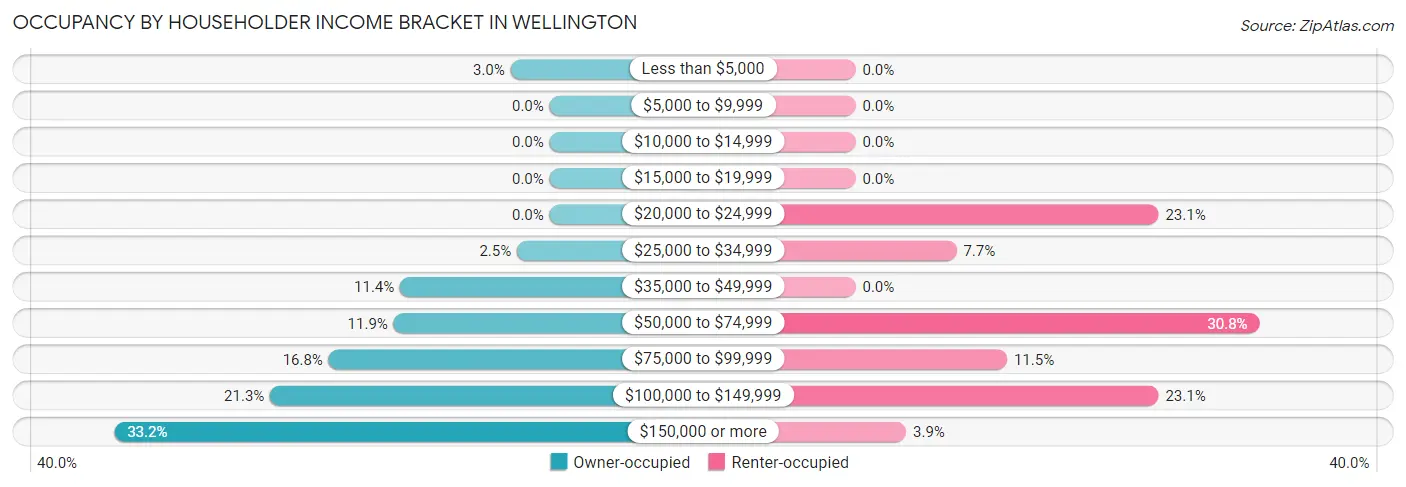
| Income Bracket | Owner-occupied | Renter-occupied |
| Less than $5,000 | 6 (3.0%) | 0 (0.0%) |
| $5,000 to $9,999 | 0 (0.0%) | 0 (0.0%) |
| $10,000 to $14,999 | 0 (0.0%) | 0 (0.0%) |
| $15,000 to $19,999 | 0 (0.0%) | 0 (0.0%) |
| $20,000 to $24,999 | 0 (0.0%) | 6 (23.1%) |
| $25,000 to $34,999 | 5 (2.5%) | 2 (7.7%) |
| $35,000 to $49,999 | 23 (11.4%) | 0 (0.0%) |
| $50,000 to $74,999 | 24 (11.9%) | 8 (30.8%) |
| $75,000 to $99,999 | 34 (16.8%) | 3 (11.5%) |
| $100,000 to $149,999 | 43 (21.3%) | 6 (23.1%) |
| $150,000 or more | 67 (33.2%) | 1 (3.8%) |
| Total | 202 (100.0%) | 26 (100.0%) |
Monthly Housing Cost Tiers in Wellington
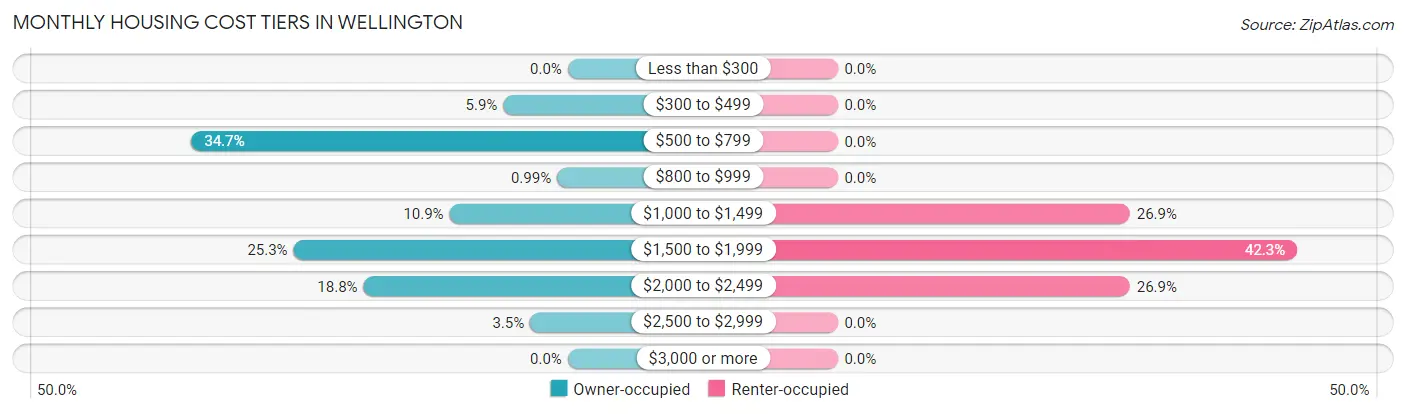
| Monthly Cost | Owner-occupied | Renter-occupied |
| Less than $300 | 0 (0.0%) | 0 (0.0%) |
| $300 to $499 | 12 (5.9%) | 0 (0.0%) |
| $500 to $799 | 70 (34.6%) | 0 (0.0%) |
| $800 to $999 | 2 (1.0%) | 0 (0.0%) |
| $1,000 to $1,499 | 22 (10.9%) | 7 (26.9%) |
| $1,500 to $1,999 | 51 (25.3%) | 11 (42.3%) |
| $2,000 to $2,499 | 38 (18.8%) | 7 (26.9%) |
| $2,500 to $2,999 | 7 (3.5%) | 0 (0.0%) |
| $3,000 or more | 0 (0.0%) | 0 (0.0%) |
| Total | 202 (100.0%) | 26 (100.0%) |
Physical Housing Characteristics in Wellington
Housing Structures in Wellington
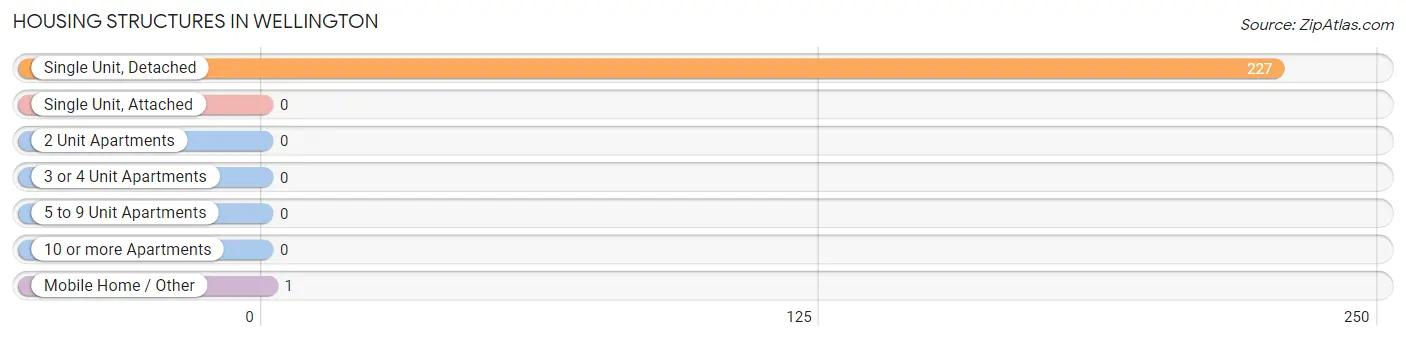
| Structure Type | # Housing Units | % Housing Units |
| Single Unit, Detached | 227 | 99.6% |
| Single Unit, Attached | 0 | 0.0% |
| 2 Unit Apartments | 0 | 0.0% |
| 3 or 4 Unit Apartments | 0 | 0.0% |
| 5 to 9 Unit Apartments | 0 | 0.0% |
| 10 or more Apartments | 0 | 0.0% |
| Mobile Home / Other | 1 | 0.4% |
| Total | 228 | 100.0% |
Housing Structures by Occupancy in Wellington
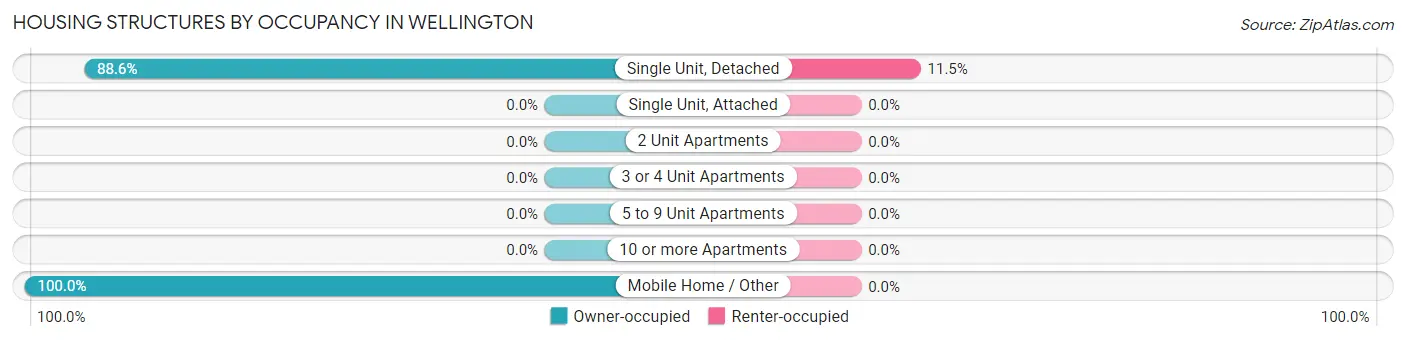
| Structure Type | Owner-occupied | Renter-occupied |
| Single Unit, Detached | 201 (88.5%) | 26 (11.5%) |
| Single Unit, Attached | 0 (0.0%) | 0 (0.0%) |
| 2 Unit Apartments | 0 (0.0%) | 0 (0.0%) |
| 3 or 4 Unit Apartments | 0 (0.0%) | 0 (0.0%) |
| 5 to 9 Unit Apartments | 0 (0.0%) | 0 (0.0%) |
| 10 or more Apartments | 0 (0.0%) | 0 (0.0%) |
| Mobile Home / Other | 1 (100.0%) | 0 (0.0%) |
| Total | 202 (88.6%) | 26 (11.4%) |
Housing Structures by Number of Rooms in Wellington
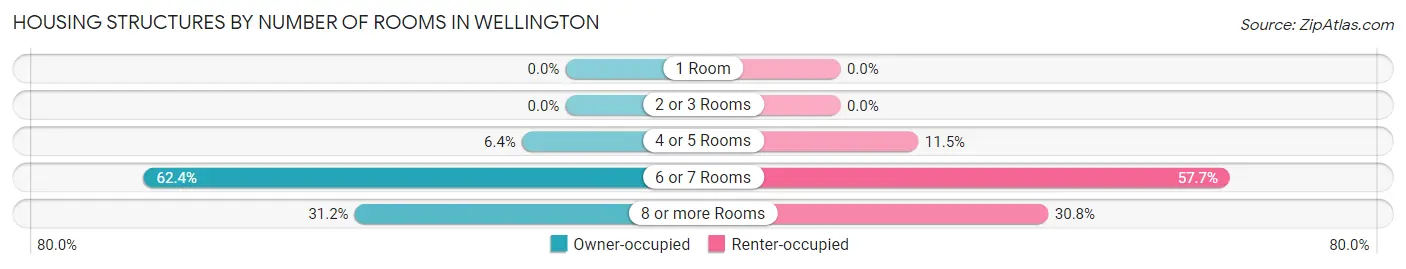
| Number of Rooms | Owner-occupied | Renter-occupied |
| 1 Room | 0 (0.0%) | 0 (0.0%) |
| 2 or 3 Rooms | 0 (0.0%) | 0 (0.0%) |
| 4 or 5 Rooms | 13 (6.4%) | 3 (11.5%) |
| 6 or 7 Rooms | 126 (62.4%) | 15 (57.7%) |
| 8 or more Rooms | 63 (31.2%) | 8 (30.8%) |
| Total | 202 (100.0%) | 26 (100.0%) |
Housing Structure by Heating Type in Wellington
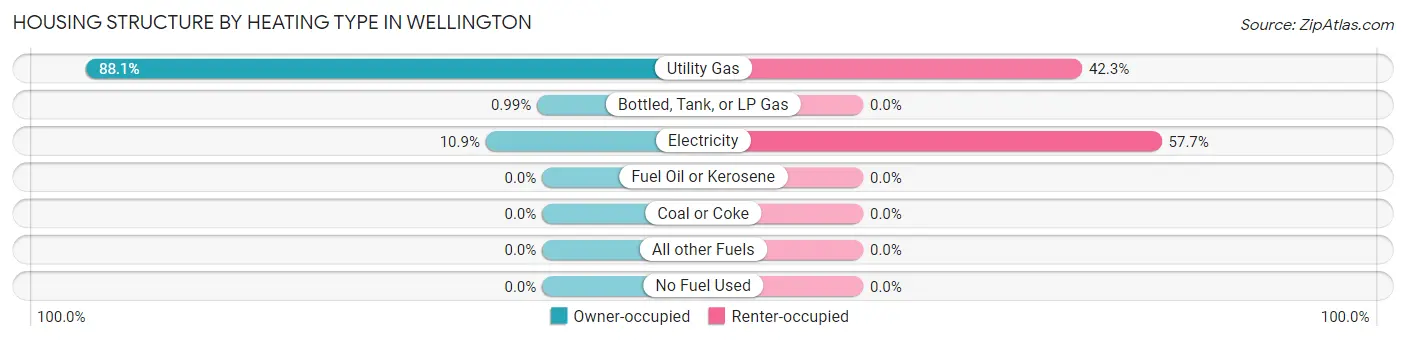
| Heating Type | Owner-occupied | Renter-occupied |
| Utility Gas | 178 (88.1%) | 11 (42.3%) |
| Bottled, Tank, or LP Gas | 2 (1.0%) | 0 (0.0%) |
| Electricity | 22 (10.9%) | 15 (57.7%) |
| Fuel Oil or Kerosene | 0 (0.0%) | 0 (0.0%) |
| Coal or Coke | 0 (0.0%) | 0 (0.0%) |
| All other Fuels | 0 (0.0%) | 0 (0.0%) |
| No Fuel Used | 0 (0.0%) | 0 (0.0%) |
| Total | 202 (100.0%) | 26 (100.0%) |
Household Vehicle Usage in Wellington
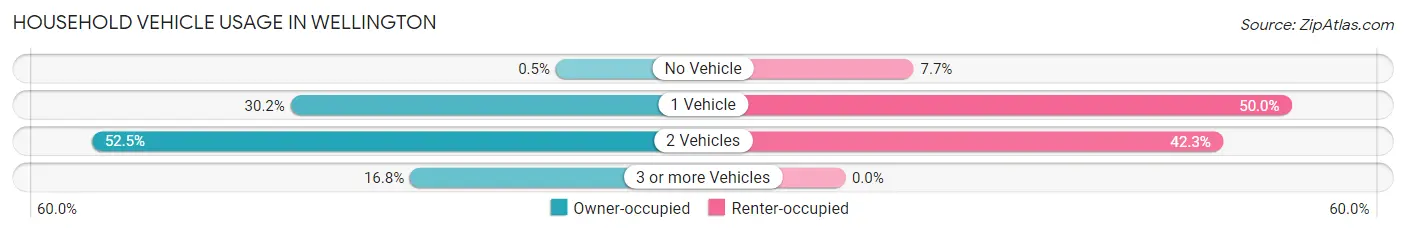
| Vehicles per Household | Owner-occupied | Renter-occupied |
| No Vehicle | 1 (0.5%) | 2 (7.7%) |
| 1 Vehicle | 61 (30.2%) | 13 (50.0%) |
| 2 Vehicles | 106 (52.5%) | 11 (42.3%) |
| 3 or more Vehicles | 34 (16.8%) | 0 (0.0%) |
| Total | 202 (100.0%) | 26 (100.0%) |
Real Estate & Mortgages in Wellington
Real Estate and Mortgage Overview in Wellington
| Characteristic | Without Mortgage | With Mortgage |
| Housing Units | 74 | 128 |
| Median Property Value | $279,700 | $314,300 |
| Median Household Income | $80,000 | $44 |
| Monthly Housing Costs | $630 | $0 |
| Real Estate Taxes | $2,461 | $4 |
Property Value by Mortgage Status in Wellington
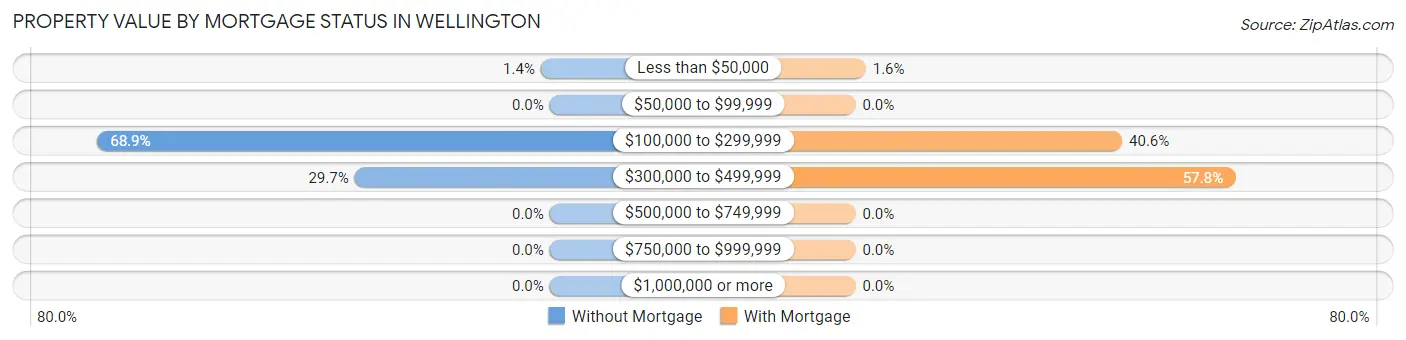
| Property Value | Without Mortgage | With Mortgage |
| Less than $50,000 | 1 (1.3%) | 2 (1.6%) |
| $50,000 to $99,999 | 0 (0.0%) | 0 (0.0%) |
| $100,000 to $299,999 | 51 (68.9%) | 52 (40.6%) |
| $300,000 to $499,999 | 22 (29.7%) | 74 (57.8%) |
| $500,000 to $749,999 | 0 (0.0%) | 0 (0.0%) |
| $750,000 to $999,999 | 0 (0.0%) | 0 (0.0%) |
| $1,000,000 or more | 0 (0.0%) | 0 (0.0%) |
| Total | 74 (100.0%) | 128 (100.0%) |
Household Income by Mortgage Status in Wellington
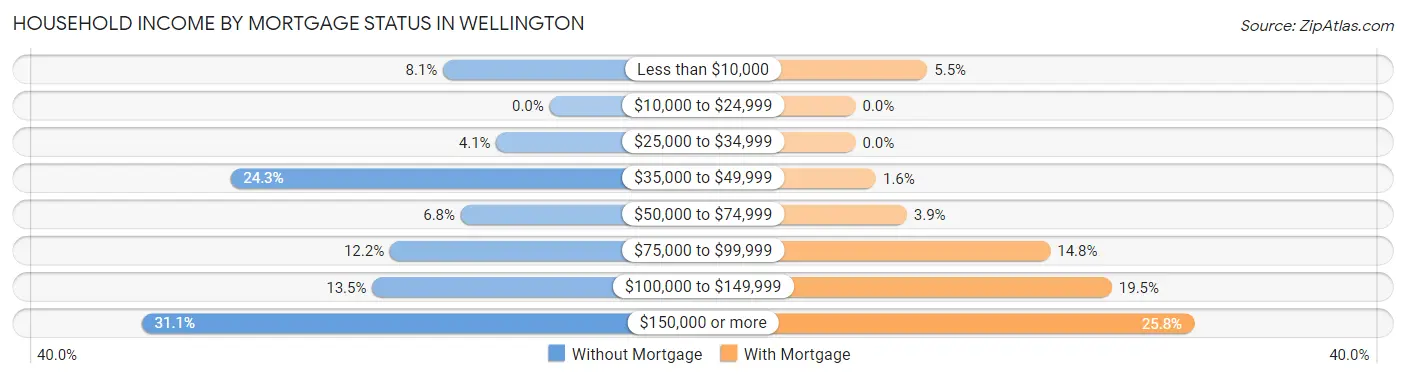
| Household Income | Without Mortgage | With Mortgage |
| Less than $10,000 | 6 (8.1%) | 7 (5.5%) |
| $10,000 to $24,999 | 0 (0.0%) | 0 (0.0%) |
| $25,000 to $34,999 | 3 (4.1%) | 0 (0.0%) |
| $35,000 to $49,999 | 18 (24.3%) | 2 (1.6%) |
| $50,000 to $74,999 | 5 (6.8%) | 5 (3.9%) |
| $75,000 to $99,999 | 9 (12.2%) | 19 (14.8%) |
| $100,000 to $149,999 | 10 (13.5%) | 25 (19.5%) |
| $150,000 or more | 23 (31.1%) | 33 (25.8%) |
| Total | 74 (100.0%) | 128 (100.0%) |
Property Value to Household Income Ratio in Wellington
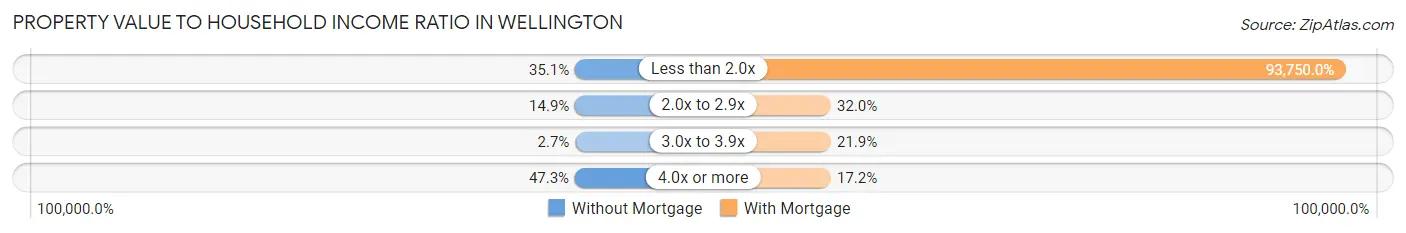
| Value-to-Income Ratio | Without Mortgage | With Mortgage |
| Less than 2.0x | 26 (35.1%) | 120,000 (93,750.0%) |
| 2.0x to 2.9x | 11 (14.9%) | 41 (32.0%) |
| 3.0x to 3.9x | 2 (2.7%) | 28 (21.9%) |
| 4.0x or more | 35 (47.3%) | 22 (17.2%) |
| Total | 74 (100.0%) | 128 (100.0%) |
Real Estate Taxes by Mortgage Status in Wellington
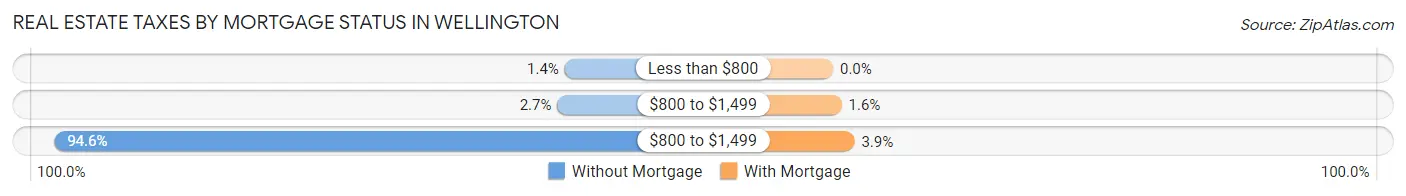
| Property Taxes | Without Mortgage | With Mortgage |
| Less than $800 | 1 (1.3%) | 0 (0.0%) |
| $800 to $1,499 | 2 (2.7%) | 2 (1.6%) |
| $800 to $1,499 | 70 (94.6%) | 5 (3.9%) |
| Total | 74 (100.0%) | 128 (100.0%) |
Health & Disability in Wellington
Health Insurance Coverage by Age in Wellington
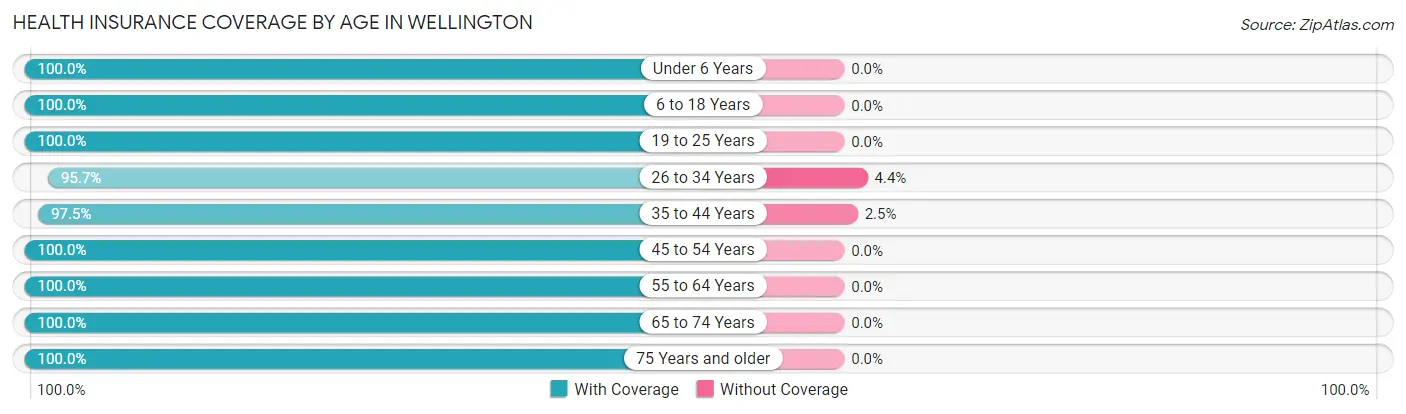
| Age Bracket | With Coverage | Without Coverage |
| Under 6 Years | 18 (100.0%) | 0 (0.0%) |
| 6 to 18 Years | 70 (100.0%) | 0 (0.0%) |
| 19 to 25 Years | 31 (100.0%) | 0 (0.0%) |
| 26 to 34 Years | 44 (95.7%) | 2 (4.3%) |
| 35 to 44 Years | 39 (97.5%) | 1 (2.5%) |
| 45 to 54 Years | 65 (100.0%) | 0 (0.0%) |
| 55 to 64 Years | 82 (100.0%) | 0 (0.0%) |
| 65 to 74 Years | 53 (100.0%) | 0 (0.0%) |
| 75 Years and older | 38 (100.0%) | 0 (0.0%) |
| Total | 440 (99.3%) | 3 (0.7%) |
Health Insurance Coverage by Citizenship Status in Wellington
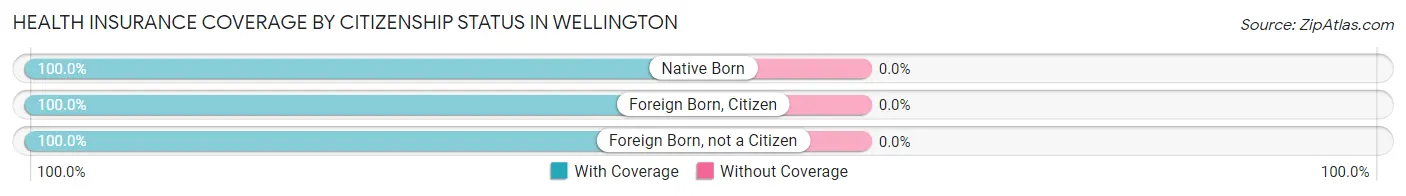
| Citizenship Status | With Coverage | Without Coverage |
| Native Born | 18 (100.0%) | 0 (0.0%) |
| Foreign Born, Citizen | 70 (100.0%) | 0 (0.0%) |
| Foreign Born, not a Citizen | 31 (100.0%) | 0 (0.0%) |
Health Insurance Coverage by Household Income in Wellington
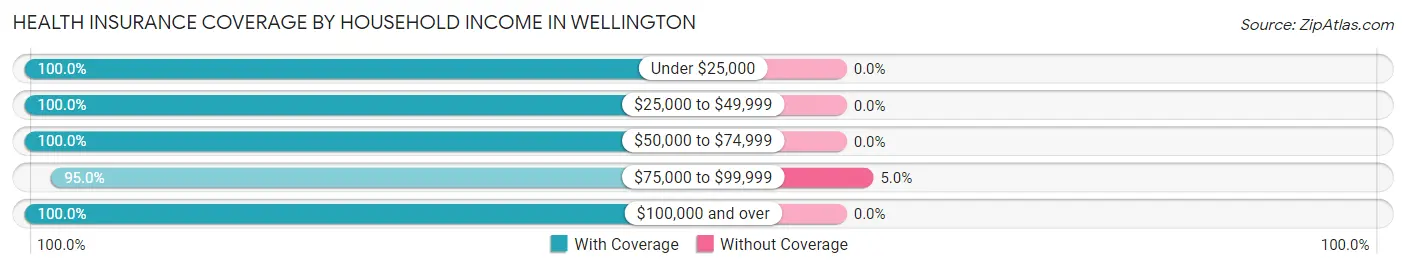
| Household Income | With Coverage | Without Coverage |
| Under $25,000 | 12 (100.0%) | 0 (0.0%) |
| $25,000 to $49,999 | 33 (100.0%) | 0 (0.0%) |
| $50,000 to $74,999 | 42 (100.0%) | 0 (0.0%) |
| $75,000 to $99,999 | 57 (95.0%) | 3 (5.0%) |
| $100,000 and over | 296 (100.0%) | 0 (0.0%) |
Public vs Private Health Insurance Coverage by Age in Wellington
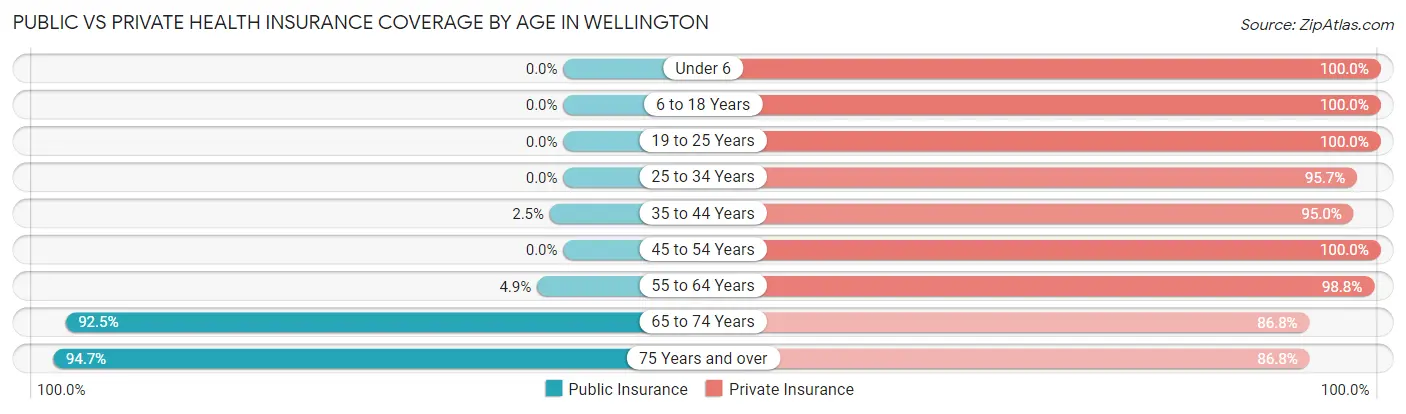
| Age Bracket | Public Insurance | Private Insurance |
| Under 6 | 0 (0.0%) | 18 (100.0%) |
| 6 to 18 Years | 0 (0.0%) | 70 (100.0%) |
| 19 to 25 Years | 0 (0.0%) | 31 (100.0%) |
| 25 to 34 Years | 0 (0.0%) | 44 (95.7%) |
| 35 to 44 Years | 1 (2.5%) | 38 (95.0%) |
| 45 to 54 Years | 0 (0.0%) | 65 (100.0%) |
| 55 to 64 Years | 4 (4.9%) | 81 (98.8%) |
| 65 to 74 Years | 49 (92.4%) | 46 (86.8%) |
| 75 Years and over | 36 (94.7%) | 33 (86.8%) |
| Total | 90 (20.3%) | 426 (96.2%) |
Disability Status by Sex by Age in Wellington
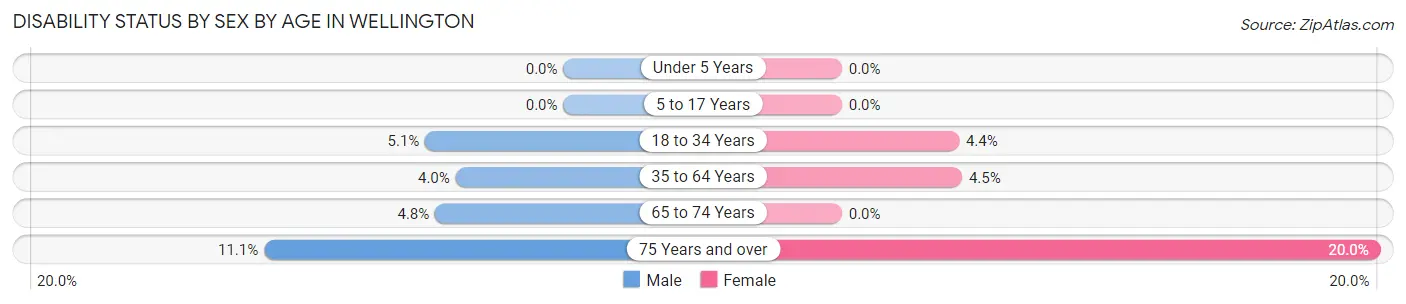
| Age Bracket | Male | Female |
| Under 5 Years | 0 (0.0%) | 0 (0.0%) |
| 5 to 17 Years | 0 (0.0%) | 0 (0.0%) |
| 18 to 34 Years | 2 (5.1%) | 2 (4.3%) |
| 35 to 64 Years | 3 (4.0%) | 5 (4.5%) |
| 65 to 74 Years | 1 (4.8%) | 0 (0.0%) |
| 75 Years and over | 2 (11.1%) | 4 (20.0%) |
Disability Class by Sex by Age in Wellington
Disability Class: Hearing Difficulty
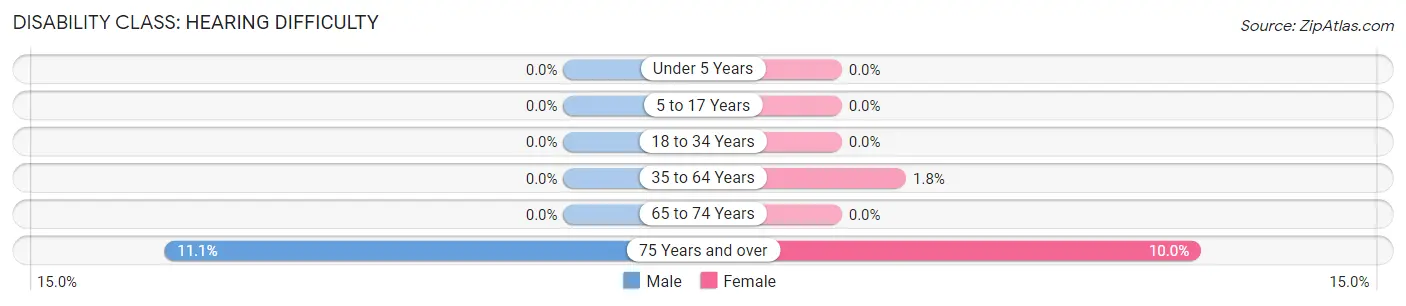
| Age Bracket | Male | Female |
| Under 5 Years | 0 (0.0%) | 0 (0.0%) |
| 5 to 17 Years | 0 (0.0%) | 0 (0.0%) |
| 18 to 34 Years | 0 (0.0%) | 0 (0.0%) |
| 35 to 64 Years | 0 (0.0%) | 2 (1.8%) |
| 65 to 74 Years | 0 (0.0%) | 0 (0.0%) |
| 75 Years and over | 2 (11.1%) | 2 (10.0%) |
Disability Class: Vision Difficulty
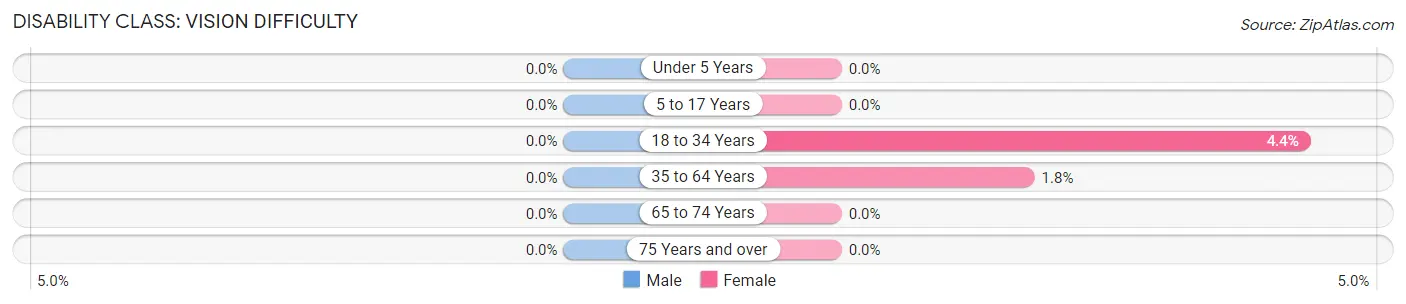
| Age Bracket | Male | Female |
| Under 5 Years | 0 (0.0%) | 0 (0.0%) |
| 5 to 17 Years | 0 (0.0%) | 0 (0.0%) |
| 18 to 34 Years | 0 (0.0%) | 2 (4.3%) |
| 35 to 64 Years | 0 (0.0%) | 2 (1.8%) |
| 65 to 74 Years | 0 (0.0%) | 0 (0.0%) |
| 75 Years and over | 0 (0.0%) | 0 (0.0%) |
Disability Class: Cognitive Difficulty
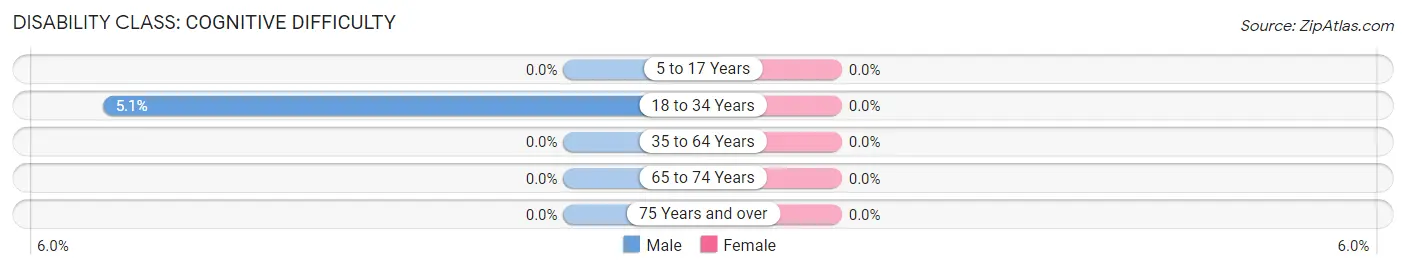
| Age Bracket | Male | Female |
| 5 to 17 Years | 0 (0.0%) | 0 (0.0%) |
| 18 to 34 Years | 2 (5.1%) | 0 (0.0%) |
| 35 to 64 Years | 0 (0.0%) | 0 (0.0%) |
| 65 to 74 Years | 0 (0.0%) | 0 (0.0%) |
| 75 Years and over | 0 (0.0%) | 0 (0.0%) |
Disability Class: Ambulatory Difficulty
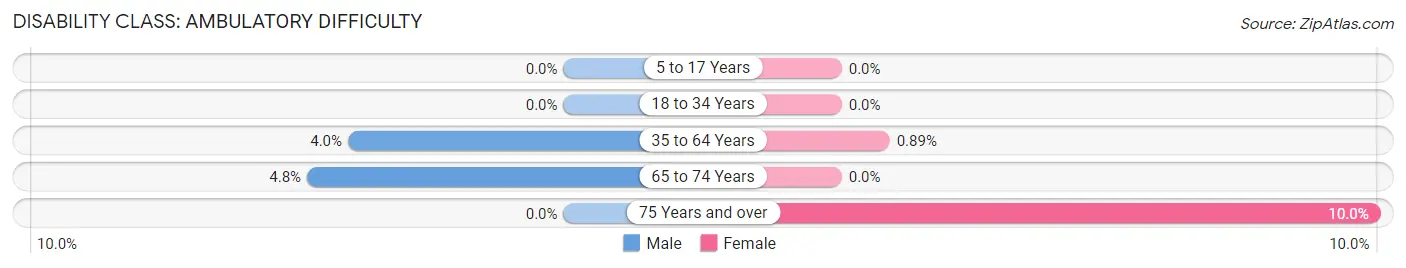
| Age Bracket | Male | Female |
| 5 to 17 Years | 0 (0.0%) | 0 (0.0%) |
| 18 to 34 Years | 0 (0.0%) | 0 (0.0%) |
| 35 to 64 Years | 3 (4.0%) | 1 (0.9%) |
| 65 to 74 Years | 1 (4.8%) | 0 (0.0%) |
| 75 Years and over | 0 (0.0%) | 2 (10.0%) |
Disability Class: Self-Care Difficulty
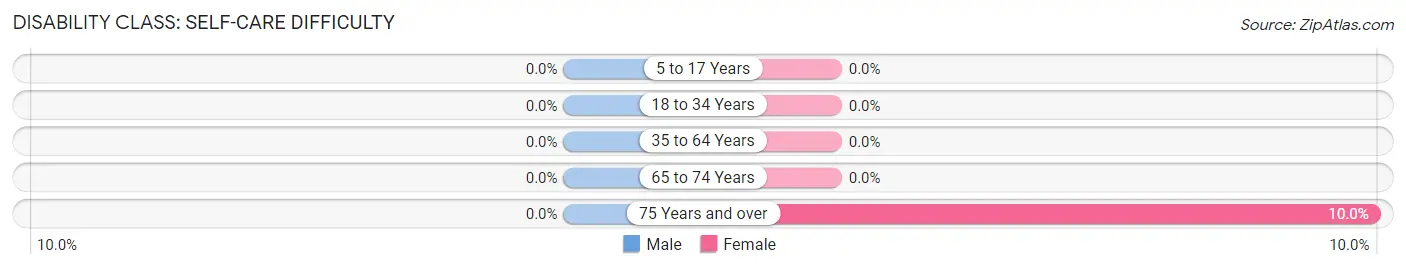
| Age Bracket | Male | Female |
| 5 to 17 Years | 0 (0.0%) | 0 (0.0%) |
| 18 to 34 Years | 0 (0.0%) | 0 (0.0%) |
| 35 to 64 Years | 0 (0.0%) | 0 (0.0%) |
| 65 to 74 Years | 0 (0.0%) | 0 (0.0%) |
| 75 Years and over | 0 (0.0%) | 2 (10.0%) |
Technology Access in Wellington
Computing Device Access in Wellington
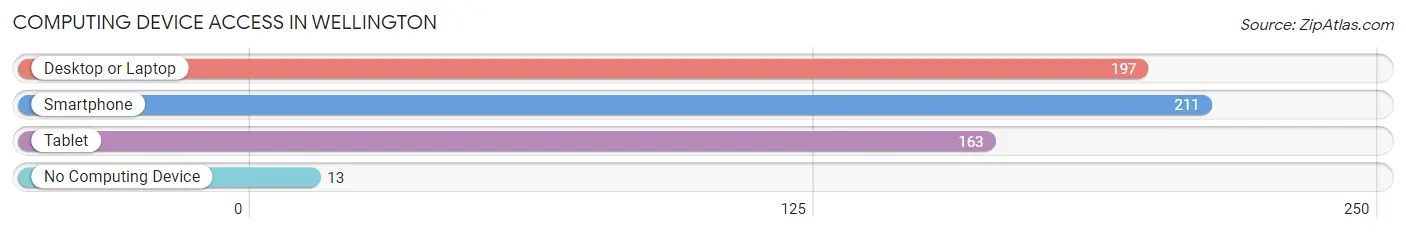
| Device Type | # Households | % Households |
| Desktop or Laptop | 197 | 86.4% |
| Smartphone | 211 | 92.5% |
| Tablet | 163 | 71.5% |
| No Computing Device | 13 | 5.7% |
| Total | 228 | 100.0% |
Internet Access in Wellington
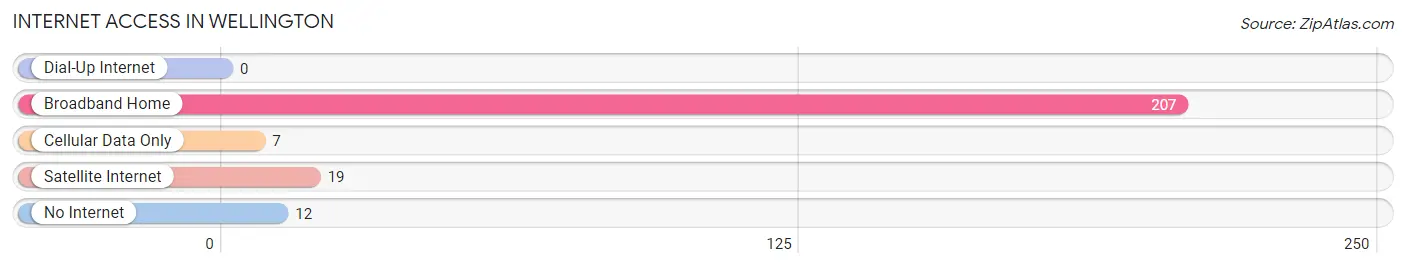
| Internet Type | # Households | % Households |
| Dial-Up Internet | 0 | 0.0% |
| Broadband Home | 207 | 90.8% |
| Cellular Data Only | 7 | 3.1% |
| Satellite Internet | 19 | 8.3% |
| No Internet | 12 | 5.3% |
| Total | 228 | 100.0% |
Wellington Summary
Wellington, Kentucky is a small city located in the heart of the Bluegrass region of the state. It is situated in the northern part of the state, just south of Lexington, and is part of the Lexington-Fayette Metropolitan Statistical Area. The city has a population of just over 2,000 people, and is the county seat of Menifee County.
History
Wellington was founded in 1817 by a group of settlers from Virginia. The city was named after Arthur Wellesley, the Duke of Wellington, who had recently defeated Napoleon at the Battle of Waterloo. The city was incorporated in 1820, and the first post office was established in 1821.
The city grew slowly but steadily throughout the 19th century, and by the turn of the century, it had become a thriving agricultural center. The city was also home to several manufacturing plants, including a flour mill, a sawmill, and a furniture factory.
In the early 20th century, the city experienced a period of growth and prosperity. The city was home to several banks, a movie theater, and a variety of stores and businesses. The city also had a thriving music scene, and was home to several popular bands and musicians.
Geography
Wellington is located in the northern part of the state, just south of Lexington. The city is situated in the Bluegrass region of Kentucky, and is part of the Lexington-Fayette Metropolitan Statistical Area. The city is located in the foothills of the Appalachian Mountains, and is surrounded by rolling hills and farmland.
The city is located along the Kentucky River, and is home to several parks and recreational areas. The city is also home to several historic sites, including the Wellington Historic District, which is listed on the National Register of Historic Places.
Economy
The economy of Wellington is largely based on agriculture and manufacturing. The city is home to several farms, and is a major producer of tobacco, corn, and hay. The city is also home to several manufacturing plants, including a furniture factory, a sawmill, and a flour mill.
The city is also home to several banks, and is a major center for banking and finance in the region. The city is also home to several stores and businesses, and is a popular destination for shopping and dining.
Demographics
As of the 2010 census, the population of Wellington was 2,072. The racial makeup of the city was 95.3% White, 1.2% African American, 0.3% Native American, 0.3% Asian, 0.1% Pacific Islander, 0.7% from other races, and 1.9% from two or more races. Hispanic or Latino of any race were 2.2% of the population.
The median income for a household in the city was $35,938, and the median income for a family was $41,250. The per capita income for the city was $17,845. About 15.2% of families and 17.7% of the population were below the poverty line, including 25.2% of those under age 18 and 11.2% of those age 65 or over.
Common Questions
What is Per Capita Income in Wellington?
Per Capita income in Wellington is $63,370.
What is the Median Family Income in Wellington?
Median Family Income in Wellington is $136,250.
What is the Median Household income in Wellington?
Median Household Income in Wellington is $103,333.
What is Income or Wage Gap in Wellington?
Income or Wage Gap in Wellington is 0.4%.
Women in Wellington earn 99.6 cents for every dollar earned by a man.
What is Inequality or Gini Index in Wellington?
Inequality or Gini Index in Wellington is 0.37.
What is the Total Population of Wellington?
Total Population of Wellington is 443.
What is the Total Male Population of Wellington?
Total Male Population of Wellington is 199.
What is the Total Female Population of Wellington?
Total Female Population of Wellington is 244.
What is the Ratio of Males per 100 Females in Wellington?
There are 81.56 Males per 100 Females in Wellington.
What is the Ratio of Females per 100 Males in Wellington?
There are 122.61 Females per 100 Males in Wellington.
What is the Median Population Age in Wellington?
Median Population Age in Wellington is 47.5 Years.
What is the Average Family Size in Wellington
Average Family Size in Wellington is 2.6 People.
What is the Average Household Size in Wellington
Average Household Size in Wellington is 1.9 People.
How Large is the Labor Force in Wellington?
There are 262 People in the Labor Forcein in Wellington.
What is the Percentage of People in the Labor Force in Wellington?
70.4% of People are in the Labor Force in Wellington.
What is the Unemployment Rate in Wellington?
Unemployment Rate in Wellington is 1.5%.