Cities with the Highest Percentage of Polish Population in Kentucky
RELATED REPORTS & OPTIONS
Polish
Kentucky
Compare Cities
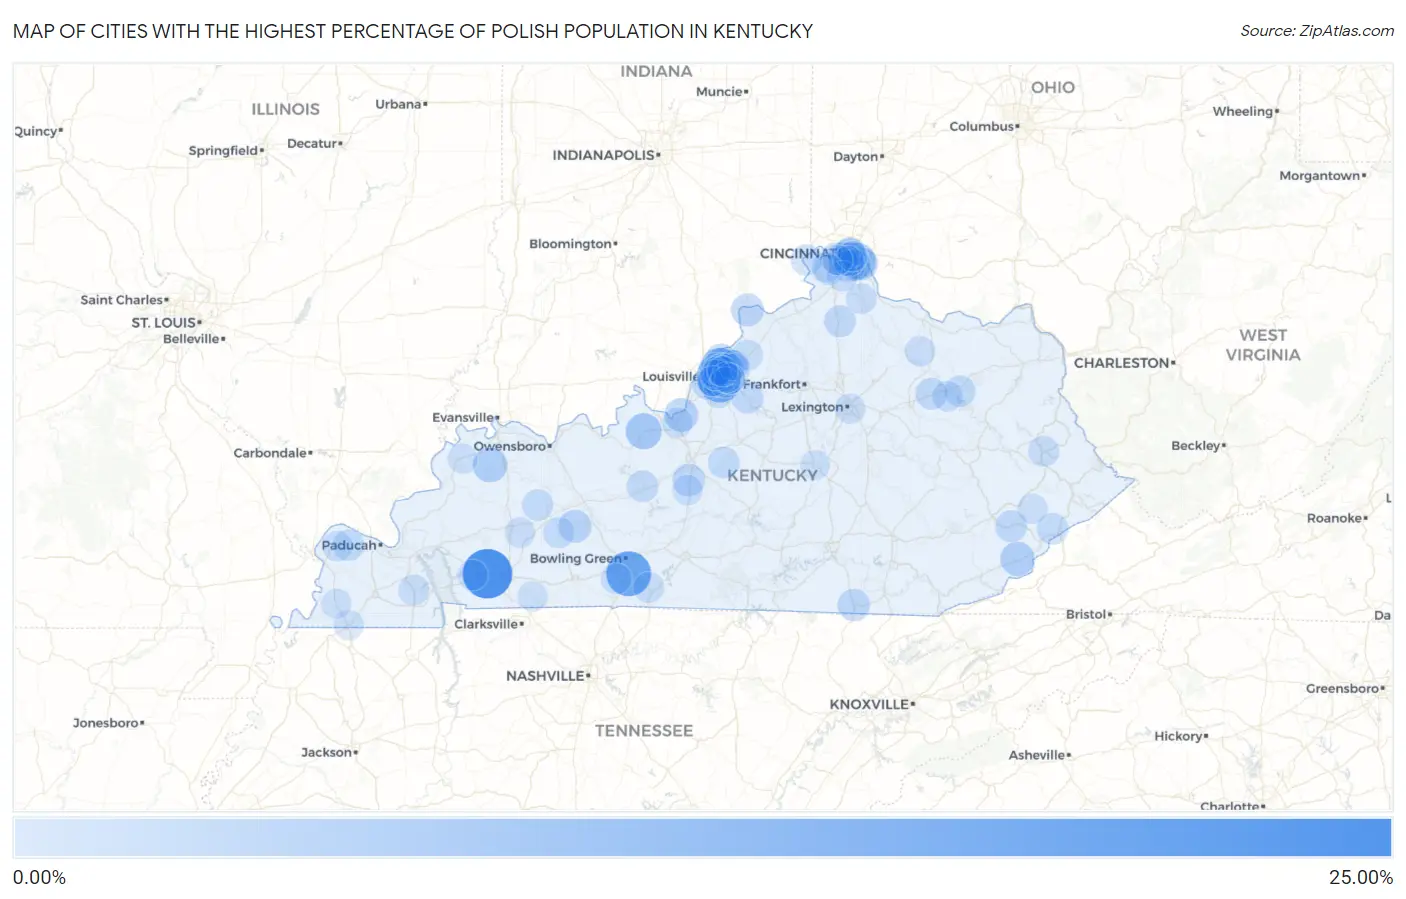
Map of Cities with the Highest Percentage of Polish Population in Kentucky
0.00%
25.00%
Cities with the Highest Percentage of Polish Population in Kentucky
| City | Polish | vs State | vs National | |
| 1. | Gracey | 20.78% | 0.91%(+19.9)#1 | 2.61%(+18.2)#316 |
| 2. | Plano | 15.91% | 0.91%(+15.0)#2 | 2.61%(+13.3)#607 |
| 3. | Lincolnshire | 13.33% | 0.91%(+12.4)#3 | 2.61%(+10.7)#915 |
| 4. | Green Spring | 10.36% | 0.91%(+9.45)#4 | 2.61%(+7.75)#1,558 |
| 5. | Glenview Manor | 8.25% | 0.91%(+7.34)#5 | 2.61%(+5.64)#2,351 |
| 6. | Westwood | 7.46% | 0.91%(+6.55)#6 | 2.61%(+4.85)#2,734 |
| 7. | Silver Grove | 7.42% | 0.91%(+6.51)#7 | 2.61%(+4.80)#2,763 |
| 8. | Old Brownsboro Place | 7.29% | 0.91%(+6.38)#8 | 2.61%(+4.68)#2,855 |
| 9. | Philpot | 7.11% | 0.91%(+6.20)#9 | 2.61%(+4.50)#2,975 |
| 10. | Irvington | 6.99% | 0.91%(+6.08)#10 | 2.61%(+4.38)#3,046 |
| 11. | Brownsboro Village | 6.75% | 0.91%(+5.84)#11 | 2.61%(+4.14)#3,202 |
| 12. | Poole | 5.56% | 0.91%(+4.65)#12 | 2.61%(+2.94)#4,205 |
| 13. | Moorland | 5.49% | 0.91%(+4.58)#13 | 2.61%(+2.88)#4,272 |
| 14. | Ten Broeck | 5.48% | 0.91%(+4.57)#14 | 2.61%(+2.87)#4,279 |
| 15. | Riverwood | 5.39% | 0.91%(+4.48)#15 | 2.61%(+2.78)#4,361 |
| 16. | Cumberland | 5.27% | 0.91%(+4.36)#16 | 2.61%(+2.66)#4,478 |
| 17. | West Point | 4.66% | 0.91%(+3.75)#17 | 2.61%(+2.05)#5,165 |
| 18. | Woodlawn | 4.47% | 0.91%(+3.56)#18 | 2.61%(+1.86)#5,393 |
| 19. | Orchard Grass Hills | 4.44% | 0.91%(+3.53)#19 | 2.61%(+1.83)#5,430 |
| 20. | Melbourne | 4.20% | 0.91%(+3.29)#20 | 2.61%(+1.59)#5,757 |
| 21. | Southgate | 4.00% | 0.91%(+3.09)#21 | 2.61%(+1.39)#6,053 |
| 22. | Rochester | 3.89% | 0.91%(+2.98)#22 | 2.61%(+1.28)#6,200 |
| 23. | Milton | 3.79% | 0.91%(+2.88)#23 | 2.61%(+1.18)#6,344 |
| 24. | Broeck Pointe | 3.69% | 0.91%(+2.78)#24 | 2.61%(+1.08)#6,511 |
| 25. | Sonora | 3.63% | 0.91%(+2.72)#25 | 2.61%(+1.02)#6,602 |
| 26. | River Bluff | 3.63% | 0.91%(+2.72)#26 | 2.61%(+1.02)#6,611 |
| 27. | Pine Knot | 3.51% | 0.91%(+2.60)#27 | 2.61%(+0.895)#6,802 |
| 28. | Villa Hills | 3.27% | 0.91%(+2.36)#28 | 2.61%(+0.662)#7,261 |
| 29. | Elk Creek | 3.14% | 0.91%(+2.23)#29 | 2.61%(+0.526)#7,520 |
| 30. | Taylor Mill | 3.08% | 0.91%(+2.17)#30 | 2.61%(+0.469)#7,628 |
| 31. | Vicco | 2.98% | 0.91%(+2.07)#31 | 2.61%(+0.369)#7,824 |
| 32. | Williamstown | 2.92% | 0.91%(+2.01)#32 | 2.61%(+0.305)#7,953 |
| 33. | Owingsville | 2.91% | 0.91%(+2.00)#33 | 2.61%(+0.297)#7,975 |
| 34. | Douglass Hills | 2.85% | 0.91%(+1.94)#34 | 2.61%(+0.243)#8,077 |
| 35. | Kingsley | 2.83% | 0.91%(+1.92)#35 | 2.61%(+0.216)#8,128 |
| 36. | Seneca Gardens | 2.81% | 0.91%(+1.90)#36 | 2.61%(+0.196)#8,178 |
| 37. | Glenview | 2.79% | 0.91%(+1.88)#37 | 2.61%(+0.176)#8,221 |
| 38. | Leitchfield | 2.75% | 0.91%(+1.84)#38 | 2.61%(+0.141)#8,307 |
| 39. | Windy Hills | 2.74% | 0.91%(+1.83)#39 | 2.61%(+0.125)#8,345 |
| 40. | Cold Spring | 2.73% | 0.91%(+1.82)#40 | 2.61%(+0.121)#8,356 |
| 41. | Audubon Park | 2.69% | 0.91%(+1.78)#41 | 2.61%(+0.080)#8,442 |
| 42. | Fleming Neon | 2.67% | 0.91%(+1.76)#42 | 2.61%(+0.057)#8,503 |
| 43. | New Haven | 2.66% | 0.91%(+1.75)#43 | 2.61%(+0.050)#8,513 |
| 44. | Prospect | 2.64% | 0.91%(+1.73)#44 | 2.61%(+0.027)#8,564 |
| 45. | Lakeview Heights | 2.53% | 0.91%(+1.62)#45 | 2.61%(-0.083)#8,844 |
| 46. | Kevil | 2.52% | 0.91%(+1.61)#46 | 2.61%(-0.088)#8,856 |
| 47. | Sorgho | 2.41% | 0.91%(+1.50)#47 | 2.61%(-0.200)#9,150 |
| 48. | Beechmont | 2.41% | 0.91%(+1.50)#48 | 2.61%(-0.202)#9,154 |
| 49. | Plantation | 2.36% | 0.91%(+1.45)#49 | 2.61%(-0.252)#9,293 |
| 50. | Bremen | 2.35% | 0.91%(+1.44)#50 | 2.61%(-0.261)#9,327 |
| 51. | Blue Ridge Manor | 2.34% | 0.91%(+1.43)#51 | 2.61%(-0.269)#9,350 |
| 52. | Thornhill | 2.26% | 0.91%(+1.35)#52 | 2.61%(-0.351)#9,568 |
| 53. | Petersburg | 2.21% | 0.91%(+1.30)#53 | 2.61%(-0.397)#9,691 |
| 54. | Spring Mill | 2.15% | 0.91%(+1.24)#54 | 2.61%(-0.457)#9,879 |
| 55. | Park Hills | 2.12% | 0.91%(+1.21)#55 | 2.61%(-0.490)#9,973 |
| 56. | Bellemeade | 2.12% | 0.91%(+1.21)#56 | 2.61%(-0.493)#9,979 |
| 57. | Auxier | 2.10% | 0.91%(+1.19)#57 | 2.61%(-0.508)#10,021 |
| 58. | Scottsville | 2.10% | 0.91%(+1.19)#58 | 2.61%(-0.511)#10,030 |
| 59. | Beechwood Village | 2.07% | 0.91%(+1.16)#59 | 2.61%(-0.538)#10,103 |
| 60. | Fort Wright | 2.07% | 0.91%(+1.16)#60 | 2.61%(-0.540)#10,110 |
| 61. | Hardin | 2.07% | 0.91%(+1.16)#61 | 2.61%(-0.545)#10,127 |
| 62. | Murray Hill | 2.05% | 0.91%(+1.14)#62 | 2.61%(-0.560)#10,177 |
| 63. | La Grange | 2.02% | 0.91%(+1.10)#63 | 2.61%(-0.596)#10,286 |
| 64. | Meadowview Estates | 2.01% | 0.91%(+1.10)#64 | 2.61%(-0.598)#10,293 |
| 65. | Woodburn | 1.96% | 0.91%(+1.05)#65 | 2.61%(-0.651)#10,447 |
| 66. | Druid Hills | 1.89% | 0.91%(+0.982)#66 | 2.61%(-0.719)#10,698 |
| 67. | La Center | 1.89% | 0.91%(+0.981)#67 | 2.61%(-0.720)#10,702 |
| 68. | Salt Lick | 1.86% | 0.91%(+0.951)#68 | 2.61%(-0.750)#10,789 |
| 69. | Bellevue | 1.86% | 0.91%(+0.948)#69 | 2.61%(-0.753)#10,804 |
| 70. | Pewee Valley | 1.85% | 0.91%(+0.939)#70 | 2.61%(-0.762)#10,835 |
| 71. | Florence | 1.85% | 0.91%(+0.936)#71 | 2.61%(-0.765)#10,847 |
| 72. | Brownsboro Farm | 1.81% | 0.91%(+0.898)#72 | 2.61%(-0.803)#10,983 |
| 73. | Cadiz | 1.80% | 0.91%(+0.885)#73 | 2.61%(-0.816)#11,030 |
| 74. | Independence | 1.73% | 0.91%(+0.820)#74 | 2.61%(-0.881)#11,264 |
| 75. | Fincastle | 1.70% | 0.91%(+0.790)#75 | 2.61%(-0.911)#11,362 |
| 76. | White Plains | 1.68% | 0.91%(+0.774)#76 | 2.61%(-0.926)#11,425 |
| 77. | Upton | 1.67% | 0.91%(+0.756)#77 | 2.61%(-0.945)#11,509 |
| 78. | Maryhill Estates | 1.66% | 0.91%(+0.749)#78 | 2.61%(-0.952)#11,538 |
| 79. | Muldraugh | 1.64% | 0.91%(+0.727)#79 | 2.61%(-0.973)#11,620 |
| 80. | Butler | 1.63% | 0.91%(+0.717)#80 | 2.61%(-0.984)#11,653 |
| 81. | Wilder | 1.62% | 0.91%(+0.707)#81 | 2.61%(-0.993)#11,683 |
| 82. | Hills And Dales | 1.56% | 0.91%(+0.652)#82 | 2.61%(-1.05)#11,907 |
| 83. | Indian Hills | 1.56% | 0.91%(+0.646)#83 | 2.61%(-1.05)#11,931 |
| 84. | Lexington | 1.54% | 0.91%(+0.626)#84 | 2.61%(-1.07)#11,988 |
| 85. | Ewing | 1.53% | 0.91%(+0.622)#85 | 2.61%(-1.08)#12,004 |
| 86. | Strathmoor Village | 1.52% | 0.91%(+0.613)#86 | 2.61%(-1.09)#12,034 |
| 87. | Fulton | 1.52% | 0.91%(+0.612)#87 | 2.61%(-1.09)#12,043 |
| 88. | Crestwood | 1.52% | 0.91%(+0.612)#88 | 2.61%(-1.09)#12,044 |
| 89. | Fort Thomas | 1.52% | 0.91%(+0.609)#89 | 2.61%(-1.09)#12,058 |
| 90. | Morganfield | 1.51% | 0.91%(+0.601)#90 | 2.61%(-1.10)#12,080 |
| 91. | Jeffersontown | 1.51% | 0.91%(+0.597)#91 | 2.61%(-1.10)#12,096 |
| 92. | Oakbrook | 1.50% | 0.91%(+0.593)#92 | 2.61%(-1.11)#12,109 |
| 93. | Pippa Passes | 1.47% | 0.91%(+0.563)#93 | 2.61%(-1.14)#12,239 |
| 94. | Middletown | 1.47% | 0.91%(+0.559)#94 | 2.61%(-1.14)#12,258 |
| 95. | Sycamore | 1.43% | 0.91%(+0.518)#95 | 2.61%(-1.18)#12,423 |
| 96. | Crescent Springs | 1.43% | 0.91%(+0.515)#96 | 2.61%(-1.19)#12,434 |
| 97. | Trenton | 1.40% | 0.91%(+0.488)#97 | 2.61%(-1.21)#12,543 |
| 98. | Goose Creek | 1.39% | 0.91%(+0.483)#98 | 2.61%(-1.22)#12,564 |
| 99. | Danville | 1.37% | 0.91%(+0.456)#99 | 2.61%(-1.24)#12,673 |
| 100. | Clinton | 1.36% | 0.91%(+0.453)#100 | 2.61%(-1.25)#12,682 |
Common Questions
What are the Top 10 Cities with the Highest Percentage of Polish Population in Kentucky?
Top 10 Cities with the Highest Percentage of Polish Population in Kentucky are:
#1
20.78%
#2
15.91%
#3
13.33%
#4
10.36%
#5
8.25%
#6
7.46%
#7
7.42%
#8
7.29%
#9
6.99%
#10
6.75%
What city has the Highest Percentage of Polish Population in Kentucky?
Gracey has the Highest Percentage of Polish Population in Kentucky with 20.78%.
What is the Percentage of Polish Population in the State of Kentucky?
Percentage of Polish Population in Kentucky is 0.91%.
What is the Percentage of Polish Population in the United States?
Percentage of Polish Population in the United States is 2.61%.