Raywick, KY Map & Demographics
Raywick Map
Raywick Overview
$27,884
PER CAPITA INCOME
$78,750
AVG FAMILY INCOME
$40,000
AVG HOUSEHOLD INCOME
25.4%
WAGE / INCOME GAP [ % ]
74.6¢/ $1
WAGE / INCOME GAP [ $ ]
0.42
INEQUALITY / GINI INDEX
123
TOTAL POPULATION
71
MALE POPULATION
52
FEMALE POPULATION
136.54
MALES / 100 FEMALES
73.24
FEMALES / 100 MALES
47.3
MEDIAN AGE
2.4
AVG FAMILY SIZE
1.8
AVG HOUSEHOLD SIZE
62
LABOR FORCE [ PEOPLE ]
54.9%
PERCENT IN LABOR FORCE
1.6%
UNEMPLOYMENT RATE
Raywick Zip Codes
Raywick Area Codes
Income in Raywick
Income Overview in Raywick
Per Capita Income in Raywick is $27,884, while median incomes of families and households are $78,750 and $40,000 respectively.
| Characteristic | Number | Measure |
| Per Capita Income | 123 | $27,884 |
| Median Family Income | 38 | $78,750 |
| Mean Family Income | 38 | $66,566 |
| Median Household Income | 68 | $40,000 |
| Mean Household Income | 68 | $47,851 |
| Income Deficit | 38 | $0 |
| Wage / Income Gap (%) | 123 | 25.44% |
| Wage / Income Gap ($) | 123 | 74.56¢ per $1 |
| Gini / Inequality Index | 123 | 0.42 |
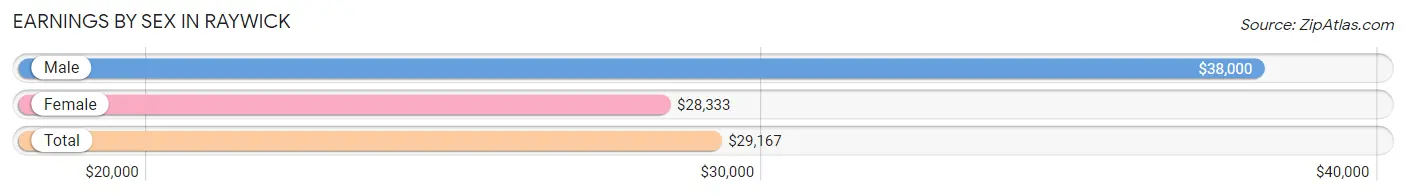
Earnings by Sex in Raywick
Average Earnings in Raywick are $29,167, $38,000 for men and $28,333 for women, a difference of 25.4%.
| Sex | Number | Average Earnings |
| Male | 44 (62.9%) | $38,000 |
| Female | 26 (37.1%) | $28,333 |
| Total | 70 (100.0%) | $29,167 |
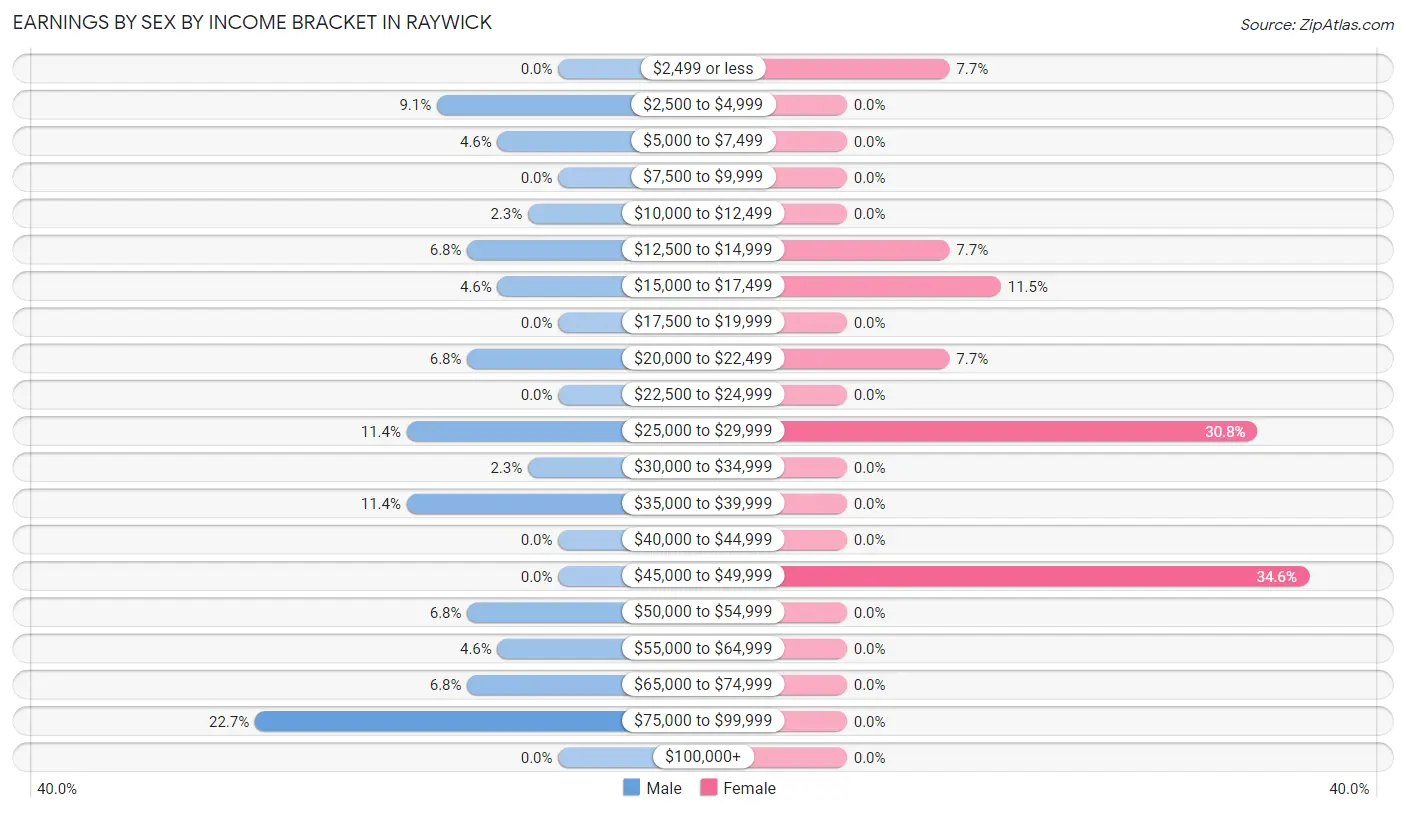
Earnings by Sex by Income Bracket in Raywick
The most common earnings brackets in Raywick are $75,000 to $99,999 for men (10 | 22.7%) and $45,000 to $49,999 for women (9 | 34.6%).
| Income | Male | Female |
| $2,499 or less | 0 (0.0%) | 2 (7.7%) |
| $2,500 to $4,999 | 4 (9.1%) | 0 (0.0%) |
| $5,000 to $7,499 | 2 (4.5%) | 0 (0.0%) |
| $7,500 to $9,999 | 0 (0.0%) | 0 (0.0%) |
| $10,000 to $12,499 | 1 (2.3%) | 0 (0.0%) |
| $12,500 to $14,999 | 3 (6.8%) | 2 (7.7%) |
| $15,000 to $17,499 | 2 (4.5%) | 3 (11.5%) |
| $17,500 to $19,999 | 0 (0.0%) | 0 (0.0%) |
| $20,000 to $22,499 | 3 (6.8%) | 2 (7.7%) |
| $22,500 to $24,999 | 0 (0.0%) | 0 (0.0%) |
| $25,000 to $29,999 | 5 (11.4%) | 8 (30.8%) |
| $30,000 to $34,999 | 1 (2.3%) | 0 (0.0%) |
| $35,000 to $39,999 | 5 (11.4%) | 0 (0.0%) |
| $40,000 to $44,999 | 0 (0.0%) | 0 (0.0%) |
| $45,000 to $49,999 | 0 (0.0%) | 9 (34.6%) |
| $50,000 to $54,999 | 3 (6.8%) | 0 (0.0%) |
| $55,000 to $64,999 | 2 (4.5%) | 0 (0.0%) |
| $65,000 to $74,999 | 3 (6.8%) | 0 (0.0%) |
| $75,000 to $99,999 | 10 (22.7%) | 0 (0.0%) |
| $100,000+ | 0 (0.0%) | 0 (0.0%) |
| Total | 44 (100.0%) | 26 (100.0%) |
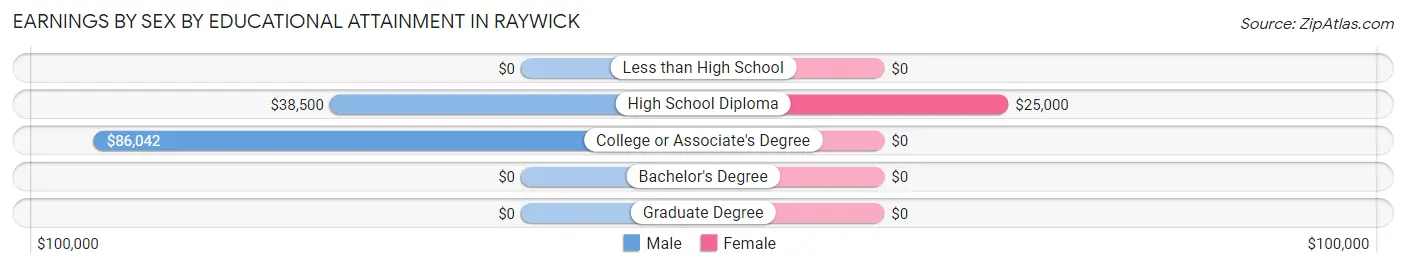
Earnings by Sex by Educational Attainment in Raywick
Average earnings in Raywick are $50,417 for men and $28,750 for women, a difference of 43.0%. Men with an educational attainment of college or associate's degree enjoy the highest average annual earnings of $86,042, while those with high school diploma education earn the least with $38,500. Women with an educational attainment of high school diploma earn the most with the average annual earnings of $25,000, while those with high school diploma education have the smallest earnings of $25,000.
| Educational Attainment | Male Income | Female Income |
| Less than High School | - | - |
| High School Diploma | $38,500 | $25,000 |
| College or Associate's Degree | $86,042 | $0 |
| Bachelor's Degree | - | - |
| Graduate Degree | - | - |
| Total | $50,417 | $28,750 |
Family Income in Raywick
Family Income Brackets in Raywick
According to the Raywick family income data, there are 16 families falling into the $75,000 to $99,999 income range, which is the most common income bracket and makes up 42.1% of all families.
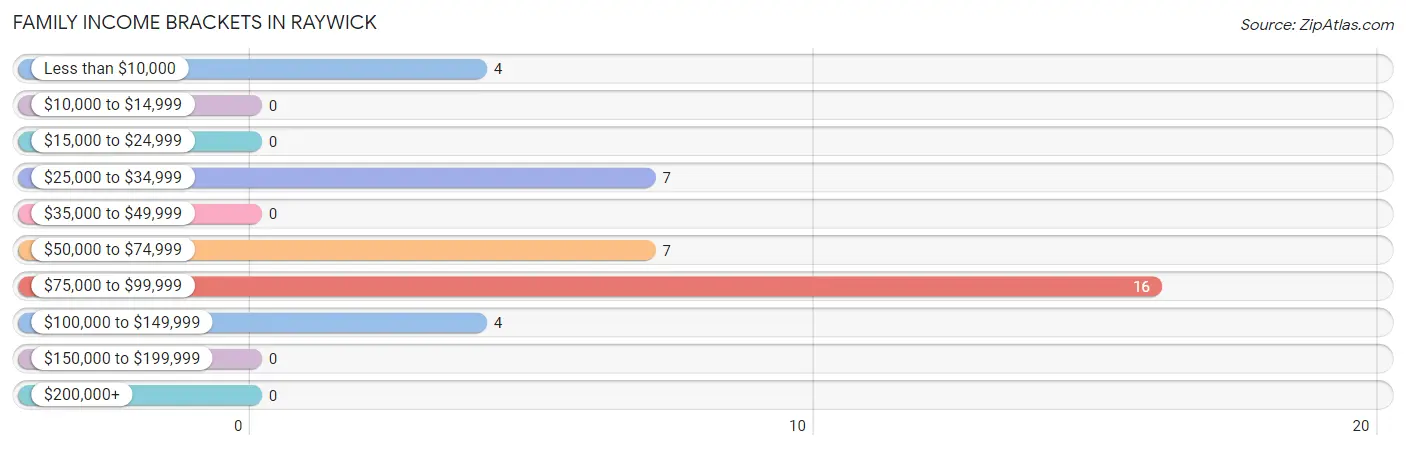
| Income Bracket | # Families | % Families |
| Less than $10,000 | 4 | 10.5% |
| $10,000 to $14,999 | 0 | 0.0% |
| $15,000 to $24,999 | 0 | 0.0% |
| $25,000 to $34,999 | 7 | 18.4% |
| $35,000 to $49,999 | 0 | 0.0% |
| $50,000 to $74,999 | 7 | 18.4% |
| $75,000 to $99,999 | 16 | 42.1% |
| $100,000 to $149,999 | 4 | 10.5% |
| $150,000 to $199,999 | 0 | 0.0% |
| $200,000+ | 0 | 0.0% |
Family Income by Famaliy Size in Raywick
2-person families (27 | 71.1%) account for the highest median family income in Raywick with $85,781 per family, while 2-person families (27 | 71.1%) have the highest median income of $42,890 per family member.
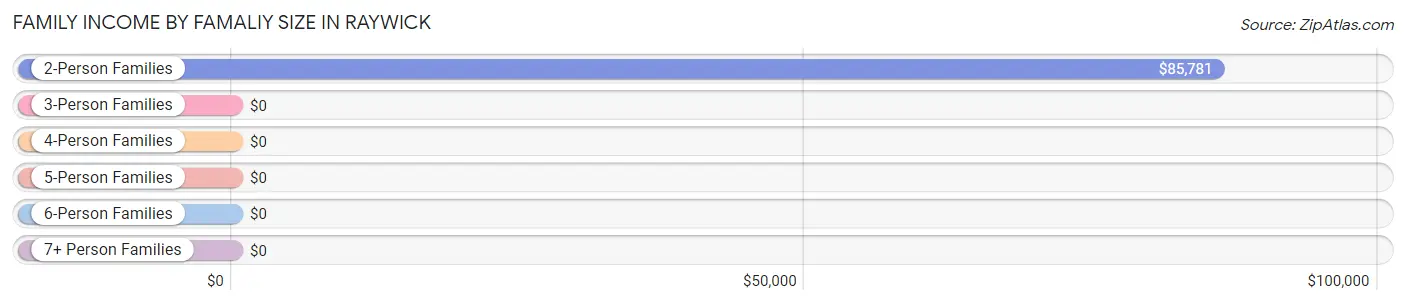
| Income Bracket | # Families | Median Income |
| 2-Person Families | 27 (71.1%) | $85,781 |
| 3-Person Families | 7 (18.4%) | $0 |
| 4-Person Families | 4 (10.5%) | $0 |
| 5-Person Families | 0 (0.0%) | $0 |
| 6-Person Families | 0 (0.0%) | $0 |
| 7+ Person Families | 0 (0.0%) | $0 |
| Total | 38 (100.0%) | $78,750 |
Family Income by Number of Earners in Raywick
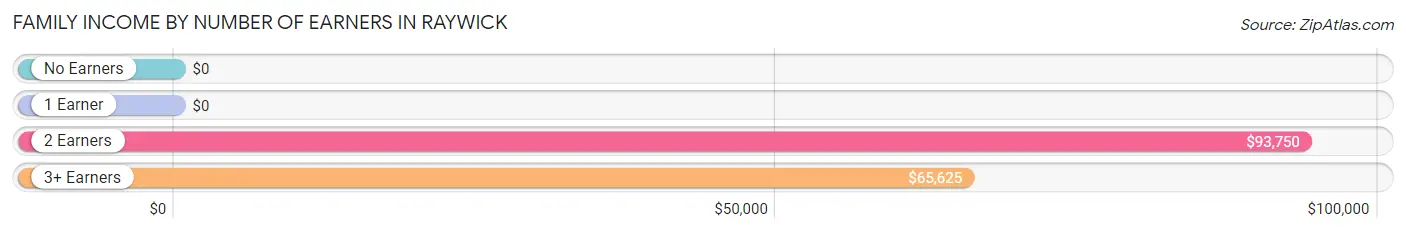
| Number of Earners | # Families | Median Income |
| No Earners | 4 (10.5%) | $0 |
| 1 Earner | 19 (50.0%) | $0 |
| 2 Earners | 10 (26.3%) | $93,750 |
| 3+ Earners | 5 (13.2%) | $65,625 |
| Total | 38 (100.0%) | $78,750 |
Household Income in Raywick
Household Income Brackets in Raywick
With 17 households falling in the category, the $75,000 to $99,999 income range is the most frequent in Raywick, accounting for 25.0% of all households.
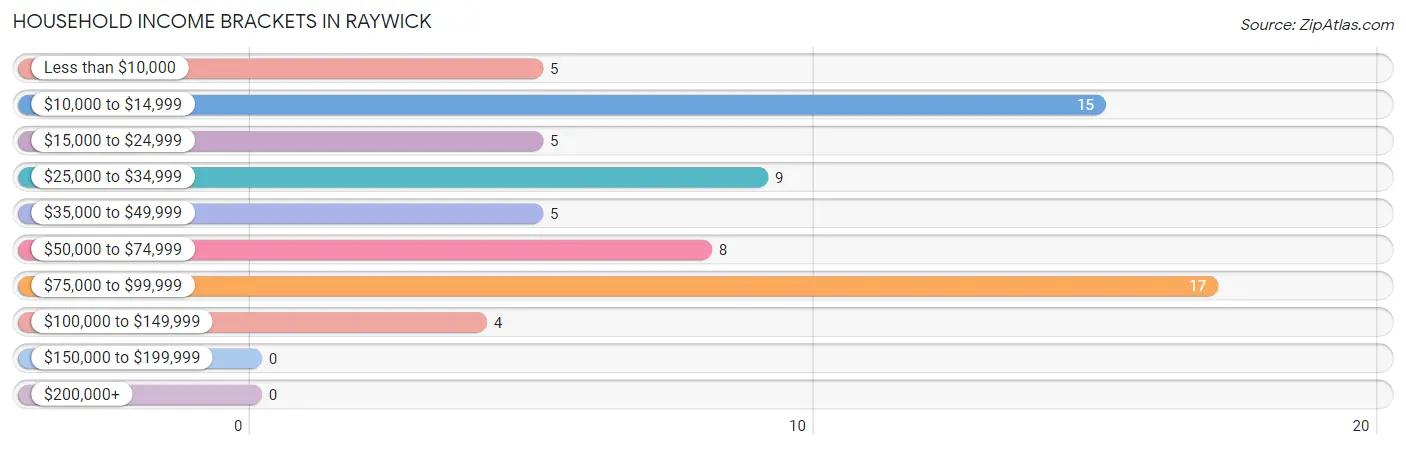
| Income Bracket | # Households | % Households |
| Less than $10,000 | 5 | 7.4% |
| $10,000 to $14,999 | 15 | 22.1% |
| $15,000 to $24,999 | 5 | 7.4% |
| $25,000 to $34,999 | 9 | 13.2% |
| $35,000 to $49,999 | 5 | 7.4% |
| $50,000 to $74,999 | 8 | 11.8% |
| $75,000 to $99,999 | 17 | 25.0% |
| $100,000 to $149,999 | 4 | 5.9% |
| $150,000 to $199,999 | 0 | 0.0% |
| $200,000+ | 0 | 0.0% |
Household Income by Householder Age in Raywick
The median household income in Raywick is $40,000, with the highest median household income of $78,125 found in the 25 to 44 years age bracket for the primary householder. A total of 15 households (22.1%) fall into this category. Meanwhile, the 15 to 24 years age bracket for the primary householder has the lowest median household income of $0, with 2 households (2.9%) in this group.
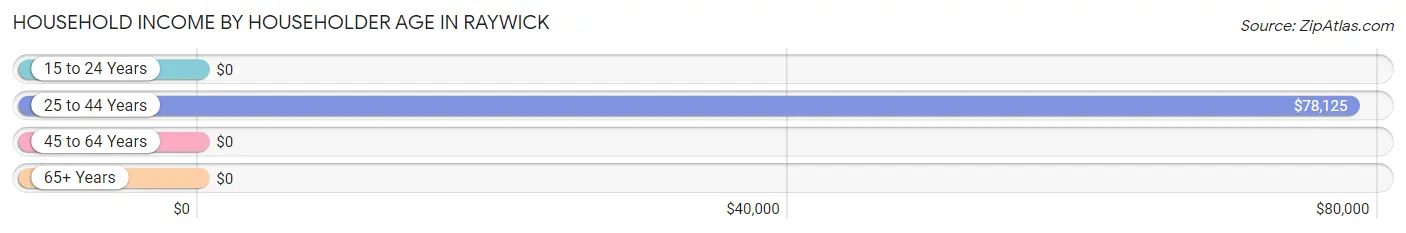
| Income Bracket | # Households | Median Income |
| 15 to 24 Years | 2 (2.9%) | $0 |
| 25 to 44 Years | 15 (22.1%) | $78,125 |
| 45 to 64 Years | 33 (48.5%) | $0 |
| 65+ Years | 18 (26.5%) | $0 |
| Total | 68 (100.0%) | $40,000 |
Poverty in Raywick
Income Below Poverty by Sex and Age in Raywick
With 15.5% poverty level for males and 26.9% for females among the residents of Raywick, 55 to 64 year old males and 55 to 64 year old females are the most vulnerable to poverty, with 3 males (60.0%) and 7 females (53.8%) in their respective age groups living below the poverty level.
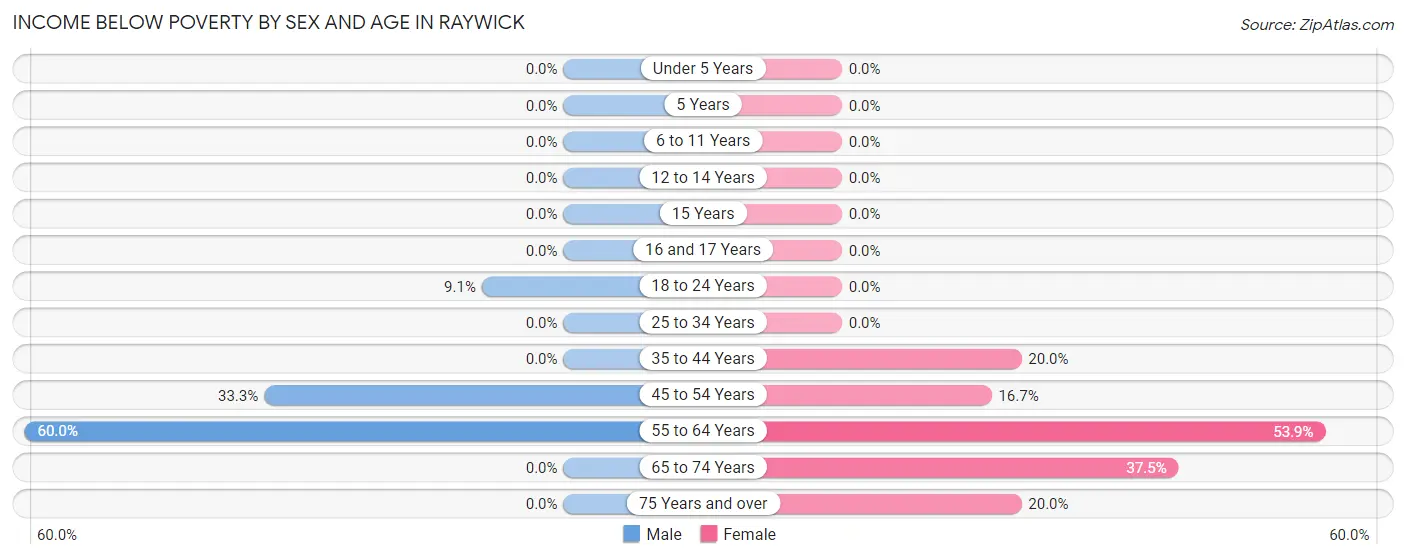
| Age Bracket | Male | Female |
| Under 5 Years | 0 (0.0%) | 0 (0.0%) |
| 5 Years | 0 (0.0%) | 0 (0.0%) |
| 6 to 11 Years | 0 (0.0%) | 0 (0.0%) |
| 12 to 14 Years | 0 (0.0%) | 0 (0.0%) |
| 15 Years | 0 (0.0%) | 0 (0.0%) |
| 16 and 17 Years | 0 (0.0%) | 0 (0.0%) |
| 18 to 24 Years | 2 (9.1%) | 0 (0.0%) |
| 25 to 34 Years | 0 (0.0%) | 0 (0.0%) |
| 35 to 44 Years | 0 (0.0%) | 2 (20.0%) |
| 45 to 54 Years | 6 (33.3%) | 1 (16.7%) |
| 55 to 64 Years | 3 (60.0%) | 7 (53.8%) |
| 65 to 74 Years | 0 (0.0%) | 3 (37.5%) |
| 75 Years and over | 0 (0.0%) | 1 (20.0%) |
| Total | 11 (15.5%) | 14 (26.9%) |
Income Above Poverty by Sex and Age in Raywick
According to the poverty statistics in Raywick, males aged under 5 years and females aged 6 to 11 years are the age groups that are most secure financially, with 100.0% of males and 100.0% of females in these age groups living above the poverty line.
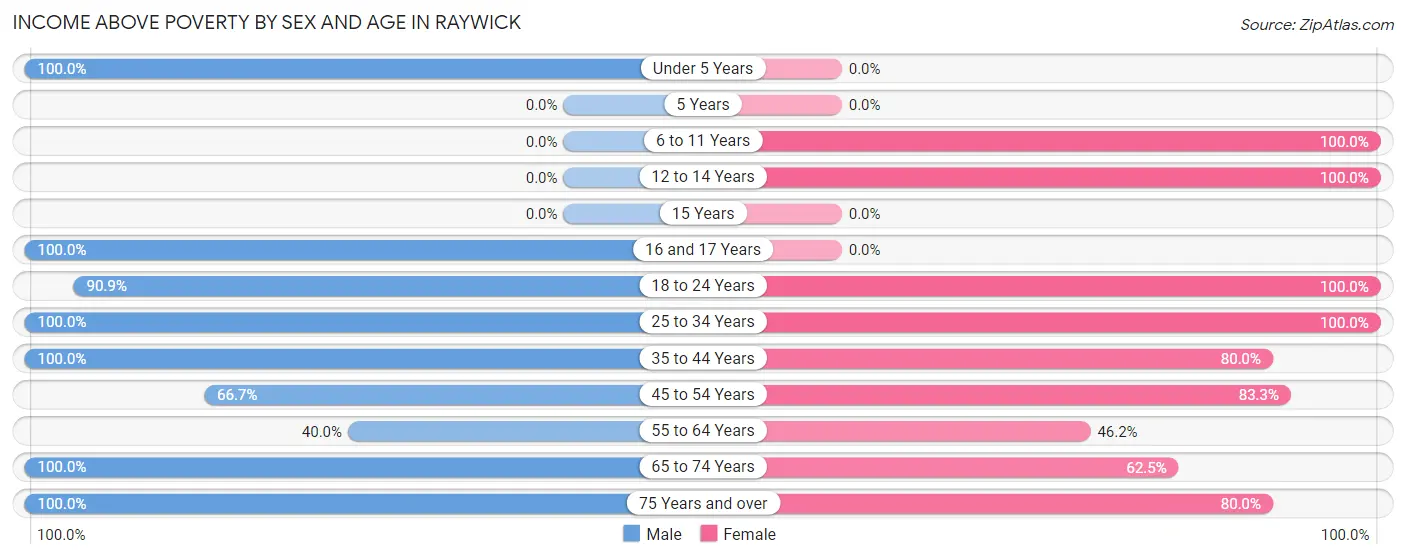
| Age Bracket | Male | Female |
| Under 5 Years | 5 (100.0%) | 0 (0.0%) |
| 5 Years | 0 (0.0%) | 0 (0.0%) |
| 6 to 11 Years | 0 (0.0%) | 2 (100.0%) |
| 12 to 14 Years | 0 (0.0%) | 3 (100.0%) |
| 15 Years | 0 (0.0%) | 0 (0.0%) |
| 16 and 17 Years | 3 (100.0%) | 0 (0.0%) |
| 18 to 24 Years | 20 (90.9%) | 2 (100.0%) |
| 25 to 34 Years | 7 (100.0%) | 3 (100.0%) |
| 35 to 44 Years | 2 (100.0%) | 8 (80.0%) |
| 45 to 54 Years | 12 (66.7%) | 5 (83.3%) |
| 55 to 64 Years | 2 (40.0%) | 6 (46.2%) |
| 65 to 74 Years | 6 (100.0%) | 5 (62.5%) |
| 75 Years and over | 3 (100.0%) | 4 (80.0%) |
| Total | 60 (84.5%) | 38 (73.1%) |
Income Below Poverty Among Married-Couple Families in Raywick
The poverty statistics for married-couple families in Raywick show that 10.5% or 2 of the total 19 families live below the poverty line. Families with no children have the highest poverty rate of 13.3%, comprising of 2 families. On the other hand, families with 1 or 2 children have the lowest poverty rate of 0.0%, which includes 0 families.
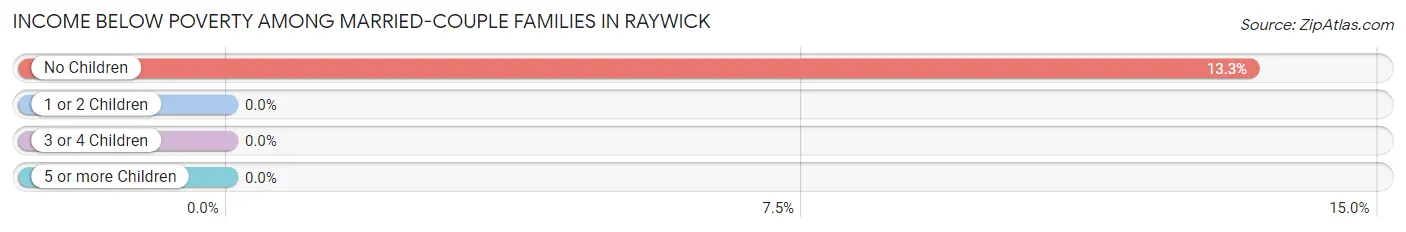
| Children | Above Poverty | Below Poverty |
| No Children | 13 (86.7%) | 2 (13.3%) |
| 1 or 2 Children | 4 (100.0%) | 0 (0.0%) |
| 3 or 4 Children | 0 (0.0%) | 0 (0.0%) |
| 5 or more Children | 0 (0.0%) | 0 (0.0%) |
| Total | 17 (89.5%) | 2 (10.5%) |
Income Below Poverty Among Single-Parent Households in Raywick
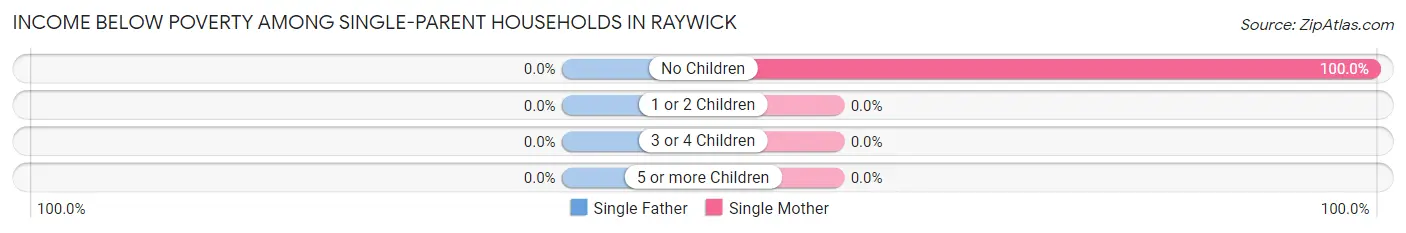
| Children | Single Father | Single Mother |
| No Children | 0 (0.0%) | 2 (100.0%) |
| 1 or 2 Children | 0 (0.0%) | 0 (0.0%) |
| 3 or 4 Children | 0 (0.0%) | 0 (0.0%) |
| 5 or more Children | 0 (0.0%) | 0 (0.0%) |
| Total | 0 (0.0%) | 2 (33.3%) |
Income Below Poverty Among Married-Couple vs Single-Parent Households in Raywick
The poverty data for Raywick shows that 2 of the married-couple family households (10.5%) and 2 of the single-parent households (10.5%) are living below the poverty level. Within the married-couple family households, those with no children have the highest poverty rate, with 2 households (13.3%) falling below the poverty line. Among the single-parent households, those with no children have the highest poverty rate, with 2 household (22.2%) living below poverty.
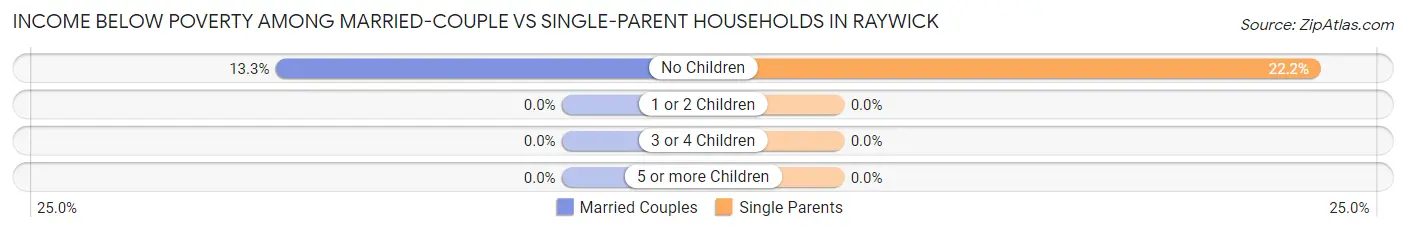
| Children | Married-Couple Families | Single-Parent Households |
| No Children | 2 (13.3%) | 2 (22.2%) |
| 1 or 2 Children | 0 (0.0%) | 0 (0.0%) |
| 3 or 4 Children | 0 (0.0%) | 0 (0.0%) |
| 5 or more Children | 0 (0.0%) | 0 (0.0%) |
| Total | 2 (10.5%) | 2 (10.5%) |
Race in Raywick
The most populous races in Raywick are , and White / Caucasian (123 | 100.0%).
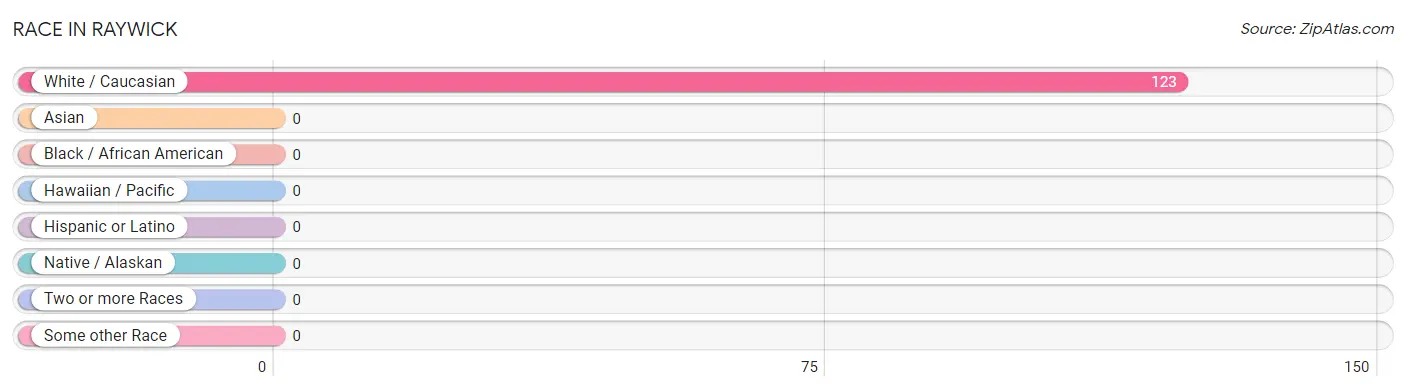
| Race | # Population | % Population |
| Asian | 0 | 0.0% |
| Black / African American | 0 | 0.0% |
| Hawaiian / Pacific | 0 | 0.0% |
| Hispanic or Latino | 0 | 0.0% |
| Native / Alaskan | 0 | 0.0% |
| White / Caucasian | 123 | 100.0% |
| Two or more Races | 0 | 0.0% |
| Some other Race | 0 | 0.0% |
| Total | 123 | 100.0% |
Ancestry in Raywick
The most populous ancestries reported in Raywick are American (28 | 22.8%), Irish (15 | 12.2%), German (11 | 8.9%), English (8 | 6.5%), and Scottish (5 | 4.1%), together accounting for 54.5% of all Raywick residents.
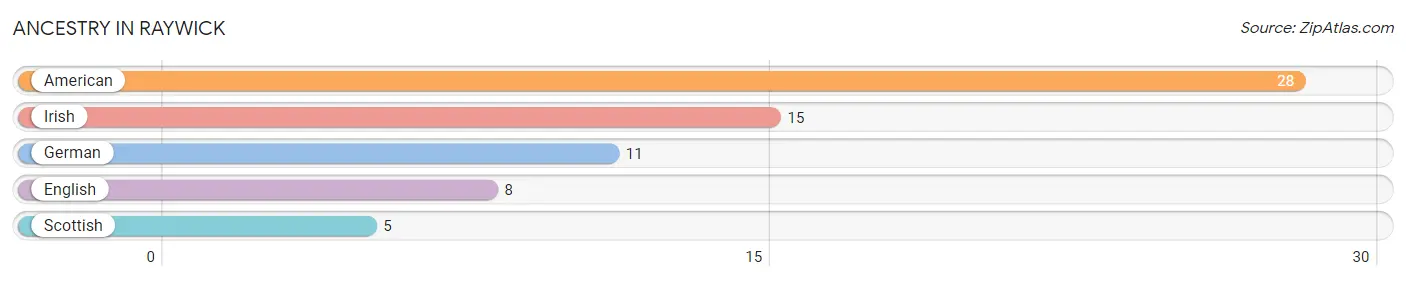
| Ancestry | # Population | % Population |
| American | 28 | 22.8% |
| English | 8 | 6.5% |
| German | 11 | 8.9% |
| Irish | 15 | 12.2% |
| Scottish | 5 | 4.1% | View All 5 Rows |
Immigrants in Raywick

| Immigration Origin | # Population | % Population | View All 0 Rows |
Sex and Age in Raywick
Sex and Age in Raywick
The most populous age groups in Raywick are 20 to 24 Years (16 | 22.5%) for men and 60 to 64 Years (8 | 15.4%) for women.
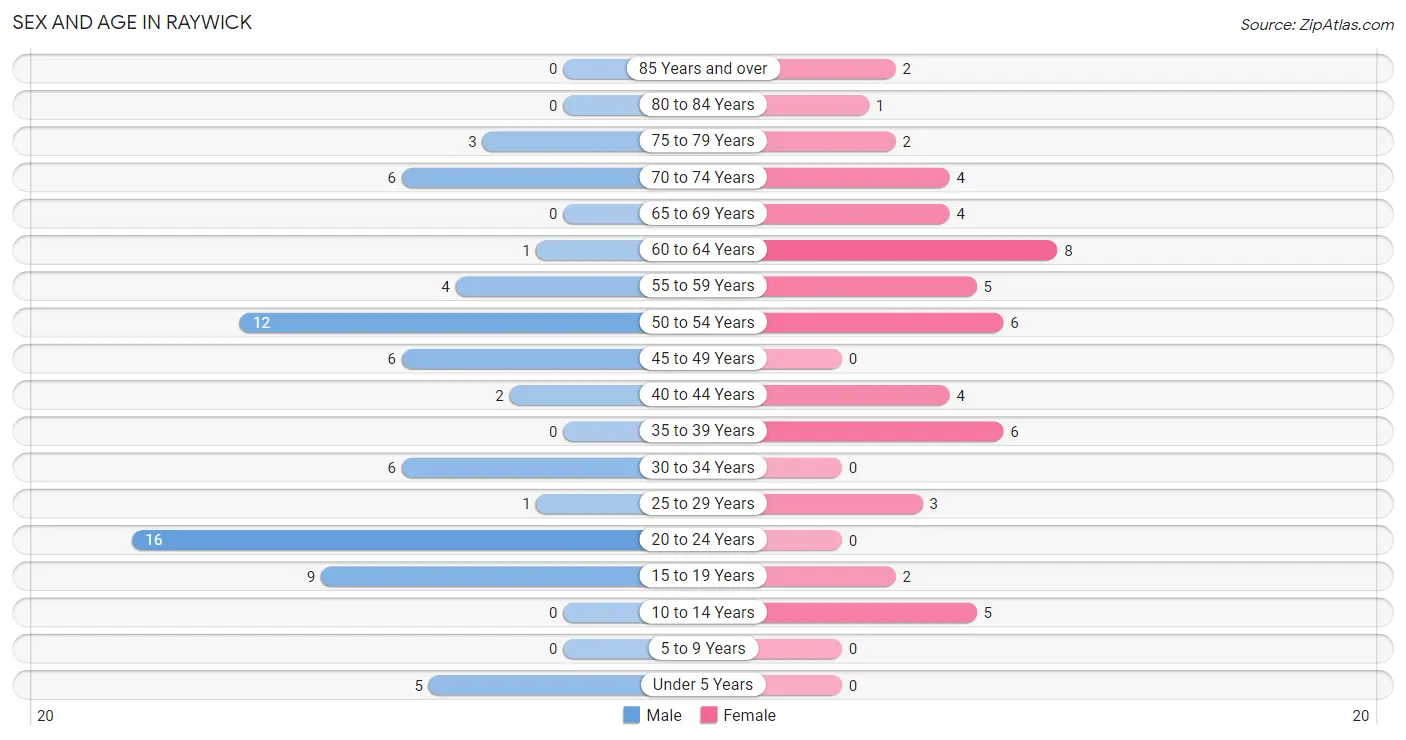
| Age Bracket | Male | Female |
| Under 5 Years | 5 (7.0%) | 0 (0.0%) |
| 5 to 9 Years | 0 (0.0%) | 0 (0.0%) |
| 10 to 14 Years | 0 (0.0%) | 5 (9.6%) |
| 15 to 19 Years | 9 (12.7%) | 2 (3.8%) |
| 20 to 24 Years | 16 (22.5%) | 0 (0.0%) |
| 25 to 29 Years | 1 (1.4%) | 3 (5.8%) |
| 30 to 34 Years | 6 (8.5%) | 0 (0.0%) |
| 35 to 39 Years | 0 (0.0%) | 6 (11.5%) |
| 40 to 44 Years | 2 (2.8%) | 4 (7.7%) |
| 45 to 49 Years | 6 (8.5%) | 0 (0.0%) |
| 50 to 54 Years | 12 (16.9%) | 6 (11.5%) |
| 55 to 59 Years | 4 (5.6%) | 5 (9.6%) |
| 60 to 64 Years | 1 (1.4%) | 8 (15.4%) |
| 65 to 69 Years | 0 (0.0%) | 4 (7.7%) |
| 70 to 74 Years | 6 (8.5%) | 4 (7.7%) |
| 75 to 79 Years | 3 (4.2%) | 2 (3.8%) |
| 80 to 84 Years | 0 (0.0%) | 1 (1.9%) |
| 85 Years and over | 0 (0.0%) | 2 (3.8%) |
| Total | 71 (100.0%) | 52 (100.0%) |
Families and Households in Raywick
Median Family Size in Raywick
The median family size in Raywick is 2.37 persons per family, with married-couple families (19 | 50.0%) accounting for the largest median family size of 2.53 persons per family. On the other hand, single male/father families (13 | 34.2%) represent the smallest median family size with 2.15 persons per family.
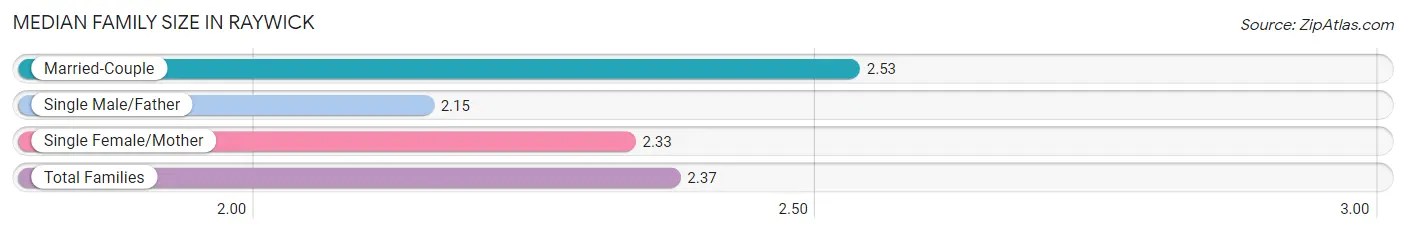
| Family Type | # Families | Family Size |
| Married-Couple | 19 (50.0%) | 2.53 |
| Single Male/Father | 13 (34.2%) | 2.15 |
| Single Female/Mother | 6 (15.8%) | 2.33 |
| Total Families | 38 (100.0%) | 2.37 |
Median Household Size in Raywick
The median household size in Raywick is 1.81 persons per household, with married-couple households (19 | 27.9%) accounting for the largest median household size of 2.53 persons per household. non-family households (30 | 44.1%) represent the smallest median household size with 1.07 persons per household.
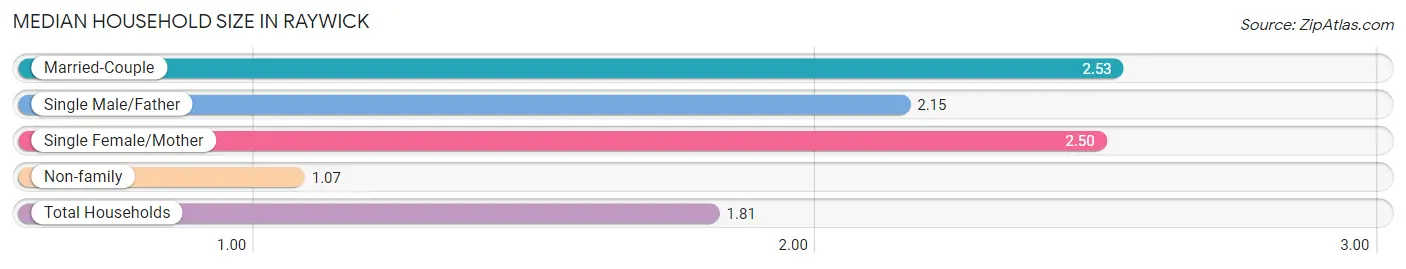
| Household Type | # Households | Household Size |
| Married-Couple | 19 (27.9%) | 2.53 |
| Single Male/Father | 13 (19.1%) | 2.15 |
| Single Female/Mother | 6 (8.8%) | 2.50 |
| Non-family | 30 (44.1%) | 1.07 |
| Total Households | 68 (100.0%) | 1.81 |
Household Size by Marriage Status in Raywick
Out of a total of 68 households in Raywick, 38 (55.9%) are family households, while 30 (44.1%) are nonfamily households. The most numerous type of family households are 2-person households, comprising 25, and the most common type of nonfamily households are 1-person households, comprising 28.
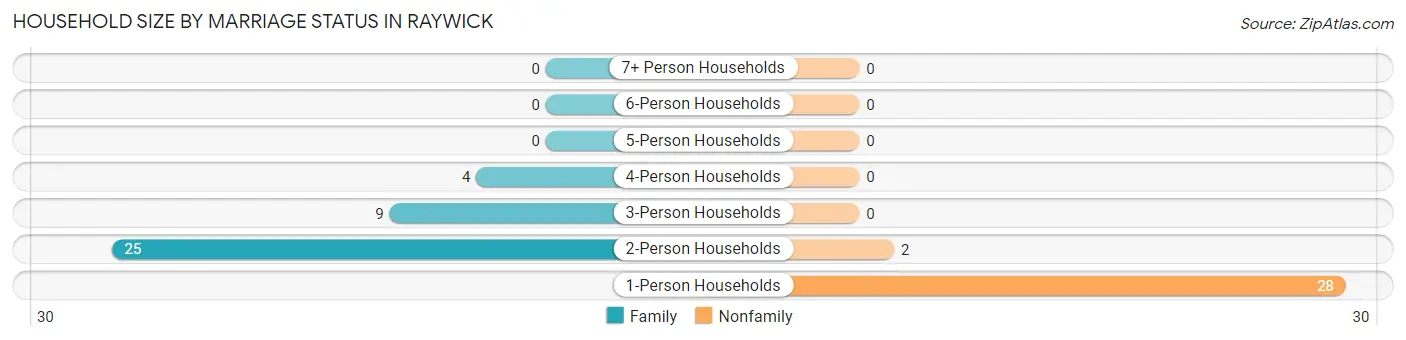
| Household Size | Family Households | Nonfamily Households |
| 1-Person Households | - | 28 (41.2%) |
| 2-Person Households | 25 (36.8%) | 2 (2.9%) |
| 3-Person Households | 9 (13.2%) | 0 (0.0%) |
| 4-Person Households | 4 (5.9%) | 0 (0.0%) |
| 5-Person Households | 0 (0.0%) | 0 (0.0%) |
| 6-Person Households | 0 (0.0%) | 0 (0.0%) |
| 7+ Person Households | 0 (0.0%) | 0 (0.0%) |
| Total | 38 (55.9%) | 30 (44.1%) |
Female Fertility in Raywick
Fertility by Age in Raywick
| Age Bracket | Women with Births | Births / 1,000 Women |
| 15 to 19 years | 0 (0.0%) | 0.0 |
| 20 to 34 years | 0 (0.0%) | 0.0 |
| 35 to 50 years | 0 (0.0%) | 0.0 |
| Total | 0 (0.0%) | 0.0 |
Fertility by Age by Marriage Status in Raywick
| Age Bracket | Married | Unmarried |
| 15 to 19 years | 0 (0.0%) | 0 (0.0%) |
| 20 to 34 years | 0 (0.0%) | 0 (0.0%) |
| 35 to 50 years | 0 (0.0%) | 0 (0.0%) |
| Total | 0 (0.0%) | 0 (0.0%) |
Fertility by Education in Raywick
| Educational Attainment | Women with Births | Births / 1,000 Women |
| Less than High School | 0 (0.0%) | 0.0 |
| High School Diploma | 0 (0.0%) | 0.0 |
| College or Associate's Degree | 0 (0.0%) | 0.0 |
| Bachelor's Degree | 0 (0.0%) | 0.0 |
| Graduate Degree | 0 (0.0%) | 0.0 |
| Total | 0 (0.0%) | 0.0 |
Fertility by Education by Marriage Status in Raywick
| Educational Attainment | Married | Unmarried |
| Less than High School | 0 (0.0%) | 0 (0.0%) |
| High School Diploma | 0 (0.0%) | 0 (0.0%) |
| College or Associate's Degree | 0 (0.0%) | 0 (0.0%) |
| Bachelor's Degree | 0 (0.0%) | 0 (0.0%) |
| Graduate Degree | 0 (0.0%) | 0 (0.0%) |
| Total | 0 (0.0%) | 0 (0.0%) |
Employment Characteristics in Raywick
Employment by Class of Employer in Raywick
Among the 61 employed individuals in Raywick, private company employees (48 | 78.7%), not-for-profit organizations (7 | 11.5%), and self-employed (not incorporated) (5 | 8.2%) make up the most common classes of employment.
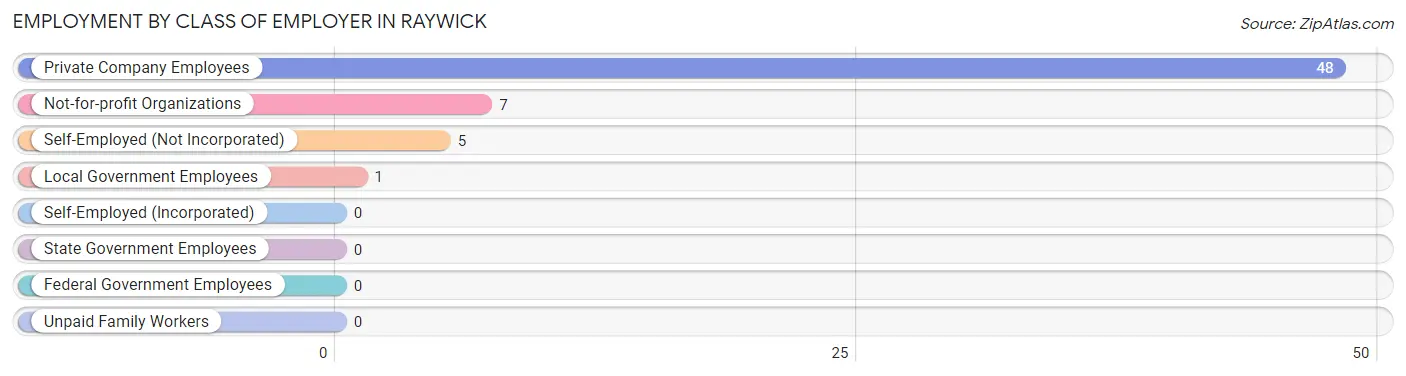
| Employer Class | # Employees | % Employees |
| Private Company Employees | 48 | 78.7% |
| Self-Employed (Incorporated) | 0 | 0.0% |
| Self-Employed (Not Incorporated) | 5 | 8.2% |
| Not-for-profit Organizations | 7 | 11.5% |
| Local Government Employees | 1 | 1.6% |
| State Government Employees | 0 | 0.0% |
| Federal Government Employees | 0 | 0.0% |
| Unpaid Family Workers | 0 | 0.0% |
| Total | 61 | 100.0% |
Employment Status by Age in Raywick
According to the labor force statistics for Raywick, out of the total population over 16 years of age (113), 54.9% or 62 individuals are in the labor force, with 1.6% or 1 of them unemployed. The age group with the highest labor force participation rate is 25 to 29 years, with 100.0% or 4 individuals in the labor force. Within the labor force, the 55 to 59 years age range has the highest percentage of unemployed individuals, with 50.0% or 1 of them being unemployed.
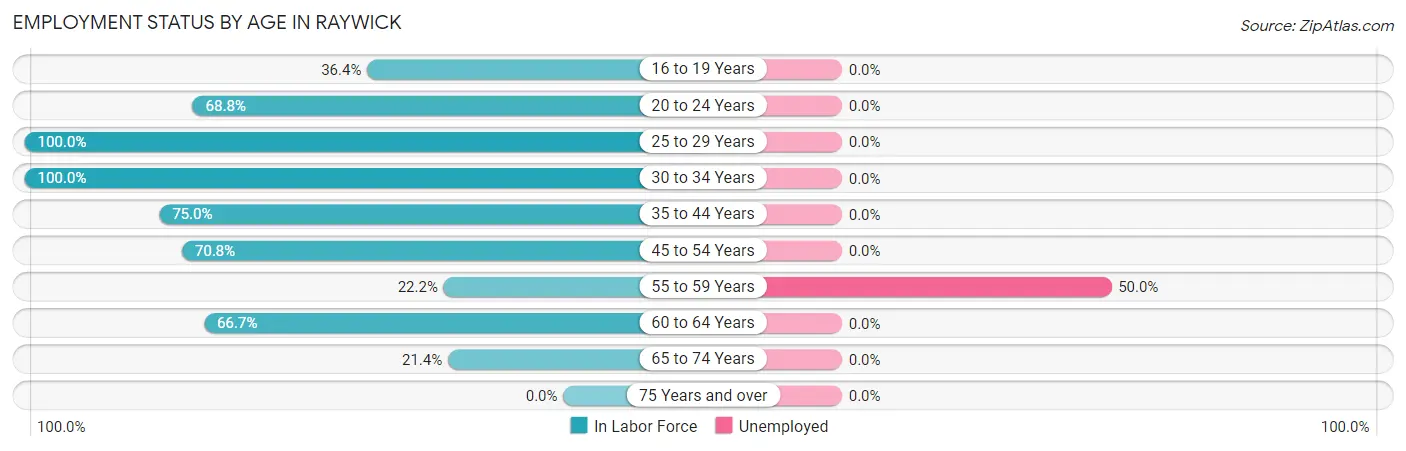
| Age Bracket | In Labor Force | Unemployed |
| 16 to 19 Years | 4 (36.4%) | 0 (0.0%) |
| 20 to 24 Years | 11 (68.8%) | 0 (0.0%) |
| 25 to 29 Years | 4 (100.0%) | 0 (0.0%) |
| 30 to 34 Years | 6 (100.0%) | 0 (0.0%) |
| 35 to 44 Years | 9 (75.0%) | 0 (0.0%) |
| 45 to 54 Years | 17 (70.8%) | 0 (0.0%) |
| 55 to 59 Years | 2 (22.2%) | 1 (50.0%) |
| 60 to 64 Years | 6 (66.7%) | 0 (0.0%) |
| 65 to 74 Years | 3 (21.4%) | 0 (0.0%) |
| 75 Years and over | 0 (0.0%) | 0 (0.0%) |
| Total | 62 (54.9%) | 1 (1.6%) |
Employment Status by Educational Attainment in Raywick
According to labor force statistics for Raywick, 68.8% of individuals (44) out of the total population between 25 and 64 years of age (64) are in the labor force, with 2.3% or 1 of them being unemployed. The group with the highest labor force participation rate are those with the educational attainment of high school diploma, with 80.0% or 28 individuals in the labor force. Within the labor force, individuals with high school diploma education have the highest percentage of unemployment, with 3.6% or 1 of them being unemployed.
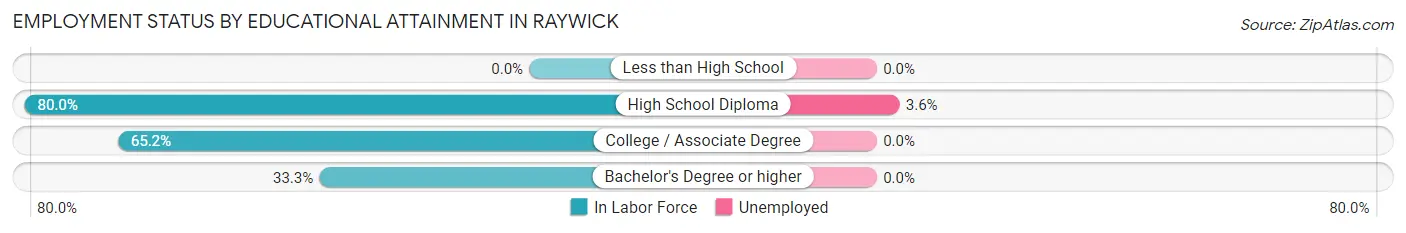
| Educational Attainment | In Labor Force | Unemployed |
| Less than High School | 0 (0.0%) | 0 (0.0%) |
| High School Diploma | 28 (80.0%) | 1 (3.6%) |
| College / Associate Degree | 15 (65.2%) | 0 (0.0%) |
| Bachelor's Degree or higher | 1 (33.3%) | 0 (0.0%) |
| Total | 44 (68.8%) | 1 (2.3%) |
Employment Occupations by Sex in Raywick
Management, Business, Science and Arts Occupations
The most common Management, Business, Science and Arts occupations in Raywick are Management (9 | 14.7%), Computers, Engineering & Science (3 | 4.9%), Architecture & Engineering (3 | 4.9%), and Health Diagnosing & Treating (2 | 3.3%).
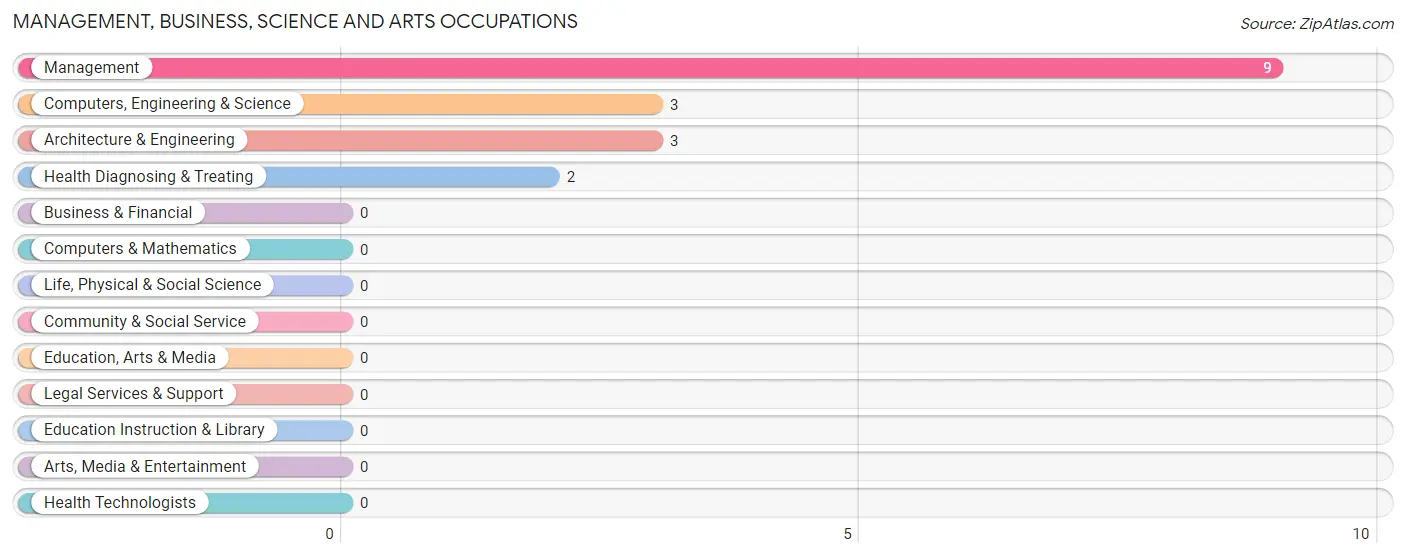
Management, Business, Science and Arts Occupations by Sex
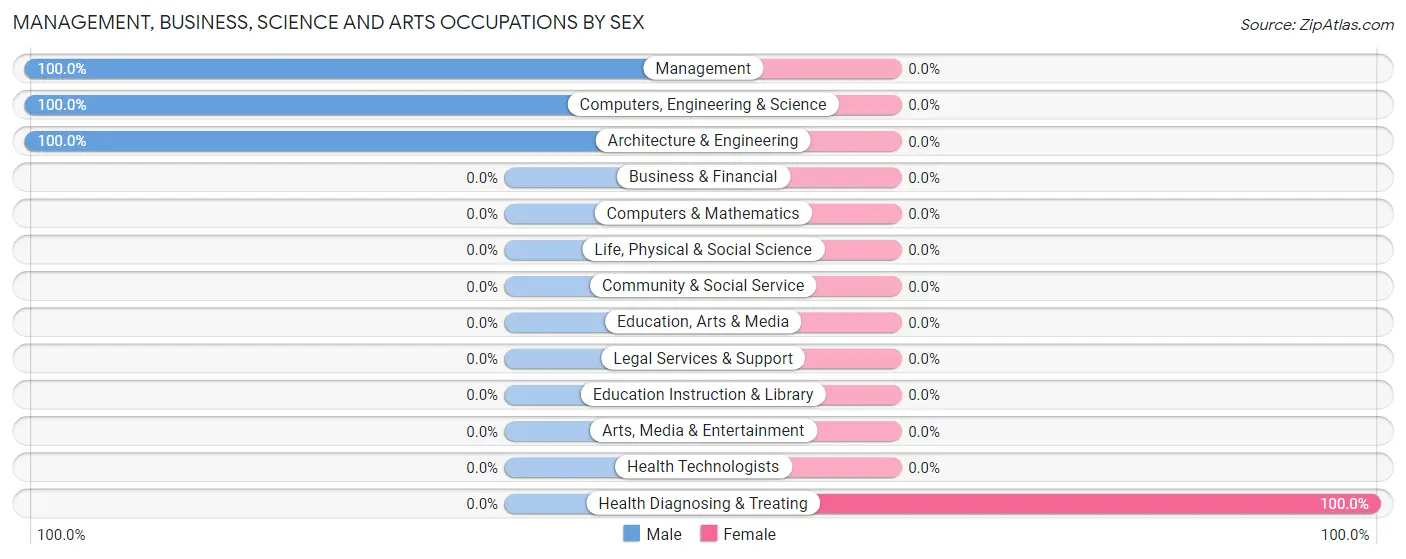
| Occupation | Male | Female |
| Management | 9 (100.0%) | 0 (0.0%) |
| Business & Financial | 0 (0.0%) | 0 (0.0%) |
| Computers, Engineering & Science | 3 (100.0%) | 0 (0.0%) |
| Computers & Mathematics | 0 (0.0%) | 0 (0.0%) |
| Architecture & Engineering | 3 (100.0%) | 0 (0.0%) |
| Life, Physical & Social Science | 0 (0.0%) | 0 (0.0%) |
| Community & Social Service | 0 (0.0%) | 0 (0.0%) |
| Education, Arts & Media | 0 (0.0%) | 0 (0.0%) |
| Legal Services & Support | 0 (0.0%) | 0 (0.0%) |
| Education Instruction & Library | 0 (0.0%) | 0 (0.0%) |
| Arts, Media & Entertainment | 0 (0.0%) | 0 (0.0%) |
| Health Diagnosing & Treating | 0 (0.0%) | 2 (100.0%) |
| Health Technologists | 0 (0.0%) | 0 (0.0%) |
| Total (Category) | 12 (85.7%) | 2 (14.3%) |
| Total (Overall) | 36 (59.0%) | 25 (41.0%) |
Services Occupations
The most common Services occupations in Raywick are , and Food Preparation & Serving (3 | 4.9%).
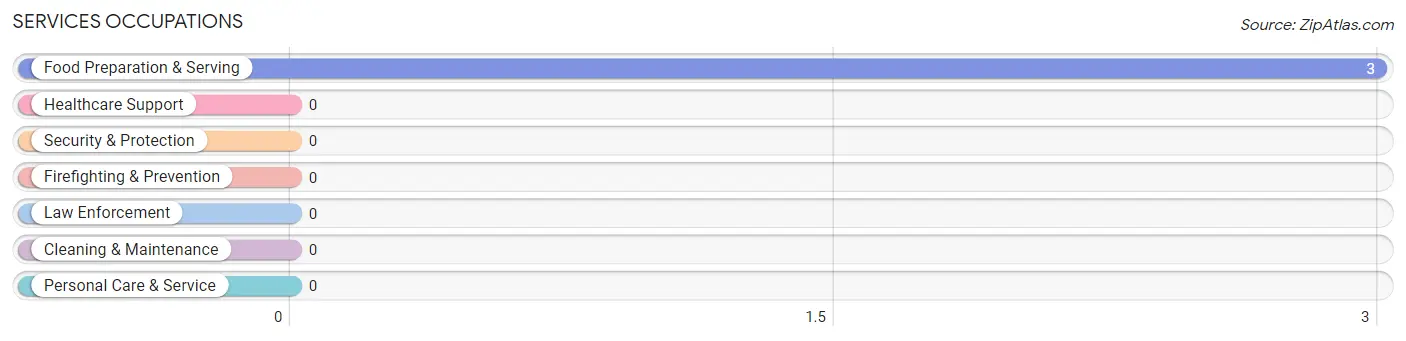
Services Occupations by Sex
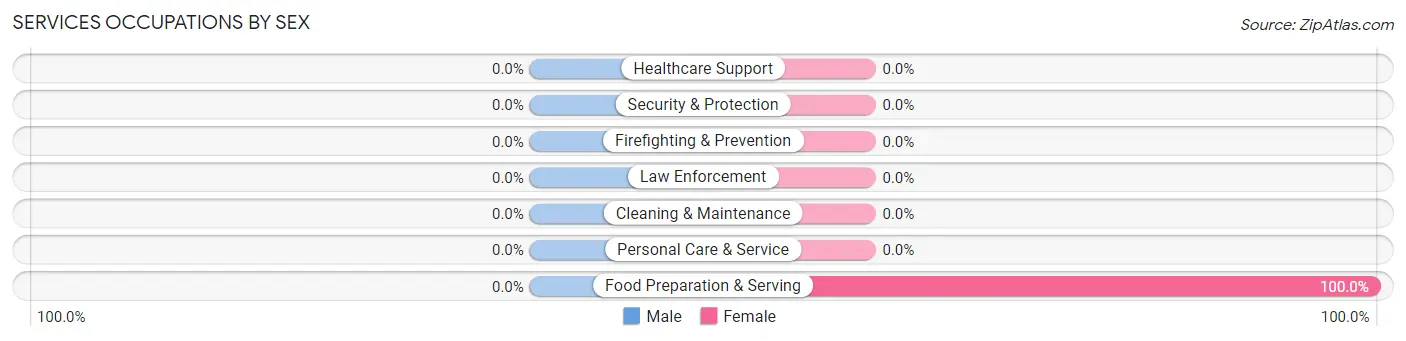
| Occupation | Male | Female |
| Healthcare Support | 0 (0.0%) | 0 (0.0%) |
| Security & Protection | 0 (0.0%) | 0 (0.0%) |
| Firefighting & Prevention | 0 (0.0%) | 0 (0.0%) |
| Law Enforcement | 0 (0.0%) | 0 (0.0%) |
| Food Preparation & Serving | 0 (0.0%) | 3 (100.0%) |
| Cleaning & Maintenance | 0 (0.0%) | 0 (0.0%) |
| Personal Care & Service | 0 (0.0%) | 0 (0.0%) |
| Total (Category) | 0 (0.0%) | 3 (100.0%) |
| Total (Overall) | 36 (59.0%) | 25 (41.0%) |
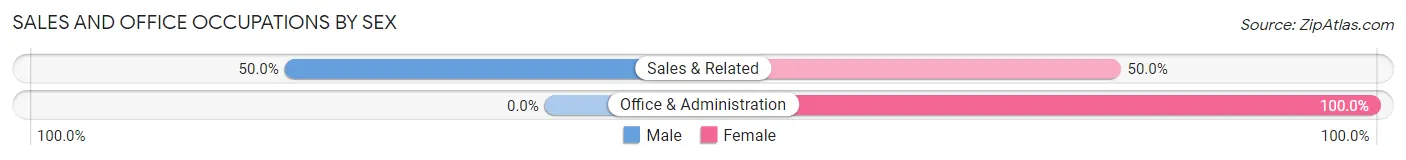
Sales and Office Occupations
The most common Sales and Office occupations in Raywick are Office & Administration (11 | 18.0%), and Sales & Related (2 | 3.3%).
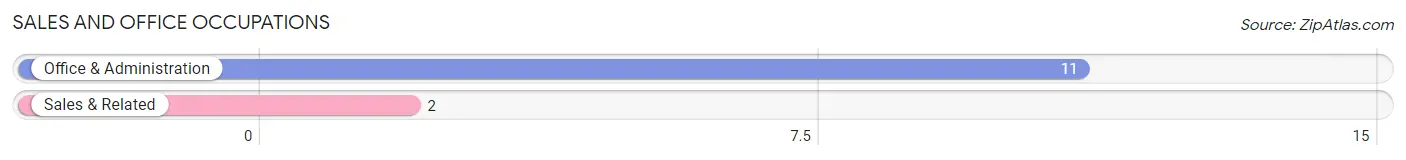
Sales and Office Occupations by Sex
| Occupation | Male | Female |
| Sales & Related | 1 (50.0%) | 1 (50.0%) |
| Office & Administration | 0 (0.0%) | 11 (100.0%) |
| Total (Category) | 1 (7.7%) | 12 (92.3%) |
| Total (Overall) | 36 (59.0%) | 25 (41.0%) |
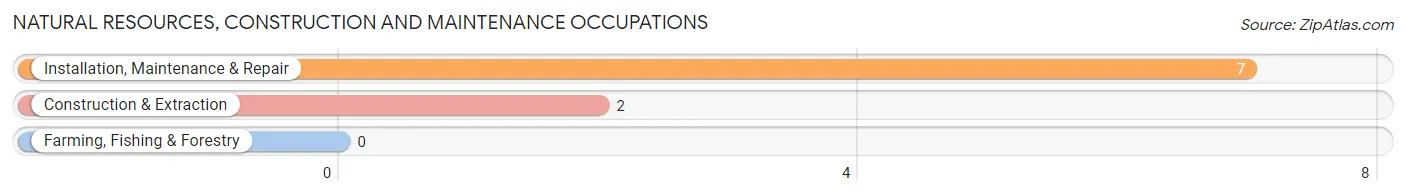
Natural Resources, Construction and Maintenance Occupations
The most common Natural Resources, Construction and Maintenance occupations in Raywick are Installation, Maintenance & Repair (7 | 11.5%), and Construction & Extraction (2 | 3.3%).
Natural Resources, Construction and Maintenance Occupations by Sex
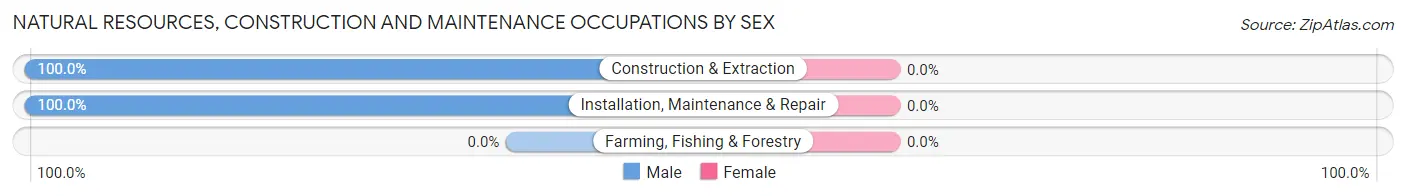
| Occupation | Male | Female |
| Farming, Fishing & Forestry | 0 (0.0%) | 0 (0.0%) |
| Construction & Extraction | 2 (100.0%) | 0 (0.0%) |
| Installation, Maintenance & Repair | 7 (100.0%) | 0 (0.0%) |
| Total (Category) | 9 (100.0%) | 0 (0.0%) |
| Total (Overall) | 36 (59.0%) | 25 (41.0%) |
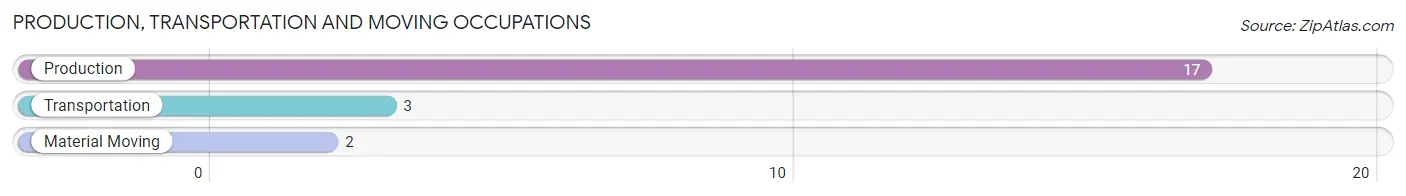
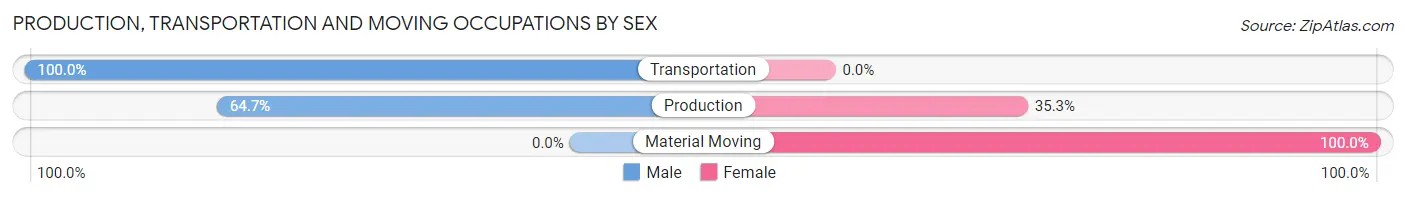
Production, Transportation and Moving Occupations
The most common Production, Transportation and Moving occupations in Raywick are Production (17 | 27.9%), Transportation (3 | 4.9%), and Material Moving (2 | 3.3%).
Production, Transportation and Moving Occupations by Sex
| Occupation | Male | Female |
| Production | 11 (64.7%) | 6 (35.3%) |
| Transportation | 3 (100.0%) | 0 (0.0%) |
| Material Moving | 0 (0.0%) | 2 (100.0%) |
| Total (Category) | 14 (63.6%) | 8 (36.4%) |
| Total (Overall) | 36 (59.0%) | 25 (41.0%) |
Employment Industries by Sex in Raywick
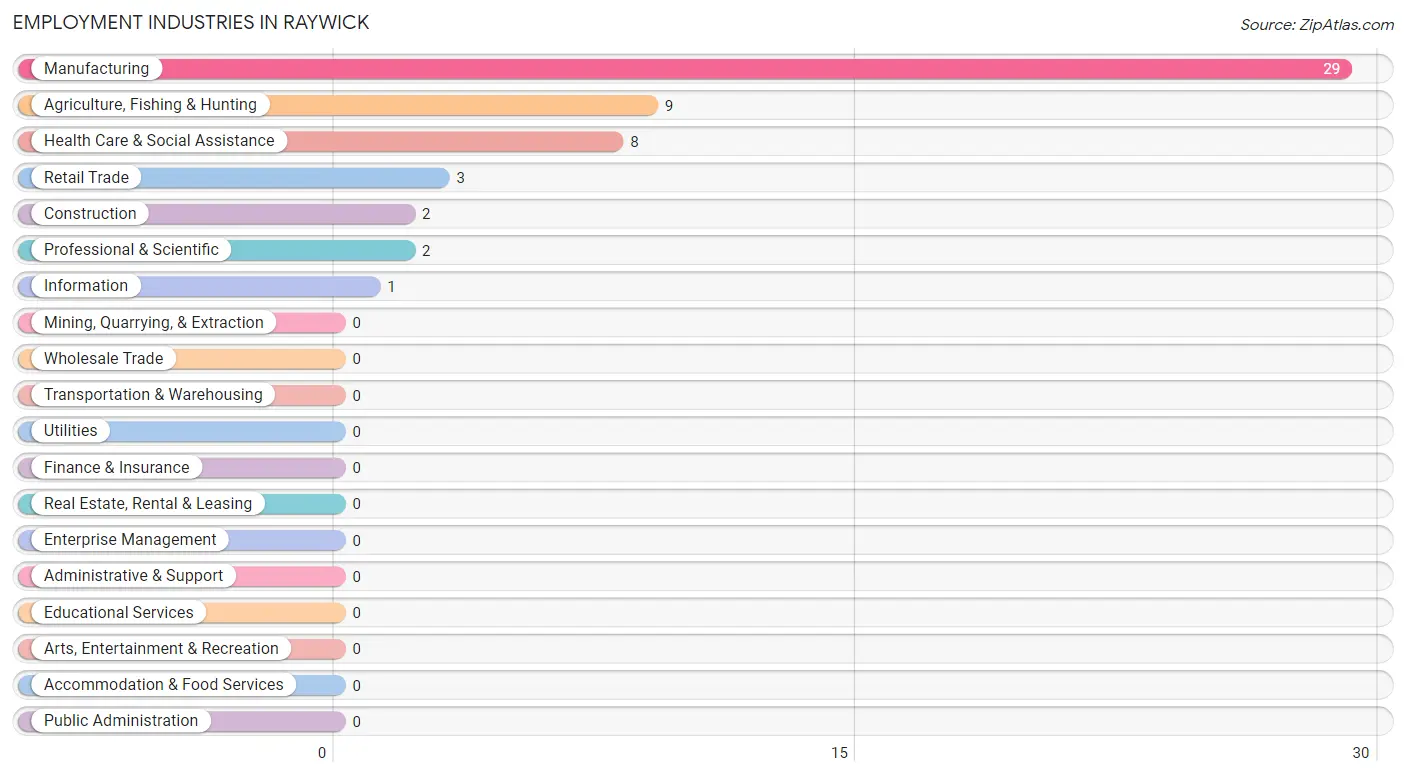
Employment Industries in Raywick
The major employment industries in Raywick include Manufacturing (29 | 47.5%), Agriculture, Fishing & Hunting (9 | 14.7%), Health Care & Social Assistance (8 | 13.1%), Retail Trade (3 | 4.9%), and Construction (2 | 3.3%).
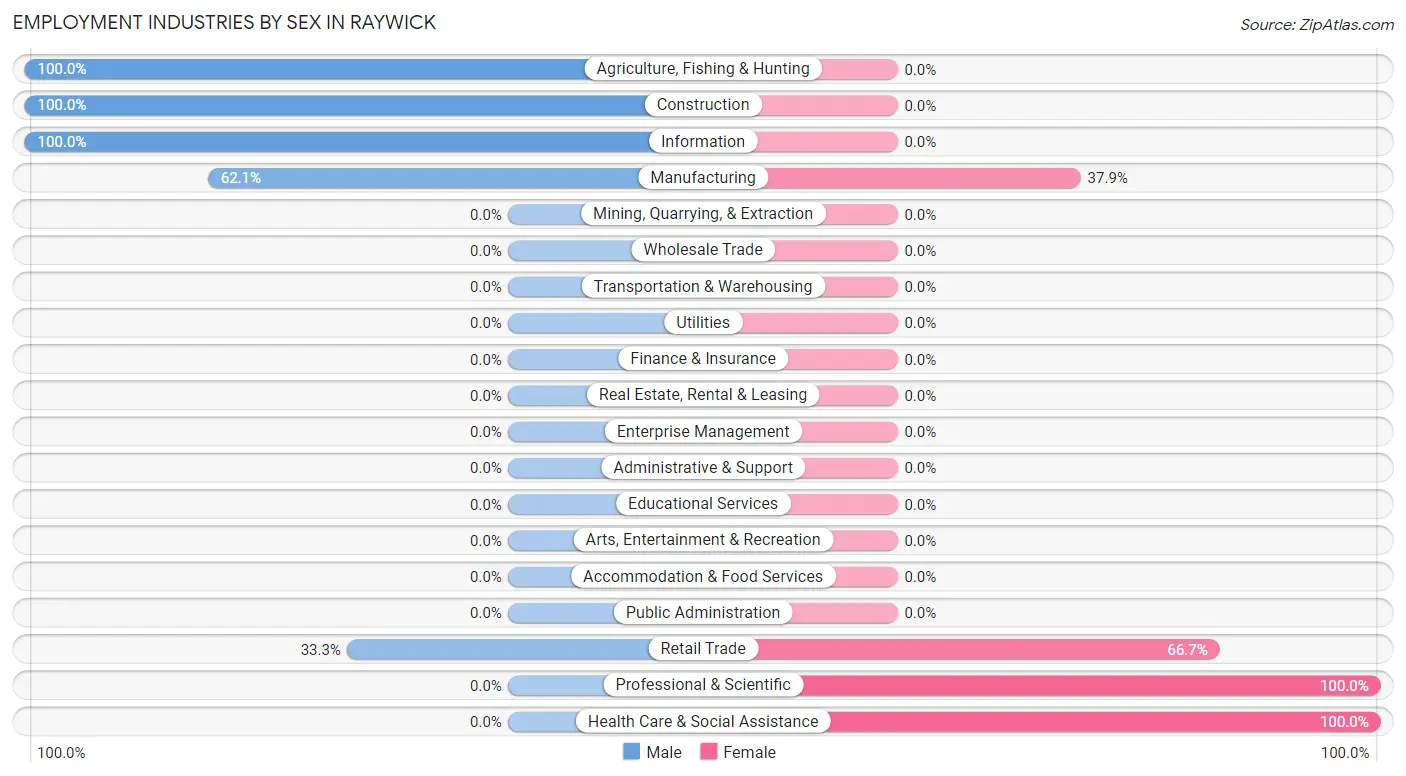
Employment Industries by Sex in Raywick
The Raywick industries that see more men than women are Agriculture, Fishing & Hunting (100.0%), Construction (100.0%), and Information (100.0%), whereas the industries that tend to have a higher number of women are Professional & Scientific (100.0%), Health Care & Social Assistance (100.0%), and Retail Trade (66.7%).
| Industry | Male | Female |
| Agriculture, Fishing & Hunting | 9 (100.0%) | 0 (0.0%) |
| Mining, Quarrying, & Extraction | 0 (0.0%) | 0 (0.0%) |
| Construction | 2 (100.0%) | 0 (0.0%) |
| Manufacturing | 18 (62.1%) | 11 (37.9%) |
| Wholesale Trade | 0 (0.0%) | 0 (0.0%) |
| Retail Trade | 1 (33.3%) | 2 (66.7%) |
| Transportation & Warehousing | 0 (0.0%) | 0 (0.0%) |
| Utilities | 0 (0.0%) | 0 (0.0%) |
| Information | 1 (100.0%) | 0 (0.0%) |
| Finance & Insurance | 0 (0.0%) | 0 (0.0%) |
| Real Estate, Rental & Leasing | 0 (0.0%) | 0 (0.0%) |
| Professional & Scientific | 0 (0.0%) | 2 (100.0%) |
| Enterprise Management | 0 (0.0%) | 0 (0.0%) |
| Administrative & Support | 0 (0.0%) | 0 (0.0%) |
| Educational Services | 0 (0.0%) | 0 (0.0%) |
| Health Care & Social Assistance | 0 (0.0%) | 8 (100.0%) |
| Arts, Entertainment & Recreation | 0 (0.0%) | 0 (0.0%) |
| Accommodation & Food Services | 0 (0.0%) | 0 (0.0%) |
| Public Administration | 0 (0.0%) | 0 (0.0%) |
| Total | 36 (59.0%) | 25 (41.0%) |
Education in Raywick
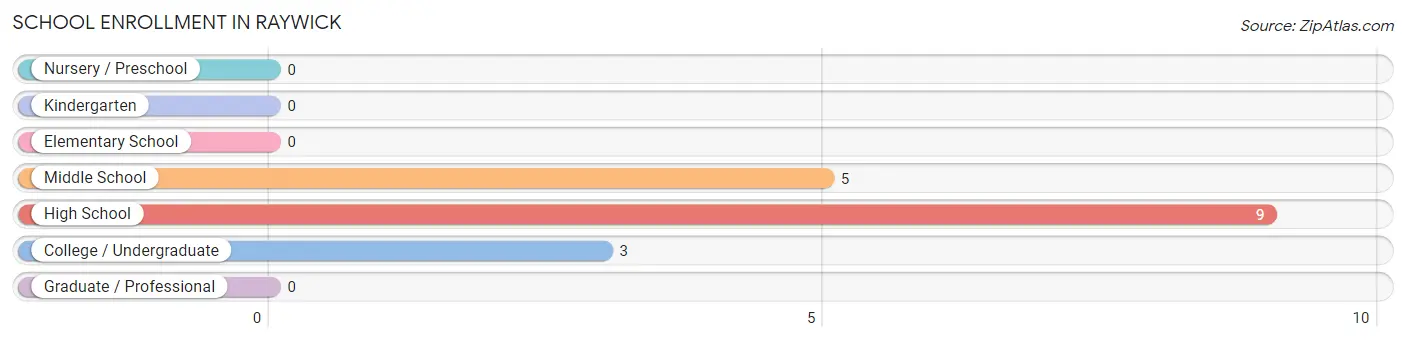
School Enrollment in Raywick
The most common levels of schooling among the 17 students in Raywick are high school (9 | 52.9%), middle school (5 | 29.4%), and college / undergraduate (3 | 17.6%).
| School Level | # Students | % Students |
| Nursery / Preschool | 0 | 0.0% |
| Kindergarten | 0 | 0.0% |
| Elementary School | 0 | 0.0% |
| Middle School | 5 | 29.4% |
| High School | 9 | 52.9% |
| College / Undergraduate | 3 | 17.6% |
| Graduate / Professional | 0 | 0.0% |
| Total | 17 | 100.0% |
School Enrollment by Age by Funding Source in Raywick
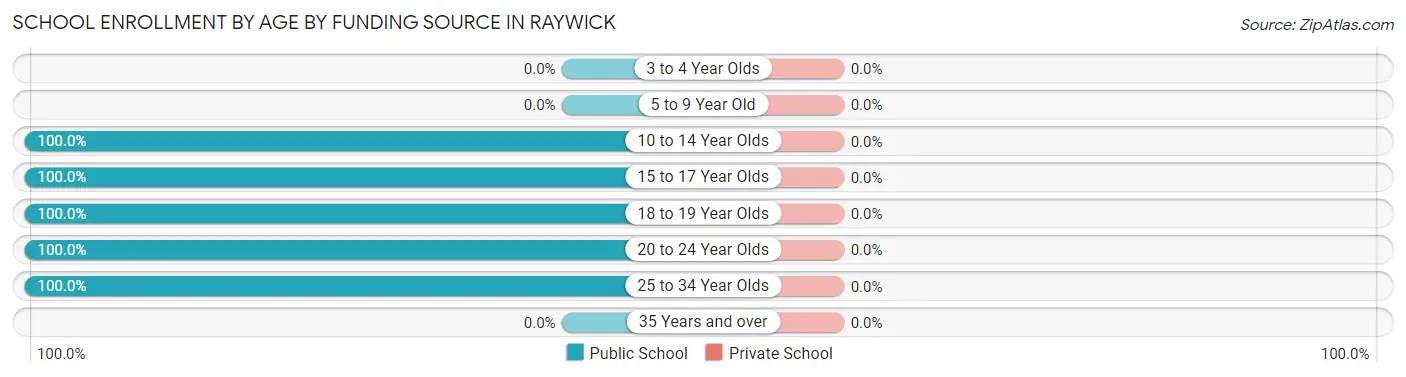
| Age Bracket | Public School | Private School |
| 3 to 4 Year Olds | 0 (0.0%) | 0 (0.0%) |
| 5 to 9 Year Old | 0 (0.0%) | 0 (0.0%) |
| 10 to 14 Year Olds | 5 (100.0%) | 0 (0.0%) |
| 15 to 17 Year Olds | 3 (100.0%) | 0 (0.0%) |
| 18 to 19 Year Olds | 6 (100.0%) | 0 (0.0%) |
| 20 to 24 Year Olds | 2 (100.0%) | 0 (0.0%) |
| 25 to 34 Year Olds | 1 (100.0%) | 0 (0.0%) |
| 35 Years and over | 0 (0.0%) | 0 (0.0%) |
| Total | 17 (100.0%) | 0 (0.0%) |
Educational Attainment by Field of Study in Raywick
Business (2 | 66.7%), and arts & humanities (1 | 33.3%) are the most common fields of study among 3 individuals in Raywick who have obtained a bachelor's degree or higher.
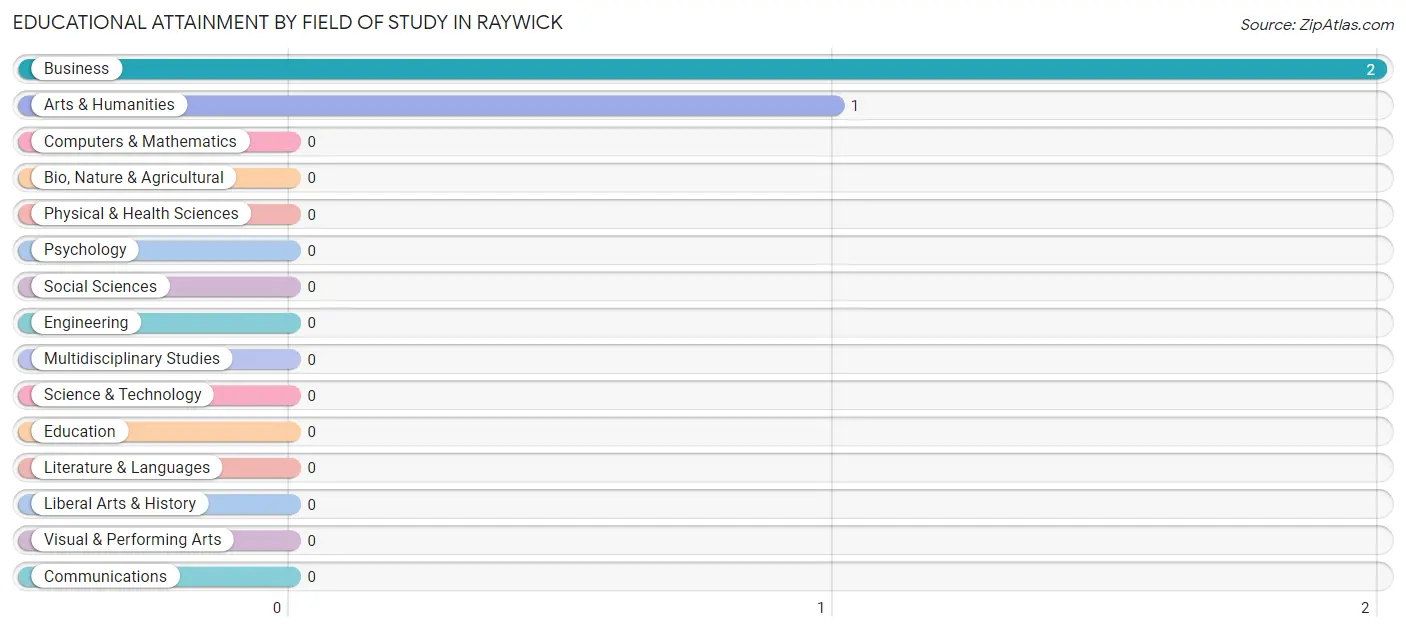
| Field of Study | # Graduates | % Graduates |
| Computers & Mathematics | 0 | 0.0% |
| Bio, Nature & Agricultural | 0 | 0.0% |
| Physical & Health Sciences | 0 | 0.0% |
| Psychology | 0 | 0.0% |
| Social Sciences | 0 | 0.0% |
| Engineering | 0 | 0.0% |
| Multidisciplinary Studies | 0 | 0.0% |
| Science & Technology | 0 | 0.0% |
| Business | 2 | 66.7% |
| Education | 0 | 0.0% |
| Literature & Languages | 0 | 0.0% |
| Liberal Arts & History | 0 | 0.0% |
| Visual & Performing Arts | 0 | 0.0% |
| Communications | 0 | 0.0% |
| Arts & Humanities | 1 | 33.3% |
| Total | 3 | 100.0% |
Transportation & Commute in Raywick
Vehicle Availability by Sex in Raywick
The most prevalent vehicle ownership categories in Raywick are males with 3 vehicles (15, accounting for 41.7%) and females with 3 vehicles (6, making up 60.0%).
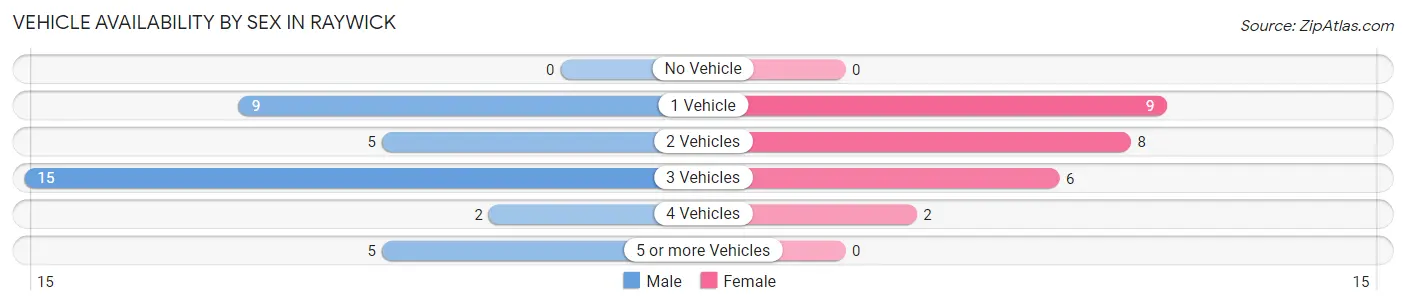
| Vehicles Available | Male | Female |
| No Vehicle | 0 (0.0%) | 0 (0.0%) |
| 1 Vehicle | 9 (25.0%) | 9 (36.0%) |
| 2 Vehicles | 5 (13.9%) | 8 (32.0%) |
| 3 Vehicles | 15 (41.7%) | 6 (24.0%) |
| 4 Vehicles | 2 (5.6%) | 2 (8.0%) |
| 5 or more Vehicles | 5 (13.9%) | 0 (0.0%) |
| Total | 36 (100.0%) | 25 (100.0%) |
Commute Time in Raywick
The most frequently occuring commute durations in Raywick are 15 to 19 minutes (24 commuters, 39.3%), 25 to 29 minutes (11 commuters, 18.0%), and 30 to 34 minutes (7 commuters, 11.5%).
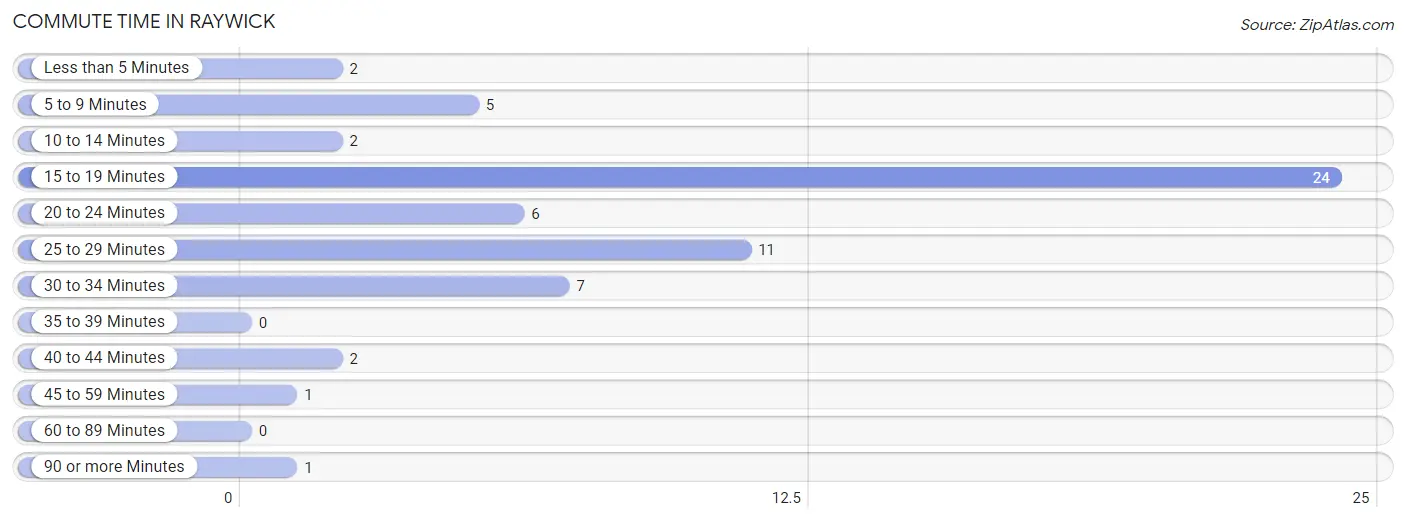
| Commute Time | # Commuters | % Commuters |
| Less than 5 Minutes | 2 | 3.3% |
| 5 to 9 Minutes | 5 | 8.2% |
| 10 to 14 Minutes | 2 | 3.3% |
| 15 to 19 Minutes | 24 | 39.3% |
| 20 to 24 Minutes | 6 | 9.8% |
| 25 to 29 Minutes | 11 | 18.0% |
| 30 to 34 Minutes | 7 | 11.5% |
| 35 to 39 Minutes | 0 | 0.0% |
| 40 to 44 Minutes | 2 | 3.3% |
| 45 to 59 Minutes | 1 | 1.6% |
| 60 to 89 Minutes | 0 | 0.0% |
| 90 or more Minutes | 1 | 1.6% |
Commute Time by Sex in Raywick
The most common commute times in Raywick are 15 to 19 minutes (13 commuters, 36.1%) for males and 15 to 19 minutes (11 commuters, 44.0%) for females.
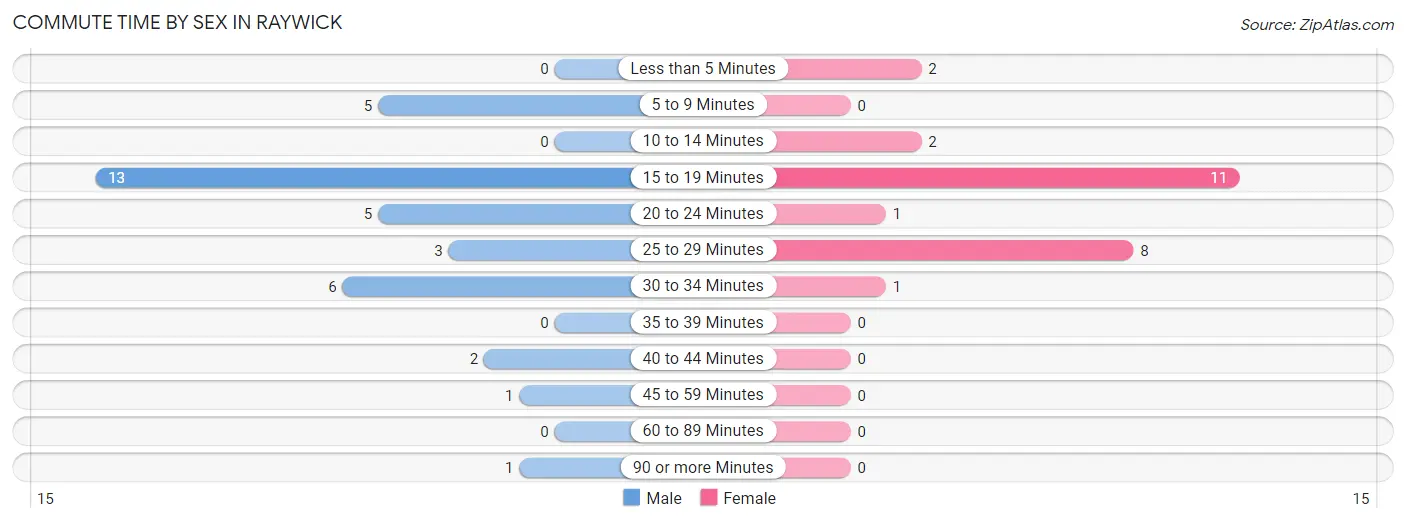
| Commute Time | Male | Female |
| Less than 5 Minutes | 0 (0.0%) | 2 (8.0%) |
| 5 to 9 Minutes | 5 (13.9%) | 0 (0.0%) |
| 10 to 14 Minutes | 0 (0.0%) | 2 (8.0%) |
| 15 to 19 Minutes | 13 (36.1%) | 11 (44.0%) |
| 20 to 24 Minutes | 5 (13.9%) | 1 (4.0%) |
| 25 to 29 Minutes | 3 (8.3%) | 8 (32.0%) |
| 30 to 34 Minutes | 6 (16.7%) | 1 (4.0%) |
| 35 to 39 Minutes | 0 (0.0%) | 0 (0.0%) |
| 40 to 44 Minutes | 2 (5.6%) | 0 (0.0%) |
| 45 to 59 Minutes | 1 (2.8%) | 0 (0.0%) |
| 60 to 89 Minutes | 0 (0.0%) | 0 (0.0%) |
| 90 or more Minutes | 1 (2.8%) | 0 (0.0%) |
Time of Departure to Work by Sex in Raywick
The most frequent times of departure to work in Raywick are 6:30 AM to 6:59 AM (13, 36.1%) for males and 8:00 AM to 8:29 AM (7, 28.0%) for females.
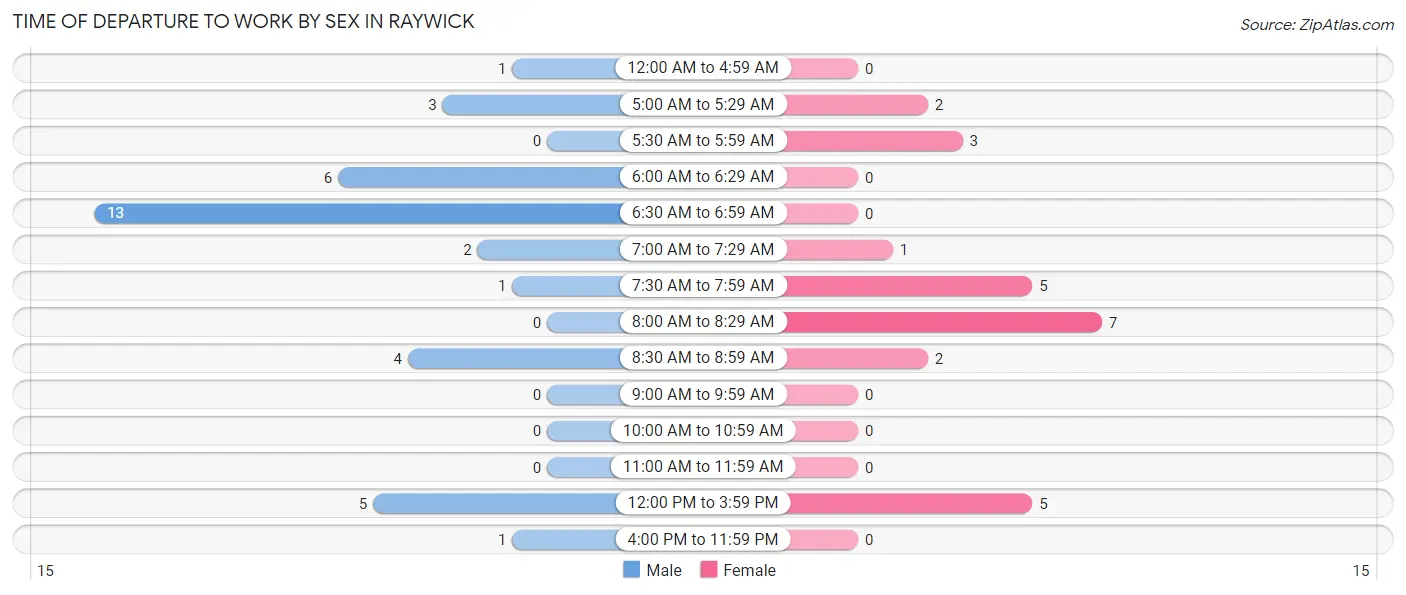
| Time of Departure | Male | Female |
| 12:00 AM to 4:59 AM | 1 (2.8%) | 0 (0.0%) |
| 5:00 AM to 5:29 AM | 3 (8.3%) | 2 (8.0%) |
| 5:30 AM to 5:59 AM | 0 (0.0%) | 3 (12.0%) |
| 6:00 AM to 6:29 AM | 6 (16.7%) | 0 (0.0%) |
| 6:30 AM to 6:59 AM | 13 (36.1%) | 0 (0.0%) |
| 7:00 AM to 7:29 AM | 2 (5.6%) | 1 (4.0%) |
| 7:30 AM to 7:59 AM | 1 (2.8%) | 5 (20.0%) |
| 8:00 AM to 8:29 AM | 0 (0.0%) | 7 (28.0%) |
| 8:30 AM to 8:59 AM | 4 (11.1%) | 2 (8.0%) |
| 9:00 AM to 9:59 AM | 0 (0.0%) | 0 (0.0%) |
| 10:00 AM to 10:59 AM | 0 (0.0%) | 0 (0.0%) |
| 11:00 AM to 11:59 AM | 0 (0.0%) | 0 (0.0%) |
| 12:00 PM to 3:59 PM | 5 (13.9%) | 5 (20.0%) |
| 4:00 PM to 11:59 PM | 1 (2.8%) | 0 (0.0%) |
| Total | 36 (100.0%) | 25 (100.0%) |
Housing Occupancy in Raywick
Occupancy by Ownership in Raywick
Of the total 68 dwellings in Raywick, owner-occupied units account for 45 (66.2%), while renter-occupied units make up 23 (33.8%).
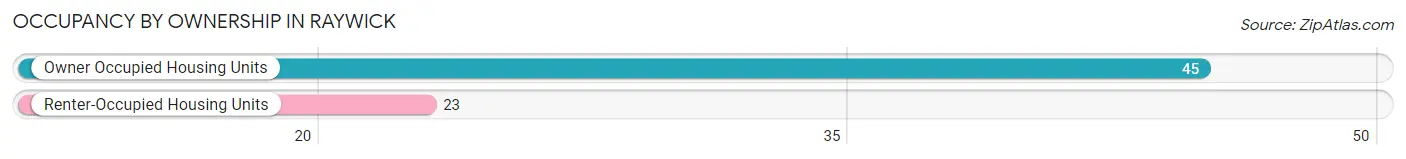
| Occupancy | # Housing Units | % Housing Units |
| Owner Occupied Housing Units | 45 | 66.2% |
| Renter-Occupied Housing Units | 23 | 33.8% |
| Total Occupied Housing Units | 68 | 100.0% |
Occupancy by Household Size in Raywick

| Household Size | # Housing Units | % Housing Units |
| 1-Person Household | 28 | 41.2% |
| 2-Person Household | 27 | 39.7% |
| 3-Person Household | 9 | 13.2% |
| 4+ Person Household | 4 | 5.9% |
| Total Housing Units | 68 | 100.0% |
Occupancy by Ownership by Household Size in Raywick
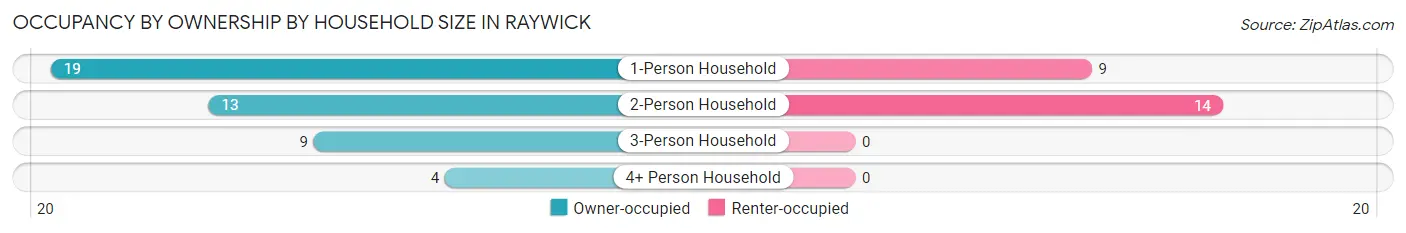
| Household Size | Owner-occupied | Renter-occupied |
| 1-Person Household | 19 (67.9%) | 9 (32.1%) |
| 2-Person Household | 13 (48.1%) | 14 (51.8%) |
| 3-Person Household | 9 (100.0%) | 0 (0.0%) |
| 4+ Person Household | 4 (100.0%) | 0 (0.0%) |
| Total Housing Units | 45 (66.2%) | 23 (33.8%) |
Occupancy by Educational Attainment in Raywick
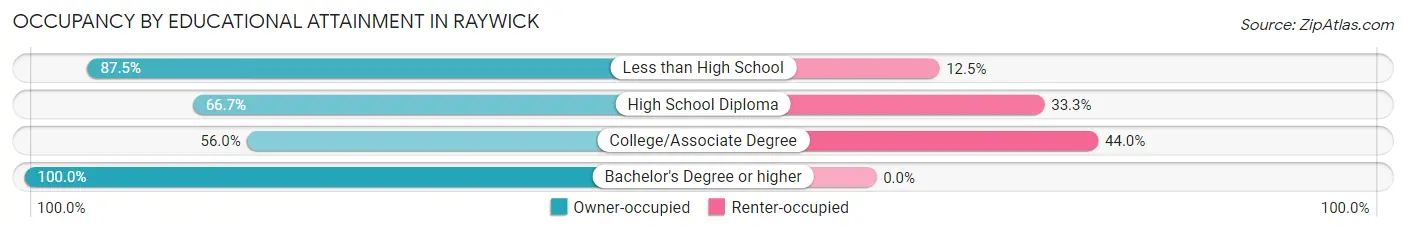
| Household Size | Owner-occupied | Renter-occupied |
| Less than High School | 7 (87.5%) | 1 (12.5%) |
| High School Diploma | 22 (66.7%) | 11 (33.3%) |
| College/Associate Degree | 14 (56.0%) | 11 (44.0%) |
| Bachelor's Degree or higher | 2 (100.0%) | 0 (0.0%) |
Occupancy by Age of Householder in Raywick
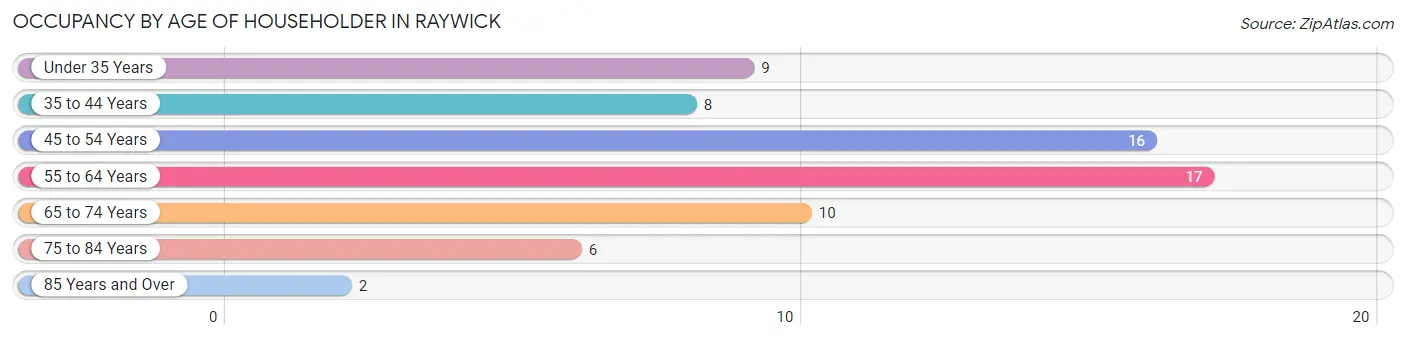
| Age Bracket | # Households | % Households |
| Under 35 Years | 9 | 13.2% |
| 35 to 44 Years | 8 | 11.8% |
| 45 to 54 Years | 16 | 23.5% |
| 55 to 64 Years | 17 | 25.0% |
| 65 to 74 Years | 10 | 14.7% |
| 75 to 84 Years | 6 | 8.8% |
| 85 Years and Over | 2 | 2.9% |
| Total | 68 | 100.0% |
Housing Finances in Raywick
Median Income by Occupancy in Raywick
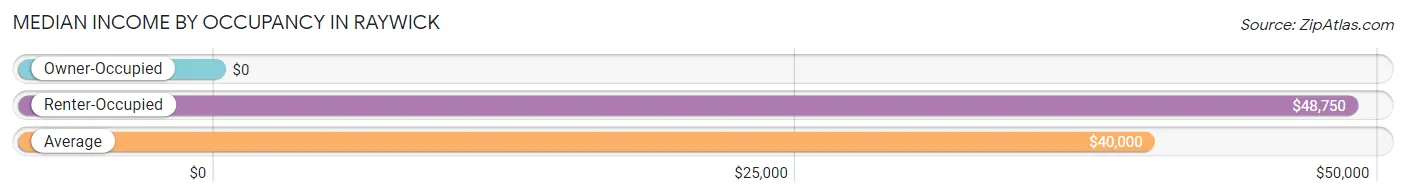
| Occupancy Type | # Households | Median Income |
| Owner-Occupied | 45 (66.2%) | $0 |
| Renter-Occupied | 23 (33.8%) | $48,750 |
| Average | 68 (100.0%) | $40,000 |
Occupancy by Householder Income Bracket in Raywick
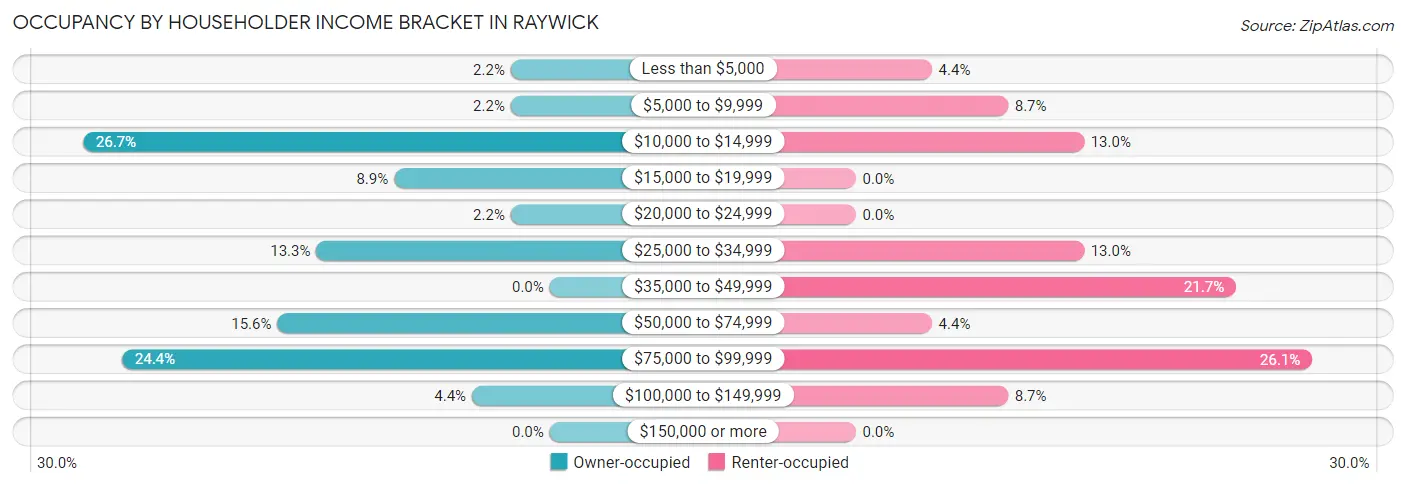
| Income Bracket | Owner-occupied | Renter-occupied |
| Less than $5,000 | 1 (2.2%) | 1 (4.3%) |
| $5,000 to $9,999 | 1 (2.2%) | 2 (8.7%) |
| $10,000 to $14,999 | 12 (26.7%) | 3 (13.0%) |
| $15,000 to $19,999 | 4 (8.9%) | 0 (0.0%) |
| $20,000 to $24,999 | 1 (2.2%) | 0 (0.0%) |
| $25,000 to $34,999 | 6 (13.3%) | 3 (13.0%) |
| $35,000 to $49,999 | 0 (0.0%) | 5 (21.7%) |
| $50,000 to $74,999 | 7 (15.6%) | 1 (4.3%) |
| $75,000 to $99,999 | 11 (24.4%) | 6 (26.1%) |
| $100,000 to $149,999 | 2 (4.4%) | 2 (8.7%) |
| $150,000 or more | 0 (0.0%) | 0 (0.0%) |
| Total | 45 (100.0%) | 23 (100.0%) |
Monthly Housing Cost Tiers in Raywick
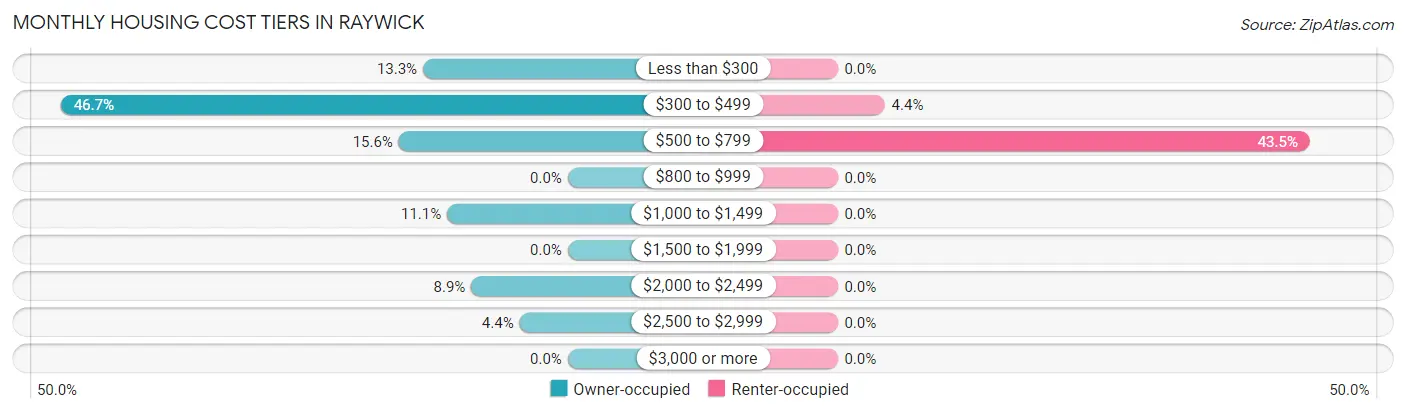
| Monthly Cost | Owner-occupied | Renter-occupied |
| Less than $300 | 6 (13.3%) | 0 (0.0%) |
| $300 to $499 | 21 (46.7%) | 1 (4.3%) |
| $500 to $799 | 7 (15.6%) | 10 (43.5%) |
| $800 to $999 | 0 (0.0%) | 0 (0.0%) |
| $1,000 to $1,499 | 5 (11.1%) | 0 (0.0%) |
| $1,500 to $1,999 | 0 (0.0%) | 0 (0.0%) |
| $2,000 to $2,499 | 4 (8.9%) | 0 (0.0%) |
| $2,500 to $2,999 | 2 (4.4%) | 0 (0.0%) |
| $3,000 or more | 0 (0.0%) | 0 (0.0%) |
| Total | 45 (100.0%) | 23 (100.0%) |
Physical Housing Characteristics in Raywick
Housing Structures in Raywick
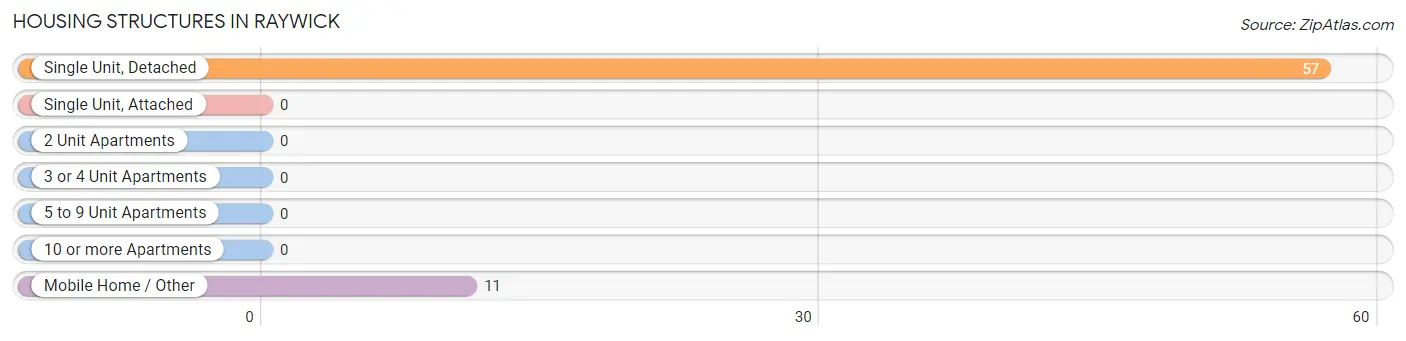
| Structure Type | # Housing Units | % Housing Units |
| Single Unit, Detached | 57 | 83.8% |
| Single Unit, Attached | 0 | 0.0% |
| 2 Unit Apartments | 0 | 0.0% |
| 3 or 4 Unit Apartments | 0 | 0.0% |
| 5 to 9 Unit Apartments | 0 | 0.0% |
| 10 or more Apartments | 0 | 0.0% |
| Mobile Home / Other | 11 | 16.2% |
| Total | 68 | 100.0% |
Housing Structures by Occupancy in Raywick
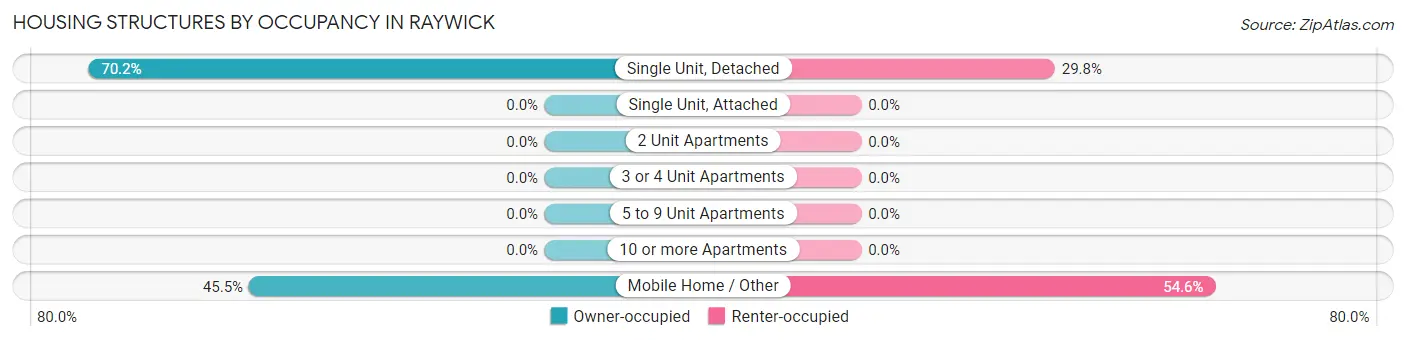
| Structure Type | Owner-occupied | Renter-occupied |
| Single Unit, Detached | 40 (70.2%) | 17 (29.8%) |
| Single Unit, Attached | 0 (0.0%) | 0 (0.0%) |
| 2 Unit Apartments | 0 (0.0%) | 0 (0.0%) |
| 3 or 4 Unit Apartments | 0 (0.0%) | 0 (0.0%) |
| 5 to 9 Unit Apartments | 0 (0.0%) | 0 (0.0%) |
| 10 or more Apartments | 0 (0.0%) | 0 (0.0%) |
| Mobile Home / Other | 5 (45.5%) | 6 (54.5%) |
| Total | 45 (66.2%) | 23 (33.8%) |
Housing Structures by Number of Rooms in Raywick
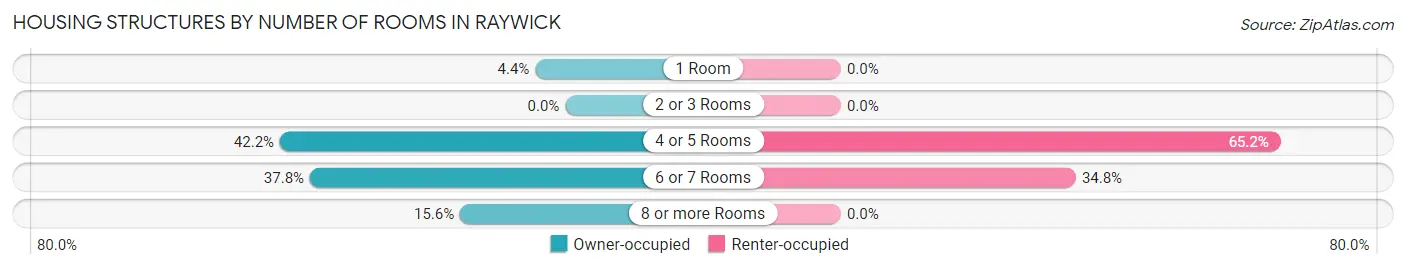
| Number of Rooms | Owner-occupied | Renter-occupied |
| 1 Room | 2 (4.4%) | 0 (0.0%) |
| 2 or 3 Rooms | 0 (0.0%) | 0 (0.0%) |
| 4 or 5 Rooms | 19 (42.2%) | 15 (65.2%) |
| 6 or 7 Rooms | 17 (37.8%) | 8 (34.8%) |
| 8 or more Rooms | 7 (15.6%) | 0 (0.0%) |
| Total | 45 (100.0%) | 23 (100.0%) |
Housing Structure by Heating Type in Raywick
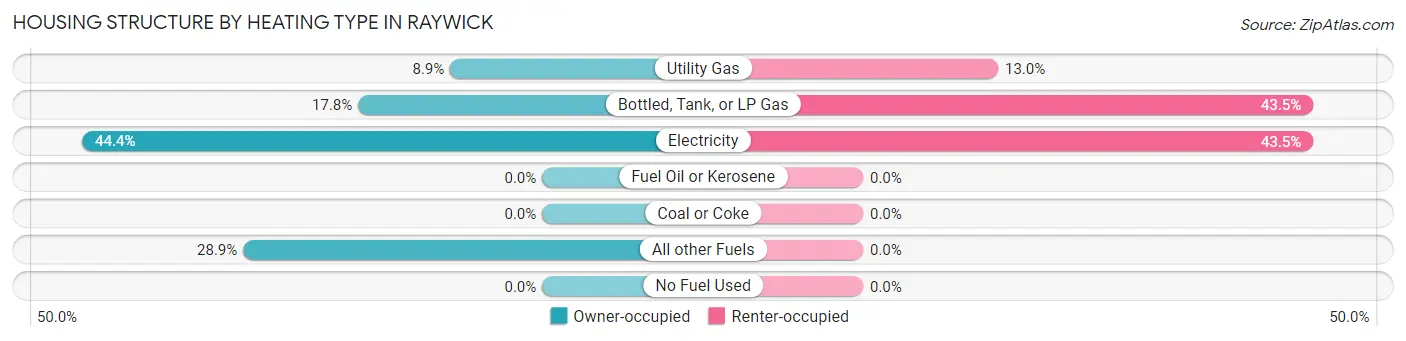
| Heating Type | Owner-occupied | Renter-occupied |
| Utility Gas | 4 (8.9%) | 3 (13.0%) |
| Bottled, Tank, or LP Gas | 8 (17.8%) | 10 (43.5%) |
| Electricity | 20 (44.4%) | 10 (43.5%) |
| Fuel Oil or Kerosene | 0 (0.0%) | 0 (0.0%) |
| Coal or Coke | 0 (0.0%) | 0 (0.0%) |
| All other Fuels | 13 (28.9%) | 0 (0.0%) |
| No Fuel Used | 0 (0.0%) | 0 (0.0%) |
| Total | 45 (100.0%) | 23 (100.0%) |
Household Vehicle Usage in Raywick
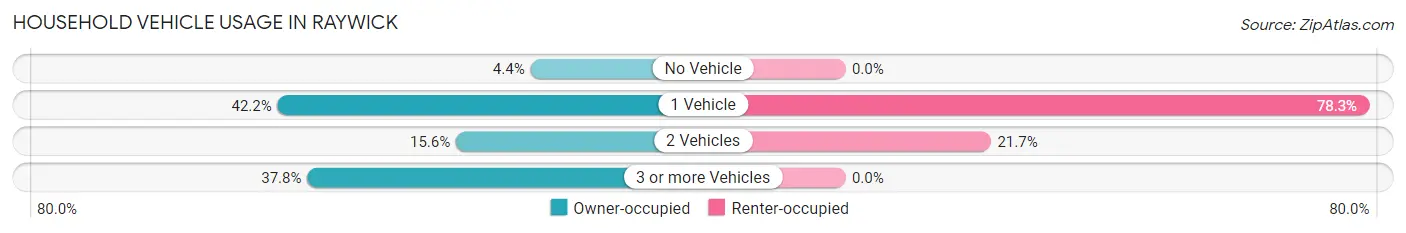
| Vehicles per Household | Owner-occupied | Renter-occupied |
| No Vehicle | 2 (4.4%) | 0 (0.0%) |
| 1 Vehicle | 19 (42.2%) | 18 (78.3%) |
| 2 Vehicles | 7 (15.6%) | 5 (21.7%) |
| 3 or more Vehicles | 17 (37.8%) | 0 (0.0%) |
| Total | 45 (100.0%) | 23 (100.0%) |
Real Estate & Mortgages in Raywick
Real Estate and Mortgage Overview in Raywick
| Characteristic | Without Mortgage | With Mortgage |
| Housing Units | 32 | 13 |
| Median Property Value | $85,000 | $139,600 |
| Median Household Income | - | - |
| Monthly Housing Costs | $363 | $0 |
| Real Estate Taxes | $400 | $0 |
Property Value by Mortgage Status in Raywick
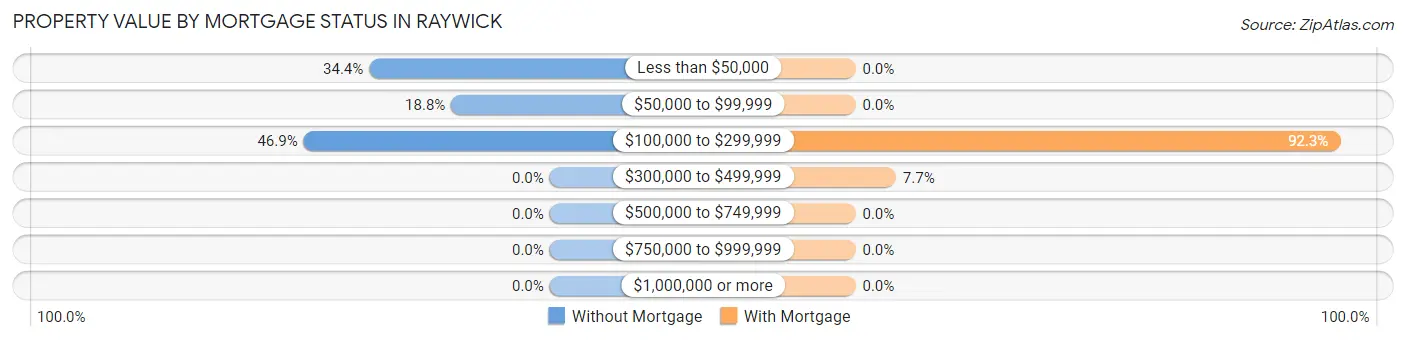
| Property Value | Without Mortgage | With Mortgage |
| Less than $50,000 | 11 (34.4%) | 0 (0.0%) |
| $50,000 to $99,999 | 6 (18.8%) | 0 (0.0%) |
| $100,000 to $299,999 | 15 (46.9%) | 12 (92.3%) |
| $300,000 to $499,999 | 0 (0.0%) | 1 (7.7%) |
| $500,000 to $749,999 | 0 (0.0%) | 0 (0.0%) |
| $750,000 to $999,999 | 0 (0.0%) | 0 (0.0%) |
| $1,000,000 or more | 0 (0.0%) | 0 (0.0%) |
| Total | 32 (100.0%) | 13 (100.0%) |
Household Income by Mortgage Status in Raywick
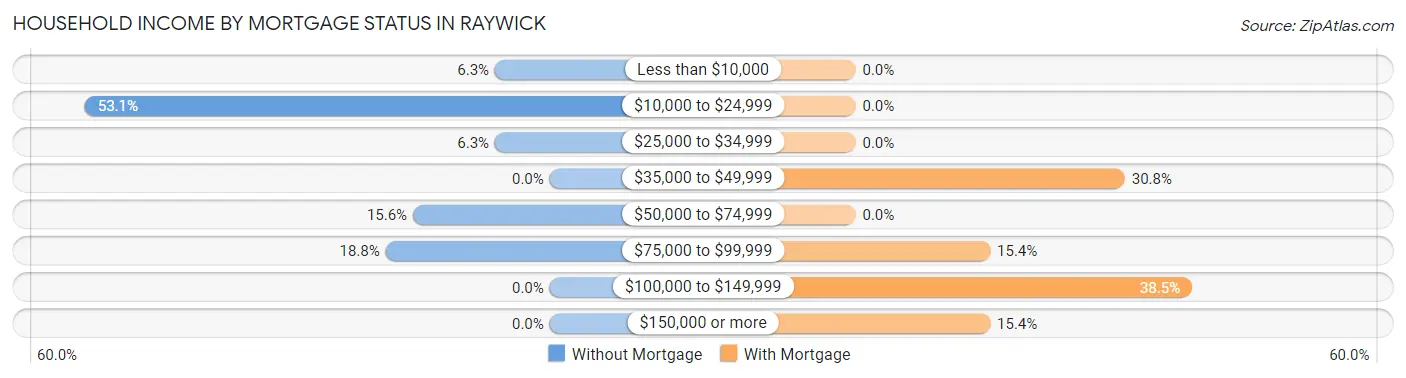
| Household Income | Without Mortgage | With Mortgage |
| Less than $10,000 | 2 (6.2%) | 0 (0.0%) |
| $10,000 to $24,999 | 17 (53.1%) | 0 (0.0%) |
| $25,000 to $34,999 | 2 (6.2%) | 0 (0.0%) |
| $35,000 to $49,999 | 0 (0.0%) | 4 (30.8%) |
| $50,000 to $74,999 | 5 (15.6%) | 0 (0.0%) |
| $75,000 to $99,999 | 6 (18.8%) | 2 (15.4%) |
| $100,000 to $149,999 | 0 (0.0%) | 5 (38.5%) |
| $150,000 or more | 0 (0.0%) | 2 (15.4%) |
| Total | 32 (100.0%) | 13 (100.0%) |
Property Value to Household Income Ratio in Raywick
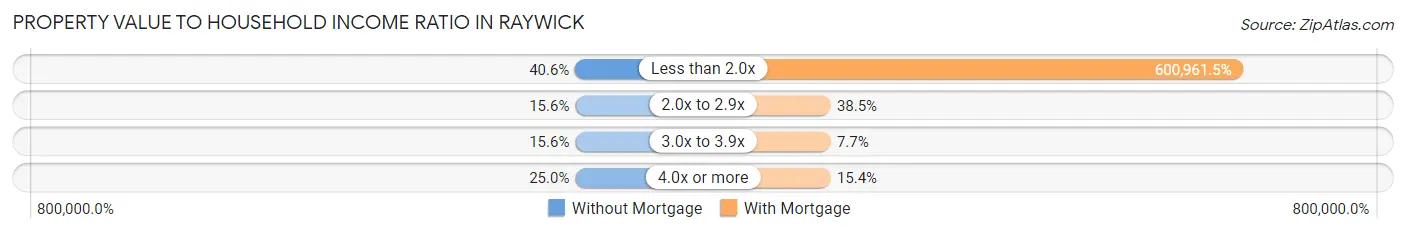
| Value-to-Income Ratio | Without Mortgage | With Mortgage |
| Less than 2.0x | 13 (40.6%) | 78,125 (600,961.5%) |
| 2.0x to 2.9x | 5 (15.6%) | 5 (38.5%) |
| 3.0x to 3.9x | 5 (15.6%) | 1 (7.7%) |
| 4.0x or more | 8 (25.0%) | 2 (15.4%) |
| Total | 32 (100.0%) | 13 (100.0%) |
Real Estate Taxes by Mortgage Status in Raywick
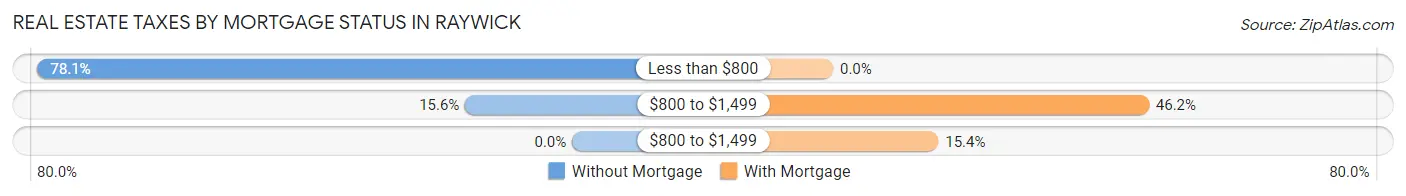
| Property Taxes | Without Mortgage | With Mortgage |
| Less than $800 | 25 (78.1%) | 0 (0.0%) |
| $800 to $1,499 | 5 (15.6%) | 6 (46.2%) |
| $800 to $1,499 | 0 (0.0%) | 2 (15.4%) |
| Total | 32 (100.0%) | 13 (100.0%) |
Health & Disability in Raywick
Health Insurance Coverage by Age in Raywick
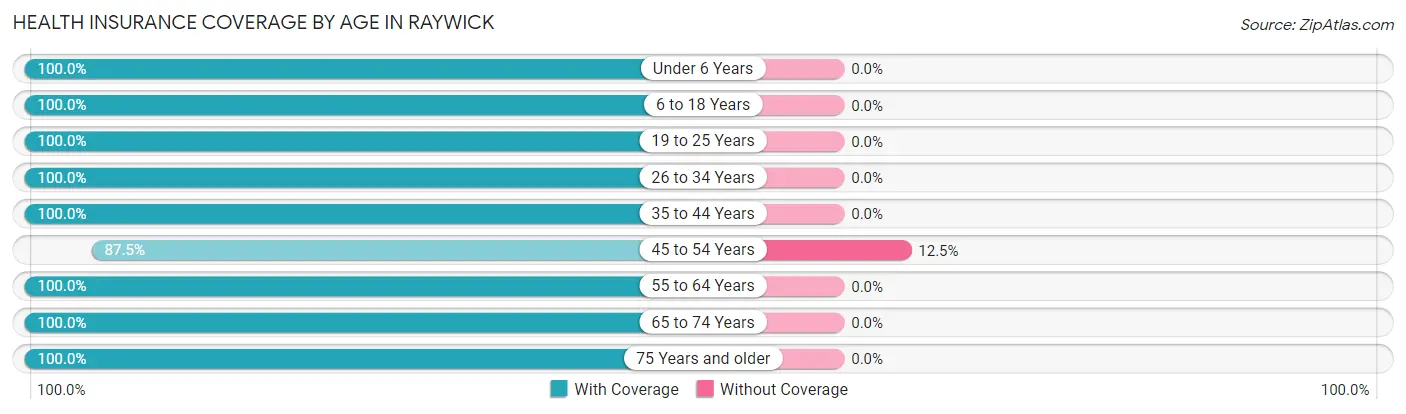
| Age Bracket | With Coverage | Without Coverage |
| Under 6 Years | 5 (100.0%) | 0 (0.0%) |
| 6 to 18 Years | 16 (100.0%) | 0 (0.0%) |
| 19 to 25 Years | 18 (100.0%) | 0 (0.0%) |
| 26 to 34 Years | 8 (100.0%) | 0 (0.0%) |
| 35 to 44 Years | 12 (100.0%) | 0 (0.0%) |
| 45 to 54 Years | 21 (87.5%) | 3 (12.5%) |
| 55 to 64 Years | 18 (100.0%) | 0 (0.0%) |
| 65 to 74 Years | 14 (100.0%) | 0 (0.0%) |
| 75 Years and older | 8 (100.0%) | 0 (0.0%) |
| Total | 120 (97.6%) | 3 (2.4%) |
Health Insurance Coverage by Citizenship Status in Raywick
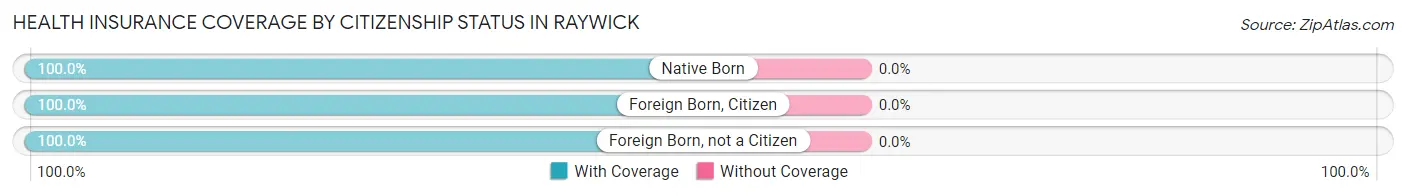
| Citizenship Status | With Coverage | Without Coverage |
| Native Born | 5 (100.0%) | 0 (0.0%) |
| Foreign Born, Citizen | 16 (100.0%) | 0 (0.0%) |
| Foreign Born, not a Citizen | 18 (100.0%) | 0 (0.0%) |
Health Insurance Coverage by Household Income in Raywick
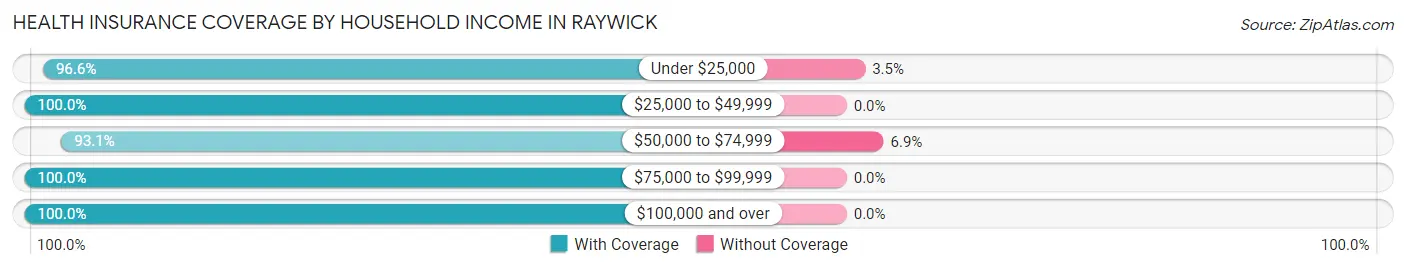
| Household Income | With Coverage | Without Coverage |
| Under $25,000 | 28 (96.6%) | 1 (3.5%) |
| $25,000 to $49,999 | 26 (100.0%) | 0 (0.0%) |
| $50,000 to $74,999 | 27 (93.1%) | 2 (6.9%) |
| $75,000 to $99,999 | 27 (100.0%) | 0 (0.0%) |
| $100,000 and over | 12 (100.0%) | 0 (0.0%) |
Public vs Private Health Insurance Coverage by Age in Raywick
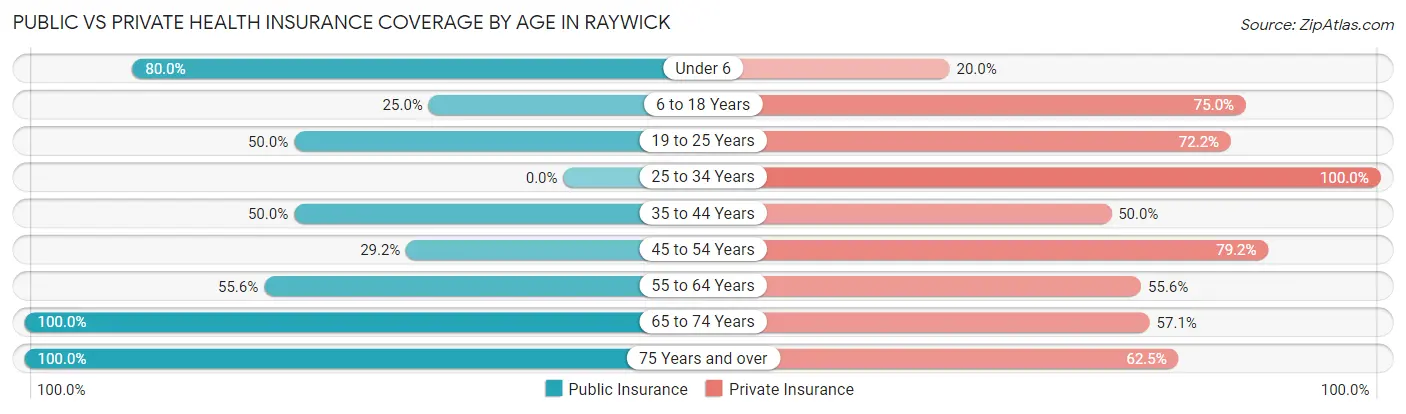
| Age Bracket | Public Insurance | Private Insurance |
| Under 6 | 4 (80.0%) | 1 (20.0%) |
| 6 to 18 Years | 4 (25.0%) | 12 (75.0%) |
| 19 to 25 Years | 9 (50.0%) | 13 (72.2%) |
| 25 to 34 Years | 0 (0.0%) | 8 (100.0%) |
| 35 to 44 Years | 6 (50.0%) | 6 (50.0%) |
| 45 to 54 Years | 7 (29.2%) | 19 (79.2%) |
| 55 to 64 Years | 10 (55.6%) | 10 (55.6%) |
| 65 to 74 Years | 14 (100.0%) | 8 (57.1%) |
| 75 Years and over | 8 (100.0%) | 5 (62.5%) |
| Total | 62 (50.4%) | 82 (66.7%) |
Disability Status by Sex by Age in Raywick
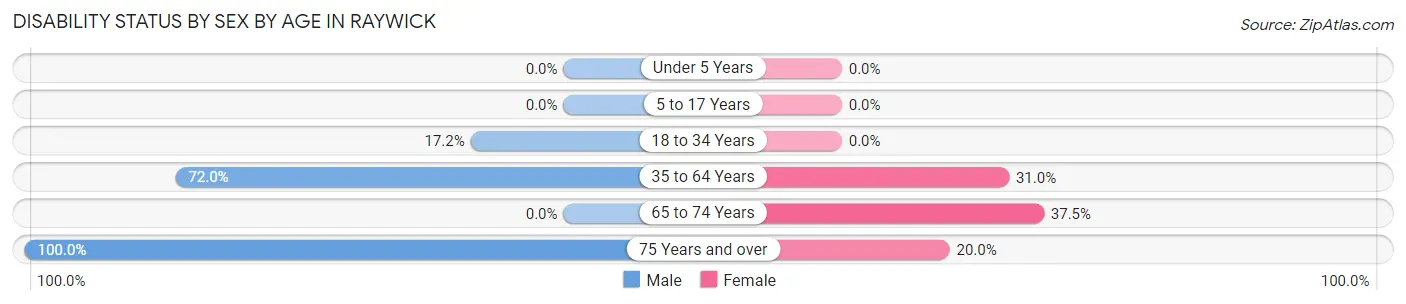
| Age Bracket | Male | Female |
| Under 5 Years | 0 (0.0%) | 0 (0.0%) |
| 5 to 17 Years | 0 (0.0%) | 0 (0.0%) |
| 18 to 34 Years | 5 (17.2%) | 0 (0.0%) |
| 35 to 64 Years | 18 (72.0%) | 9 (31.0%) |
| 65 to 74 Years | 0 (0.0%) | 3 (37.5%) |
| 75 Years and over | 3 (100.0%) | 1 (20.0%) |
Disability Class by Sex by Age in Raywick
Disability Class: Hearing Difficulty
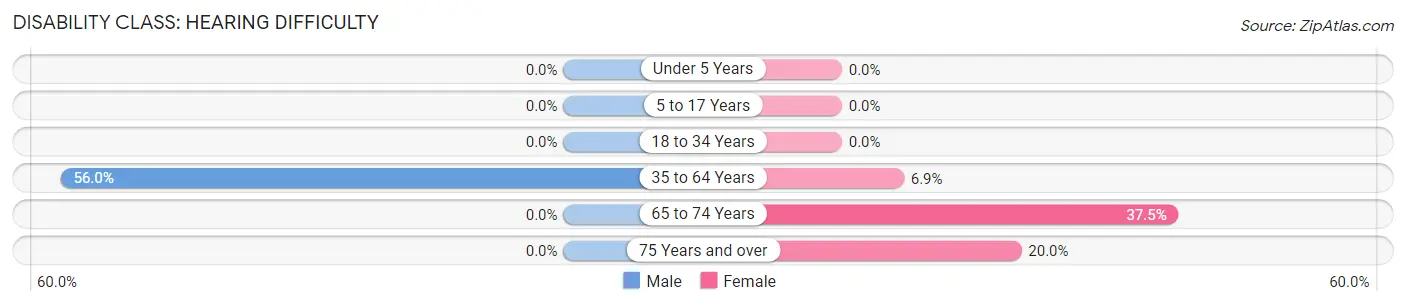
| Age Bracket | Male | Female |
| Under 5 Years | 0 (0.0%) | 0 (0.0%) |
| 5 to 17 Years | 0 (0.0%) | 0 (0.0%) |
| 18 to 34 Years | 0 (0.0%) | 0 (0.0%) |
| 35 to 64 Years | 14 (56.0%) | 2 (6.9%) |
| 65 to 74 Years | 0 (0.0%) | 3 (37.5%) |
| 75 Years and over | 0 (0.0%) | 1 (20.0%) |
Disability Class: Vision Difficulty
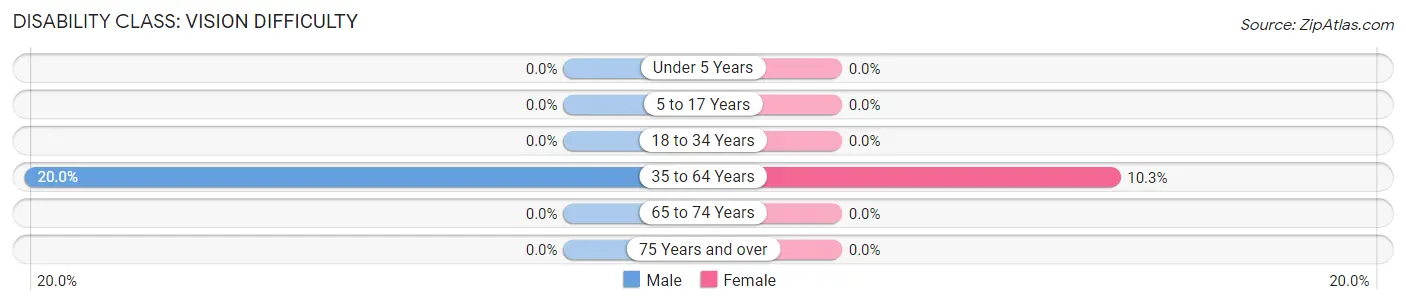
| Age Bracket | Male | Female |
| Under 5 Years | 0 (0.0%) | 0 (0.0%) |
| 5 to 17 Years | 0 (0.0%) | 0 (0.0%) |
| 18 to 34 Years | 0 (0.0%) | 0 (0.0%) |
| 35 to 64 Years | 5 (20.0%) | 3 (10.3%) |
| 65 to 74 Years | 0 (0.0%) | 0 (0.0%) |
| 75 Years and over | 0 (0.0%) | 0 (0.0%) |
Disability Class: Cognitive Difficulty
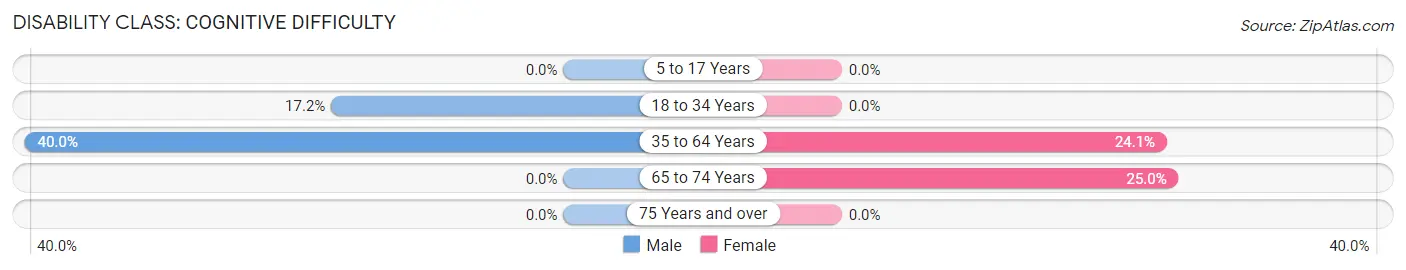
| Age Bracket | Male | Female |
| 5 to 17 Years | 0 (0.0%) | 0 (0.0%) |
| 18 to 34 Years | 5 (17.2%) | 0 (0.0%) |
| 35 to 64 Years | 10 (40.0%) | 7 (24.1%) |
| 65 to 74 Years | 0 (0.0%) | 2 (25.0%) |
| 75 Years and over | 0 (0.0%) | 0 (0.0%) |
Disability Class: Ambulatory Difficulty
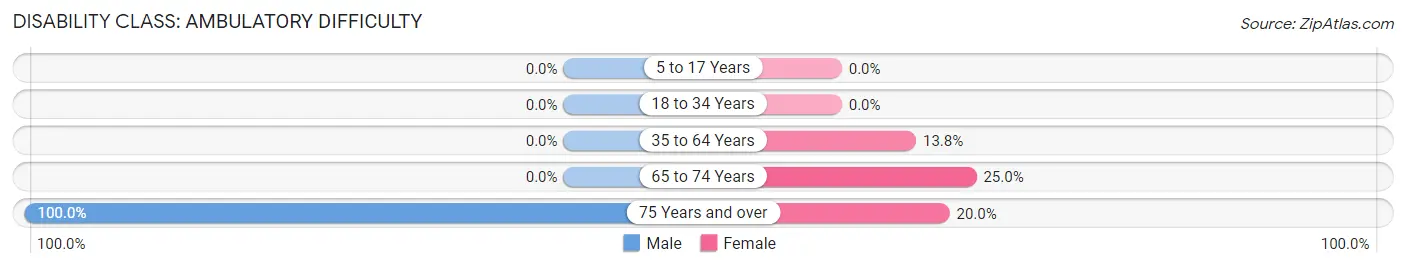
| Age Bracket | Male | Female |
| 5 to 17 Years | 0 (0.0%) | 0 (0.0%) |
| 18 to 34 Years | 0 (0.0%) | 0 (0.0%) |
| 35 to 64 Years | 0 (0.0%) | 4 (13.8%) |
| 65 to 74 Years | 0 (0.0%) | 2 (25.0%) |
| 75 Years and over | 3 (100.0%) | 1 (20.0%) |
Disability Class: Self-Care Difficulty
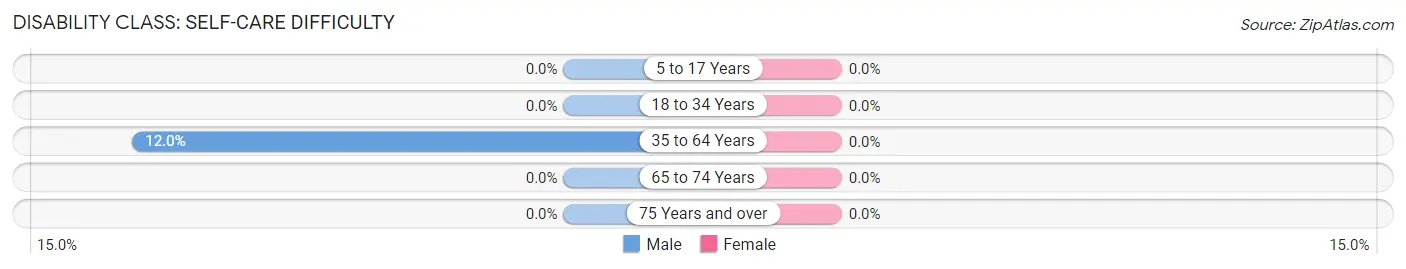
| Age Bracket | Male | Female |
| 5 to 17 Years | 0 (0.0%) | 0 (0.0%) |
| 18 to 34 Years | 0 (0.0%) | 0 (0.0%) |
| 35 to 64 Years | 3 (12.0%) | 0 (0.0%) |
| 65 to 74 Years | 0 (0.0%) | 0 (0.0%) |
| 75 Years and over | 0 (0.0%) | 0 (0.0%) |
Technology Access in Raywick
Computing Device Access in Raywick
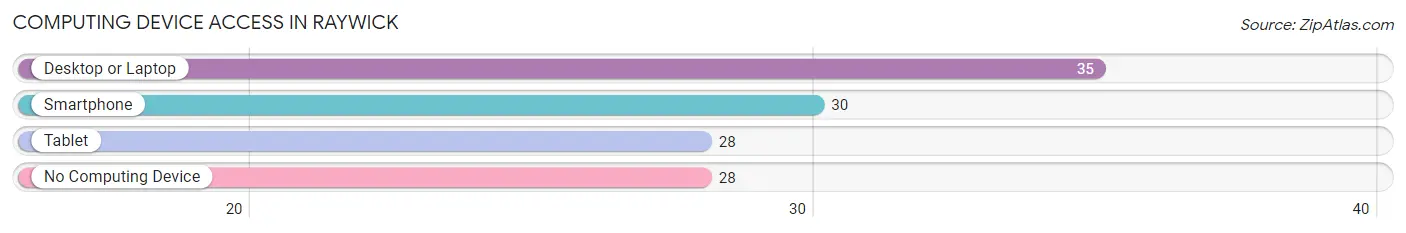
| Device Type | # Households | % Households |
| Desktop or Laptop | 35 | 51.5% |
| Smartphone | 30 | 44.1% |
| Tablet | 28 | 41.2% |
| No Computing Device | 28 | 41.2% |
| Total | 68 | 100.0% |
Internet Access in Raywick
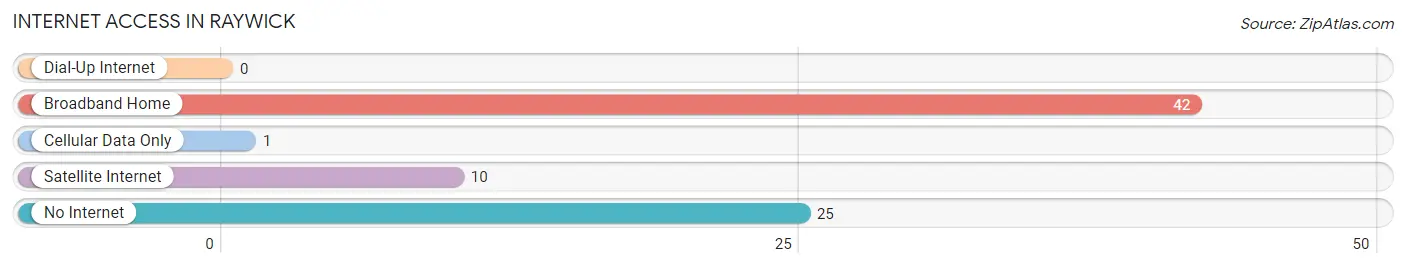
| Internet Type | # Households | % Households |
| Dial-Up Internet | 0 | 0.0% |
| Broadband Home | 42 | 61.8% |
| Cellular Data Only | 1 | 1.5% |
| Satellite Internet | 10 | 14.7% |
| No Internet | 25 | 36.8% |
| Total | 68 | 100.0% |
Raywick Summary
Raywick is a small unincorporated community located in Marion County, Kentucky. It is situated in the rolling hills of central Kentucky, approximately 10 miles south of Lebanon and 25 miles north of Campbellsville. The population of Raywick was estimated to be around 200 people in 2020.
History
Raywick was first settled in the early 1800s by a group of settlers from Virginia. The town was named after a local landowner, William Ray, who owned a large tract of land in the area. The town was officially incorporated in 1820 and was home to a variety of businesses, including a general store, a blacksmith shop, a grist mill, and a sawmill.
In the late 1800s, the town began to decline as the railroad bypassed it and the population began to move away. By the early 1900s, the town had become a virtual ghost town. However, in the mid-1900s, the town began to experience a resurgence as people began to move back to the area. Today, Raywick is a small, rural community with a population of around 200 people.
Geography
Raywick is located in the rolling hills of central Kentucky, approximately 10 miles south of Lebanon and 25 miles north of Campbellsville. The town is situated in Marion County, which is part of the Bluegrass Region of Kentucky. The terrain in the area is mostly flat, with some rolling hills and valleys. The climate in the area is generally mild, with hot summers and cold winters.
Economy
The economy of Raywick is largely based on agriculture. The town is home to several farms, which produce a variety of crops, including corn, soybeans, wheat, and hay. In addition, there are several small businesses in the area, including a general store, a gas station, and a few restaurants.
Demographics
As of the 2020 census, the population of Raywick was estimated to be around 200 people. The racial makeup of the town was 97.5% White, 0.5% African American, 0.5% Native American, and 1.5% from other races. The median household income in the town was $37,500, and the median home value was $90,000. The town has a high rate of poverty, with nearly 30% of the population living below the poverty line.
Conclusion
Raywick is a small, rural community located in Marion County, Kentucky. It has a population of around 200 people and is largely supported by agriculture. The town has a high rate of poverty, with nearly 30% of the population living below the poverty line. Despite this, Raywick is a close-knit community with a rich history and a bright future.
Common Questions
What is Per Capita Income in Raywick?
Per Capita income in Raywick is $27,884.
What is the Median Family Income in Raywick?
Median Family Income in Raywick is $78,750.
What is the Median Household income in Raywick?
Median Household Income in Raywick is $40,000.
What is Income or Wage Gap in Raywick?
Income or Wage Gap in Raywick is 25.4%.
Women in Raywick earn 74.6 cents for every dollar earned by a man.
What is Inequality or Gini Index in Raywick?
Inequality or Gini Index in Raywick is 0.42.
What is the Total Population of Raywick?
Total Population of Raywick is 123.
What is the Total Male Population of Raywick?
Total Male Population of Raywick is 71.
What is the Total Female Population of Raywick?
Total Female Population of Raywick is 52.
What is the Ratio of Males per 100 Females in Raywick?
There are 136.54 Males per 100 Females in Raywick.
What is the Ratio of Females per 100 Males in Raywick?
There are 73.24 Females per 100 Males in Raywick.
What is the Median Population Age in Raywick?
Median Population Age in Raywick is 47.3 Years.
What is the Average Family Size in Raywick
Average Family Size in Raywick is 2.4 People.
What is the Average Household Size in Raywick
Average Household Size in Raywick is 1.8 People.
How Large is the Labor Force in Raywick?
There are 62 People in the Labor Forcein in Raywick.
What is the Percentage of People in the Labor Force in Raywick?
54.9% of People are in the Labor Force in Raywick.
What is the Unemployment Rate in Raywick?
Unemployment Rate in Raywick is 1.6%.