Melbourne, KY Map & Demographics
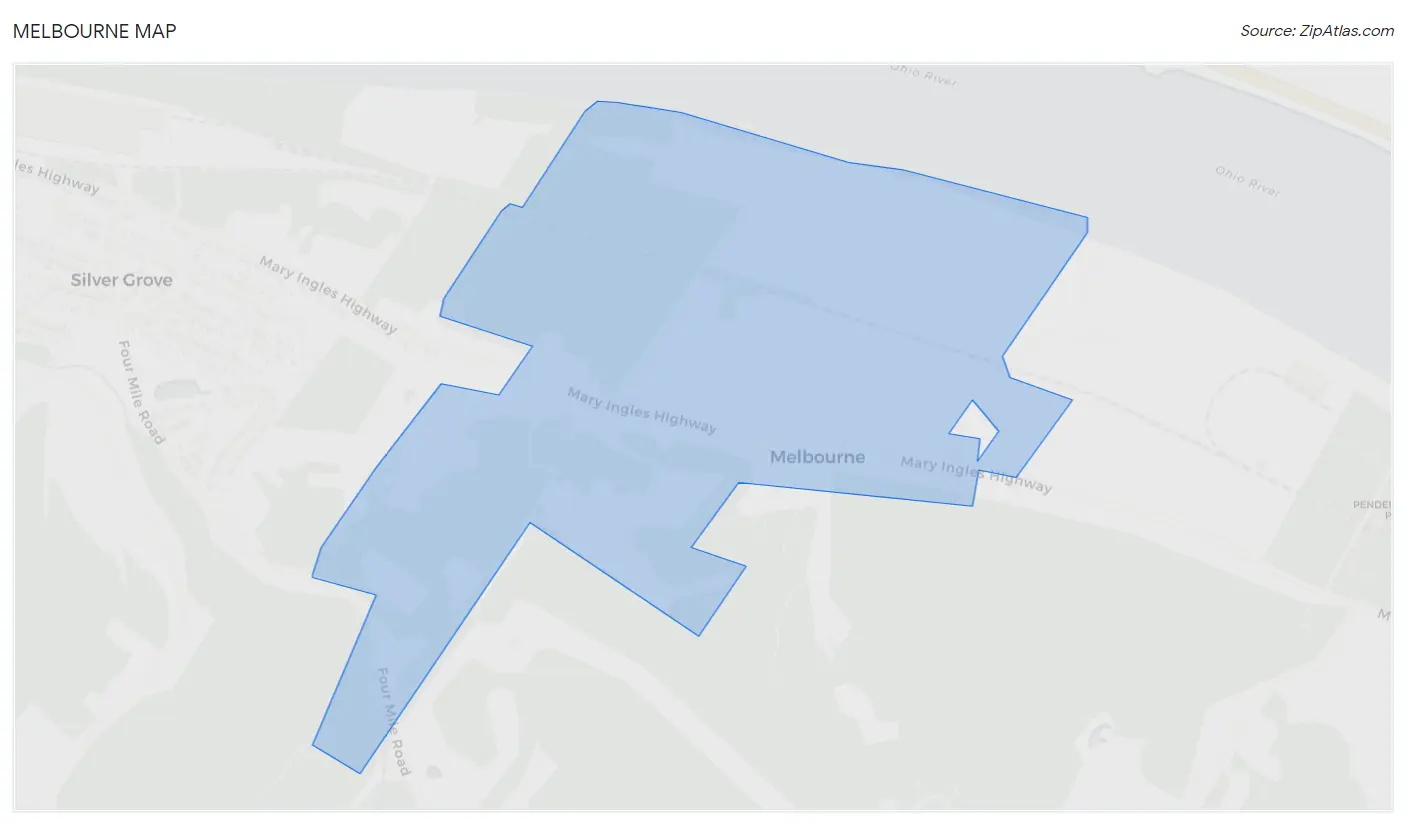
Melbourne Map
Melbourne Overview
$27,125
PER CAPITA INCOME
$76,406
AVG FAMILY INCOME
$74,375
AVG HOUSEHOLD INCOME
26.4%
WAGE / INCOME GAP [ % ]
73.6¢/ $1
WAGE / INCOME GAP [ $ ]
0.38
INEQUALITY / GINI INDEX
547
TOTAL POPULATION
230
MALE POPULATION
317
FEMALE POPULATION
72.56
MALES / 100 FEMALES
137.83
FEMALES / 100 MALES
54.9
MEDIAN AGE
3.2
AVG FAMILY SIZE
2.7
AVG HOUSEHOLD SIZE
194
LABOR FORCE [ PEOPLE ]
43.4%
PERCENT IN LABOR FORCE
6.7%
UNEMPLOYMENT RATE
Melbourne Zip Codes
Melbourne Area Codes
Income in Melbourne
Income Overview in Melbourne
Per Capita Income in Melbourne is $27,125, while median incomes of families and households are $76,406 and $74,375 respectively.
| Characteristic | Number | Measure |
| Per Capita Income | 547 | $27,125 |
| Median Family Income | 117 | $76,406 |
| Mean Family Income | 117 | $92,685 |
| Median Household Income | 172 | $74,375 |
| Mean Household Income | 172 | $80,828 |
| Income Deficit | 117 | $0 |
| Wage / Income Gap (%) | 547 | 26.39% |
| Wage / Income Gap ($) | 547 | 73.61¢ per $1 |
| Gini / Inequality Index | 547 | 0.38 |
Earnings by Sex in Melbourne
Average Earnings in Melbourne are $32,917, $41,094 for men and $30,250 for women, a difference of 26.4%.
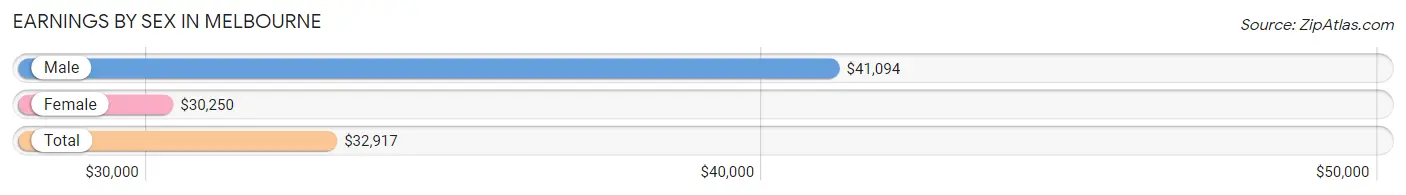
| Sex | Number | Average Earnings |
| Male | 101 (48.1%) | $41,094 |
| Female | 109 (51.9%) | $30,250 |
| Total | 210 (100.0%) | $32,917 |
Earnings by Sex by Income Bracket in Melbourne
The most common earnings brackets in Melbourne are $100,000+ for men (17 | 16.8%) and $10,000 to $12,499 for women (25 | 22.9%).
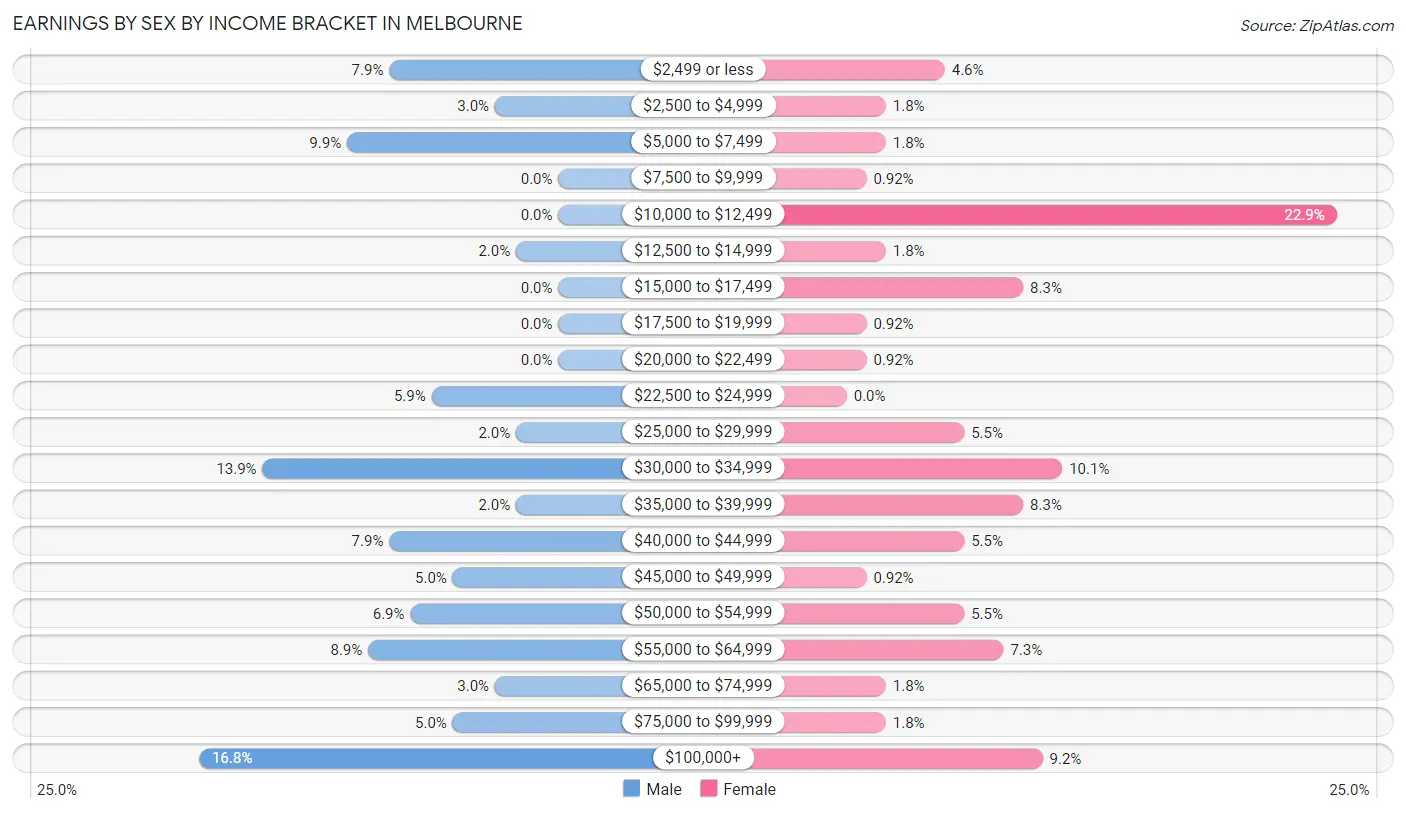
| Income | Male | Female |
| $2,499 or less | 8 (7.9%) | 5 (4.6%) |
| $2,500 to $4,999 | 3 (3.0%) | 2 (1.8%) |
| $5,000 to $7,499 | 10 (9.9%) | 2 (1.8%) |
| $7,500 to $9,999 | 0 (0.0%) | 1 (0.9%) |
| $10,000 to $12,499 | 0 (0.0%) | 25 (22.9%) |
| $12,500 to $14,999 | 2 (2.0%) | 2 (1.8%) |
| $15,000 to $17,499 | 0 (0.0%) | 9 (8.3%) |
| $17,500 to $19,999 | 0 (0.0%) | 1 (0.9%) |
| $20,000 to $22,499 | 0 (0.0%) | 1 (0.9%) |
| $22,500 to $24,999 | 6 (5.9%) | 0 (0.0%) |
| $25,000 to $29,999 | 2 (2.0%) | 6 (5.5%) |
| $30,000 to $34,999 | 14 (13.9%) | 11 (10.1%) |
| $35,000 to $39,999 | 2 (2.0%) | 9 (8.3%) |
| $40,000 to $44,999 | 8 (7.9%) | 6 (5.5%) |
| $45,000 to $49,999 | 5 (5.0%) | 1 (0.9%) |
| $50,000 to $54,999 | 7 (6.9%) | 6 (5.5%) |
| $55,000 to $64,999 | 9 (8.9%) | 8 (7.3%) |
| $65,000 to $74,999 | 3 (3.0%) | 2 (1.8%) |
| $75,000 to $99,999 | 5 (5.0%) | 2 (1.8%) |
| $100,000+ | 17 (16.8%) | 10 (9.2%) |
| Total | 101 (100.0%) | 109 (100.0%) |
Earnings by Sex by Educational Attainment in Melbourne
Average earnings in Melbourne are $52,500 for men and $30,000 for women, a difference of 42.9%. Men with an educational attainment of bachelor's degree enjoy the highest average annual earnings of $136,429, while those with high school diploma education earn the least with $48,333. Women with an educational attainment of high school diploma earn the most with the average annual earnings of $36,250, while those with college or associate's degree education have the smallest earnings of $33,958.
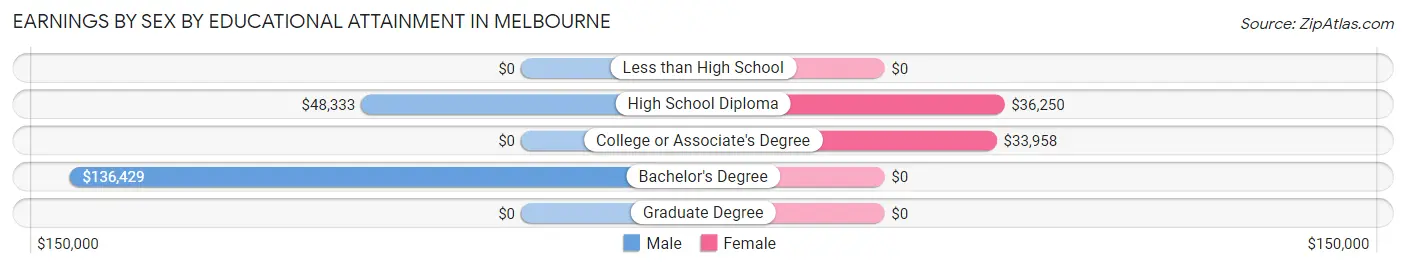
| Educational Attainment | Male Income | Female Income |
| Less than High School | - | - |
| High School Diploma | $48,333 | $36,250 |
| College or Associate's Degree | - | - |
| Bachelor's Degree | $136,429 | $0 |
| Graduate Degree | - | - |
| Total | $52,500 | $30,000 |
Family Income in Melbourne
Family Income Brackets in Melbourne
According to the Melbourne family income data, there are 33 families falling into the $50,000 to $74,999 income range, which is the most common income bracket and makes up 28.2% of all families.
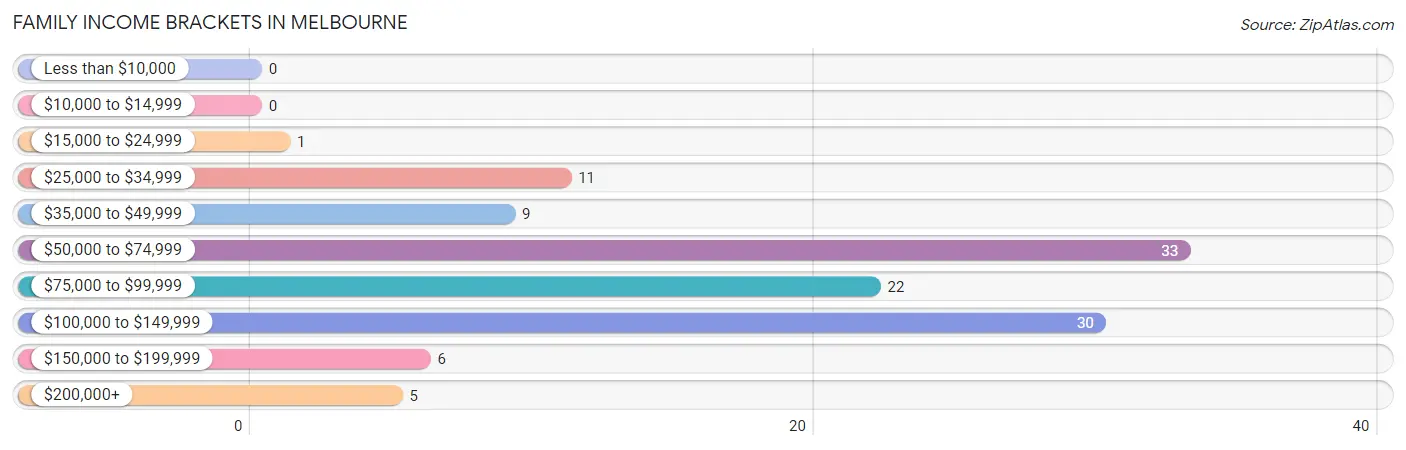
| Income Bracket | # Families | % Families |
| Less than $10,000 | 0 | 0.0% |
| $10,000 to $14,999 | 0 | 0.0% |
| $15,000 to $24,999 | 1 | 0.9% |
| $25,000 to $34,999 | 11 | 9.4% |
| $35,000 to $49,999 | 9 | 7.7% |
| $50,000 to $74,999 | 33 | 28.2% |
| $75,000 to $99,999 | 22 | 18.8% |
| $100,000 to $149,999 | 30 | 25.6% |
| $150,000 to $199,999 | 6 | 5.1% |
| $200,000+ | 5 | 4.3% |
Family Income by Famaliy Size in Melbourne
3-person families (32 | 27.4%) account for the highest median family income in Melbourne with $101,250 per family, while 2-person families (46 | 39.3%) have the highest median income of $40,625 per family member.
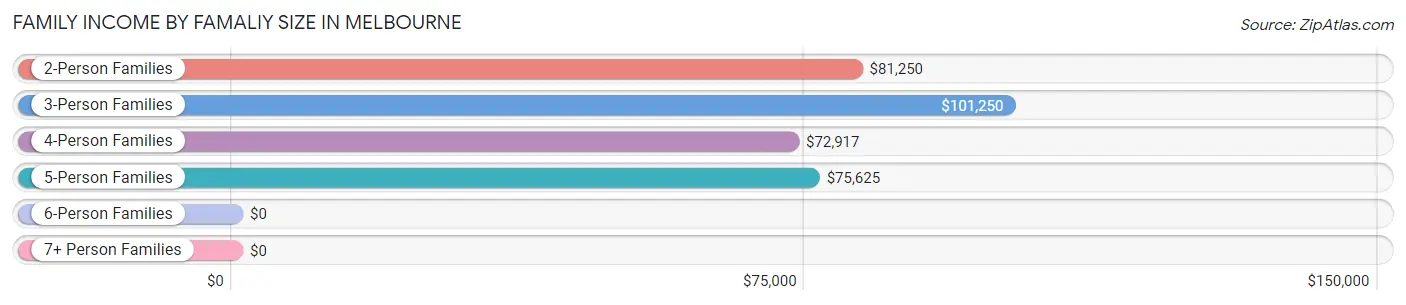
| Income Bracket | # Families | Median Income |
| 2-Person Families | 46 (39.3%) | $81,250 |
| 3-Person Families | 32 (27.4%) | $101,250 |
| 4-Person Families | 22 (18.8%) | $72,917 |
| 5-Person Families | 17 (14.5%) | $75,625 |
| 6-Person Families | 0 (0.0%) | $0 |
| 7+ Person Families | 0 (0.0%) | $0 |
| Total | 117 (100.0%) | $76,406 |
Family Income by Number of Earners in Melbourne
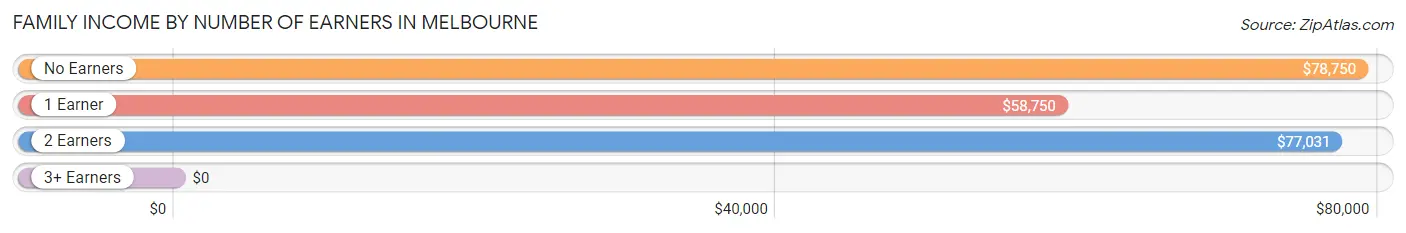
| Number of Earners | # Families | Median Income |
| No Earners | 28 (23.9%) | $78,750 |
| 1 Earner | 29 (24.8%) | $58,750 |
| 2 Earners | 47 (40.2%) | $77,031 |
| 3+ Earners | 13 (11.1%) | $0 |
| Total | 117 (100.0%) | $76,406 |
Household Income in Melbourne
Household Income Brackets in Melbourne
With 42 households falling in the category, the $100,000 to $149,999 income range is the most frequent in Melbourne, accounting for 24.4% of all households. In contrast, only 6 households (3.5%) fall into the $150,000 to $199,999 income bracket, making it the least populous group.
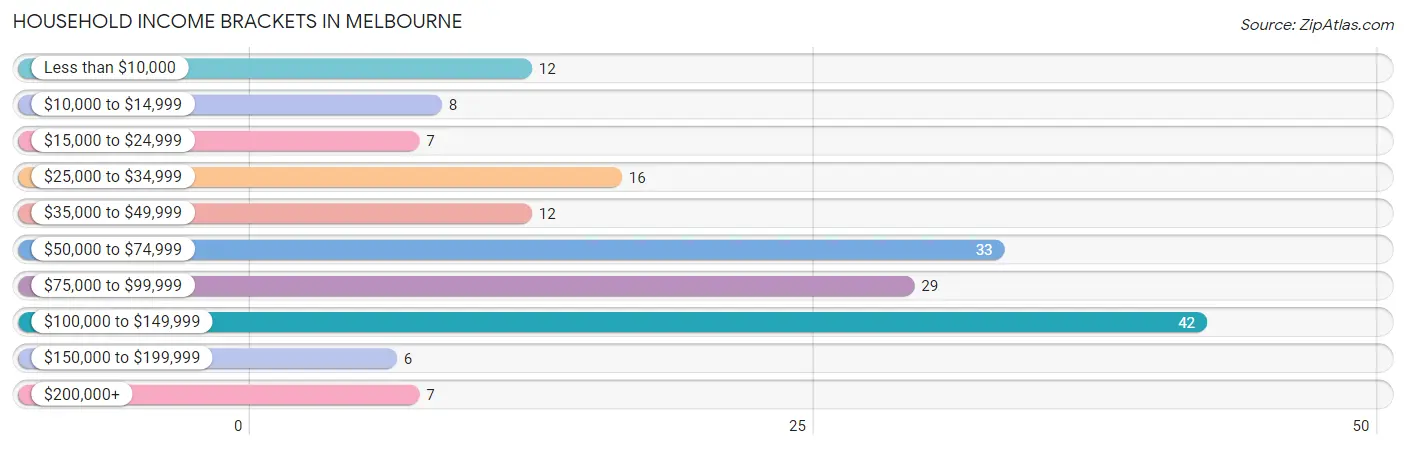
| Income Bracket | # Households | % Households |
| Less than $10,000 | 12 | 7.0% |
| $10,000 to $14,999 | 8 | 4.7% |
| $15,000 to $24,999 | 7 | 4.1% |
| $25,000 to $34,999 | 16 | 9.3% |
| $35,000 to $49,999 | 12 | 7.0% |
| $50,000 to $74,999 | 33 | 19.2% |
| $75,000 to $99,999 | 29 | 16.9% |
| $100,000 to $149,999 | 42 | 24.4% |
| $150,000 to $199,999 | 6 | 3.5% |
| $200,000+ | 7 | 4.1% |
Household Income by Householder Age in Melbourne
The median household income in Melbourne is $74,375, with the highest median household income of $96,250 found in the 45 to 64 years age bracket for the primary householder. A total of 70 households (40.7%) fall into this category.
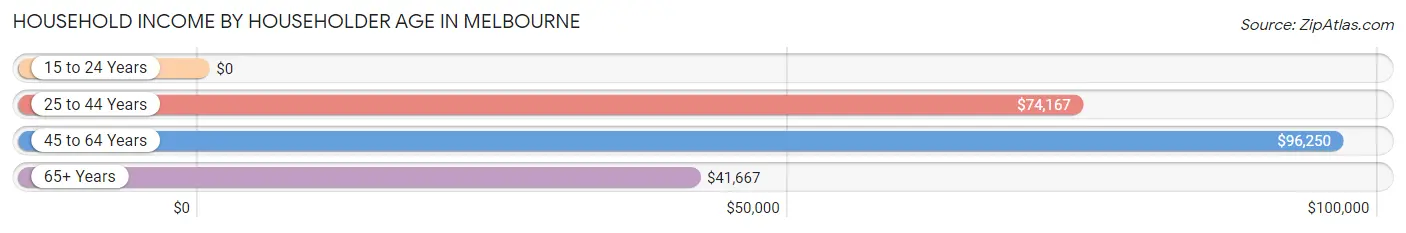
| Income Bracket | # Households | Median Income |
| 15 to 24 Years | 0 (0.0%) | $0 |
| 25 to 44 Years | 38 (22.1%) | $74,167 |
| 45 to 64 Years | 70 (40.7%) | $96,250 |
| 65+ Years | 64 (37.2%) | $41,667 |
| Total | 172 (100.0%) | $74,375 |
Poverty in Melbourne
Income Below Poverty by Sex and Age in Melbourne
With 10.5% poverty level for males and 33.1% for females among the residents of Melbourne, 16 and 17 year old males and 75 year old and over females are the most vulnerable to poverty, with 3 males (42.9%) and 45 females (75.0%) in their respective age groups living below the poverty level.
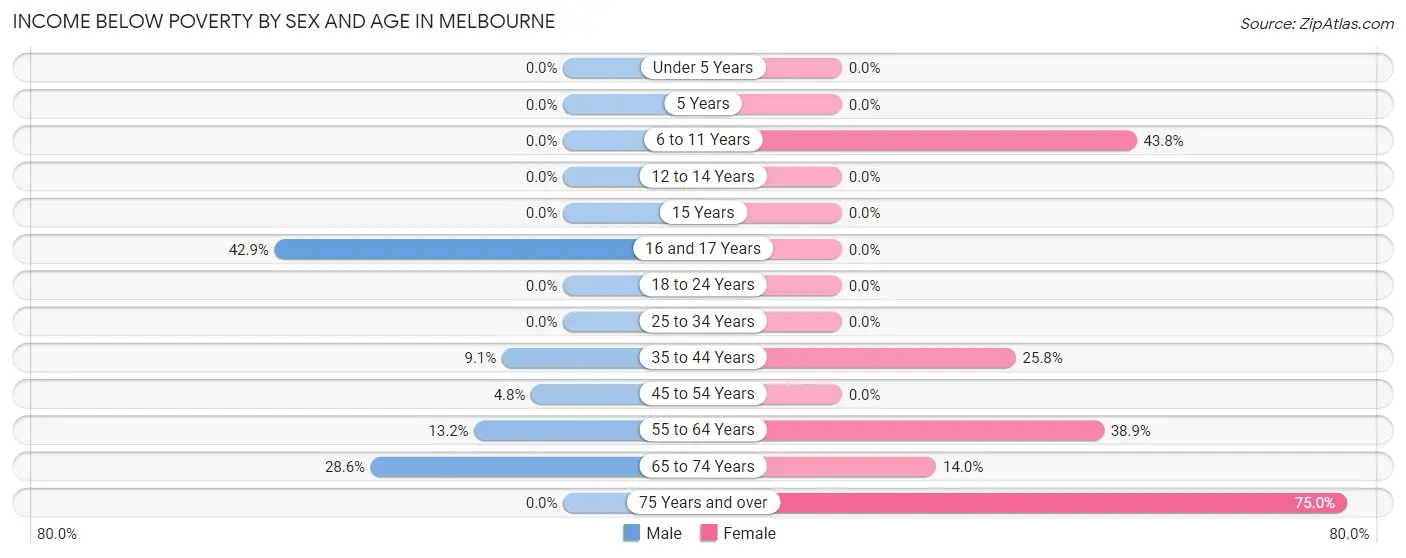
| Age Bracket | Male | Female |
| Under 5 Years | 0 (0.0%) | 0 (0.0%) |
| 5 Years | 0 (0.0%) | 0 (0.0%) |
| 6 to 11 Years | 0 (0.0%) | 21 (43.8%) |
| 12 to 14 Years | 0 (0.0%) | 0 (0.0%) |
| 15 Years | 0 (0.0%) | 0 (0.0%) |
| 16 and 17 Years | 3 (42.9%) | 0 (0.0%) |
| 18 to 24 Years | 0 (0.0%) | 0 (0.0%) |
| 25 to 34 Years | 0 (0.0%) | 0 (0.0%) |
| 35 to 44 Years | 3 (9.1%) | 8 (25.8%) |
| 45 to 54 Years | 1 (4.8%) | 0 (0.0%) |
| 55 to 64 Years | 7 (13.2%) | 21 (38.9%) |
| 65 to 74 Years | 10 (28.6%) | 7 (14.0%) |
| 75 Years and over | 0 (0.0%) | 45 (75.0%) |
| Total | 24 (10.5%) | 102 (33.1%) |
Income Above Poverty by Sex and Age in Melbourne
According to the poverty statistics in Melbourne, males aged under 5 years and females aged under 5 years are the age groups that are most secure financially, with 100.0% of males and 100.0% of females in these age groups living above the poverty line.
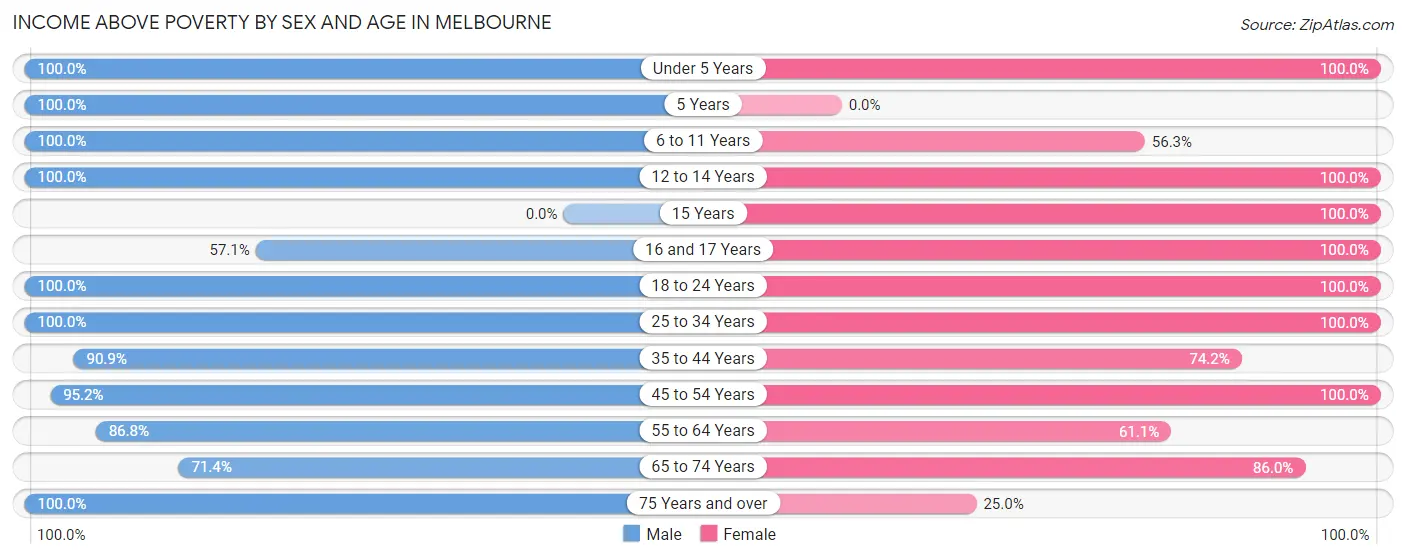
| Age Bracket | Male | Female |
| Under 5 Years | 8 (100.0%) | 8 (100.0%) |
| 5 Years | 3 (100.0%) | 0 (0.0%) |
| 6 to 11 Years | 16 (100.0%) | 27 (56.2%) |
| 12 to 14 Years | 9 (100.0%) | 2 (100.0%) |
| 15 Years | 0 (0.0%) | 2 (100.0%) |
| 16 and 17 Years | 4 (57.1%) | 6 (100.0%) |
| 18 to 24 Years | 15 (100.0%) | 9 (100.0%) |
| 25 to 34 Years | 14 (100.0%) | 18 (100.0%) |
| 35 to 44 Years | 30 (90.9%) | 23 (74.2%) |
| 45 to 54 Years | 20 (95.2%) | 20 (100.0%) |
| 55 to 64 Years | 46 (86.8%) | 33 (61.1%) |
| 65 to 74 Years | 25 (71.4%) | 43 (86.0%) |
| 75 Years and over | 14 (100.0%) | 15 (25.0%) |
| Total | 204 (89.5%) | 206 (66.9%) |
Income Below Poverty Among Married-Couple Families in Melbourne
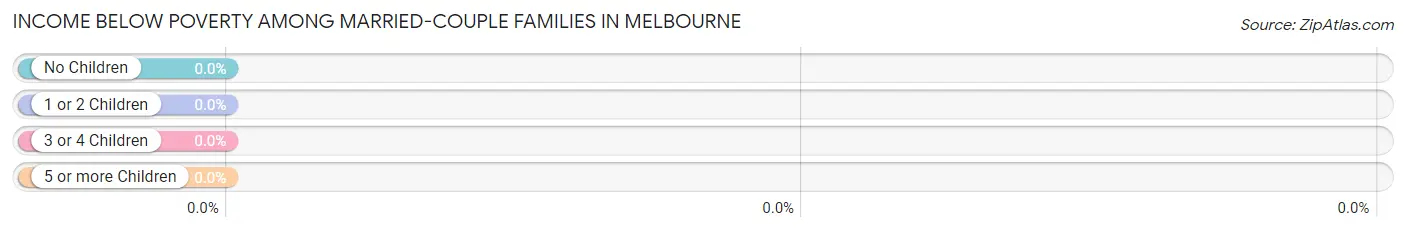
| Children | Above Poverty | Below Poverty |
| No Children | 61 (100.0%) | 0 (0.0%) |
| 1 or 2 Children | 26 (100.0%) | 0 (0.0%) |
| 3 or 4 Children | 9 (100.0%) | 0 (0.0%) |
| 5 or more Children | 0 (0.0%) | 0 (0.0%) |
| Total | 96 (100.0%) | 0 (0.0%) |
Income Below Poverty Among Single-Parent Households in Melbourne
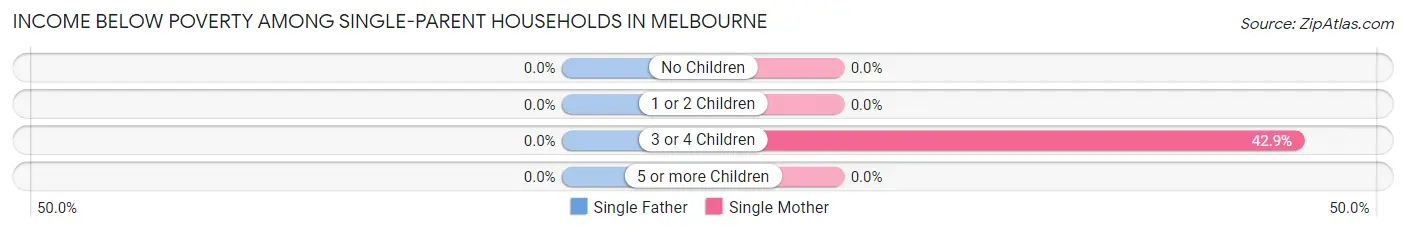
| Children | Single Father | Single Mother |
| No Children | 0 (0.0%) | 0 (0.0%) |
| 1 or 2 Children | 0 (0.0%) | 0 (0.0%) |
| 3 or 4 Children | 0 (0.0%) | 3 (42.9%) |
| 5 or more Children | 0 (0.0%) | 0 (0.0%) |
| Total | 0 (0.0%) | 3 (16.7%) |
Income Below Poverty Among Married-Couple vs Single-Parent Households in Melbourne
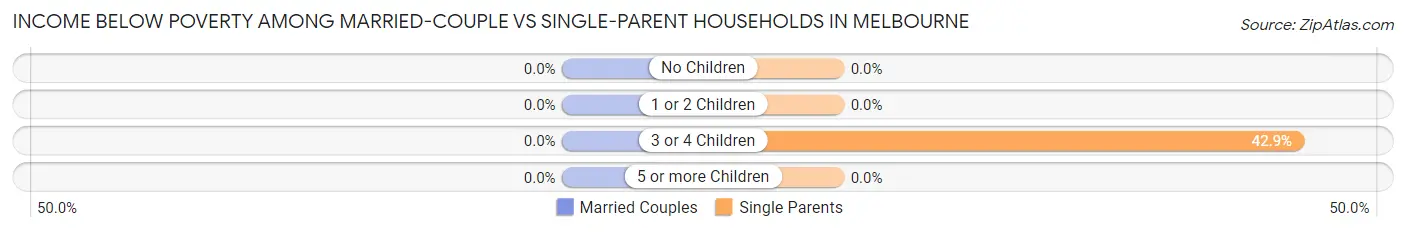
| Children | Married-Couple Families | Single-Parent Households |
| No Children | 0 (0.0%) | 0 (0.0%) |
| 1 or 2 Children | 0 (0.0%) | 0 (0.0%) |
| 3 or 4 Children | 0 (0.0%) | 3 (42.9%) |
| 5 or more Children | 0 (0.0%) | 0 (0.0%) |
| Total | 0 (0.0%) | 3 (14.3%) |
Race in Melbourne
The most populous races in Melbourne are White / Caucasian (504 | 92.1%), Two or more Races (37 | 6.8%), and Black / African American (4 | 0.7%).
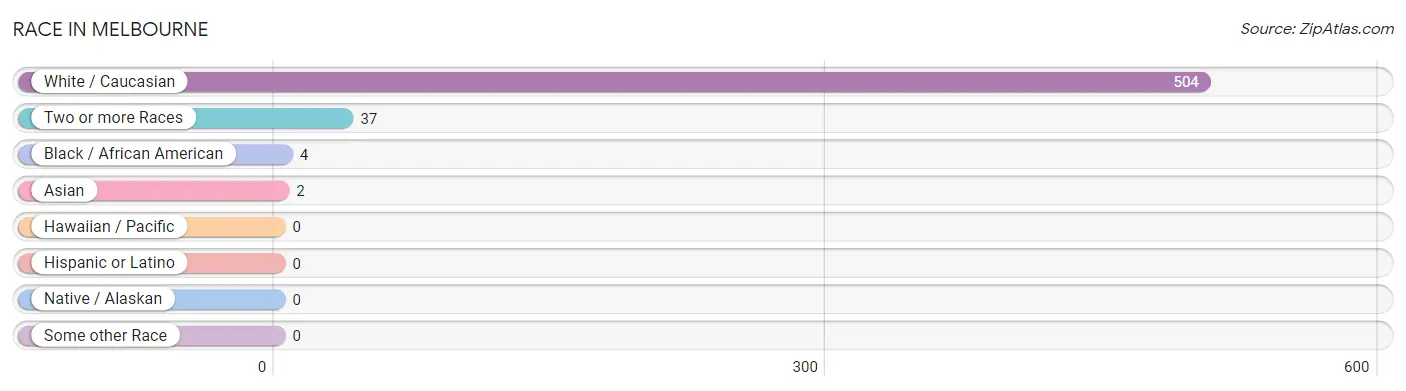
| Race | # Population | % Population |
| Asian | 2 | 0.4% |
| Black / African American | 4 | 0.7% |
| Hawaiian / Pacific | 0 | 0.0% |
| Hispanic or Latino | 0 | 0.0% |
| Native / Alaskan | 0 | 0.0% |
| White / Caucasian | 504 | 92.1% |
| Two or more Races | 37 | 6.8% |
| Some other Race | 0 | 0.0% |
| Total | 547 | 100.0% |
Ancestry in Melbourne
The most populous ancestries reported in Melbourne are German (207 | 37.8%), English (64 | 11.7%), Irish (61 | 11.2%), American (53 | 9.7%), and Polish (23 | 4.2%), together accounting for 74.6% of all Melbourne residents.
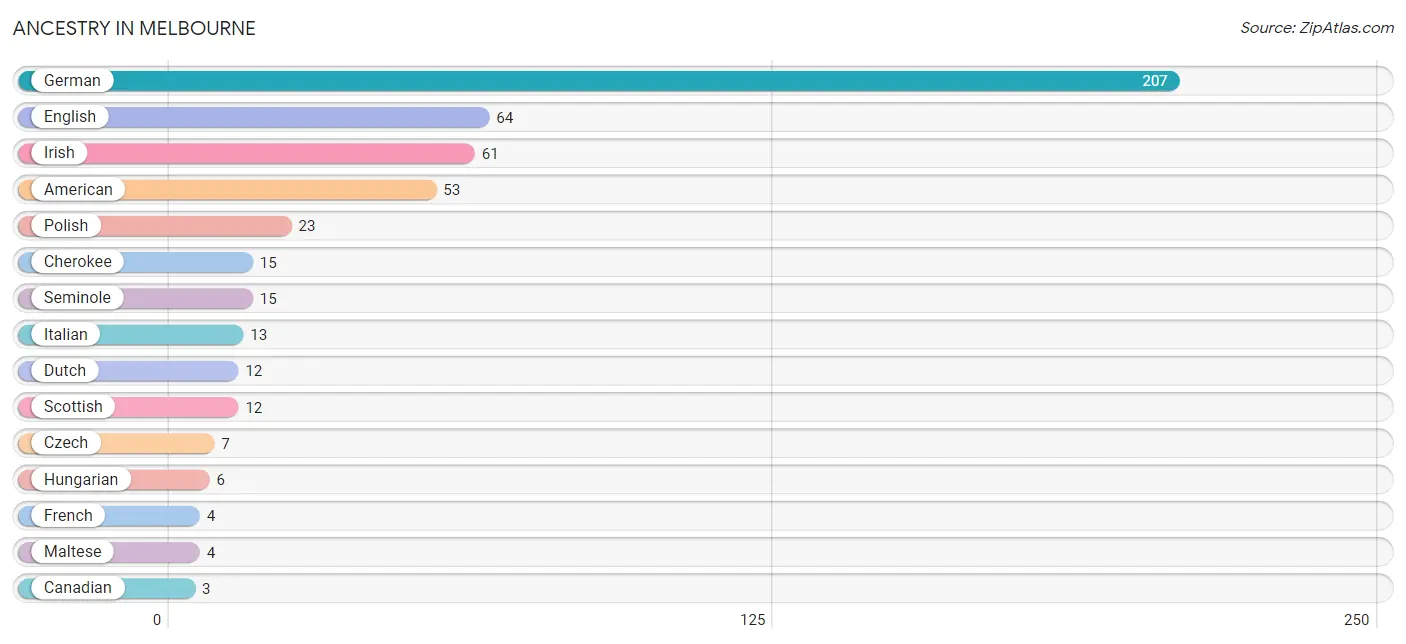
| Ancestry | # Population | % Population |
| American | 53 | 9.7% |
| British | 2 | 0.4% |
| Canadian | 3 | 0.5% |
| Cherokee | 15 | 2.7% |
| Czech | 7 | 1.3% |
| Dutch | 12 | 2.2% |
| English | 64 | 11.7% |
| European | 3 | 0.5% |
| French | 4 | 0.7% |
| German | 207 | 37.8% |
| Hungarian | 6 | 1.1% |
| Irish | 61 | 11.2% |
| Italian | 13 | 2.4% |
| Maltese | 4 | 0.7% |
| Polish | 23 | 4.2% |
| Scandinavian | 3 | 0.5% |
| Scotch-Irish | 3 | 0.5% |
| Scottish | 12 | 2.2% |
| Seminole | 15 | 2.7% |
| Thai | 2 | 0.4% |
| Turkish | 2 | 0.4% | View All 21 Rows |
Immigrants in Melbourne
The most numerous immigrant groups reported in Melbourne came from Asia (2 | 0.4%), India (2 | 0.4%), and South Central Asia (2 | 0.4%), together accounting for 1.1% of all Melbourne residents.
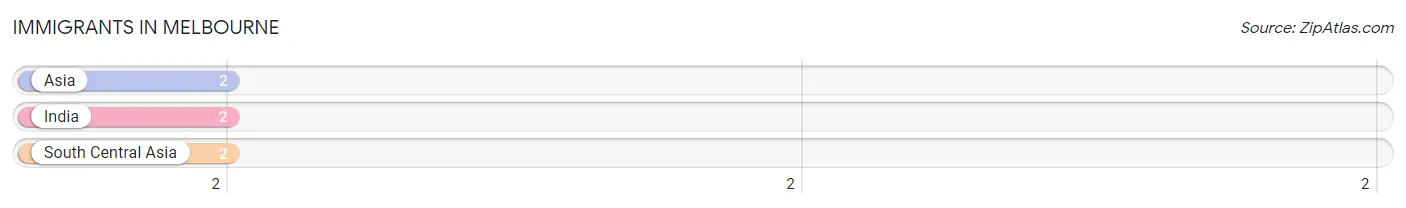
| Immigration Origin | # Population | % Population |
| Asia | 2 | 0.4% |
| India | 2 | 0.4% |
| South Central Asia | 2 | 0.4% | View All 3 Rows |
Sex and Age in Melbourne
Sex and Age in Melbourne
The most populous age groups in Melbourne are 60 to 64 Years (32 | 13.9%) for men and 80 to 84 Years (49 | 15.5%) for women.
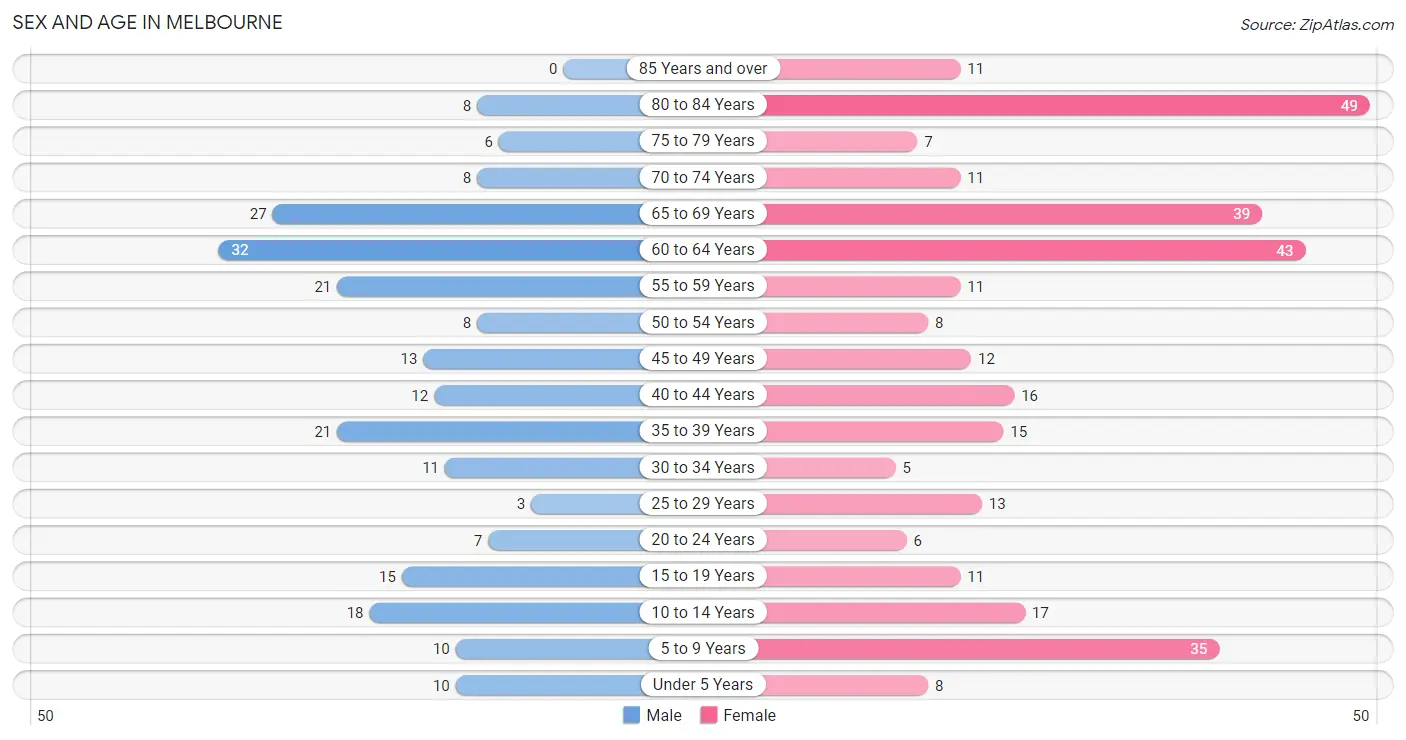
| Age Bracket | Male | Female |
| Under 5 Years | 10 (4.3%) | 8 (2.5%) |
| 5 to 9 Years | 10 (4.3%) | 35 (11.0%) |
| 10 to 14 Years | 18 (7.8%) | 17 (5.4%) |
| 15 to 19 Years | 15 (6.5%) | 11 (3.5%) |
| 20 to 24 Years | 7 (3.0%) | 6 (1.9%) |
| 25 to 29 Years | 3 (1.3%) | 13 (4.1%) |
| 30 to 34 Years | 11 (4.8%) | 5 (1.6%) |
| 35 to 39 Years | 21 (9.1%) | 15 (4.7%) |
| 40 to 44 Years | 12 (5.2%) | 16 (5.1%) |
| 45 to 49 Years | 13 (5.7%) | 12 (3.8%) |
| 50 to 54 Years | 8 (3.5%) | 8 (2.5%) |
| 55 to 59 Years | 21 (9.1%) | 11 (3.5%) |
| 60 to 64 Years | 32 (13.9%) | 43 (13.6%) |
| 65 to 69 Years | 27 (11.7%) | 39 (12.3%) |
| 70 to 74 Years | 8 (3.5%) | 11 (3.5%) |
| 75 to 79 Years | 6 (2.6%) | 7 (2.2%) |
| 80 to 84 Years | 8 (3.5%) | 49 (15.5%) |
| 85 Years and over | 0 (0.0%) | 11 (3.5%) |
| Total | 230 (100.0%) | 317 (100.0%) |
Families and Households in Melbourne
Median Family Size in Melbourne
The median family size in Melbourne is 3.23 persons per family, with single female/mother families (18 | 15.4%) accounting for the largest median family size of 5.22 persons per family. On the other hand, single male/father families (3 | 2.6%) represent the smallest median family size with 2.67 persons per family.
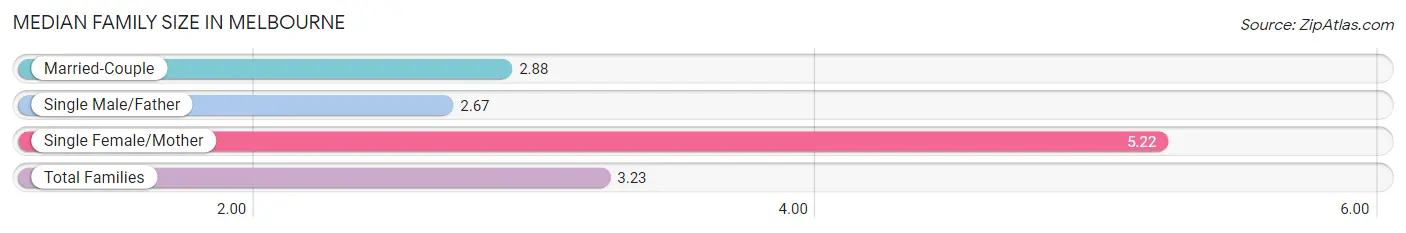
| Family Type | # Families | Family Size |
| Married-Couple | 96 (82.1%) | 2.88 |
| Single Male/Father | 3 (2.6%) | 2.67 |
| Single Female/Mother | 18 (15.4%) | 5.22 |
| Total Families | 117 (100.0%) | 3.23 |
Median Household Size in Melbourne
The median household size in Melbourne is 2.67 persons per household, with single female/mother households (18 | 10.5%) accounting for the largest median household size of 5.61 persons per household. non-family households (55 | 32.0%) represent the smallest median household size with 1.31 persons per household.
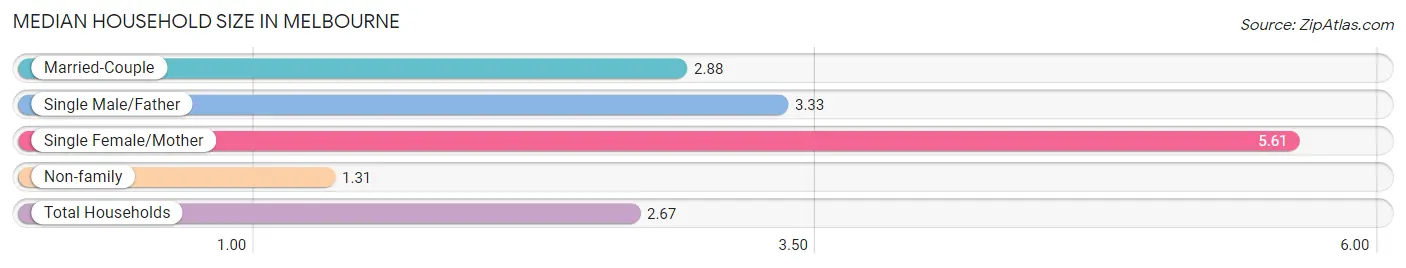
| Household Type | # Households | Household Size |
| Married-Couple | 96 (55.8%) | 2.88 |
| Single Male/Father | 3 (1.7%) | 3.33 |
| Single Female/Mother | 18 (10.5%) | 5.61 |
| Non-family | 55 (32.0%) | 1.31 |
| Total Households | 172 (100.0%) | 2.67 |
Household Size by Marriage Status in Melbourne
Out of a total of 172 households in Melbourne, 117 (68.0%) are family households, while 55 (32.0%) are nonfamily households. The most numerous type of family households are 2-person households, comprising 46, and the most common type of nonfamily households are 1-person households, comprising 40.
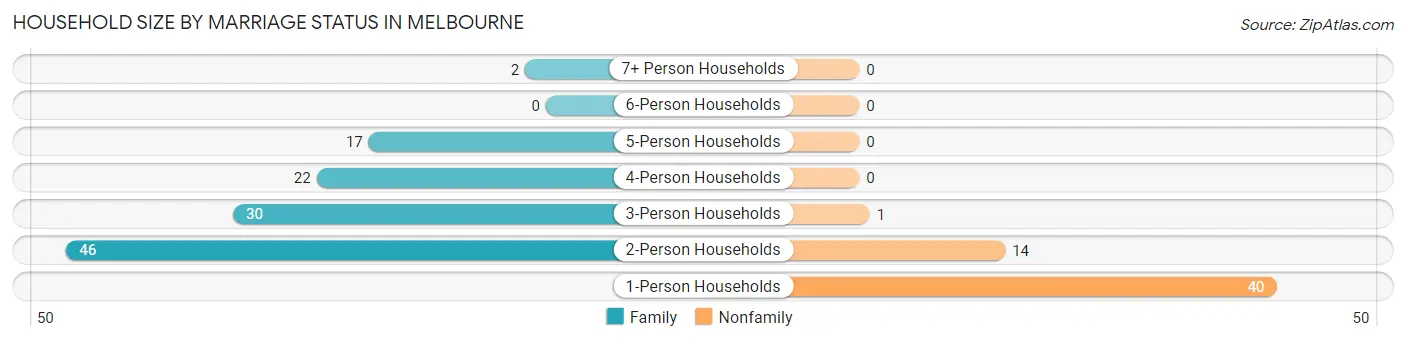
| Household Size | Family Households | Nonfamily Households |
| 1-Person Households | - | 40 (23.3%) |
| 2-Person Households | 46 (26.7%) | 14 (8.1%) |
| 3-Person Households | 30 (17.4%) | 1 (0.6%) |
| 4-Person Households | 22 (12.8%) | 0 (0.0%) |
| 5-Person Households | 17 (9.9%) | 0 (0.0%) |
| 6-Person Households | 0 (0.0%) | 0 (0.0%) |
| 7+ Person Households | 2 (1.2%) | 0 (0.0%) |
| Total | 117 (68.0%) | 55 (32.0%) |
Female Fertility in Melbourne
Fertility by Age in Melbourne
Average fertility rate in Melbourne is 49.0 births per 1,000 women. Women in the age bracket of 20 to 34 years have the highest fertility rate with 83.0 births per 1,000 women. Women in the age bracket of 20 to 34 years acount for 50.0% of all women with births.
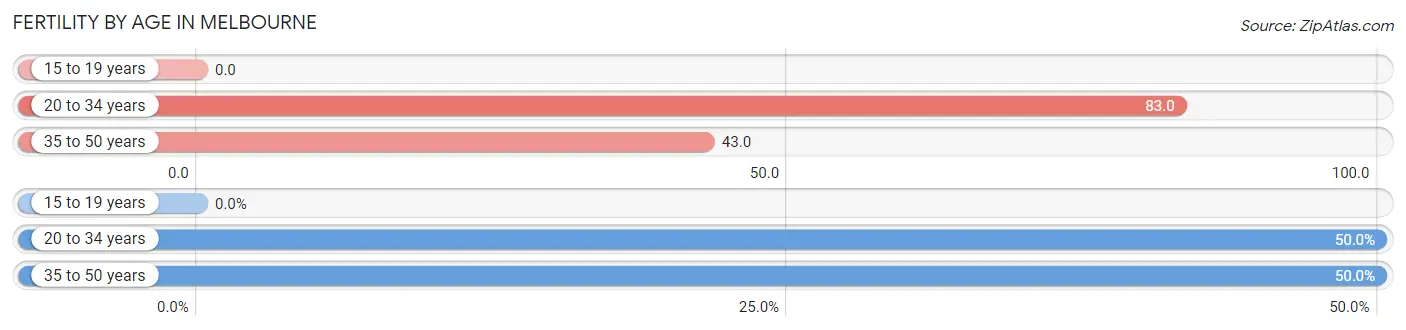
| Age Bracket | Women with Births | Births / 1,000 Women |
| 15 to 19 years | 0 (0.0%) | 0.0 |
| 20 to 34 years | 2 (50.0%) | 83.0 |
| 35 to 50 years | 2 (50.0%) | 43.0 |
| Total | 4 (100.0%) | 49.0 |
Fertility by Age by Marriage Status in Melbourne
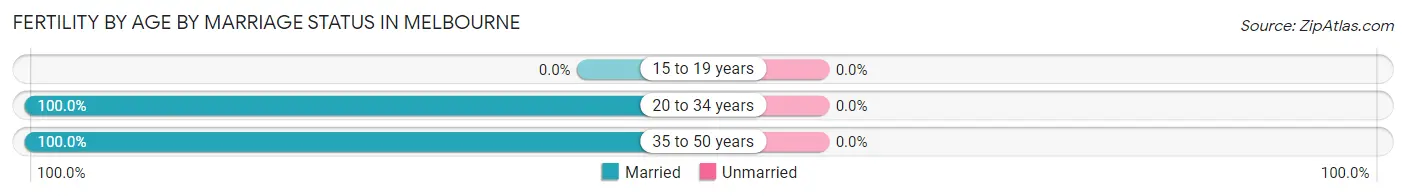
| Age Bracket | Married | Unmarried |
| 15 to 19 years | 0 (0.0%) | 0 (0.0%) |
| 20 to 34 years | 2 (100.0%) | 0 (0.0%) |
| 35 to 50 years | 2 (100.0%) | 0 (0.0%) |
| Total | 4 (100.0%) | 0 (0.0%) |
Fertility by Education in Melbourne
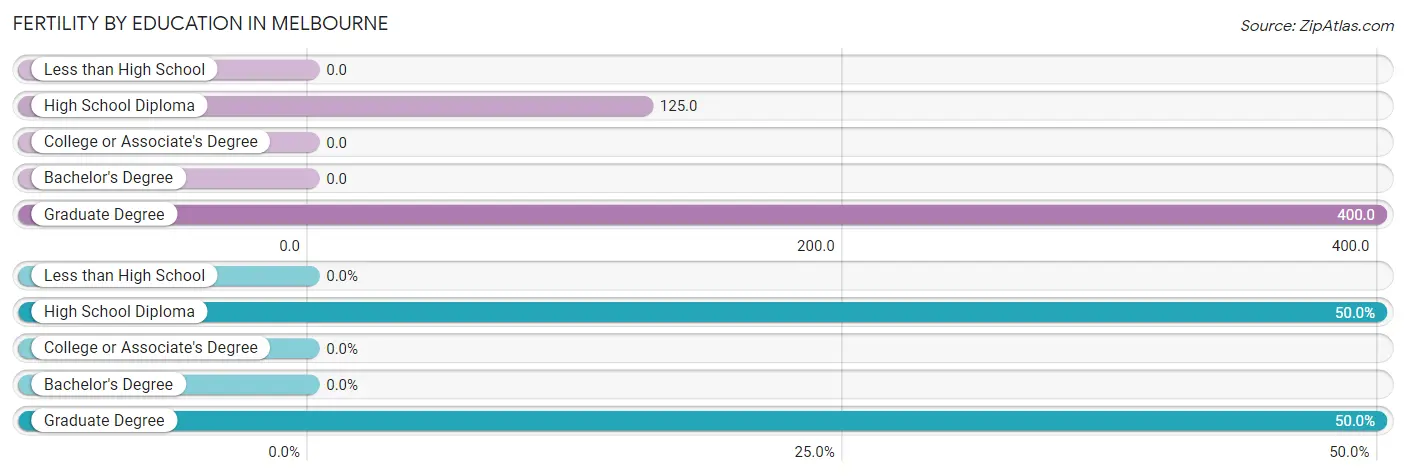
| Educational Attainment | Women with Births | Births / 1,000 Women |
| Less than High School | 0 (0.0%) | 0.0 |
| High School Diploma | 2 (50.0%) | 125.0 |
| College or Associate's Degree | 0 (0.0%) | 0.0 |
| Bachelor's Degree | 0 (0.0%) | 0.0 |
| Graduate Degree | 2 (50.0%) | 400.0 |
| Total | 4 (100.0%) | 49.0 |
Fertility by Education by Marriage Status in Melbourne
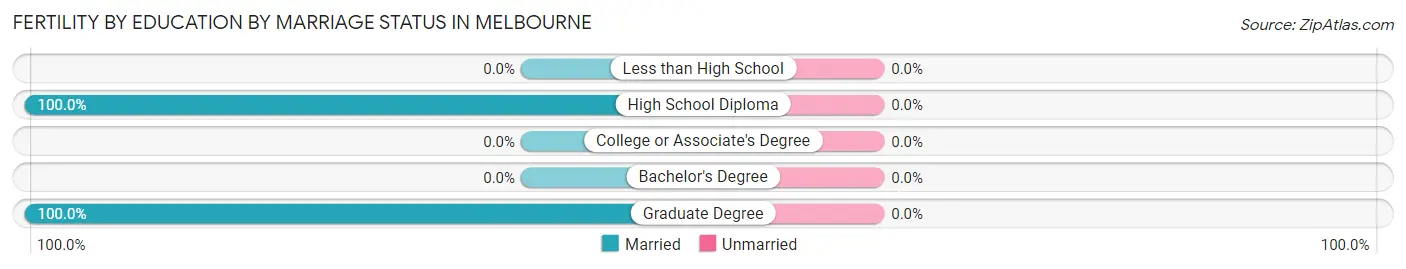
| Educational Attainment | Married | Unmarried |
| Less than High School | 0 (0.0%) | 0 (0.0%) |
| High School Diploma | 2 (100.0%) | 0 (0.0%) |
| College or Associate's Degree | 0 (0.0%) | 0 (0.0%) |
| Bachelor's Degree | 0 (0.0%) | 0 (0.0%) |
| Graduate Degree | 2 (100.0%) | 0 (0.0%) |
| Total | 4 (100.0%) | 0 (0.0%) |
Employment Characteristics in Melbourne
Employment by Class of Employer in Melbourne
Among the 180 employed individuals in Melbourne, private company employees (132 | 73.3%), not-for-profit organizations (13 | 7.2%), and self-employed (incorporated) (12 | 6.7%) make up the most common classes of employment.
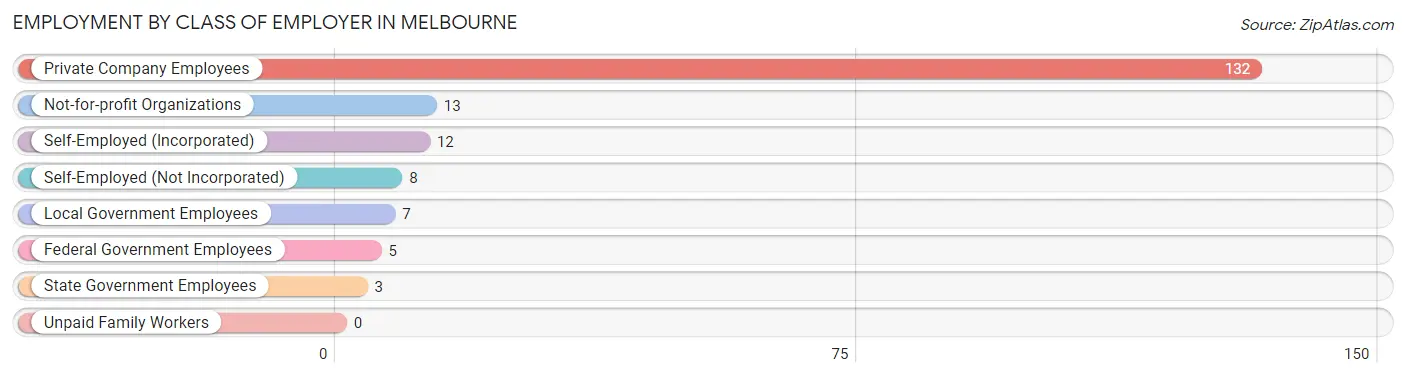
| Employer Class | # Employees | % Employees |
| Private Company Employees | 132 | 73.3% |
| Self-Employed (Incorporated) | 12 | 6.7% |
| Self-Employed (Not Incorporated) | 8 | 4.4% |
| Not-for-profit Organizations | 13 | 7.2% |
| Local Government Employees | 7 | 3.9% |
| State Government Employees | 3 | 1.7% |
| Federal Government Employees | 5 | 2.8% |
| Unpaid Family Workers | 0 | 0.0% |
| Total | 180 | 100.0% |
Employment Status by Age in Melbourne
According to the labor force statistics for Melbourne, out of the total population over 16 years of age (447), 43.4% or 194 individuals are in the labor force, with 6.7% or 13 of them unemployed. The age group with the highest labor force participation rate is 25 to 29 years, with 100.0% or 16 individuals in the labor force. Within the labor force, the 20 to 24 years age range has the highest percentage of unemployed individuals, with 37.5% or 3 of them being unemployed.
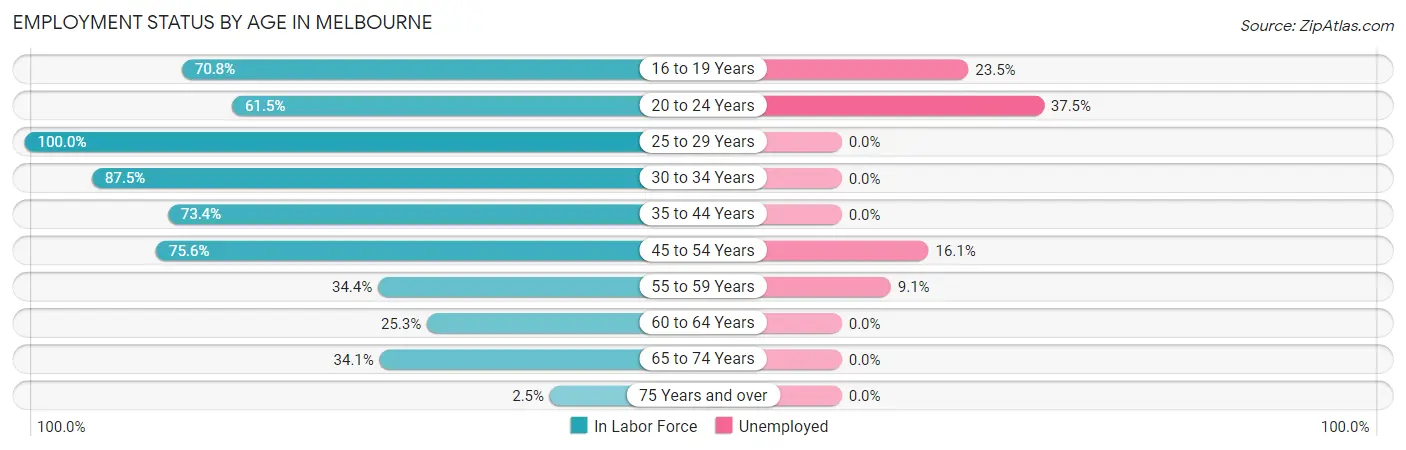
| Age Bracket | In Labor Force | Unemployed |
| 16 to 19 Years | 17 (70.8%) | 4 (23.5%) |
| 20 to 24 Years | 8 (61.5%) | 3 (37.5%) |
| 25 to 29 Years | 16 (100.0%) | 0 (0.0%) |
| 30 to 34 Years | 14 (87.5%) | 0 (0.0%) |
| 35 to 44 Years | 47 (73.4%) | 0 (0.0%) |
| 45 to 54 Years | 31 (75.6%) | 5 (16.1%) |
| 55 to 59 Years | 11 (34.4%) | 1 (9.1%) |
| 60 to 64 Years | 19 (25.3%) | 0 (0.0%) |
| 65 to 74 Years | 29 (34.1%) | 0 (0.0%) |
| 75 Years and over | 2 (2.5%) | 0 (0.0%) |
| Total | 194 (43.4%) | 13 (6.7%) |
Employment Status by Educational Attainment in Melbourne
According to labor force statistics for Melbourne, 56.6% of individuals (138) out of the total population between 25 and 64 years of age (244) are in the labor force, with 4.3% or 6 of them being unemployed. The group with the highest labor force participation rate are those with the educational attainment of college / associate degree, with 83.6% or 61 individuals in the labor force. Within the labor force, individuals with bachelor's degree or higher education have the highest percentage of unemployment, with 8.6% or 3 of them being unemployed.
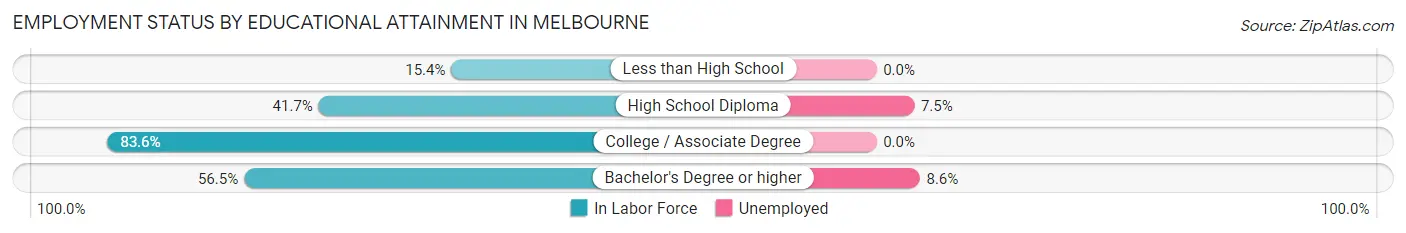
| Educational Attainment | In Labor Force | Unemployed |
| Less than High School | 2 (15.4%) | 0 (0.0%) |
| High School Diploma | 40 (41.7%) | 7 (7.5%) |
| College / Associate Degree | 61 (83.6%) | 0 (0.0%) |
| Bachelor's Degree or higher | 35 (56.5%) | 5 (8.6%) |
| Total | 138 (56.6%) | 10 (4.3%) |
Employment Occupations by Sex in Melbourne
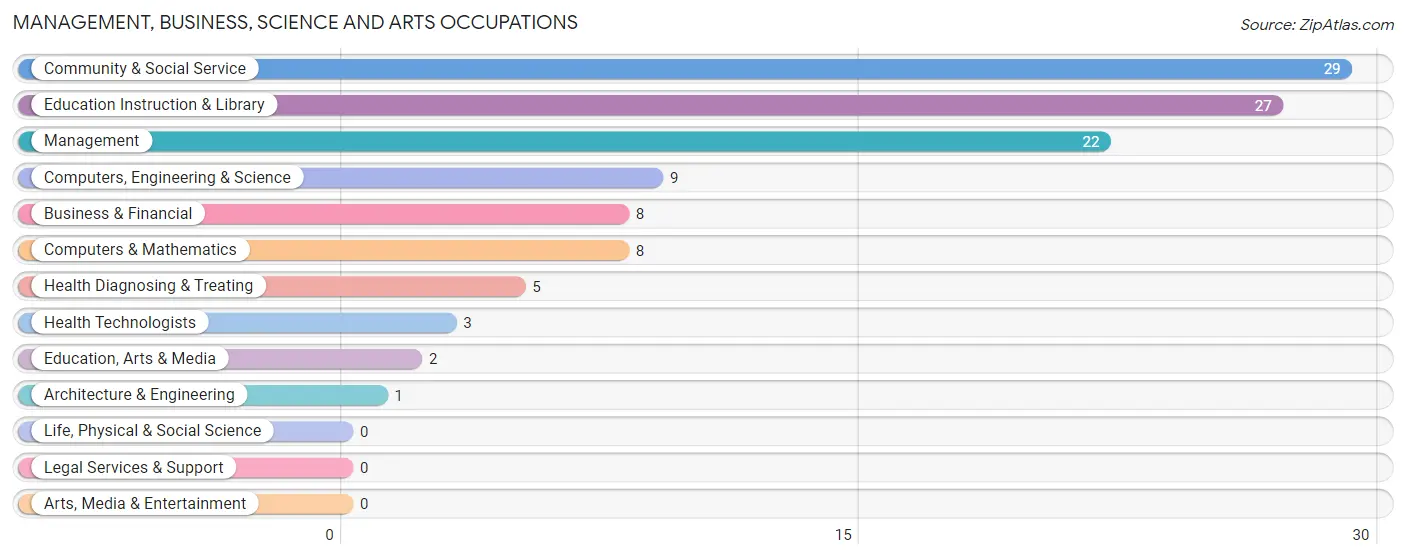
Management, Business, Science and Arts Occupations
The most common Management, Business, Science and Arts occupations in Melbourne are Community & Social Service (29 | 16.0%), Education Instruction & Library (27 | 14.9%), Management (22 | 12.1%), Computers, Engineering & Science (9 | 5.0%), and Business & Financial (8 | 4.4%).
Management, Business, Science and Arts Occupations by Sex
Within the Management, Business, Science and Arts occupations in Melbourne, the most male-oriented occupations are Computers, Engineering & Science (100.0%), Computers & Mathematics (100.0%), and Architecture & Engineering (100.0%), while the most female-oriented occupations are Community & Social Service (100.0%), Education, Arts & Media (100.0%), and Education Instruction & Library (100.0%).
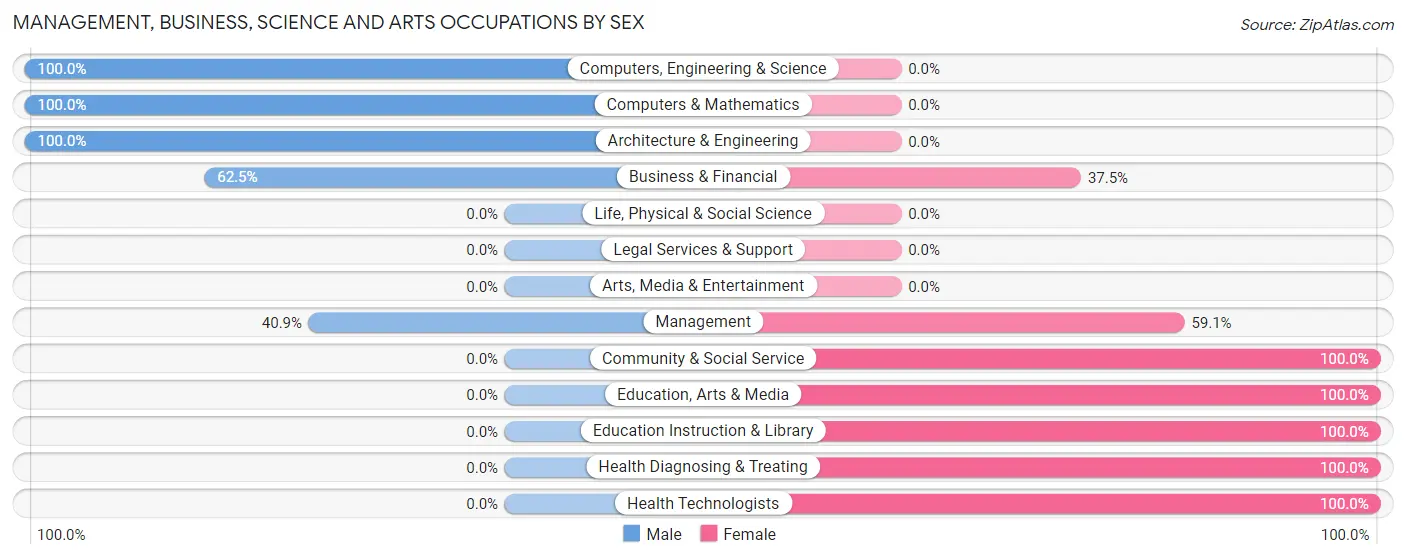
| Occupation | Male | Female |
| Management | 9 (40.9%) | 13 (59.1%) |
| Business & Financial | 5 (62.5%) | 3 (37.5%) |
| Computers, Engineering & Science | 9 (100.0%) | 0 (0.0%) |
| Computers & Mathematics | 8 (100.0%) | 0 (0.0%) |
| Architecture & Engineering | 1 (100.0%) | 0 (0.0%) |
| Life, Physical & Social Science | 0 (0.0%) | 0 (0.0%) |
| Community & Social Service | 0 (0.0%) | 29 (100.0%) |
| Education, Arts & Media | 0 (0.0%) | 2 (100.0%) |
| Legal Services & Support | 0 (0.0%) | 0 (0.0%) |
| Education Instruction & Library | 0 (0.0%) | 27 (100.0%) |
| Arts, Media & Entertainment | 0 (0.0%) | 0 (0.0%) |
| Health Diagnosing & Treating | 0 (0.0%) | 5 (100.0%) |
| Health Technologists | 0 (0.0%) | 3 (100.0%) |
| Total (Category) | 23 (31.5%) | 50 (68.5%) |
| Total (Overall) | 81 (44.8%) | 100 (55.2%) |
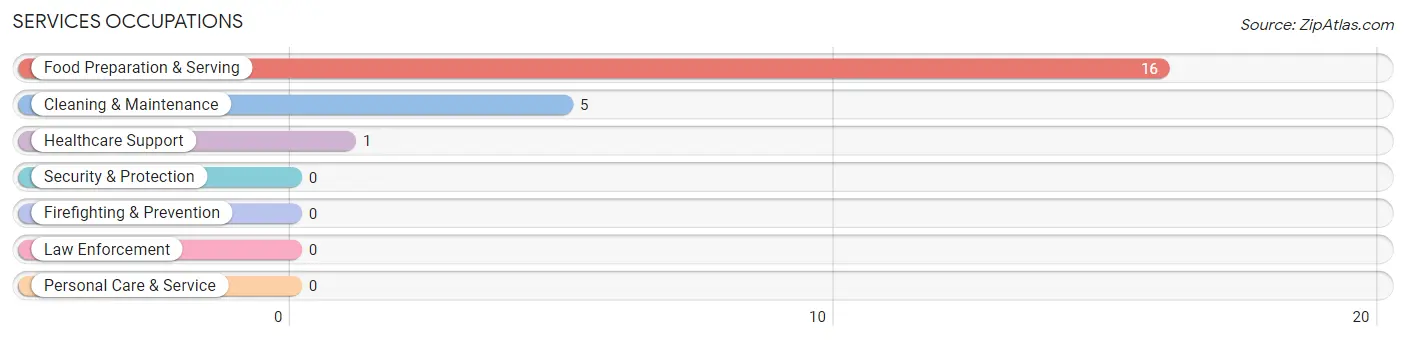
Services Occupations
The most common Services occupations in Melbourne are Food Preparation & Serving (16 | 8.8%), Cleaning & Maintenance (5 | 2.8%), and Healthcare Support (1 | 0.5%).
Services Occupations by Sex
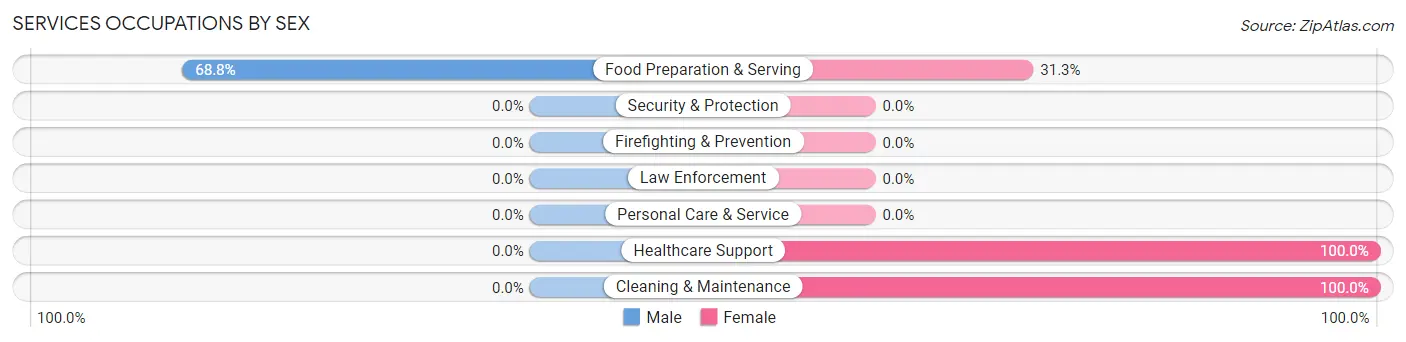
| Occupation | Male | Female |
| Healthcare Support | 0 (0.0%) | 1 (100.0%) |
| Security & Protection | 0 (0.0%) | 0 (0.0%) |
| Firefighting & Prevention | 0 (0.0%) | 0 (0.0%) |
| Law Enforcement | 0 (0.0%) | 0 (0.0%) |
| Food Preparation & Serving | 11 (68.8%) | 5 (31.2%) |
| Cleaning & Maintenance | 0 (0.0%) | 5 (100.0%) |
| Personal Care & Service | 0 (0.0%) | 0 (0.0%) |
| Total (Category) | 11 (50.0%) | 11 (50.0%) |
| Total (Overall) | 81 (44.8%) | 100 (55.2%) |
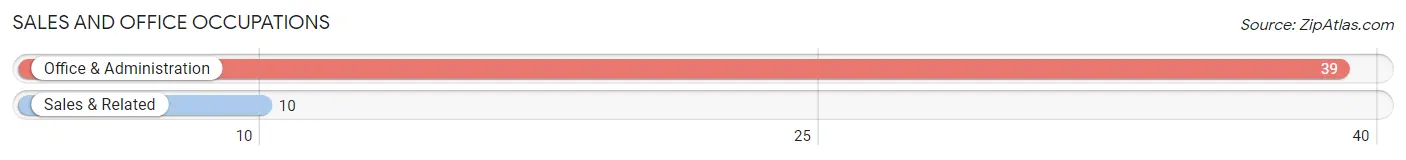
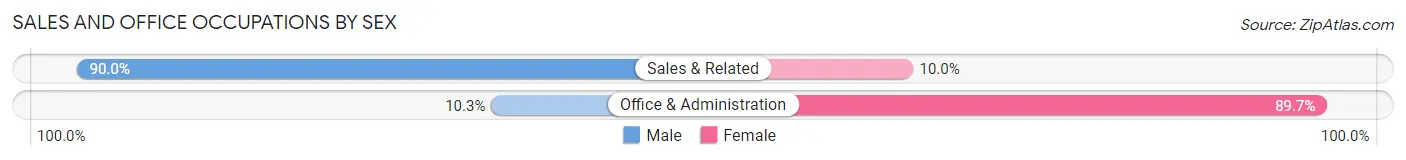
Sales and Office Occupations
The most common Sales and Office occupations in Melbourne are Office & Administration (39 | 21.5%), and Sales & Related (10 | 5.5%).
Sales and Office Occupations by Sex
| Occupation | Male | Female |
| Sales & Related | 9 (90.0%) | 1 (10.0%) |
| Office & Administration | 4 (10.3%) | 35 (89.7%) |
| Total (Category) | 13 (26.5%) | 36 (73.5%) |
| Total (Overall) | 81 (44.8%) | 100 (55.2%) |
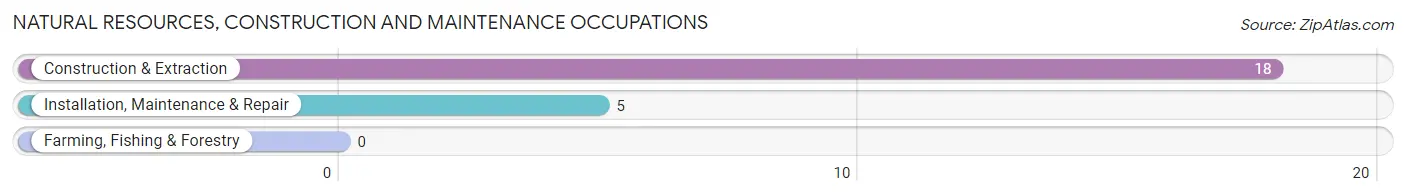
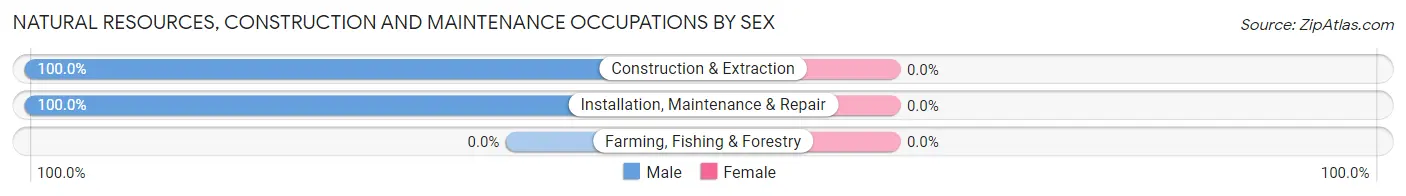
Natural Resources, Construction and Maintenance Occupations
The most common Natural Resources, Construction and Maintenance occupations in Melbourne are Construction & Extraction (18 | 9.9%), and Installation, Maintenance & Repair (5 | 2.8%).
Natural Resources, Construction and Maintenance Occupations by Sex
| Occupation | Male | Female |
| Farming, Fishing & Forestry | 0 (0.0%) | 0 (0.0%) |
| Construction & Extraction | 18 (100.0%) | 0 (0.0%) |
| Installation, Maintenance & Repair | 5 (100.0%) | 0 (0.0%) |
| Total (Category) | 23 (100.0%) | 0 (0.0%) |
| Total (Overall) | 81 (44.8%) | 100 (55.2%) |
Production, Transportation and Moving Occupations
The most common Production, Transportation and Moving occupations in Melbourne are Production (6 | 3.3%), Transportation (4 | 2.2%), and Material Moving (4 | 2.2%).
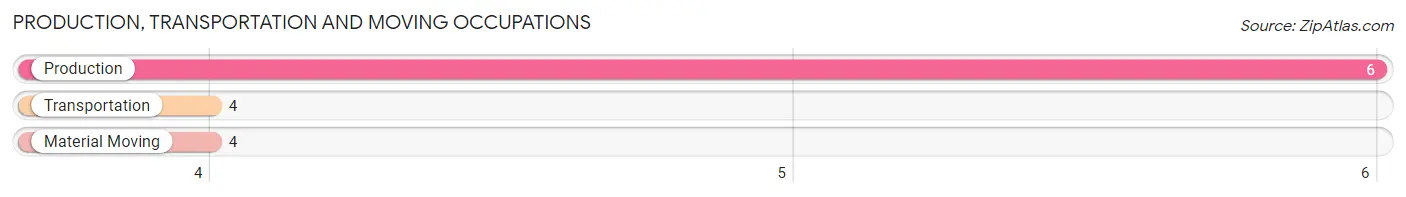
Production, Transportation and Moving Occupations by Sex
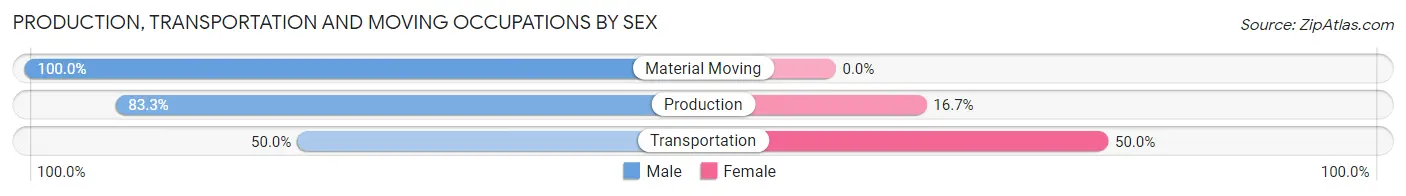
| Occupation | Male | Female |
| Production | 5 (83.3%) | 1 (16.7%) |
| Transportation | 2 (50.0%) | 2 (50.0%) |
| Material Moving | 4 (100.0%) | 0 (0.0%) |
| Total (Category) | 11 (78.6%) | 3 (21.4%) |
| Total (Overall) | 81 (44.8%) | 100 (55.2%) |
Employment Industries by Sex in Melbourne
Employment Industries in Melbourne
The major employment industries in Melbourne include Educational Services (27 | 14.9%), Manufacturing (20 | 11.1%), Professional & Scientific (19 | 10.5%), Health Care & Social Assistance (18 | 9.9%), and Construction (17 | 9.4%).
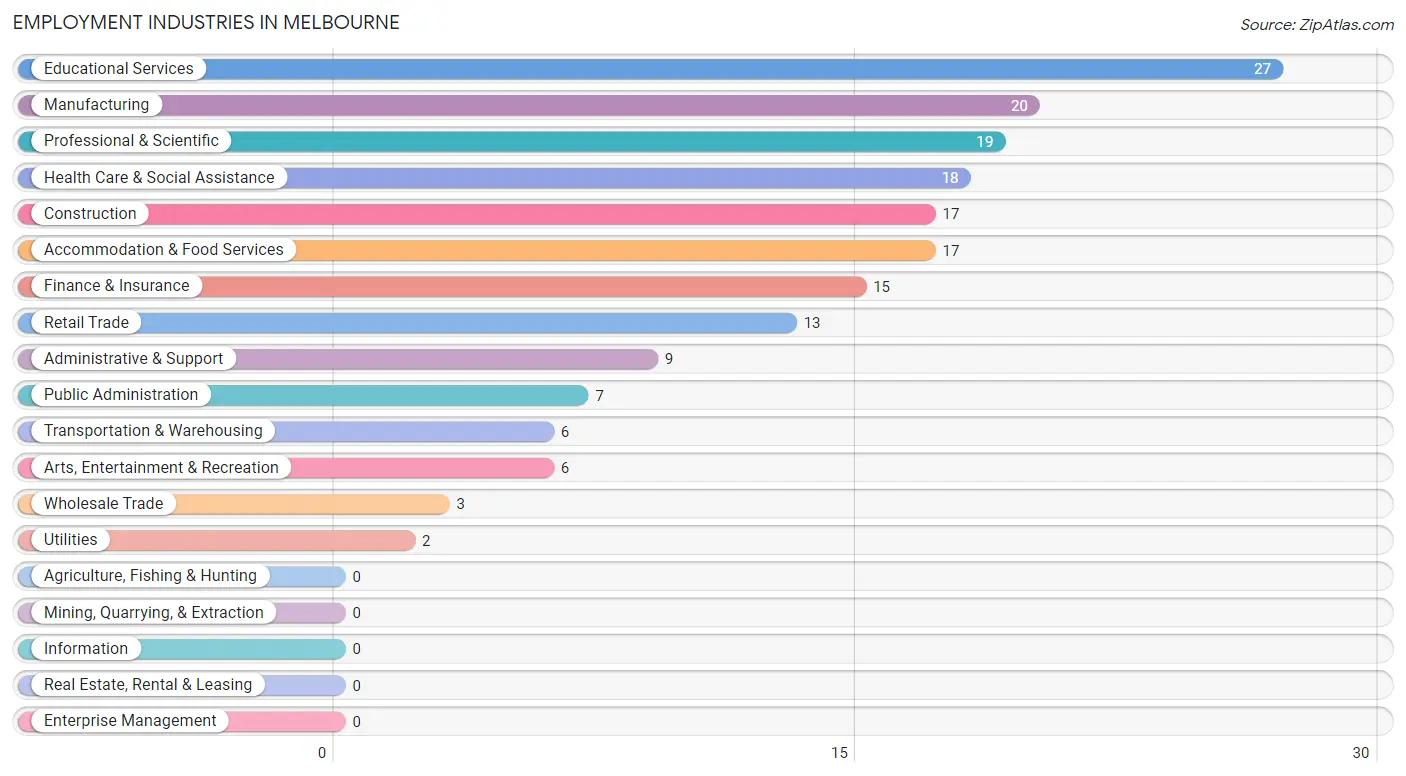
Employment Industries by Sex in Melbourne
The Melbourne industries that see more men than women are Construction (100.0%), Wholesale Trade (100.0%), and Utilities (100.0%), whereas the industries that tend to have a higher number of women are Health Care & Social Assistance (100.0%), Educational Services (96.3%), and Administrative & Support (88.9%).
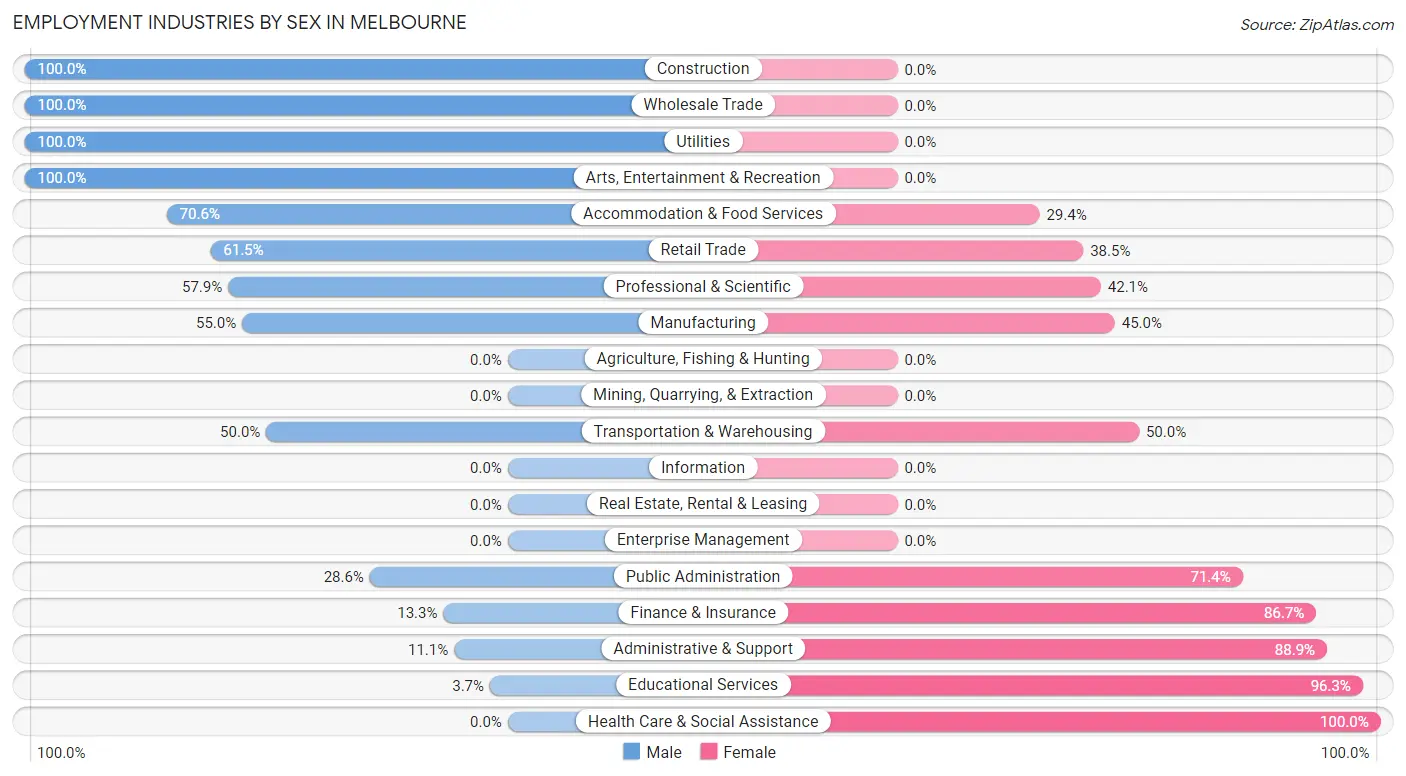
| Industry | Male | Female |
| Agriculture, Fishing & Hunting | 0 (0.0%) | 0 (0.0%) |
| Mining, Quarrying, & Extraction | 0 (0.0%) | 0 (0.0%) |
| Construction | 17 (100.0%) | 0 (0.0%) |
| Manufacturing | 11 (55.0%) | 9 (45.0%) |
| Wholesale Trade | 3 (100.0%) | 0 (0.0%) |
| Retail Trade | 8 (61.5%) | 5 (38.5%) |
| Transportation & Warehousing | 3 (50.0%) | 3 (50.0%) |
| Utilities | 2 (100.0%) | 0 (0.0%) |
| Information | 0 (0.0%) | 0 (0.0%) |
| Finance & Insurance | 2 (13.3%) | 13 (86.7%) |
| Real Estate, Rental & Leasing | 0 (0.0%) | 0 (0.0%) |
| Professional & Scientific | 11 (57.9%) | 8 (42.1%) |
| Enterprise Management | 0 (0.0%) | 0 (0.0%) |
| Administrative & Support | 1 (11.1%) | 8 (88.9%) |
| Educational Services | 1 (3.7%) | 26 (96.3%) |
| Health Care & Social Assistance | 0 (0.0%) | 18 (100.0%) |
| Arts, Entertainment & Recreation | 6 (100.0%) | 0 (0.0%) |
| Accommodation & Food Services | 12 (70.6%) | 5 (29.4%) |
| Public Administration | 2 (28.6%) | 5 (71.4%) |
| Total | 81 (44.8%) | 100 (55.2%) |
Education in Melbourne
School Enrollment in Melbourne
The most common levels of schooling among the 128 students in Melbourne are elementary school (40 | 31.2%), middle school (31 | 24.2%), and high school (26 | 20.3%).
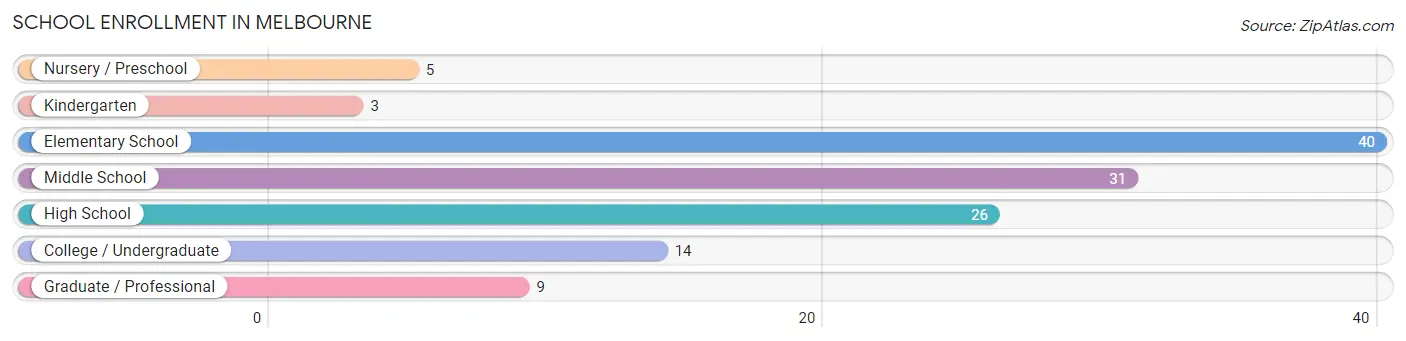
| School Level | # Students | % Students |
| Nursery / Preschool | 5 | 3.9% |
| Kindergarten | 3 | 2.3% |
| Elementary School | 40 | 31.2% |
| Middle School | 31 | 24.2% |
| High School | 26 | 20.3% |
| College / Undergraduate | 14 | 10.9% |
| Graduate / Professional | 9 | 7.0% |
| Total | 128 | 100.0% |
School Enrollment by Age by Funding Source in Melbourne
Out of a total of 128 students who are enrolled in schools in Melbourne, 19 (14.8%) attend a private institution, while the remaining 109 (85.2%) are enrolled in public schools. The age group of 3 to 4 year olds has the highest likelihood of being enrolled in private schools, with 1 (33.3% in the age bracket) enrolled. Conversely, the age group of 18 to 19 year olds has the lowest likelihood of being enrolled in a private school, with 11 (100.0% in the age bracket) attending a public institution.
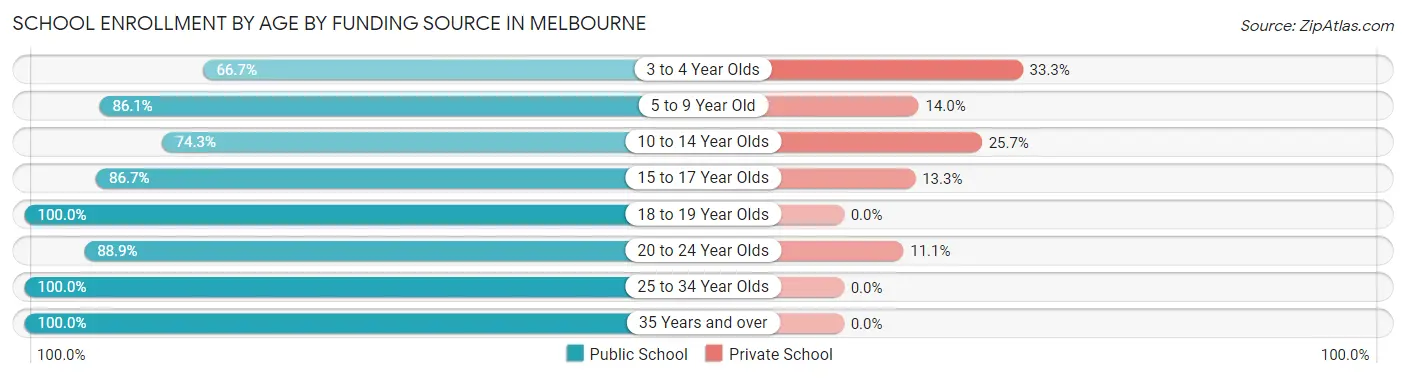
| Age Bracket | Public School | Private School |
| 3 to 4 Year Olds | 2 (66.7%) | 1 (33.3%) |
| 5 to 9 Year Old | 37 (86.1%) | 6 (14.0%) |
| 10 to 14 Year Olds | 26 (74.3%) | 9 (25.7%) |
| 15 to 17 Year Olds | 13 (86.7%) | 2 (13.3%) |
| 18 to 19 Year Olds | 11 (100.0%) | 0 (0.0%) |
| 20 to 24 Year Olds | 8 (88.9%) | 1 (11.1%) |
| 25 to 34 Year Olds | 4 (100.0%) | 0 (0.0%) |
| 35 Years and over | 8 (100.0%) | 0 (0.0%) |
| Total | 109 (85.2%) | 19 (14.8%) |
Educational Attainment by Field of Study in Melbourne
Education (52 | 32.5%), visual & performing arts (28 | 17.5%), science & technology (25 | 15.6%), business (12 | 7.5%), and computers & mathematics (8 | 5.0%) are the most common fields of study among 160 individuals in Melbourne who have obtained a bachelor's degree or higher.
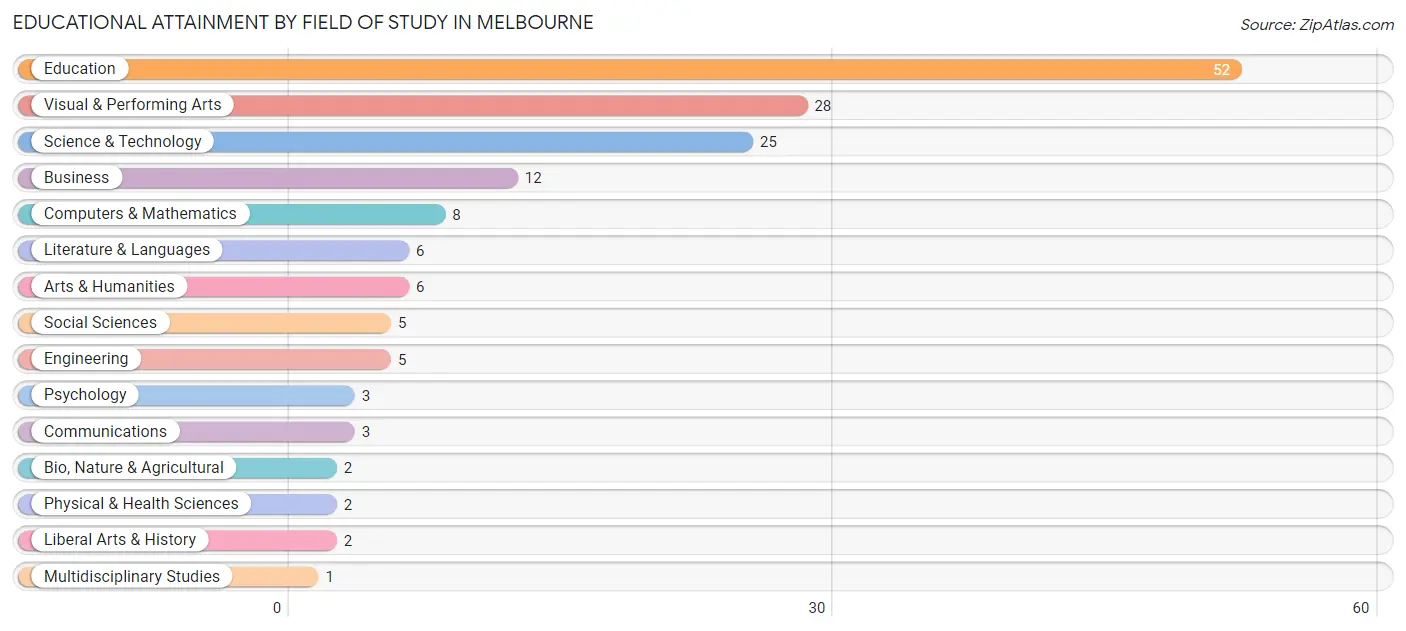
| Field of Study | # Graduates | % Graduates |
| Computers & Mathematics | 8 | 5.0% |
| Bio, Nature & Agricultural | 2 | 1.3% |
| Physical & Health Sciences | 2 | 1.3% |
| Psychology | 3 | 1.9% |
| Social Sciences | 5 | 3.1% |
| Engineering | 5 | 3.1% |
| Multidisciplinary Studies | 1 | 0.6% |
| Science & Technology | 25 | 15.6% |
| Business | 12 | 7.5% |
| Education | 52 | 32.5% |
| Literature & Languages | 6 | 3.7% |
| Liberal Arts & History | 2 | 1.3% |
| Visual & Performing Arts | 28 | 17.5% |
| Communications | 3 | 1.9% |
| Arts & Humanities | 6 | 3.7% |
| Total | 160 | 100.0% |
Transportation & Commute in Melbourne
Vehicle Availability by Sex in Melbourne
The most prevalent vehicle ownership categories in Melbourne are males with 2 vehicles (27, accounting for 33.3%) and females with 2 vehicles (34, making up 35.5%).
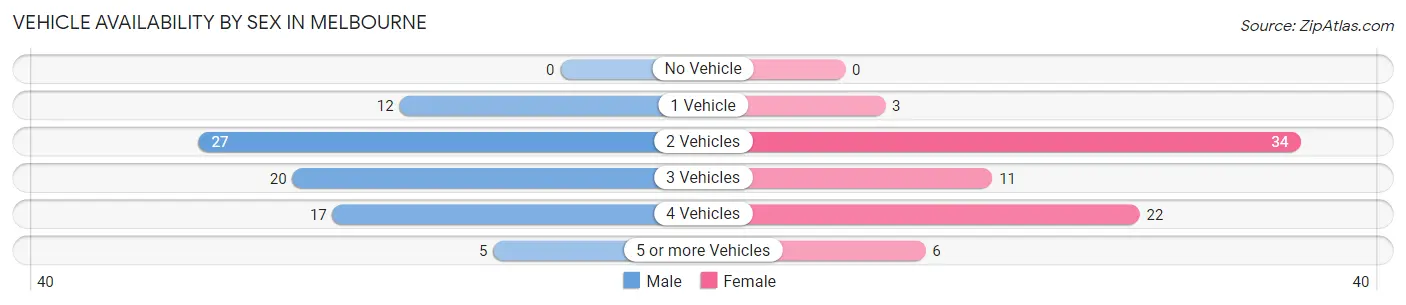
| Vehicles Available | Male | Female |
| No Vehicle | 0 (0.0%) | 0 (0.0%) |
| 1 Vehicle | 12 (14.8%) | 3 (4.0%) |
| 2 Vehicles | 27 (33.3%) | 34 (44.7%) |
| 3 Vehicles | 20 (24.7%) | 11 (14.5%) |
| 4 Vehicles | 17 (21.0%) | 22 (28.9%) |
| 5 or more Vehicles | 5 (6.2%) | 6 (7.9%) |
| Total | 81 (100.0%) | 76 (100.0%) |
Commute Time in Melbourne
The most frequently occuring commute durations in Melbourne are 30 to 34 minutes (32 commuters, 20.0%), 10 to 14 minutes (30 commuters, 18.8%), and 20 to 24 minutes (29 commuters, 18.1%).
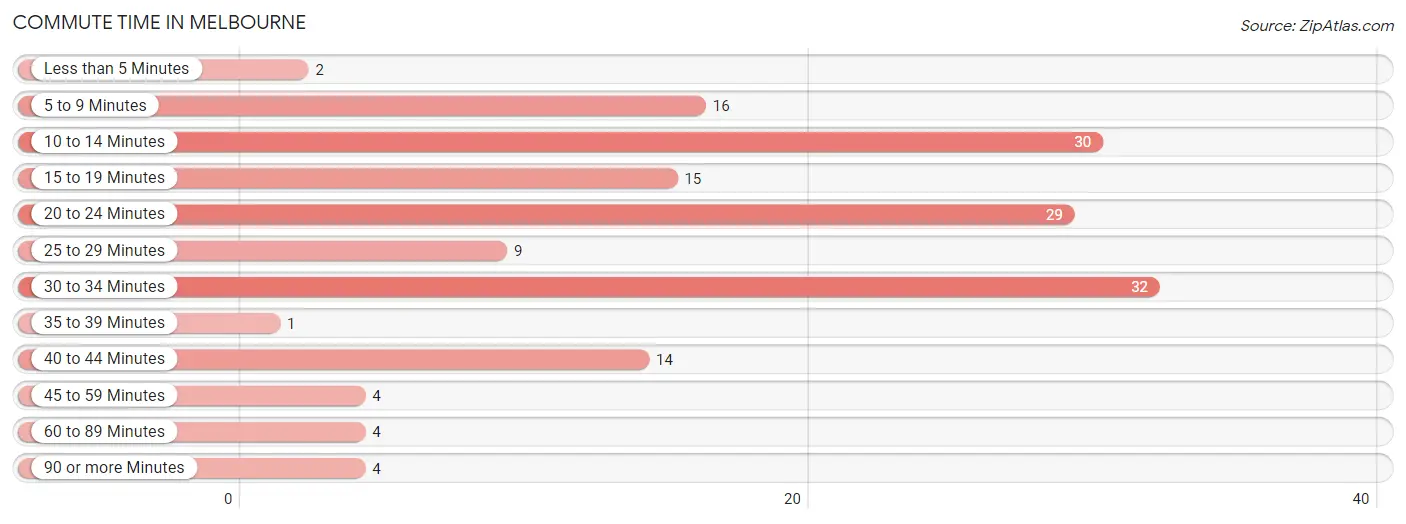
| Commute Time | # Commuters | % Commuters |
| Less than 5 Minutes | 2 | 1.3% |
| 5 to 9 Minutes | 16 | 10.0% |
| 10 to 14 Minutes | 30 | 18.8% |
| 15 to 19 Minutes | 15 | 9.4% |
| 20 to 24 Minutes | 29 | 18.1% |
| 25 to 29 Minutes | 9 | 5.6% |
| 30 to 34 Minutes | 32 | 20.0% |
| 35 to 39 Minutes | 1 | 0.6% |
| 40 to 44 Minutes | 14 | 8.7% |
| 45 to 59 Minutes | 4 | 2.5% |
| 60 to 89 Minutes | 4 | 2.5% |
| 90 or more Minutes | 4 | 2.5% |
Commute Time by Sex in Melbourne
The most common commute times in Melbourne are 5 to 9 minutes (14 commuters, 20.6%) for males and 30 to 34 minutes (25 commuters, 27.2%) for females.
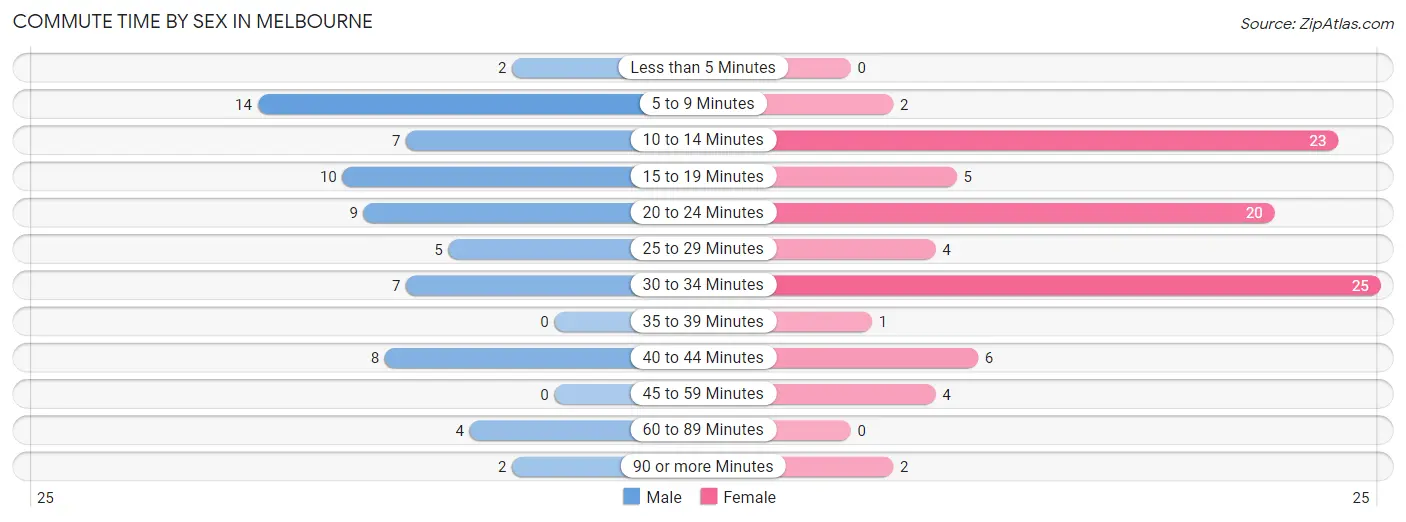
| Commute Time | Male | Female |
| Less than 5 Minutes | 2 (2.9%) | 0 (0.0%) |
| 5 to 9 Minutes | 14 (20.6%) | 2 (2.2%) |
| 10 to 14 Minutes | 7 (10.3%) | 23 (25.0%) |
| 15 to 19 Minutes | 10 (14.7%) | 5 (5.4%) |
| 20 to 24 Minutes | 9 (13.2%) | 20 (21.7%) |
| 25 to 29 Minutes | 5 (7.3%) | 4 (4.3%) |
| 30 to 34 Minutes | 7 (10.3%) | 25 (27.2%) |
| 35 to 39 Minutes | 0 (0.0%) | 1 (1.1%) |
| 40 to 44 Minutes | 8 (11.8%) | 6 (6.5%) |
| 45 to 59 Minutes | 0 (0.0%) | 4 (4.3%) |
| 60 to 89 Minutes | 4 (5.9%) | 0 (0.0%) |
| 90 or more Minutes | 2 (2.9%) | 2 (2.2%) |
Time of Departure to Work by Sex in Melbourne
The most frequent times of departure to work in Melbourne are 6:30 AM to 6:59 AM (16, 23.5%) for males and 6:00 AM to 6:29 AM (27, 29.3%) for females.
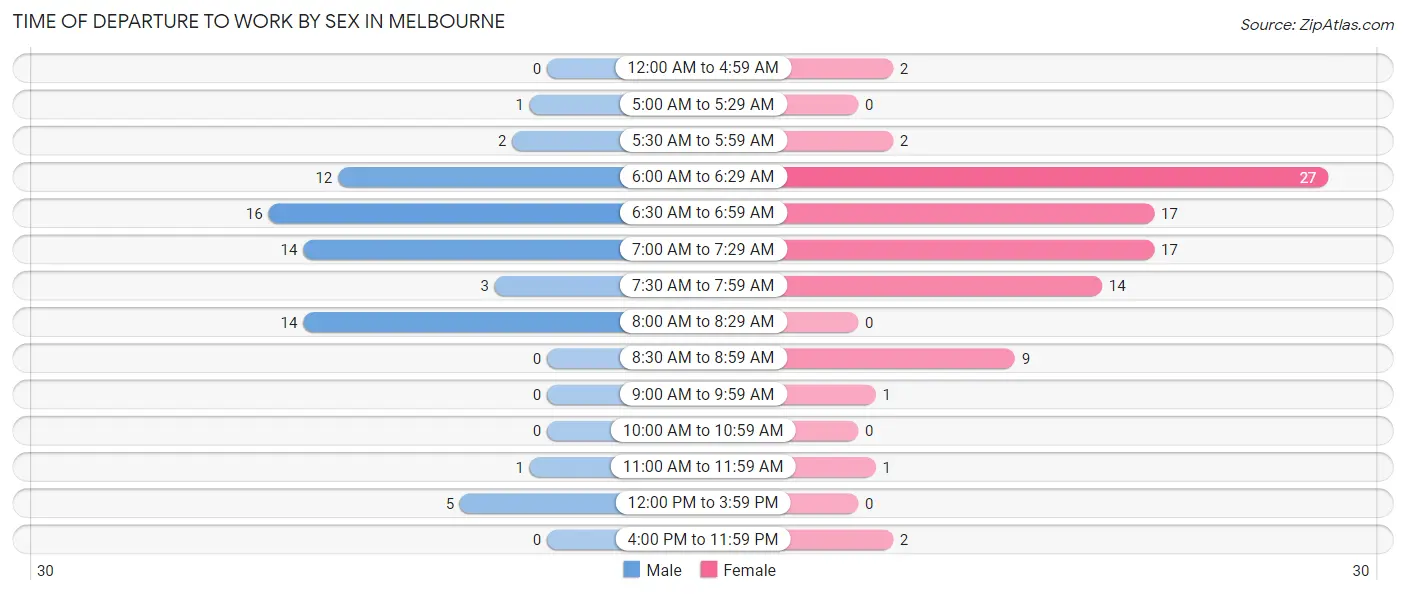
| Time of Departure | Male | Female |
| 12:00 AM to 4:59 AM | 0 (0.0%) | 2 (2.2%) |
| 5:00 AM to 5:29 AM | 1 (1.5%) | 0 (0.0%) |
| 5:30 AM to 5:59 AM | 2 (2.9%) | 2 (2.2%) |
| 6:00 AM to 6:29 AM | 12 (17.6%) | 27 (29.3%) |
| 6:30 AM to 6:59 AM | 16 (23.5%) | 17 (18.5%) |
| 7:00 AM to 7:29 AM | 14 (20.6%) | 17 (18.5%) |
| 7:30 AM to 7:59 AM | 3 (4.4%) | 14 (15.2%) |
| 8:00 AM to 8:29 AM | 14 (20.6%) | 0 (0.0%) |
| 8:30 AM to 8:59 AM | 0 (0.0%) | 9 (9.8%) |
| 9:00 AM to 9:59 AM | 0 (0.0%) | 1 (1.1%) |
| 10:00 AM to 10:59 AM | 0 (0.0%) | 0 (0.0%) |
| 11:00 AM to 11:59 AM | 1 (1.5%) | 1 (1.1%) |
| 12:00 PM to 3:59 PM | 5 (7.3%) | 0 (0.0%) |
| 4:00 PM to 11:59 PM | 0 (0.0%) | 2 (2.2%) |
| Total | 68 (100.0%) | 92 (100.0%) |
Housing Occupancy in Melbourne
Occupancy by Ownership in Melbourne
Of the total 172 dwellings in Melbourne, owner-occupied units account for 158 (91.9%), while renter-occupied units make up 14 (8.1%).
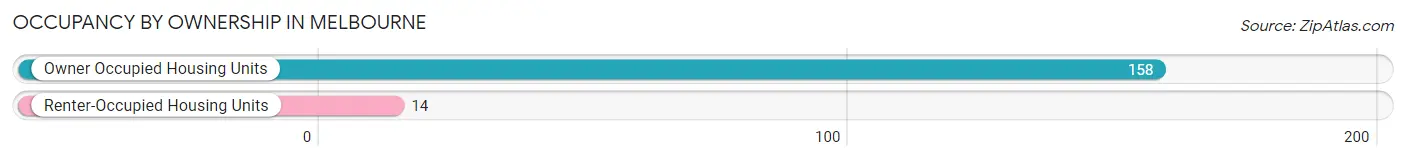
| Occupancy | # Housing Units | % Housing Units |
| Owner Occupied Housing Units | 158 | 91.9% |
| Renter-Occupied Housing Units | 14 | 8.1% |
| Total Occupied Housing Units | 172 | 100.0% |
Occupancy by Household Size in Melbourne
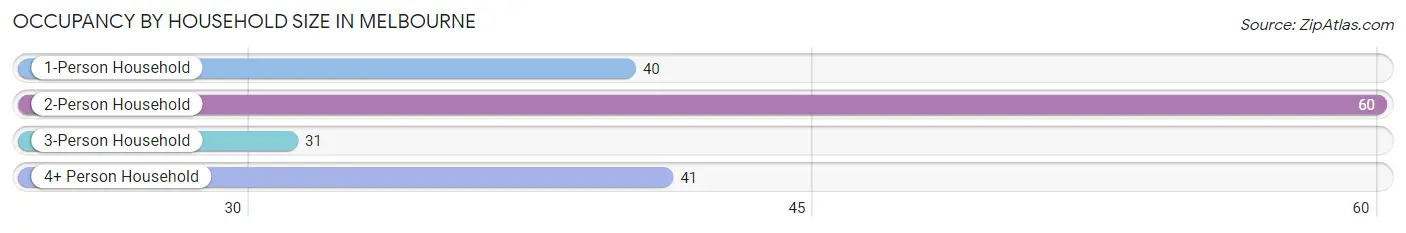
| Household Size | # Housing Units | % Housing Units |
| 1-Person Household | 40 | 23.3% |
| 2-Person Household | 60 | 34.9% |
| 3-Person Household | 31 | 18.0% |
| 4+ Person Household | 41 | 23.8% |
| Total Housing Units | 172 | 100.0% |
Occupancy by Ownership by Household Size in Melbourne
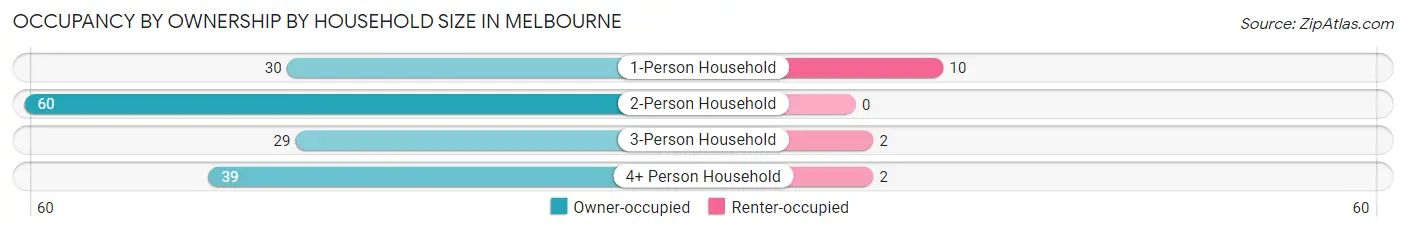
| Household Size | Owner-occupied | Renter-occupied |
| 1-Person Household | 30 (75.0%) | 10 (25.0%) |
| 2-Person Household | 60 (100.0%) | 0 (0.0%) |
| 3-Person Household | 29 (93.5%) | 2 (6.5%) |
| 4+ Person Household | 39 (95.1%) | 2 (4.9%) |
| Total Housing Units | 158 (91.9%) | 14 (8.1%) |
Occupancy by Educational Attainment in Melbourne
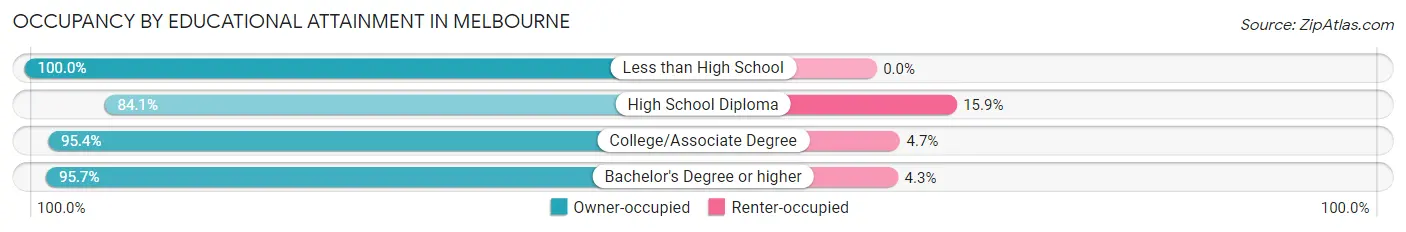
| Household Size | Owner-occupied | Renter-occupied |
| Less than High School | 19 (100.0%) | 0 (0.0%) |
| High School Diploma | 53 (84.1%) | 10 (15.9%) |
| College/Associate Degree | 41 (95.4%) | 2 (4.6%) |
| Bachelor's Degree or higher | 45 (95.7%) | 2 (4.3%) |
Occupancy by Age of Householder in Melbourne
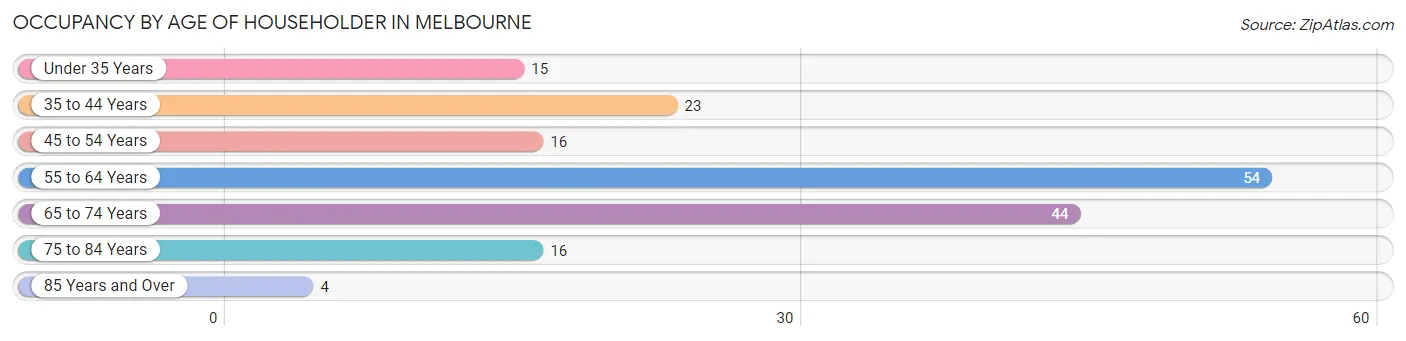
| Age Bracket | # Households | % Households |
| Under 35 Years | 15 | 8.7% |
| 35 to 44 Years | 23 | 13.4% |
| 45 to 54 Years | 16 | 9.3% |
| 55 to 64 Years | 54 | 31.4% |
| 65 to 74 Years | 44 | 25.6% |
| 75 to 84 Years | 16 | 9.3% |
| 85 Years and Over | 4 | 2.3% |
| Total | 172 | 100.0% |
Housing Finances in Melbourne
Median Income by Occupancy in Melbourne
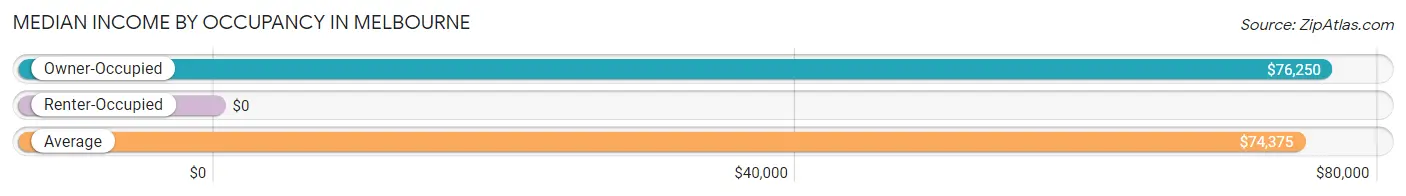
| Occupancy Type | # Households | Median Income |
| Owner-Occupied | 158 (91.9%) | $76,250 |
| Renter-Occupied | 14 (8.1%) | $0 |
| Average | 172 (100.0%) | $74,375 |
Occupancy by Householder Income Bracket in Melbourne
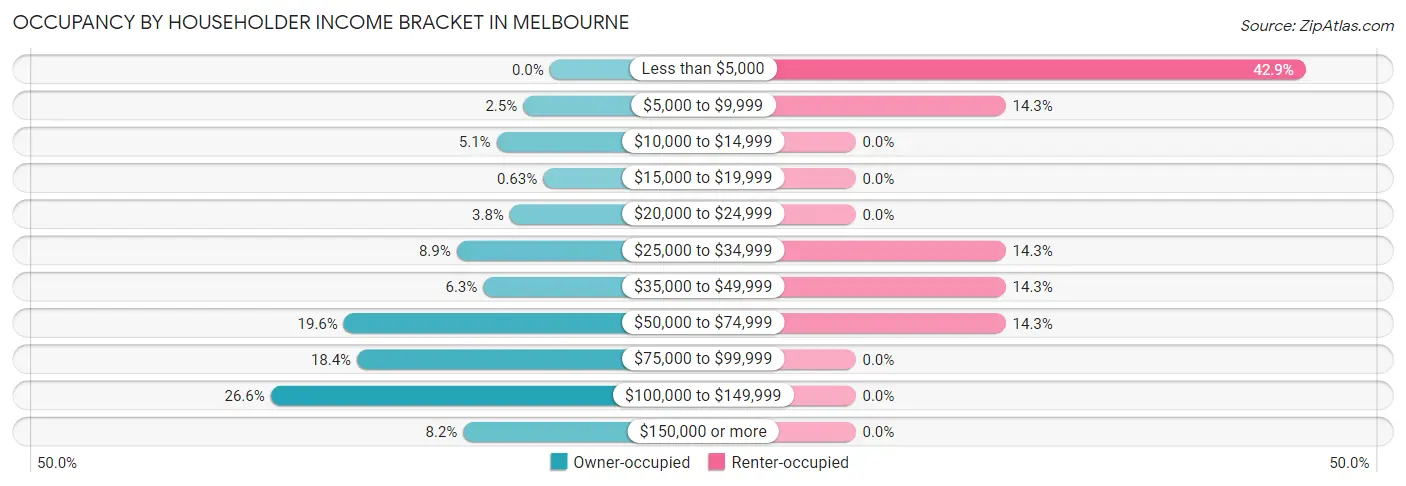
| Income Bracket | Owner-occupied | Renter-occupied |
| Less than $5,000 | 0 (0.0%) | 6 (42.9%) |
| $5,000 to $9,999 | 4 (2.5%) | 2 (14.3%) |
| $10,000 to $14,999 | 8 (5.1%) | 0 (0.0%) |
| $15,000 to $19,999 | 1 (0.6%) | 0 (0.0%) |
| $20,000 to $24,999 | 6 (3.8%) | 0 (0.0%) |
| $25,000 to $34,999 | 14 (8.9%) | 2 (14.3%) |
| $35,000 to $49,999 | 10 (6.3%) | 2 (14.3%) |
| $50,000 to $74,999 | 31 (19.6%) | 2 (14.3%) |
| $75,000 to $99,999 | 29 (18.3%) | 0 (0.0%) |
| $100,000 to $149,999 | 42 (26.6%) | 0 (0.0%) |
| $150,000 or more | 13 (8.2%) | 0 (0.0%) |
| Total | 158 (100.0%) | 14 (100.0%) |
Monthly Housing Cost Tiers in Melbourne
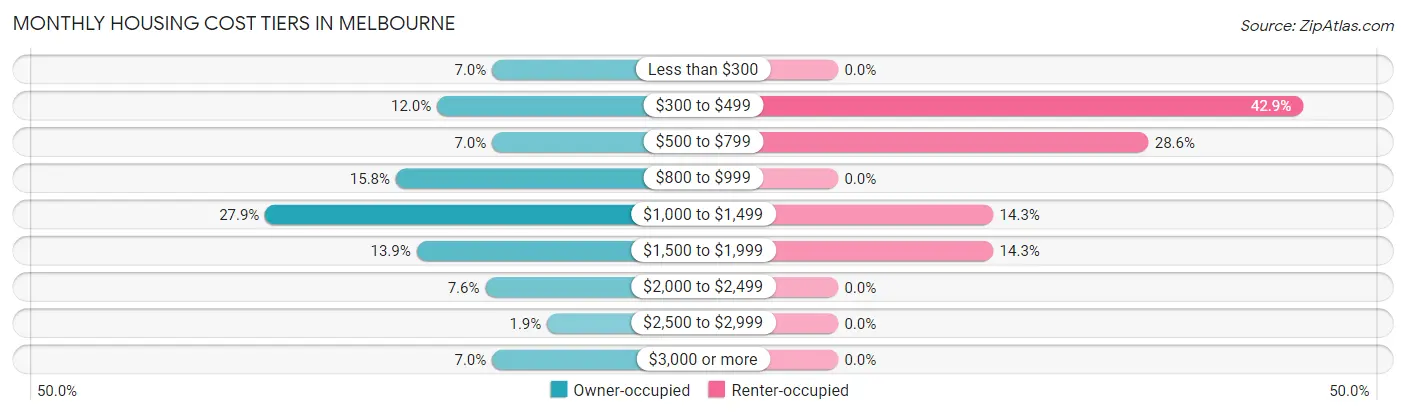
| Monthly Cost | Owner-occupied | Renter-occupied |
| Less than $300 | 11 (7.0%) | 0 (0.0%) |
| $300 to $499 | 19 (12.0%) | 6 (42.9%) |
| $500 to $799 | 11 (7.0%) | 4 (28.6%) |
| $800 to $999 | 25 (15.8%) | 0 (0.0%) |
| $1,000 to $1,499 | 44 (27.9%) | 2 (14.3%) |
| $1,500 to $1,999 | 22 (13.9%) | 2 (14.3%) |
| $2,000 to $2,499 | 12 (7.6%) | 0 (0.0%) |
| $2,500 to $2,999 | 3 (1.9%) | 0 (0.0%) |
| $3,000 or more | 11 (7.0%) | 0 (0.0%) |
| Total | 158 (100.0%) | 14 (100.0%) |
Physical Housing Characteristics in Melbourne
Housing Structures in Melbourne
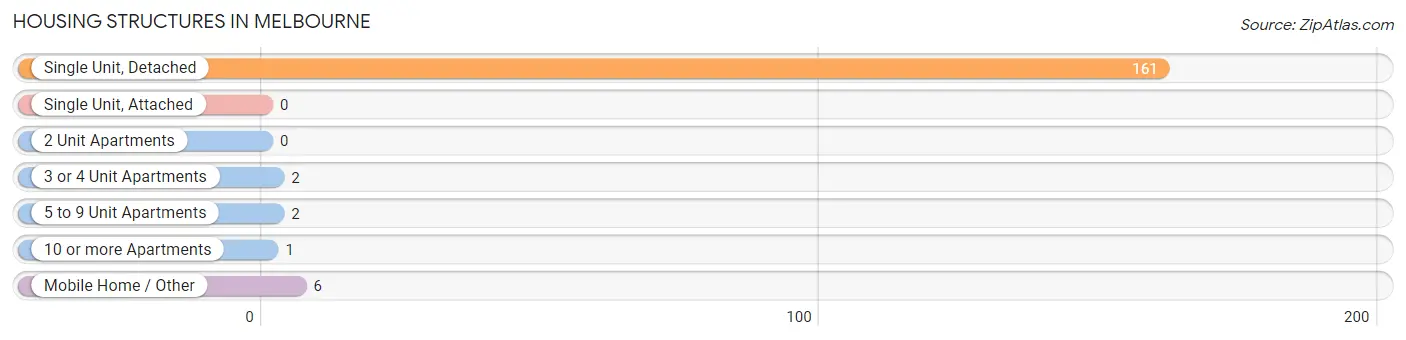
| Structure Type | # Housing Units | % Housing Units |
| Single Unit, Detached | 161 | 93.6% |
| Single Unit, Attached | 0 | 0.0% |
| 2 Unit Apartments | 0 | 0.0% |
| 3 or 4 Unit Apartments | 2 | 1.2% |
| 5 to 9 Unit Apartments | 2 | 1.2% |
| 10 or more Apartments | 1 | 0.6% |
| Mobile Home / Other | 6 | 3.5% |
| Total | 172 | 100.0% |
Housing Structures by Occupancy in Melbourne
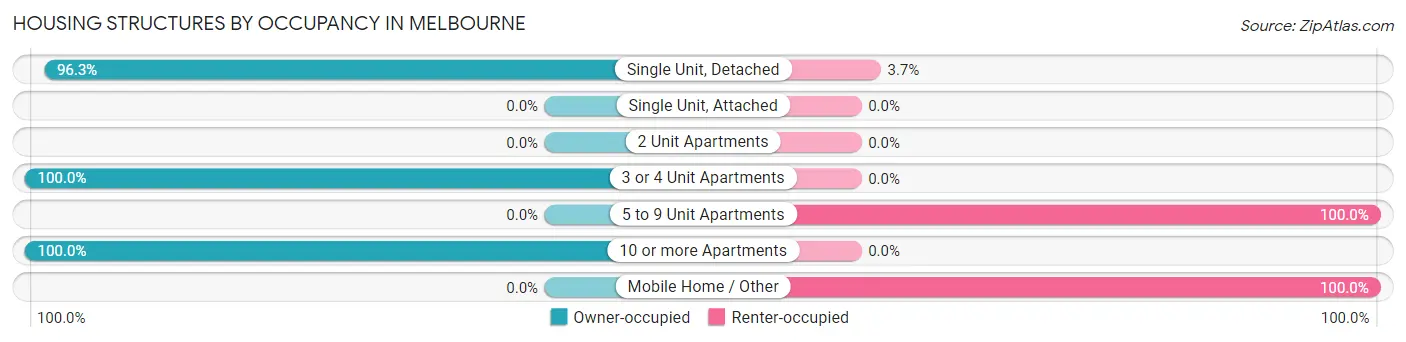
| Structure Type | Owner-occupied | Renter-occupied |
| Single Unit, Detached | 155 (96.3%) | 6 (3.7%) |
| Single Unit, Attached | 0 (0.0%) | 0 (0.0%) |
| 2 Unit Apartments | 0 (0.0%) | 0 (0.0%) |
| 3 or 4 Unit Apartments | 2 (100.0%) | 0 (0.0%) |
| 5 to 9 Unit Apartments | 0 (0.0%) | 2 (100.0%) |
| 10 or more Apartments | 1 (100.0%) | 0 (0.0%) |
| Mobile Home / Other | 0 (0.0%) | 6 (100.0%) |
| Total | 158 (91.9%) | 14 (8.1%) |
Housing Structures by Number of Rooms in Melbourne
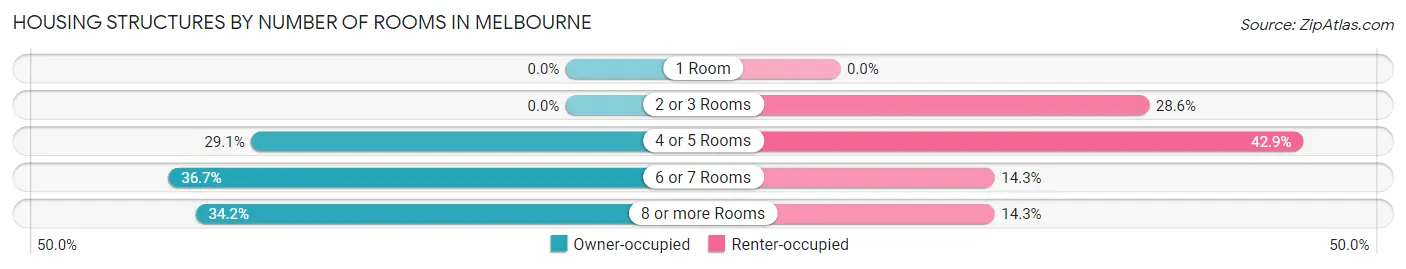
| Number of Rooms | Owner-occupied | Renter-occupied |
| 1 Room | 0 (0.0%) | 0 (0.0%) |
| 2 or 3 Rooms | 0 (0.0%) | 4 (28.6%) |
| 4 or 5 Rooms | 46 (29.1%) | 6 (42.9%) |
| 6 or 7 Rooms | 58 (36.7%) | 2 (14.3%) |
| 8 or more Rooms | 54 (34.2%) | 2 (14.3%) |
| Total | 158 (100.0%) | 14 (100.0%) |
Housing Structure by Heating Type in Melbourne
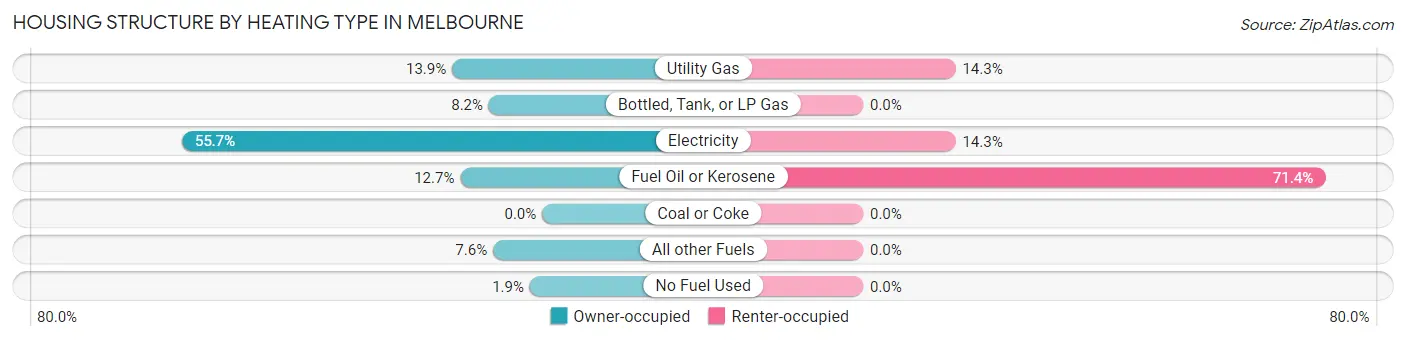
| Heating Type | Owner-occupied | Renter-occupied |
| Utility Gas | 22 (13.9%) | 2 (14.3%) |
| Bottled, Tank, or LP Gas | 13 (8.2%) | 0 (0.0%) |
| Electricity | 88 (55.7%) | 2 (14.3%) |
| Fuel Oil or Kerosene | 20 (12.7%) | 10 (71.4%) |
| Coal or Coke | 0 (0.0%) | 0 (0.0%) |
| All other Fuels | 12 (7.6%) | 0 (0.0%) |
| No Fuel Used | 3 (1.9%) | 0 (0.0%) |
| Total | 158 (100.0%) | 14 (100.0%) |
Household Vehicle Usage in Melbourne
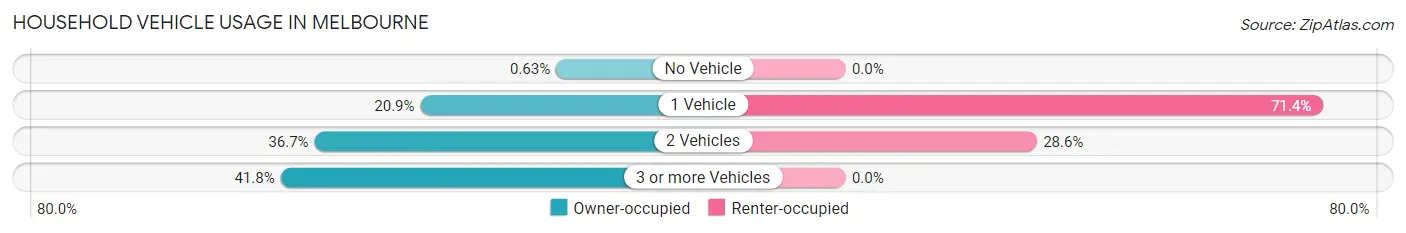
| Vehicles per Household | Owner-occupied | Renter-occupied |
| No Vehicle | 1 (0.6%) | 0 (0.0%) |
| 1 Vehicle | 33 (20.9%) | 10 (71.4%) |
| 2 Vehicles | 58 (36.7%) | 4 (28.6%) |
| 3 or more Vehicles | 66 (41.8%) | 0 (0.0%) |
| Total | 158 (100.0%) | 14 (100.0%) |
Real Estate & Mortgages in Melbourne
Real Estate and Mortgage Overview in Melbourne
| Characteristic | Without Mortgage | With Mortgage |
| Housing Units | 57 | 101 |
| Median Property Value | $142,200 | $153,400 |
| Median Household Income | $51,875 | $12 |
| Monthly Housing Costs | $483 | $11 |
| Real Estate Taxes | $2,269 | $0 |
Property Value by Mortgage Status in Melbourne
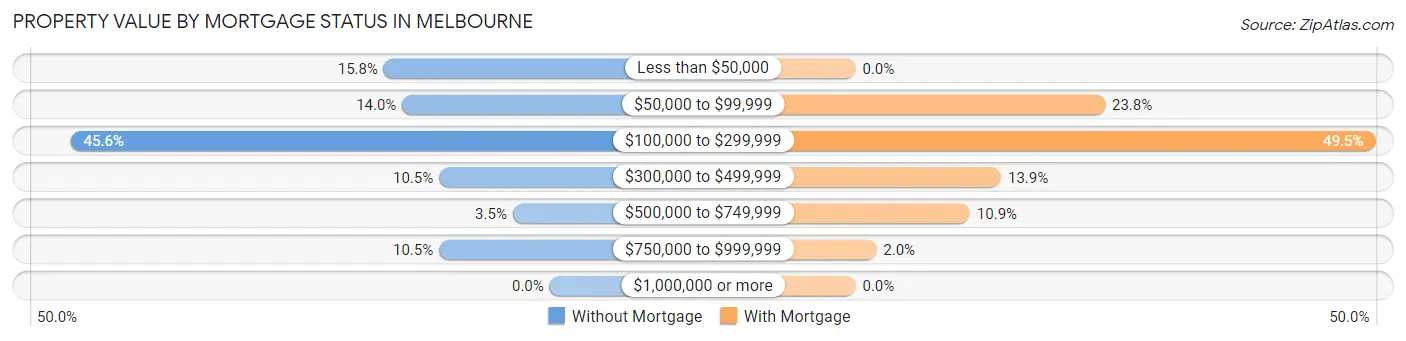
| Property Value | Without Mortgage | With Mortgage |
| Less than $50,000 | 9 (15.8%) | 0 (0.0%) |
| $50,000 to $99,999 | 8 (14.0%) | 24 (23.8%) |
| $100,000 to $299,999 | 26 (45.6%) | 50 (49.5%) |
| $300,000 to $499,999 | 6 (10.5%) | 14 (13.9%) |
| $500,000 to $749,999 | 2 (3.5%) | 11 (10.9%) |
| $750,000 to $999,999 | 6 (10.5%) | 2 (2.0%) |
| $1,000,000 or more | 0 (0.0%) | 0 (0.0%) |
| Total | 57 (100.0%) | 101 (100.0%) |
Household Income by Mortgage Status in Melbourne
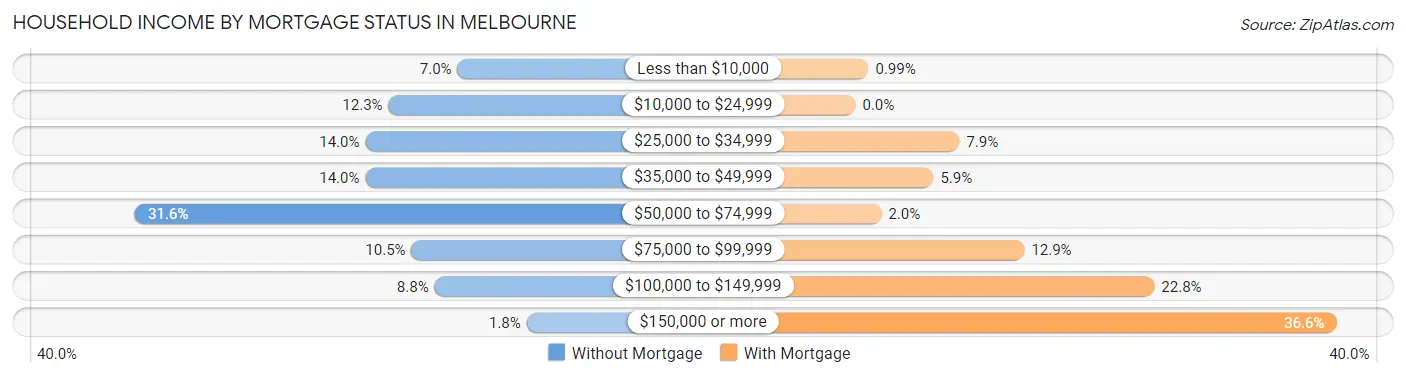
| Household Income | Without Mortgage | With Mortgage |
| Less than $10,000 | 4 (7.0%) | 1 (1.0%) |
| $10,000 to $24,999 | 7 (12.3%) | 0 (0.0%) |
| $25,000 to $34,999 | 8 (14.0%) | 8 (7.9%) |
| $35,000 to $49,999 | 8 (14.0%) | 6 (5.9%) |
| $50,000 to $74,999 | 18 (31.6%) | 2 (2.0%) |
| $75,000 to $99,999 | 6 (10.5%) | 13 (12.9%) |
| $100,000 to $149,999 | 5 (8.8%) | 23 (22.8%) |
| $150,000 or more | 1 (1.8%) | 37 (36.6%) |
| Total | 57 (100.0%) | 101 (100.0%) |
Property Value to Household Income Ratio in Melbourne
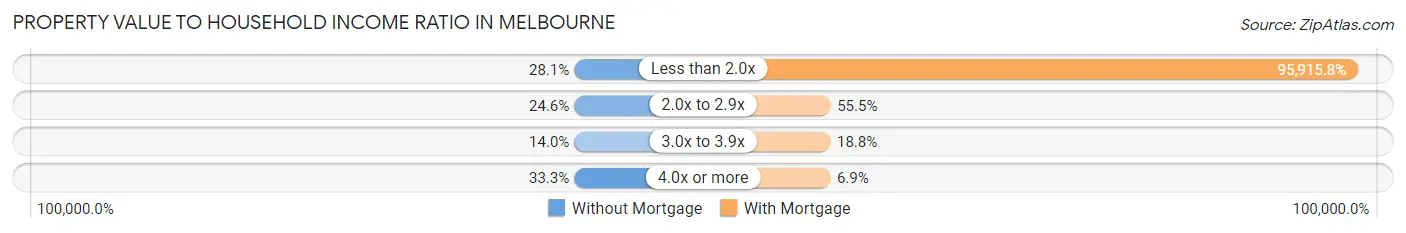
| Value-to-Income Ratio | Without Mortgage | With Mortgage |
| Less than 2.0x | 16 (28.1%) | 96,875 (95,915.8%) |
| 2.0x to 2.9x | 14 (24.6%) | 56 (55.4%) |
| 3.0x to 3.9x | 8 (14.0%) | 19 (18.8%) |
| 4.0x or more | 19 (33.3%) | 7 (6.9%) |
| Total | 57 (100.0%) | 101 (100.0%) |
Real Estate Taxes by Mortgage Status in Melbourne
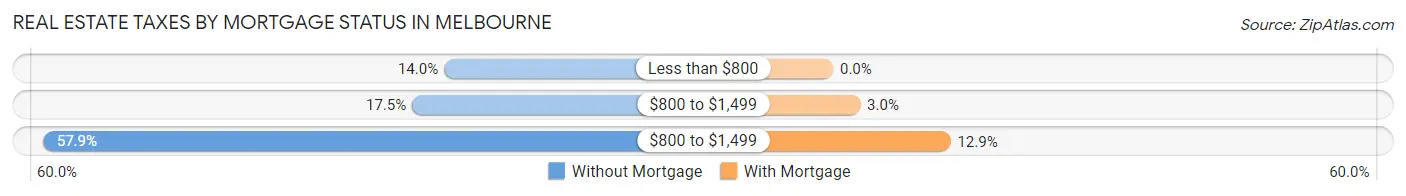
| Property Taxes | Without Mortgage | With Mortgage |
| Less than $800 | 8 (14.0%) | 0 (0.0%) |
| $800 to $1,499 | 10 (17.5%) | 3 (3.0%) |
| $800 to $1,499 | 33 (57.9%) | 13 (12.9%) |
| Total | 57 (100.0%) | 101 (100.0%) |
Health & Disability in Melbourne
Health Insurance Coverage by Age in Melbourne
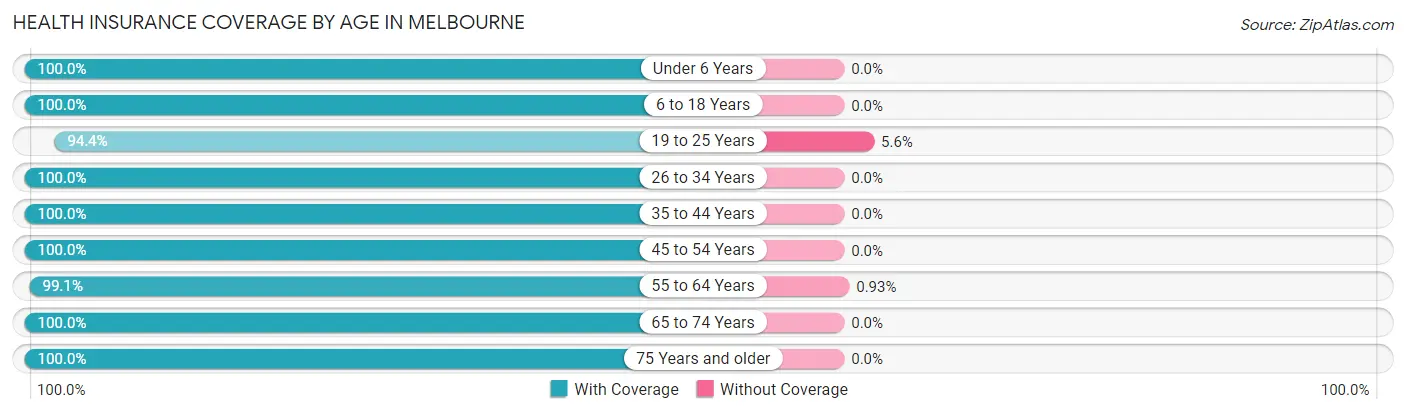
| Age Bracket | With Coverage | Without Coverage |
| Under 6 Years | 23 (100.0%) | 0 (0.0%) |
| 6 to 18 Years | 99 (100.0%) | 0 (0.0%) |
| 19 to 25 Years | 17 (94.4%) | 1 (5.6%) |
| 26 to 34 Years | 29 (100.0%) | 0 (0.0%) |
| 35 to 44 Years | 64 (100.0%) | 0 (0.0%) |
| 45 to 54 Years | 41 (100.0%) | 0 (0.0%) |
| 55 to 64 Years | 106 (99.1%) | 1 (0.9%) |
| 65 to 74 Years | 85 (100.0%) | 0 (0.0%) |
| 75 Years and older | 74 (100.0%) | 0 (0.0%) |
| Total | 538 (99.6%) | 2 (0.4%) |
Health Insurance Coverage by Citizenship Status in Melbourne
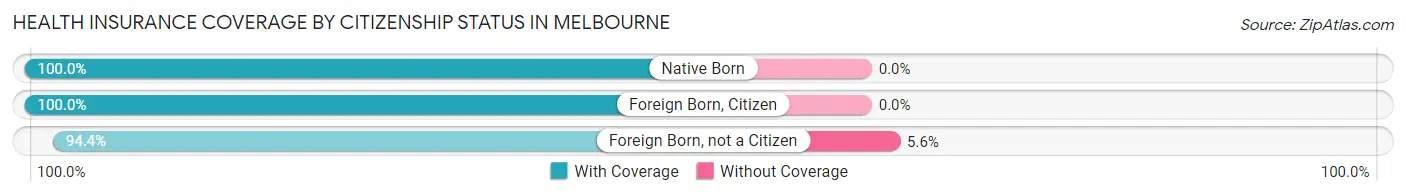
| Citizenship Status | With Coverage | Without Coverage |
| Native Born | 23 (100.0%) | 0 (0.0%) |
| Foreign Born, Citizen | 99 (100.0%) | 0 (0.0%) |
| Foreign Born, not a Citizen | 17 (94.4%) | 1 (5.6%) |
Health Insurance Coverage by Household Income in Melbourne
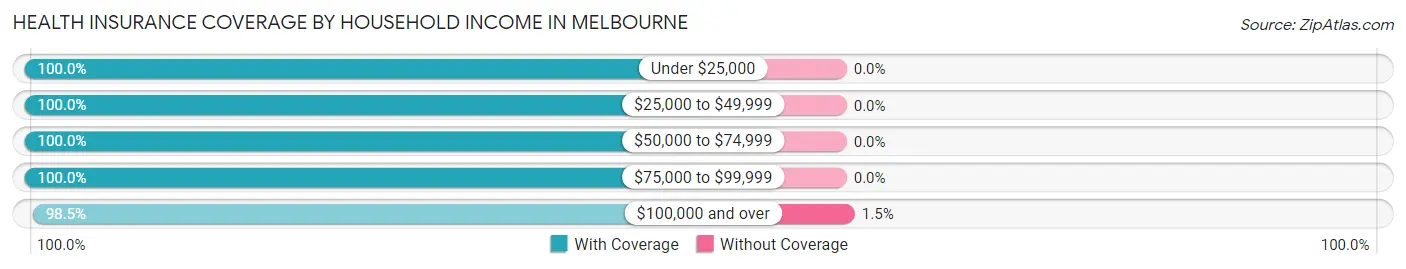
| Household Income | With Coverage | Without Coverage |
| Under $25,000 | 35 (100.0%) | 0 (0.0%) |
| $25,000 to $49,999 | 89 (100.0%) | 0 (0.0%) |
| $50,000 to $74,999 | 104 (100.0%) | 0 (0.0%) |
| $75,000 to $99,999 | 99 (100.0%) | 0 (0.0%) |
| $100,000 and over | 130 (98.5%) | 2 (1.5%) |
Public vs Private Health Insurance Coverage by Age in Melbourne
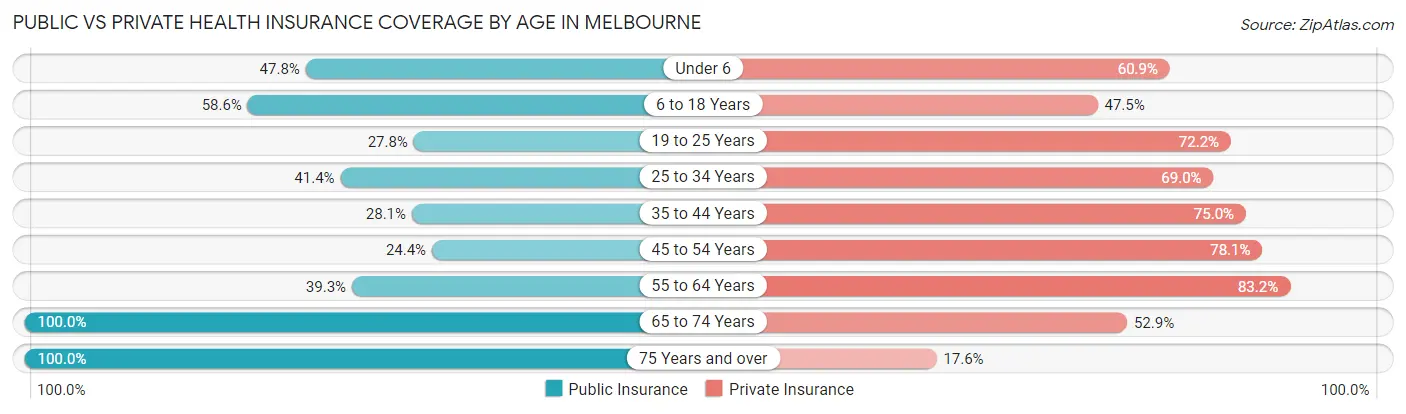
| Age Bracket | Public Insurance | Private Insurance |
| Under 6 | 11 (47.8%) | 14 (60.9%) |
| 6 to 18 Years | 58 (58.6%) | 47 (47.5%) |
| 19 to 25 Years | 5 (27.8%) | 13 (72.2%) |
| 25 to 34 Years | 12 (41.4%) | 20 (69.0%) |
| 35 to 44 Years | 18 (28.1%) | 48 (75.0%) |
| 45 to 54 Years | 10 (24.4%) | 32 (78.0%) |
| 55 to 64 Years | 42 (39.3%) | 89 (83.2%) |
| 65 to 74 Years | 85 (100.0%) | 45 (52.9%) |
| 75 Years and over | 74 (100.0%) | 13 (17.6%) |
| Total | 315 (58.3%) | 321 (59.4%) |
Disability Status by Sex by Age in Melbourne
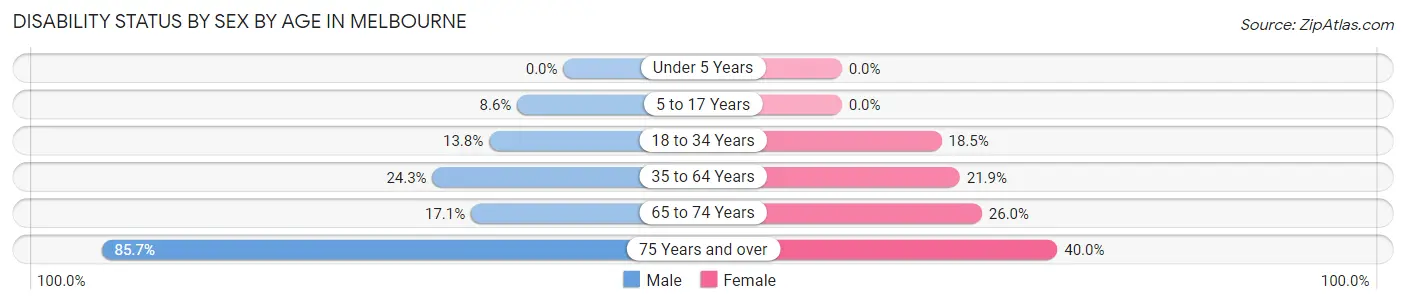
| Age Bracket | Male | Female |
| Under 5 Years | 0 (0.0%) | 0 (0.0%) |
| 5 to 17 Years | 3 (8.6%) | 0 (0.0%) |
| 18 to 34 Years | 4 (13.8%) | 5 (18.5%) |
| 35 to 64 Years | 26 (24.3%) | 23 (21.9%) |
| 65 to 74 Years | 6 (17.1%) | 13 (26.0%) |
| 75 Years and over | 12 (85.7%) | 24 (40.0%) |
Disability Class by Sex by Age in Melbourne
Disability Class: Hearing Difficulty
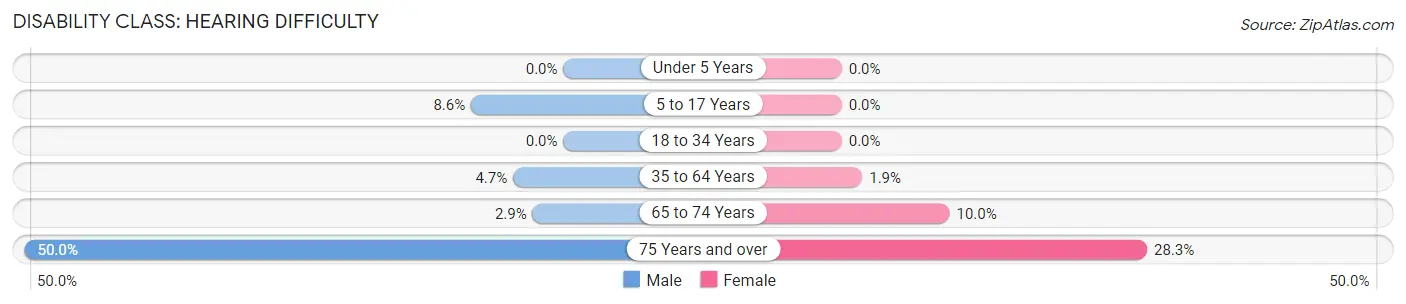
| Age Bracket | Male | Female |
| Under 5 Years | 0 (0.0%) | 0 (0.0%) |
| 5 to 17 Years | 3 (8.6%) | 0 (0.0%) |
| 18 to 34 Years | 0 (0.0%) | 0 (0.0%) |
| 35 to 64 Years | 5 (4.7%) | 2 (1.9%) |
| 65 to 74 Years | 1 (2.9%) | 5 (10.0%) |
| 75 Years and over | 7 (50.0%) | 17 (28.3%) |
Disability Class: Vision Difficulty
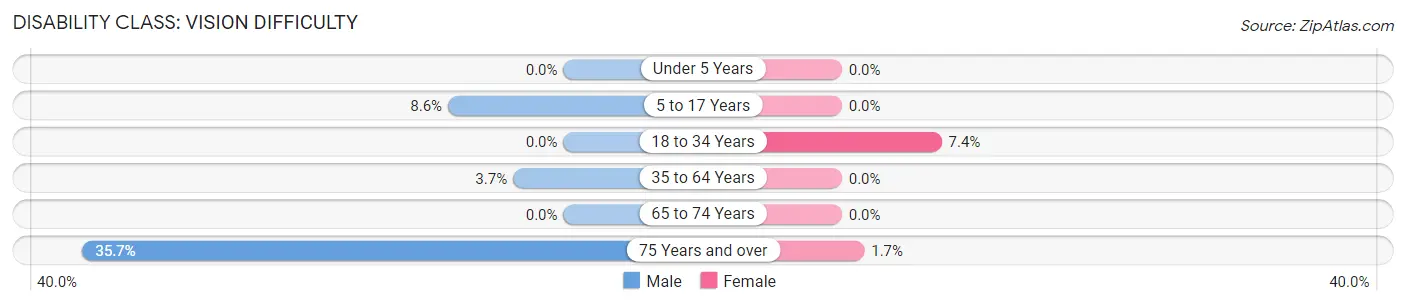
| Age Bracket | Male | Female |
| Under 5 Years | 0 (0.0%) | 0 (0.0%) |
| 5 to 17 Years | 3 (8.6%) | 0 (0.0%) |
| 18 to 34 Years | 0 (0.0%) | 2 (7.4%) |
| 35 to 64 Years | 4 (3.7%) | 0 (0.0%) |
| 65 to 74 Years | 0 (0.0%) | 0 (0.0%) |
| 75 Years and over | 5 (35.7%) | 1 (1.7%) |
Disability Class: Cognitive Difficulty
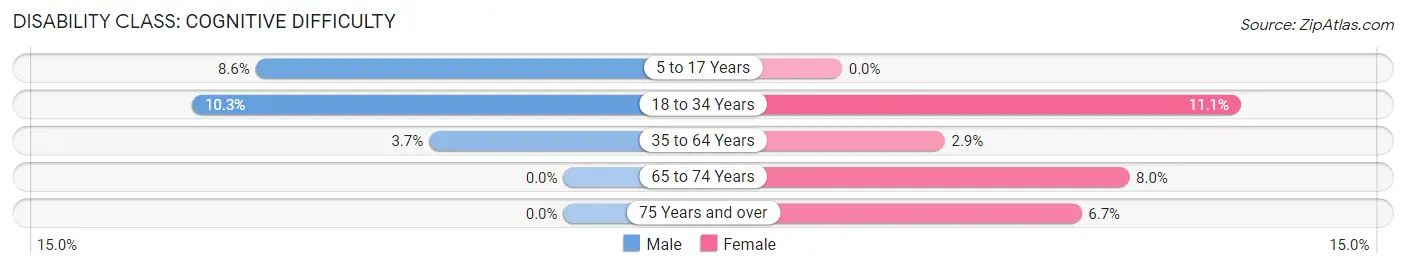
| Age Bracket | Male | Female |
| 5 to 17 Years | 3 (8.6%) | 0 (0.0%) |
| 18 to 34 Years | 3 (10.3%) | 3 (11.1%) |
| 35 to 64 Years | 4 (3.7%) | 3 (2.9%) |
| 65 to 74 Years | 0 (0.0%) | 4 (8.0%) |
| 75 Years and over | 0 (0.0%) | 4 (6.7%) |
Disability Class: Ambulatory Difficulty
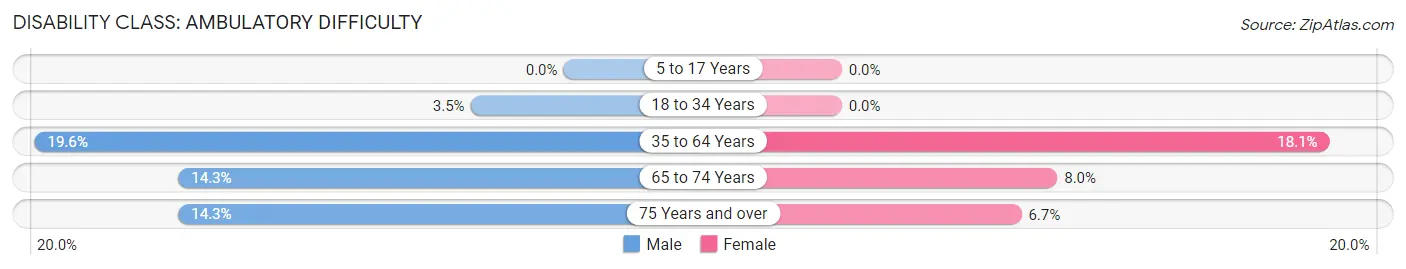
| Age Bracket | Male | Female |
| 5 to 17 Years | 0 (0.0%) | 0 (0.0%) |
| 18 to 34 Years | 1 (3.5%) | 0 (0.0%) |
| 35 to 64 Years | 21 (19.6%) | 19 (18.1%) |
| 65 to 74 Years | 5 (14.3%) | 4 (8.0%) |
| 75 Years and over | 2 (14.3%) | 4 (6.7%) |
Disability Class: Self-Care Difficulty
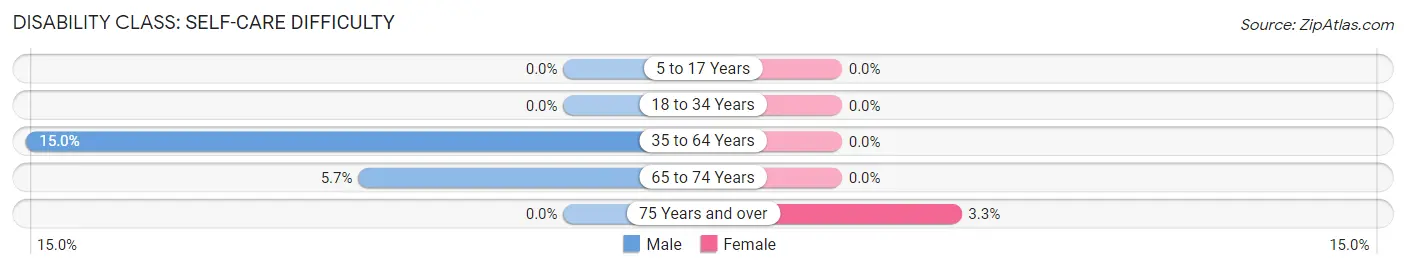
| Age Bracket | Male | Female |
| 5 to 17 Years | 0 (0.0%) | 0 (0.0%) |
| 18 to 34 Years | 0 (0.0%) | 0 (0.0%) |
| 35 to 64 Years | 16 (14.9%) | 0 (0.0%) |
| 65 to 74 Years | 2 (5.7%) | 0 (0.0%) |
| 75 Years and over | 0 (0.0%) | 2 (3.3%) |
Technology Access in Melbourne
Computing Device Access in Melbourne
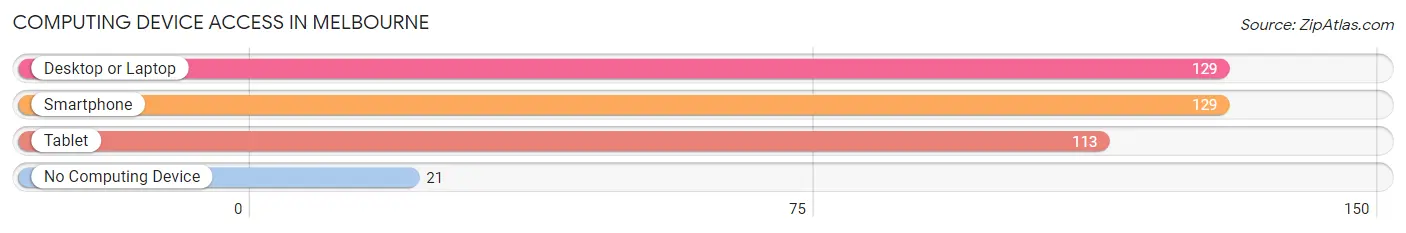
| Device Type | # Households | % Households |
| Desktop or Laptop | 129 | 75.0% |
| Smartphone | 129 | 75.0% |
| Tablet | 113 | 65.7% |
| No Computing Device | 21 | 12.2% |
| Total | 172 | 100.0% |
Internet Access in Melbourne
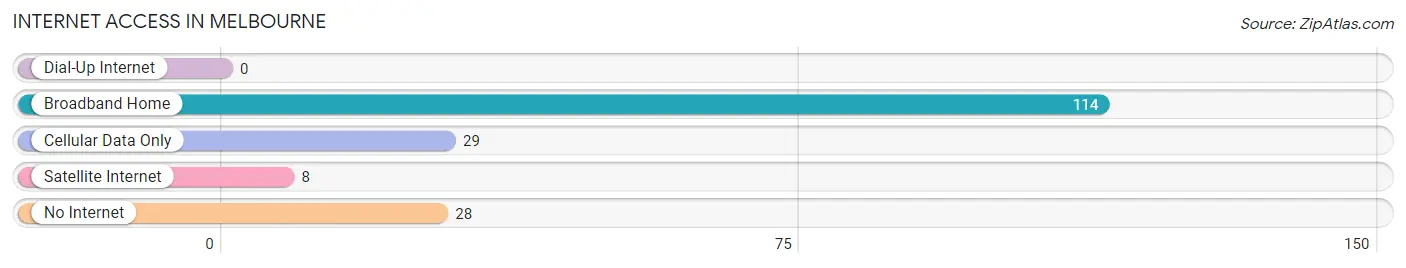
| Internet Type | # Households | % Households |
| Dial-Up Internet | 0 | 0.0% |
| Broadband Home | 114 | 66.3% |
| Cellular Data Only | 29 | 16.9% |
| Satellite Internet | 8 | 4.6% |
| No Internet | 28 | 16.3% |
| Total | 172 | 100.0% |
Melbourne Summary
Melbourne, Kentucky is a small city located in the southeastern part of the state, in the foothills of the Appalachian Mountains. It is the county seat of Clay County and is situated along the banks of the Kentucky River. The city has a population of approximately 1,500 people and is part of the larger London-Corbin Metropolitan Statistical Area.
History
The area that is now Melbourne was first settled in the early 1800s by a group of settlers from Virginia. The town was originally known as “Mud Lick” and was later renamed “Melbourne” in honor of the city in Australia. The town was officially incorporated in 1883.
In the late 1800s, the town was a major center for the timber industry. The town was also home to a large number of coal mines, which provided employment for many of the town’s residents.
In the early 1900s, the town began to experience a decline in population as many of the coal mines closed and the timber industry moved elsewhere. The town’s population continued to decline until the 1950s when the town began to experience a resurgence in population due to the opening of a new paper mill.
Geography
Melbourne is located in the southeastern part of the state, in the foothills of the Appalachian Mountains. The city is situated along the banks of the Kentucky River and is surrounded by rolling hills and forests. The city has a total area of 1.3 square miles, all of which is land.
The climate in Melbourne is classified as humid subtropical, with hot, humid summers and mild winters. The average annual temperature is around 57 degrees Fahrenheit, with an average high of around 79 degrees in the summer and an average low of around 35 degrees in the winter.
Economy
The economy of Melbourne is largely based on the paper mill, which is the city’s largest employer. Other major employers in the city include a number of small businesses, such as restaurants, retail stores, and service providers.
The city also has a number of tourist attractions, including the Clay County Historical Museum, the Clay County Courthouse, and the Clay County Fairgrounds.
Demographics
As of the 2010 census, the population of Melbourne was 1,500 people. The racial makeup of the city was 97.3% White, 0.7% African American, 0.3% Native American, 0.3% Asian, and 1.3% from other races. The median household income in the city was $30,000, and the median family income was $35,000.
The city has a large number of retirees, with nearly 20% of the population over the age of 65. The city also has a large number of children, with nearly 30% of the population under the age of 18.
Conclusion
Melbourne, Kentucky is a small city located in the southeastern part of the state, in the foothills of the Appalachian Mountains. It is the county seat of Clay County and is situated along the banks of the Kentucky River. The city has a population of approximately 1,500 people and is part of the larger London-Corbin Metropolitan Statistical Area. The economy of Melbourne is largely based on the paper mill, which is the city’s largest employer. Other major employers in the city include a number of small businesses, such as restaurants, retail stores, and service providers. The city also has a number of tourist attractions, including the Clay County Historical Museum, the Clay County Courthouse, and the Clay County Fairgrounds.
Common Questions
What is Per Capita Income in Melbourne?
Per Capita income in Melbourne is $27,125.
What is the Median Family Income in Melbourne?
Median Family Income in Melbourne is $76,406.
What is the Median Household income in Melbourne?
Median Household Income in Melbourne is $74,375.
What is Income or Wage Gap in Melbourne?
Income or Wage Gap in Melbourne is 26.4%.
Women in Melbourne earn 73.6 cents for every dollar earned by a man.
What is Inequality or Gini Index in Melbourne?
Inequality or Gini Index in Melbourne is 0.38.
What is the Total Population of Melbourne?
Total Population of Melbourne is 547.
What is the Total Male Population of Melbourne?
Total Male Population of Melbourne is 230.
What is the Total Female Population of Melbourne?
Total Female Population of Melbourne is 317.
What is the Ratio of Males per 100 Females in Melbourne?
There are 72.56 Males per 100 Females in Melbourne.
What is the Ratio of Females per 100 Males in Melbourne?
There are 137.83 Females per 100 Males in Melbourne.
What is the Median Population Age in Melbourne?
Median Population Age in Melbourne is 54.9 Years.
What is the Average Family Size in Melbourne
Average Family Size in Melbourne is 3.2 People.
What is the Average Household Size in Melbourne
Average Household Size in Melbourne is 2.7 People.
How Large is the Labor Force in Melbourne?
There are 194 People in the Labor Forcein in Melbourne.
What is the Percentage of People in the Labor Force in Melbourne?
43.4% of People are in the Labor Force in Melbourne.
What is the Unemployment Rate in Melbourne?
Unemployment Rate in Melbourne is 6.7%.