Annville, KY Map & Demographics
Annville Map
Annville Overview
$19,648
PER CAPITA INCOME
$52,436
AVG FAMILY INCOME
$56,979
AVG HOUSEHOLD INCOME
37.3%
WAGE / INCOME GAP [ % ]
62.7¢/ $1
WAGE / INCOME GAP [ $ ]
0.35
INEQUALITY / GINI INDEX
1,189
TOTAL POPULATION
601
MALE POPULATION
588
FEMALE POPULATION
102.21
MALES / 100 FEMALES
97.84
FEMALES / 100 MALES
36.4
MEDIAN AGE
4.6
AVG FAMILY SIZE
3.7
AVG HOUSEHOLD SIZE
318
LABOR FORCE [ PEOPLE ]
38.0%
PERCENT IN LABOR FORCE
Annville Zip Codes
Annville Area Codes
Income in Annville
Income Overview in Annville
Per Capita Income in Annville is $19,648, while median incomes of families and households are $52,436 and $56,979 respectively.
| Characteristic | Number | Measure |
| Per Capita Income | 1,189 | $19,648 |
| Median Family Income | 226 | $52,436 |
| Mean Family Income | 226 | $68,334 |
| Median Household Income | 301 | $56,979 |
| Mean Household Income | 301 | $62,277 |
| Income Deficit | 226 | $0 |
| Wage / Income Gap (%) | 1,189 | 37.25% |
| Wage / Income Gap ($) | 1,189 | 62.75¢ per $1 |
| Gini / Inequality Index | 1,189 | 0.35 |
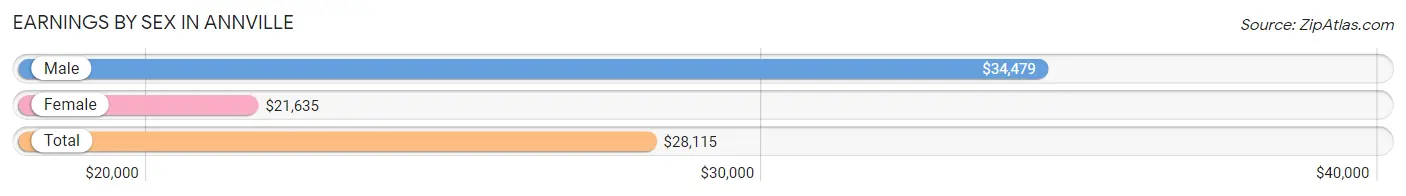
Earnings by Sex in Annville
Average Earnings in Annville are $28,115, $34,479 for men and $21,635 for women, a difference of 37.2%.
| Sex | Number | Average Earnings |
| Male | 175 (49.7%) | $34,479 |
| Female | 177 (50.3%) | $21,635 |
| Total | 352 (100.0%) | $28,115 |
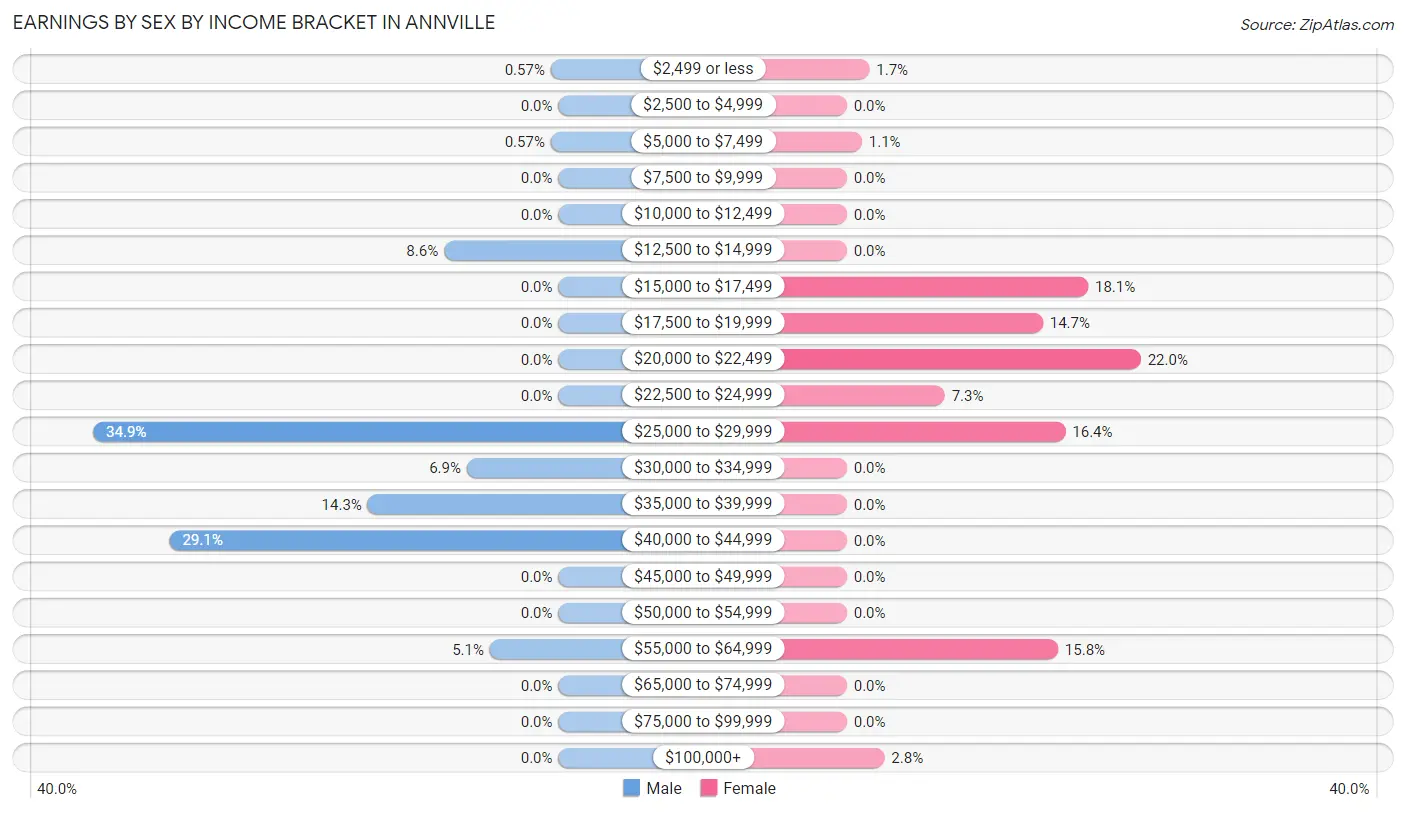
Earnings by Sex by Income Bracket in Annville
The most common earnings brackets in Annville are $25,000 to $29,999 for men (61 | 34.9%) and $20,000 to $22,499 for women (39 | 22.0%).
| Income | Male | Female |
| $2,499 or less | 1 (0.6%) | 3 (1.7%) |
| $2,500 to $4,999 | 0 (0.0%) | 0 (0.0%) |
| $5,000 to $7,499 | 1 (0.6%) | 2 (1.1%) |
| $7,500 to $9,999 | 0 (0.0%) | 0 (0.0%) |
| $10,000 to $12,499 | 0 (0.0%) | 0 (0.0%) |
| $12,500 to $14,999 | 15 (8.6%) | 0 (0.0%) |
| $15,000 to $17,499 | 0 (0.0%) | 32 (18.1%) |
| $17,500 to $19,999 | 0 (0.0%) | 26 (14.7%) |
| $20,000 to $22,499 | 0 (0.0%) | 39 (22.0%) |
| $22,500 to $24,999 | 0 (0.0%) | 13 (7.3%) |
| $25,000 to $29,999 | 61 (34.9%) | 29 (16.4%) |
| $30,000 to $34,999 | 12 (6.9%) | 0 (0.0%) |
| $35,000 to $39,999 | 25 (14.3%) | 0 (0.0%) |
| $40,000 to $44,999 | 51 (29.1%) | 0 (0.0%) |
| $45,000 to $49,999 | 0 (0.0%) | 0 (0.0%) |
| $50,000 to $54,999 | 0 (0.0%) | 0 (0.0%) |
| $55,000 to $64,999 | 9 (5.1%) | 28 (15.8%) |
| $65,000 to $74,999 | 0 (0.0%) | 0 (0.0%) |
| $75,000 to $99,999 | 0 (0.0%) | 0 (0.0%) |
| $100,000+ | 0 (0.0%) | 5 (2.8%) |
| Total | 175 (100.0%) | 177 (100.0%) |
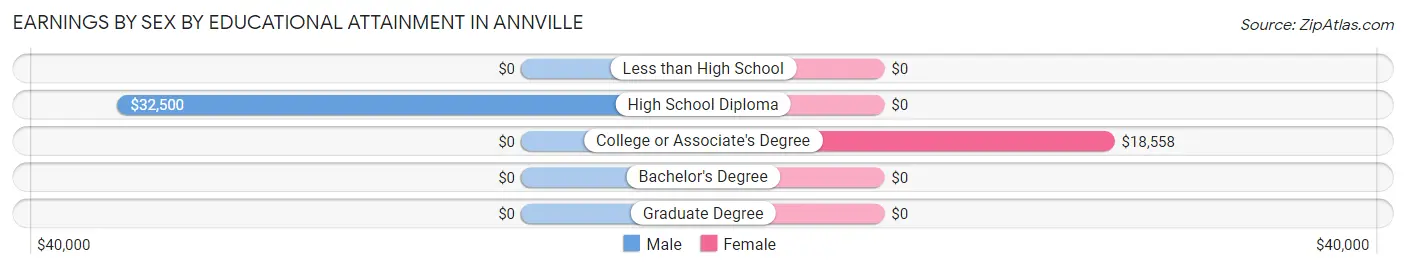
Earnings by Sex by Educational Attainment in Annville
Average earnings in Annville are $34,688 for men and $21,699 for women, a difference of 37.4%. Men with an educational attainment of high school diploma enjoy the highest average annual earnings of $32,500, while those with high school diploma education earn the least with $32,500. Women with an educational attainment of college or associate's degree earn the most with the average annual earnings of $18,558, while those with college or associate's degree education have the smallest earnings of $18,558.
| Educational Attainment | Male Income | Female Income |
| Less than High School | - | - |
| High School Diploma | $32,500 | $0 |
| College or Associate's Degree | - | - |
| Bachelor's Degree | - | - |
| Graduate Degree | - | - |
| Total | $34,688 | $21,699 |
Family Income in Annville
Family Income Brackets in Annville
According to the Annville family income data, there are 100 families falling into the $50,000 to $74,999 income range, which is the most common income bracket and makes up 44.3% of all families.
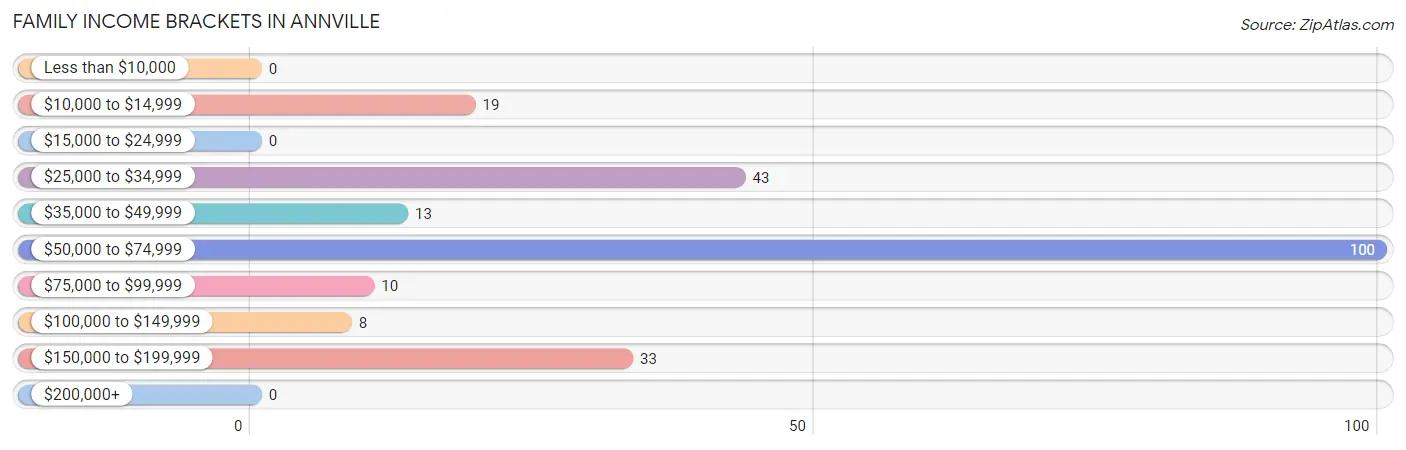
| Income Bracket | # Families | % Families |
| Less than $10,000 | 0 | 0.0% |
| $10,000 to $14,999 | 19 | 8.4% |
| $15,000 to $24,999 | 0 | 0.0% |
| $25,000 to $34,999 | 43 | 19.0% |
| $35,000 to $49,999 | 13 | 5.8% |
| $50,000 to $74,999 | 100 | 44.2% |
| $75,000 to $99,999 | 10 | 4.4% |
| $100,000 to $149,999 | 8 | 3.5% |
| $150,000 to $199,999 | 33 | 14.6% |
| $200,000+ | 0 | 0.0% |
Family Income by Famaliy Size in Annville
2-person families (70 | 31.0%) account for the highest median family income in Annville with $48,846 per family, while 2-person families (70 | 31.0%) have the highest median income of $24,423 per family member.
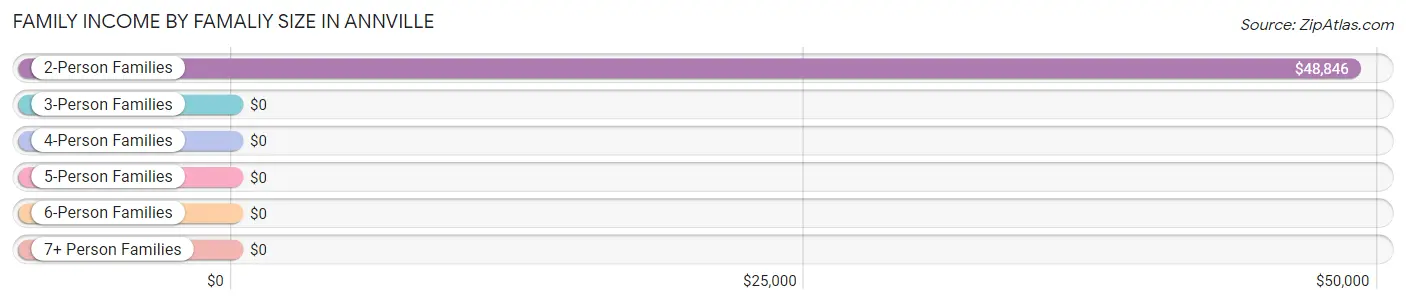
| Income Bracket | # Families | Median Income |
| 2-Person Families | 70 (31.0%) | $48,846 |
| 3-Person Families | 39 (17.3%) | $0 |
| 4-Person Families | 77 (34.1%) | $0 |
| 5-Person Families | 17 (7.5%) | $0 |
| 6-Person Families | 23 (10.2%) | $0 |
| 7+ Person Families | 0 (0.0%) | $0 |
| Total | 226 (100.0%) | $52,436 |
Family Income by Number of Earners in Annville
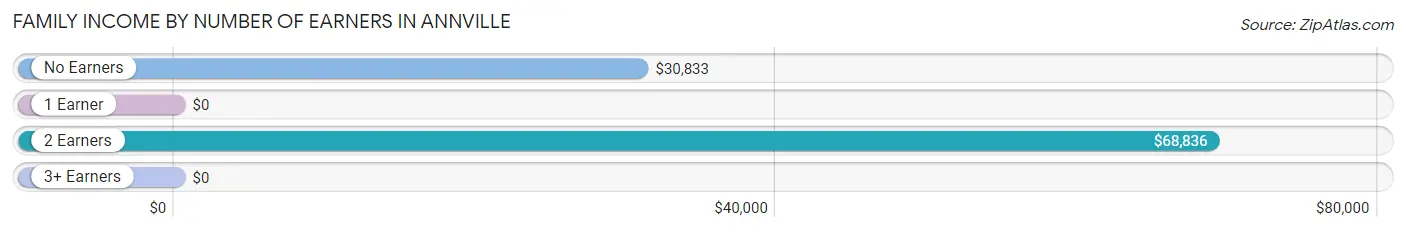
| Number of Earners | # Families | Median Income |
| No Earners | 78 (34.5%) | $30,833 |
| 1 Earner | 15 (6.6%) | $0 |
| 2 Earners | 133 (58.9%) | $68,836 |
| 3+ Earners | 0 (0.0%) | $0 |
| Total | 226 (100.0%) | $52,436 |
Household Income in Annville
Household Income Brackets in Annville
With 148 households falling in the category, the $50,000 to $74,999 income range is the most frequent in Annville, accounting for 49.2% of all households.
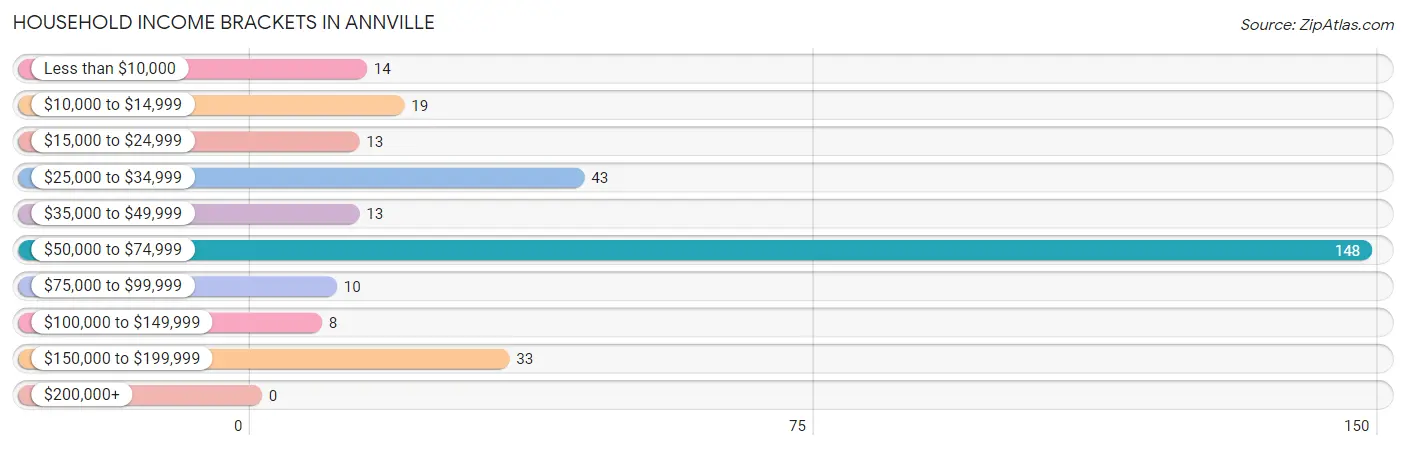
| Income Bracket | # Households | % Households |
| Less than $10,000 | 14 | 4.7% |
| $10,000 to $14,999 | 19 | 6.3% |
| $15,000 to $24,999 | 13 | 4.3% |
| $25,000 to $34,999 | 43 | 14.3% |
| $35,000 to $49,999 | 13 | 4.3% |
| $50,000 to $74,999 | 148 | 49.2% |
| $75,000 to $99,999 | 10 | 3.3% |
| $100,000 to $149,999 | 8 | 2.7% |
| $150,000 to $199,999 | 33 | 11.0% |
| $200,000+ | 0 | 0.0% |
Household Income by Householder Age in Annville
The median household income in Annville is $56,979, with the highest median household income of $61,042 found in the 65+ years age bracket for the primary householder. A total of 116 households (38.5%) fall into this category.
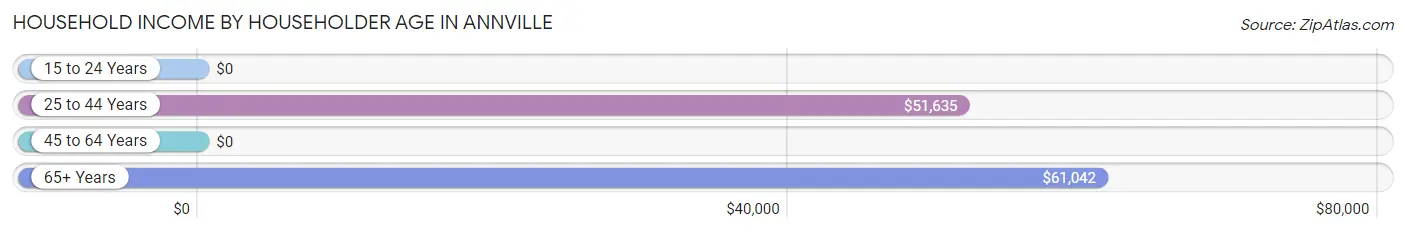
| Income Bracket | # Households | Median Income |
| 15 to 24 Years | 0 (0.0%) | $0 |
| 25 to 44 Years | 119 (39.5%) | $51,635 |
| 45 to 64 Years | 66 (21.9%) | $0 |
| 65+ Years | 116 (38.5%) | $61,042 |
| Total | 301 (100.0%) | $56,979 |
Poverty in Annville
Income Below Poverty by Sex and Age in Annville
With 22.2% poverty level for males and 20.5% for females among the residents of Annville, under 5 year old males and under 5 year old females are the most vulnerable to poverty, with 60 males (100.0%) and 13 females (100.0%) in their respective age groups living below the poverty level.
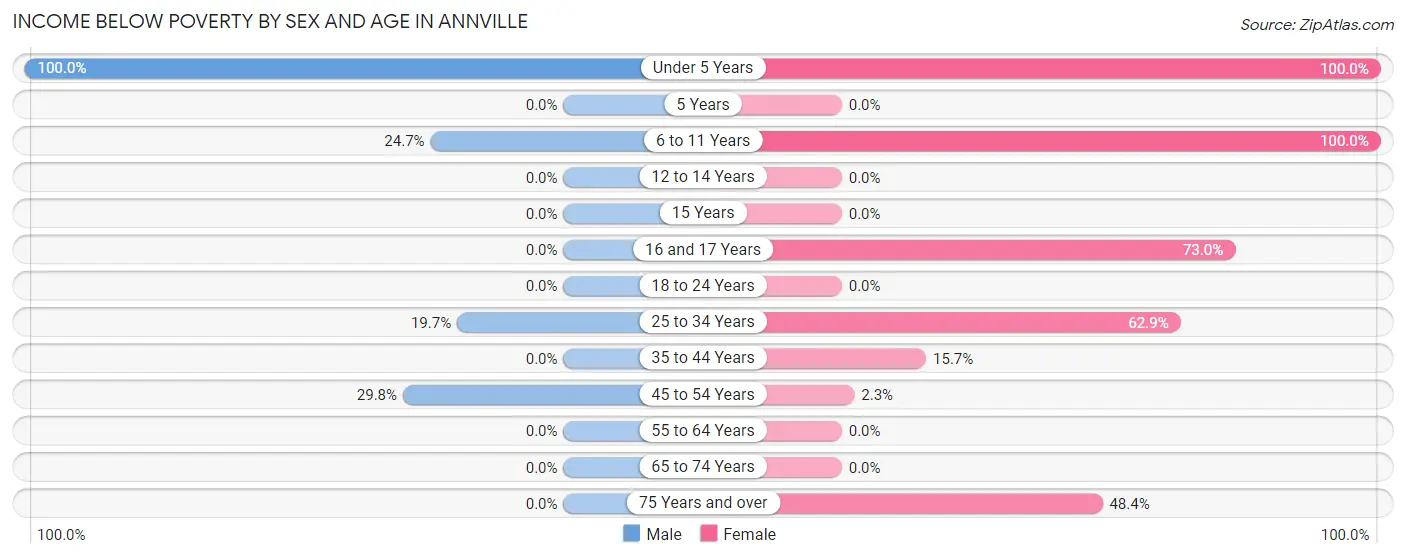
| Age Bracket | Male | Female |
| Under 5 Years | 60 (100.0%) | 13 (100.0%) |
| 5 Years | 0 (0.0%) | 0 (0.0%) |
| 6 to 11 Years | 38 (24.7%) | 12 (100.0%) |
| 12 to 14 Years | 0 (0.0%) | 0 (0.0%) |
| 15 Years | 0 (0.0%) | 0 (0.0%) |
| 16 and 17 Years | 0 (0.0%) | 27 (73.0%) |
| 18 to 24 Years | 0 (0.0%) | 0 (0.0%) |
| 25 to 34 Years | 15 (19.7%) | 22 (62.9%) |
| 35 to 44 Years | 0 (0.0%) | 23 (15.7%) |
| 45 to 54 Years | 14 (29.8%) | 1 (2.3%) |
| 55 to 64 Years | 0 (0.0%) | 0 (0.0%) |
| 65 to 74 Years | 0 (0.0%) | 0 (0.0%) |
| 75 Years and over | 0 (0.0%) | 15 (48.4%) |
| Total | 127 (22.2%) | 113 (20.5%) |
Income Above Poverty by Sex and Age in Annville
According to the poverty statistics in Annville, males aged 12 to 14 years and females aged 5 years are the age groups that are most secure financially, with 100.0% of males and 100.0% of females in these age groups living above the poverty line.
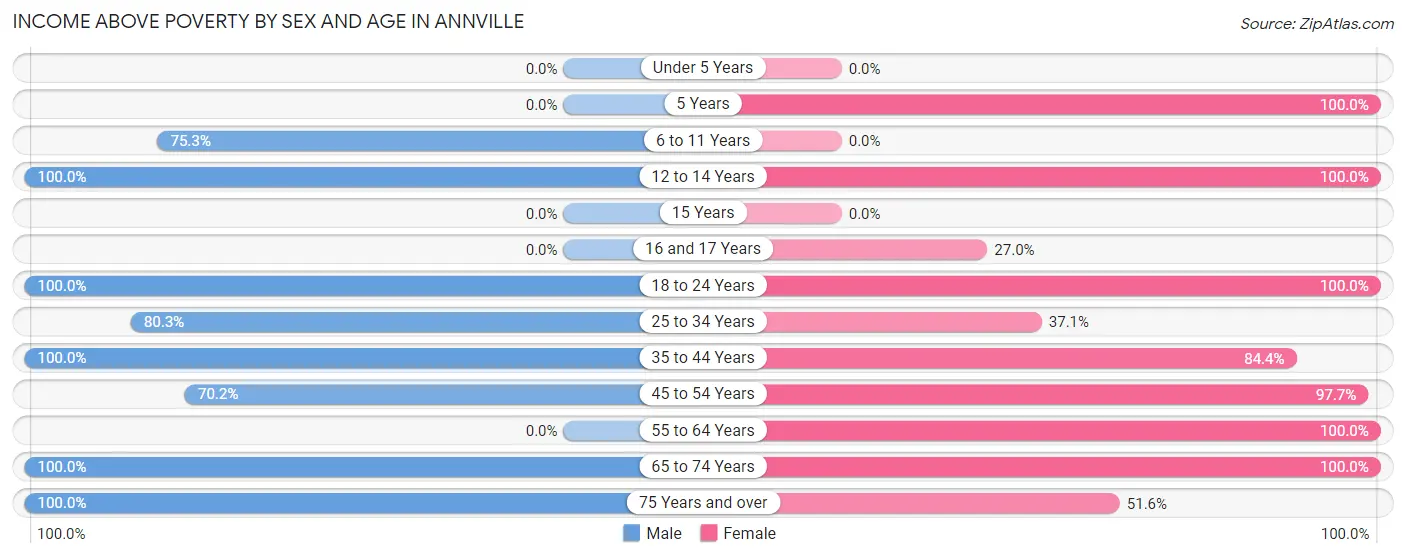
| Age Bracket | Male | Female |
| Under 5 Years | 0 (0.0%) | 0 (0.0%) |
| 5 Years | 0 (0.0%) | 9 (100.0%) |
| 6 to 11 Years | 116 (75.3%) | 0 (0.0%) |
| 12 to 14 Years | 25 (100.0%) | 77 (100.0%) |
| 15 Years | 0 (0.0%) | 0 (0.0%) |
| 16 and 17 Years | 0 (0.0%) | 10 (27.0%) |
| 18 to 24 Years | 8 (100.0%) | 17 (100.0%) |
| 25 to 34 Years | 61 (80.3%) | 13 (37.1%) |
| 35 to 44 Years | 72 (100.0%) | 124 (84.4%) |
| 45 to 54 Years | 33 (70.2%) | 42 (97.7%) |
| 55 to 64 Years | 0 (0.0%) | 28 (100.0%) |
| 65 to 74 Years | 78 (100.0%) | 103 (100.0%) |
| 75 Years and over | 53 (100.0%) | 16 (51.6%) |
| Total | 446 (77.8%) | 439 (79.5%) |
Income Below Poverty Among Married-Couple Families in Annville
The poverty statistics for married-couple families in Annville show that 8.8% or 15 of the total 171 families live below the poverty line. Families with 3 or 4 children have the highest poverty rate of 46.9%, comprising of 15 families. On the other hand, families with no children have the lowest poverty rate of 0.0%, which includes 0 families.
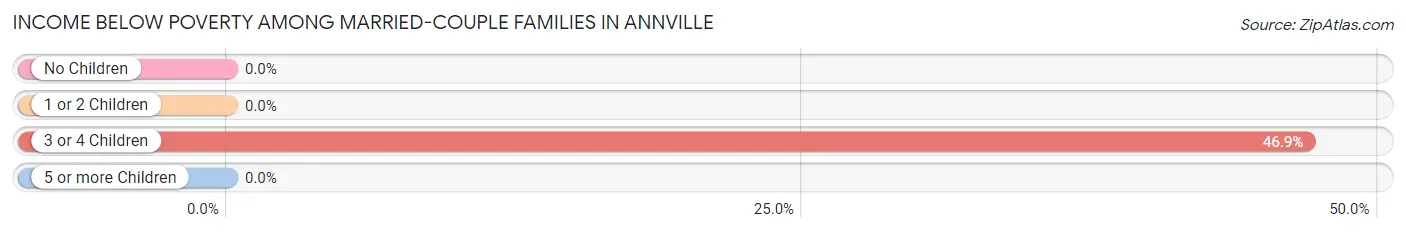
| Children | Above Poverty | Below Poverty |
| No Children | 64 (100.0%) | 0 (0.0%) |
| 1 or 2 Children | 75 (100.0%) | 0 (0.0%) |
| 3 or 4 Children | 17 (53.1%) | 15 (46.9%) |
| 5 or more Children | 0 (0.0%) | 0 (0.0%) |
| Total | 156 (91.2%) | 15 (8.8%) |
Income Below Poverty Among Single-Parent Households in Annville
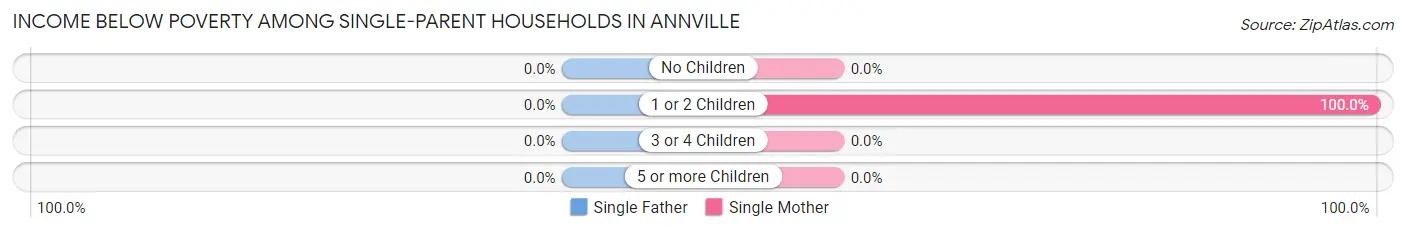
| Children | Single Father | Single Mother |
| No Children | 0 (0.0%) | 0 (0.0%) |
| 1 or 2 Children | 0 (0.0%) | 19 (100.0%) |
| 3 or 4 Children | 0 (0.0%) | 0 (0.0%) |
| 5 or more Children | 0 (0.0%) | 0 (0.0%) |
| Total | 0 (0.0%) | 19 (34.5%) |
Income Below Poverty Among Married-Couple vs Single-Parent Households in Annville
The poverty data for Annville shows that 15 of the married-couple family households (8.8%) and 19 of the single-parent households (34.5%) are living below the poverty level. Within the married-couple family households, those with 3 or 4 children have the highest poverty rate, with 15 households (46.9%) falling below the poverty line. Among the single-parent households, those with 1 or 2 children have the highest poverty rate, with 19 household (100.0%) living below poverty.
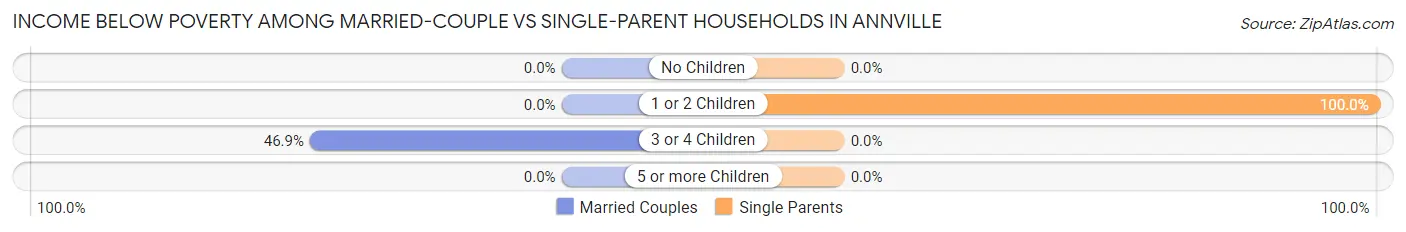
| Children | Married-Couple Families | Single-Parent Households |
| No Children | 0 (0.0%) | 0 (0.0%) |
| 1 or 2 Children | 0 (0.0%) | 19 (100.0%) |
| 3 or 4 Children | 15 (46.9%) | 0 (0.0%) |
| 5 or more Children | 0 (0.0%) | 0 (0.0%) |
| Total | 15 (8.8%) | 19 (34.5%) |
Race in Annville
The most populous races in Annville are White / Caucasian (1,178 | 99.1%), Two or more Races (8 | 0.7%), and Black / African American (3 | 0.3%).
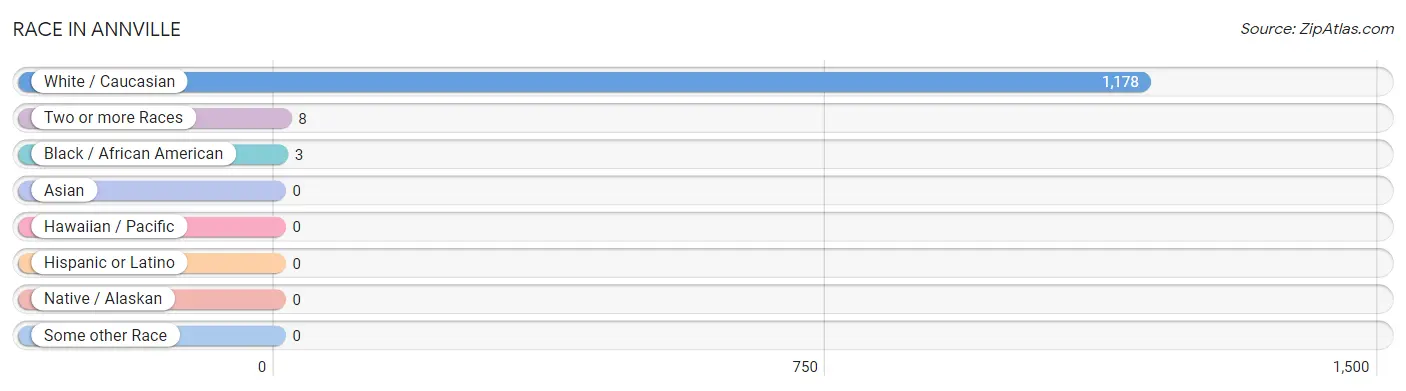
| Race | # Population | % Population |
| Asian | 0 | 0.0% |
| Black / African American | 3 | 0.3% |
| Hawaiian / Pacific | 0 | 0.0% |
| Hispanic or Latino | 0 | 0.0% |
| Native / Alaskan | 0 | 0.0% |
| White / Caucasian | 1,178 | 99.1% |
| Two or more Races | 8 | 0.7% |
| Some other Race | 0 | 0.0% |
| Total | 1,189 | 100.0% |
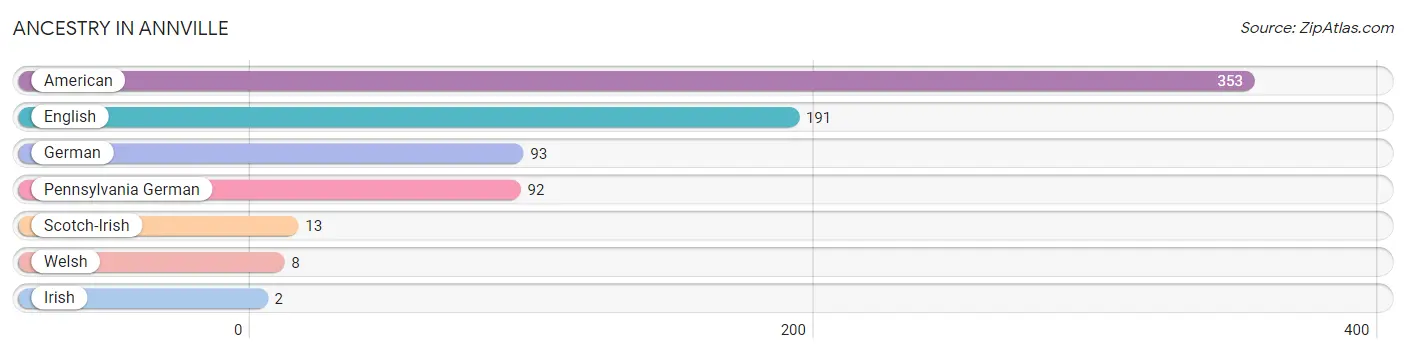
Ancestry in Annville
The most populous ancestries reported in Annville are American (353 | 29.7%), English (191 | 16.1%), German (93 | 7.8%), Pennsylvania German (92 | 7.7%), and Scotch-Irish (13 | 1.1%), together accounting for 62.4% of all Annville residents.
| Ancestry | # Population | % Population |
| American | 353 | 29.7% |
| English | 191 | 16.1% |
| German | 93 | 7.8% |
| Irish | 2 | 0.2% |
| Pennsylvania German | 92 | 7.7% |
| Scotch-Irish | 13 | 1.1% |
| Welsh | 8 | 0.7% | View All 7 Rows |
Immigrants in Annville

| Immigration Origin | # Population | % Population | View All 0 Rows |
Sex and Age in Annville
Sex and Age in Annville
The most populous age groups in Annville are 10 to 14 Years (108 | 18.0%) for men and 35 to 39 Years (126 | 21.4%) for women.
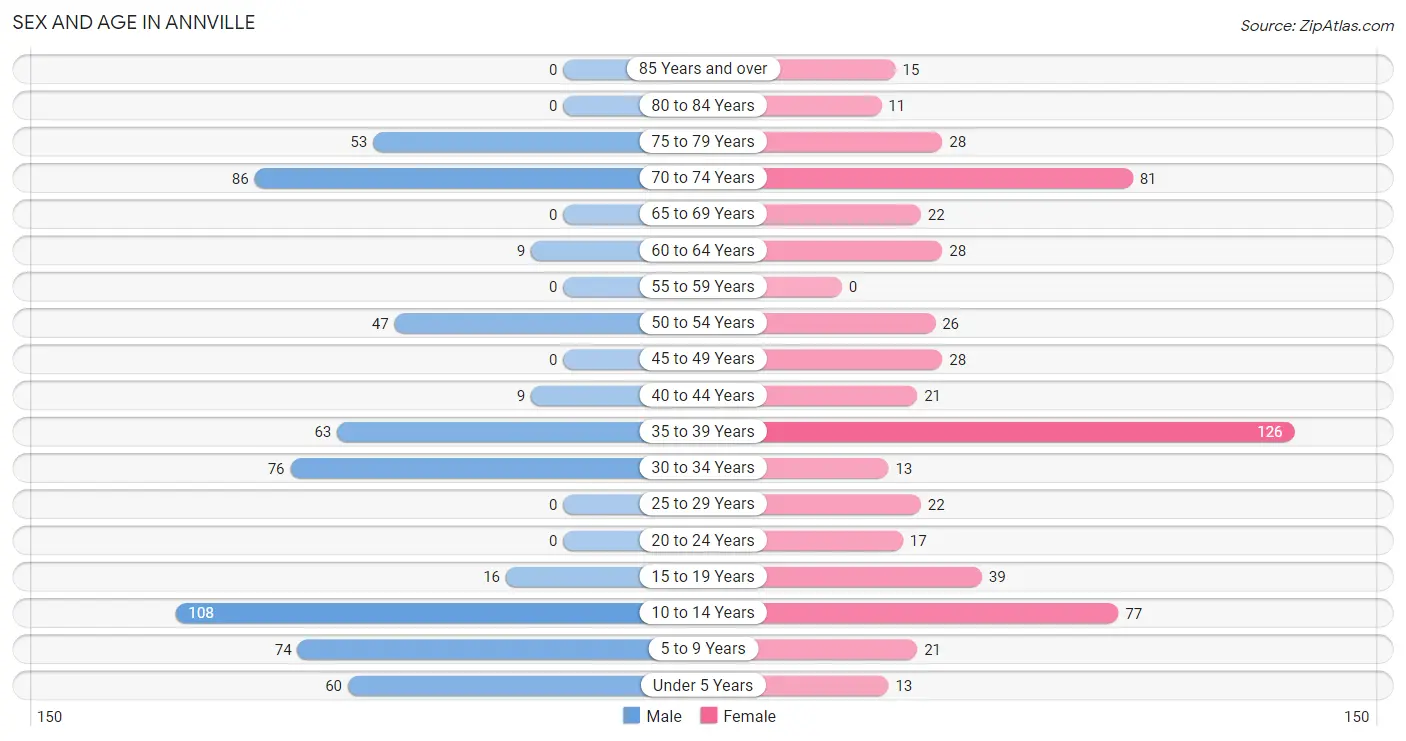
| Age Bracket | Male | Female |
| Under 5 Years | 60 (10.0%) | 13 (2.2%) |
| 5 to 9 Years | 74 (12.3%) | 21 (3.6%) |
| 10 to 14 Years | 108 (18.0%) | 77 (13.1%) |
| 15 to 19 Years | 16 (2.7%) | 39 (6.6%) |
| 20 to 24 Years | 0 (0.0%) | 17 (2.9%) |
| 25 to 29 Years | 0 (0.0%) | 22 (3.7%) |
| 30 to 34 Years | 76 (12.7%) | 13 (2.2%) |
| 35 to 39 Years | 63 (10.5%) | 126 (21.4%) |
| 40 to 44 Years | 9 (1.5%) | 21 (3.6%) |
| 45 to 49 Years | 0 (0.0%) | 28 (4.8%) |
| 50 to 54 Years | 47 (7.8%) | 26 (4.4%) |
| 55 to 59 Years | 0 (0.0%) | 0 (0.0%) |
| 60 to 64 Years | 9 (1.5%) | 28 (4.8%) |
| 65 to 69 Years | 0 (0.0%) | 22 (3.7%) |
| 70 to 74 Years | 86 (14.3%) | 81 (13.8%) |
| 75 to 79 Years | 53 (8.8%) | 28 (4.8%) |
| 80 to 84 Years | 0 (0.0%) | 11 (1.9%) |
| 85 Years and over | 0 (0.0%) | 15 (2.5%) |
| Total | 601 (100.0%) | 588 (100.0%) |
Families and Households in Annville
Median Family Size in Annville
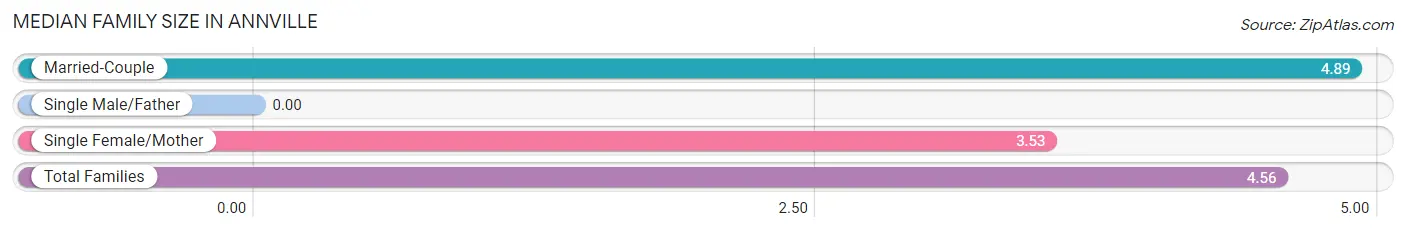
| Family Type | # Families | Family Size |
| Married-Couple | 171 (75.7%) | 4.89 |
| Single Male/Father | 0 (0.0%) | - |
| Single Female/Mother | 55 (24.3%) | 3.53 |
| Total Families | 226 (100.0%) | 4.56 |
Median Household Size in Annville
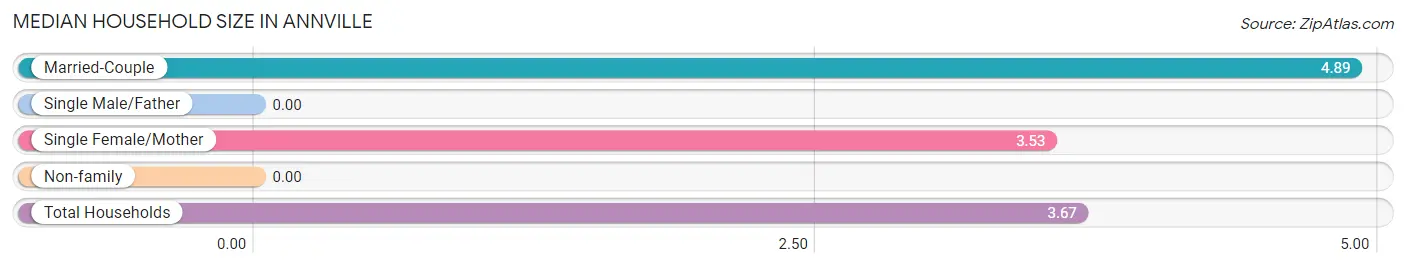
| Household Type | # Households | Household Size |
| Married-Couple | 171 (56.8%) | 4.89 |
| Single Male/Father | 0 (0.0%) | - |
| Single Female/Mother | 55 (18.3%) | 3.53 |
| Non-family | 75 (24.9%) | - |
| Total Households | 301 (100.0%) | 3.67 |
Household Size by Marriage Status in Annville
Out of a total of 301 households in Annville, 226 (75.1%) are family households, while 75 (24.9%) are nonfamily households. The most numerous type of family households are 4-person households, comprising 77, and the most common type of nonfamily households are 1-person households, comprising 75.
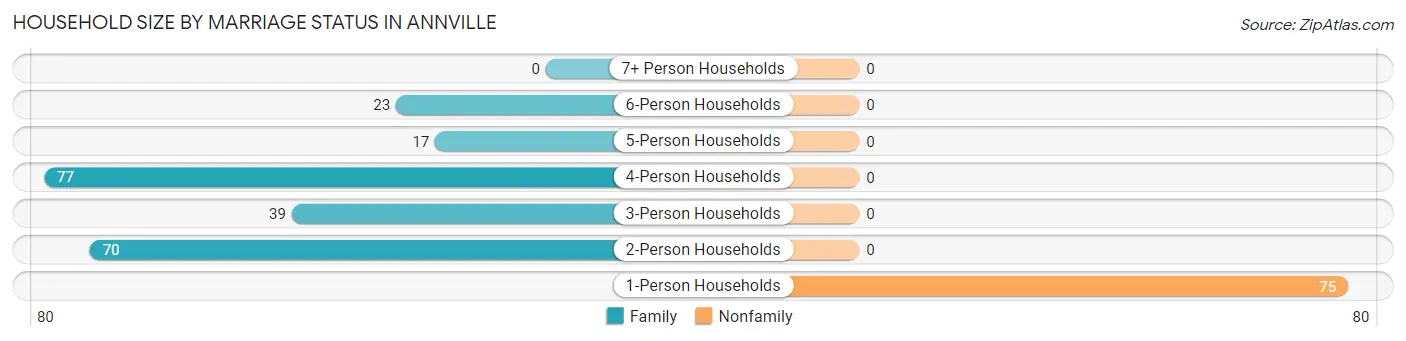
| Household Size | Family Households | Nonfamily Households |
| 1-Person Households | - | 75 (24.9%) |
| 2-Person Households | 70 (23.3%) | 0 (0.0%) |
| 3-Person Households | 39 (13.0%) | 0 (0.0%) |
| 4-Person Households | 77 (25.6%) | 0 (0.0%) |
| 5-Person Households | 17 (5.7%) | 0 (0.0%) |
| 6-Person Households | 23 (7.6%) | 0 (0.0%) |
| 7+ Person Households | 0 (0.0%) | 0 (0.0%) |
| Total | 226 (75.1%) | 75 (24.9%) |
Female Fertility in Annville
Fertility by Age in Annville
| Age Bracket | Women with Births | Births / 1,000 Women |
| 15 to 19 years | 0 (0.0%) | 0.0 |
| 20 to 34 years | 0 (0.0%) | 0.0 |
| 35 to 50 years | 0 (0.0%) | 0.0 |
| Total | 0 (0.0%) | 0.0 |
Fertility by Age by Marriage Status in Annville
| Age Bracket | Married | Unmarried |
| 15 to 19 years | 0 (0.0%) | 0 (0.0%) |
| 20 to 34 years | 0 (0.0%) | 0 (0.0%) |
| 35 to 50 years | 0 (0.0%) | 0 (0.0%) |
| Total | 0 (0.0%) | 0 (0.0%) |
Fertility by Education in Annville
| Educational Attainment | Women with Births | Births / 1,000 Women |
| Less than High School | 0 (0.0%) | 0.0 |
| High School Diploma | 0 (0.0%) | 0.0 |
| College or Associate's Degree | 0 (0.0%) | 0.0 |
| Bachelor's Degree | 0 (0.0%) | 0.0 |
| Graduate Degree | 0 (0.0%) | 0.0 |
| Total | 0 (0.0%) | 0.0 |
Fertility by Education by Marriage Status in Annville
| Educational Attainment | Married | Unmarried |
| Less than High School | 0 (0.0%) | 0 (0.0%) |
| High School Diploma | 0 (0.0%) | 0 (0.0%) |
| College or Associate's Degree | 0 (0.0%) | 0 (0.0%) |
| Bachelor's Degree | 0 (0.0%) | 0 (0.0%) |
| Graduate Degree | 0 (0.0%) | 0 (0.0%) |
| Total | 0 (0.0%) | 0 (0.0%) |
Employment Characteristics in Annville
Employment by Class of Employer in Annville
Among the 318 employed individuals in Annville, private company employees (235 | 73.9%), federal government employees (29 | 9.1%), and local government employees (21 | 6.6%) make up the most common classes of employment.
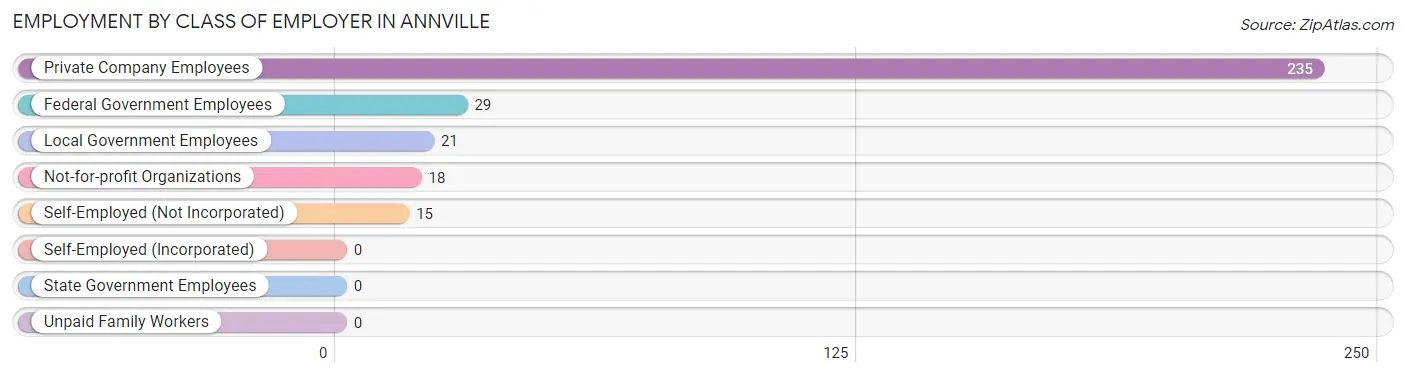
| Employer Class | # Employees | % Employees |
| Private Company Employees | 235 | 73.9% |
| Self-Employed (Incorporated) | 0 | 0.0% |
| Self-Employed (Not Incorporated) | 15 | 4.7% |
| Not-for-profit Organizations | 18 | 5.7% |
| Local Government Employees | 21 | 6.6% |
| State Government Employees | 0 | 0.0% |
| Federal Government Employees | 29 | 9.1% |
| Unpaid Family Workers | 0 | 0.0% |
| Total | 318 | 100.0% |
Employment Status by Age in Annville
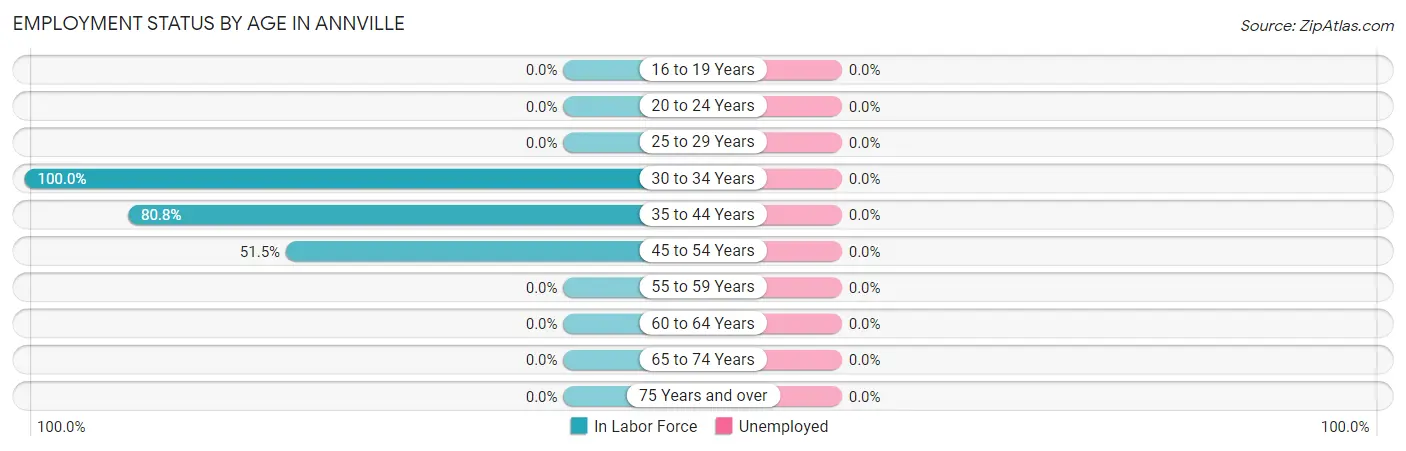
| Age Bracket | In Labor Force | Unemployed |
| 16 to 19 Years | 0 (0.0%) | 0 (0.0%) |
| 20 to 24 Years | 0 (0.0%) | 0 (0.0%) |
| 25 to 29 Years | 0 (0.0%) | 0 (0.0%) |
| 30 to 34 Years | 89 (100.0%) | 0 (0.0%) |
| 35 to 44 Years | 177 (80.8%) | 0 (0.0%) |
| 45 to 54 Years | 52 (51.5%) | 0 (0.0%) |
| 55 to 59 Years | 0 (0.0%) | 0 (0.0%) |
| 60 to 64 Years | 0 (0.0%) | 0 (0.0%) |
| 65 to 74 Years | 0 (0.0%) | 0 (0.0%) |
| 75 Years and over | 0 (0.0%) | 0 (0.0%) |
| Total | 318 (38.0%) | 0 (0.0%) |
Employment Status by Educational Attainment in Annville
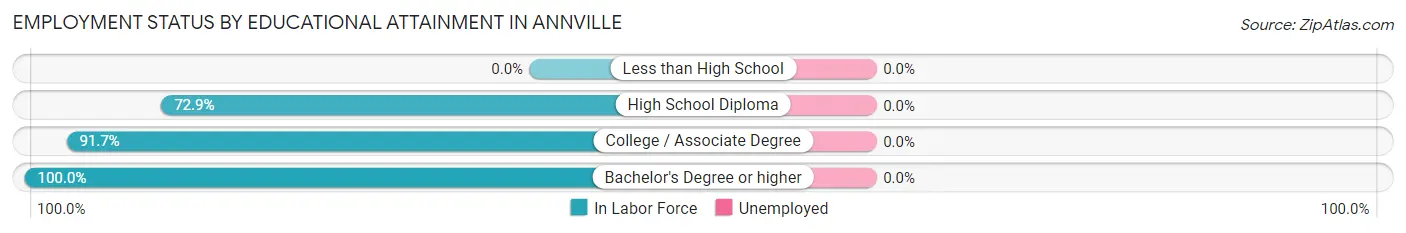
| Educational Attainment | In Labor Force | Unemployed |
| Less than High School | 0 (0.0%) | 0 (0.0%) |
| High School Diploma | 204 (72.9%) | 0 (0.0%) |
| College / Associate Degree | 100 (91.7%) | 0 (0.0%) |
| Bachelor's Degree or higher | 14 (100.0%) | 0 (0.0%) |
| Total | 318 (67.9%) | 0 (0.0%) |
Employment Occupations by Sex in Annville
Management, Business, Science and Arts Occupations
The most common Management, Business, Science and Arts occupations in Annville are Community & Social Service (9 | 2.8%), Education Instruction & Library (9 | 2.8%), and Management (5 | 1.6%).
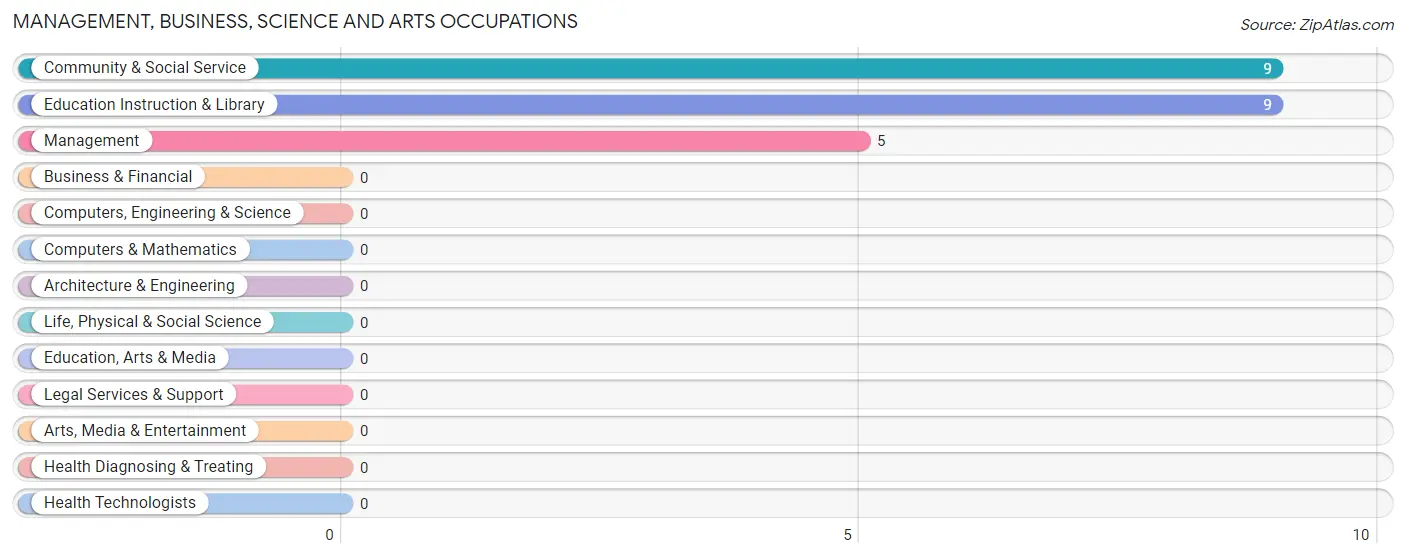
Management, Business, Science and Arts Occupations by Sex
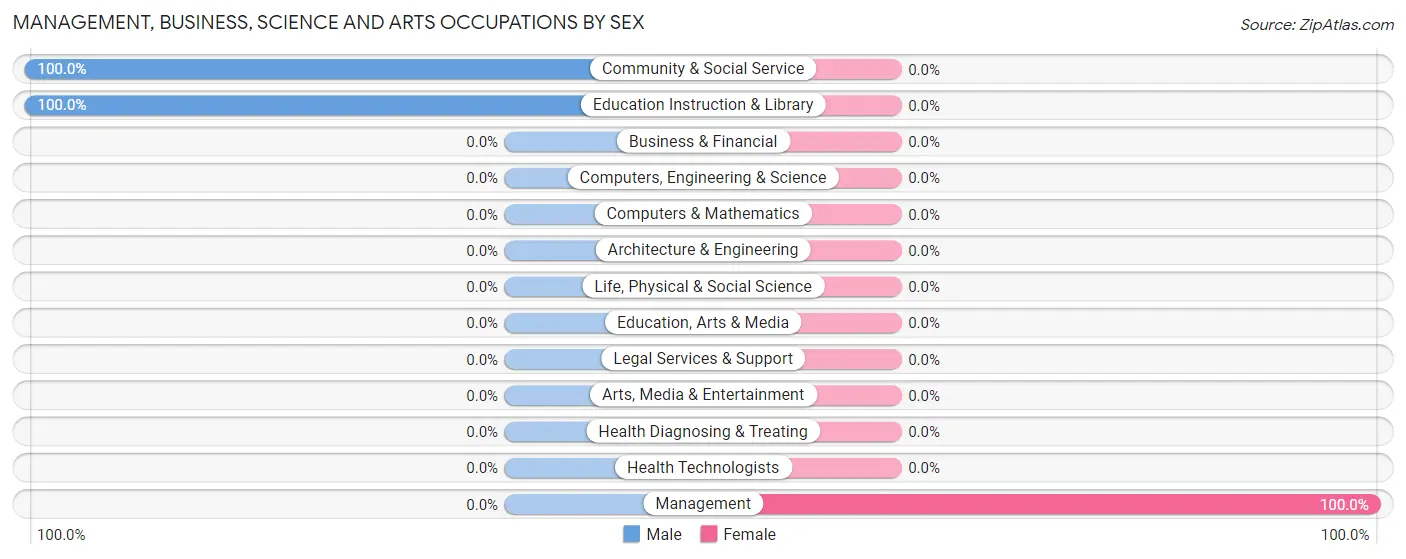
| Occupation | Male | Female |
| Management | 0 (0.0%) | 5 (100.0%) |
| Business & Financial | 0 (0.0%) | 0 (0.0%) |
| Computers, Engineering & Science | 0 (0.0%) | 0 (0.0%) |
| Computers & Mathematics | 0 (0.0%) | 0 (0.0%) |
| Architecture & Engineering | 0 (0.0%) | 0 (0.0%) |
| Life, Physical & Social Science | 0 (0.0%) | 0 (0.0%) |
| Community & Social Service | 9 (100.0%) | 0 (0.0%) |
| Education, Arts & Media | 0 (0.0%) | 0 (0.0%) |
| Legal Services & Support | 0 (0.0%) | 0 (0.0%) |
| Education Instruction & Library | 9 (100.0%) | 0 (0.0%) |
| Arts, Media & Entertainment | 0 (0.0%) | 0 (0.0%) |
| Health Diagnosing & Treating | 0 (0.0%) | 0 (0.0%) |
| Health Technologists | 0 (0.0%) | 0 (0.0%) |
| Total (Category) | 9 (64.3%) | 5 (35.7%) |
| Total (Overall) | 173 (54.4%) | 145 (45.6%) |
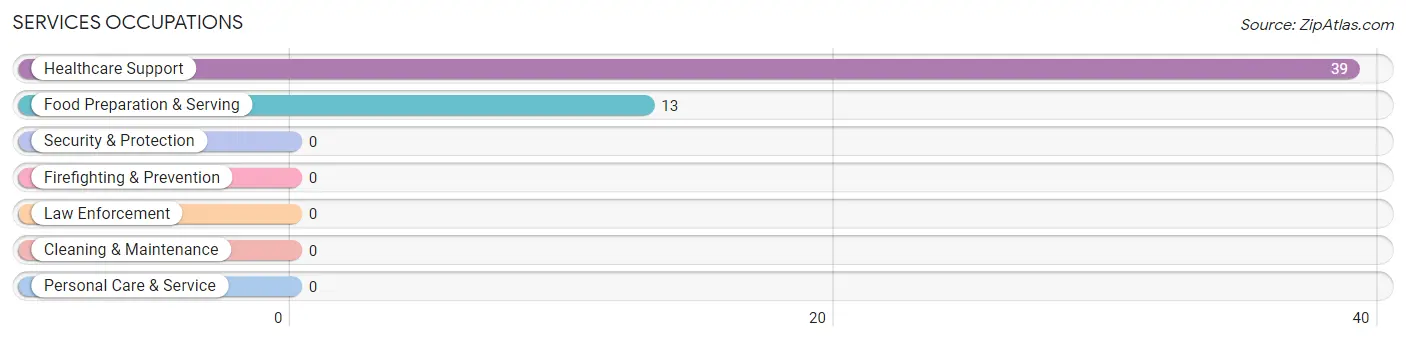
Services Occupations
The most common Services occupations in Annville are Healthcare Support (39 | 12.3%), and Food Preparation & Serving (13 | 4.1%).
Services Occupations by Sex
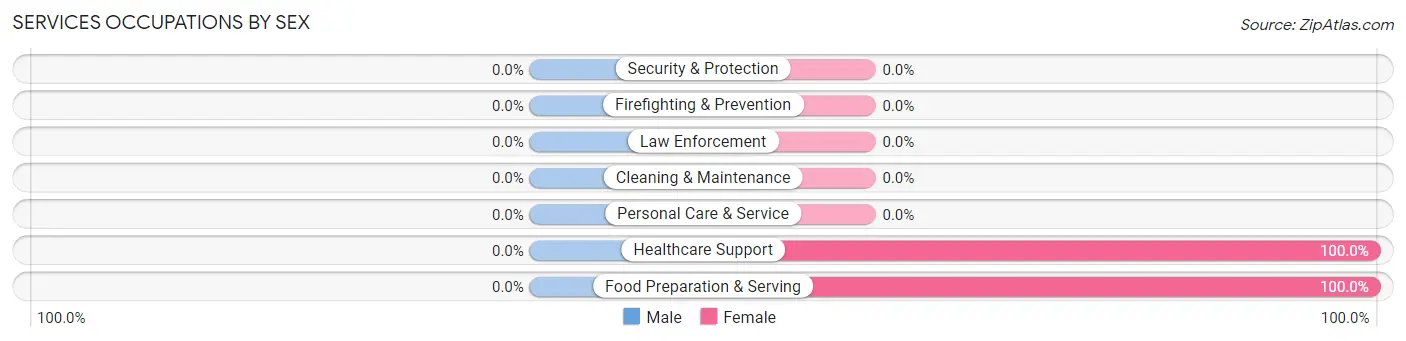
| Occupation | Male | Female |
| Healthcare Support | 0 (0.0%) | 39 (100.0%) |
| Security & Protection | 0 (0.0%) | 0 (0.0%) |
| Firefighting & Prevention | 0 (0.0%) | 0 (0.0%) |
| Law Enforcement | 0 (0.0%) | 0 (0.0%) |
| Food Preparation & Serving | 0 (0.0%) | 13 (100.0%) |
| Cleaning & Maintenance | 0 (0.0%) | 0 (0.0%) |
| Personal Care & Service | 0 (0.0%) | 0 (0.0%) |
| Total (Category) | 0 (0.0%) | 52 (100.0%) |
| Total (Overall) | 173 (54.4%) | 145 (45.6%) |
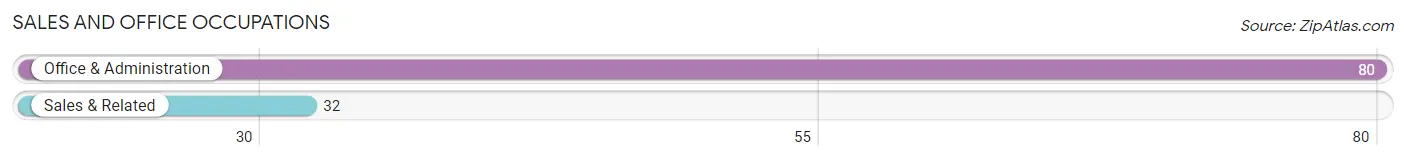
Sales and Office Occupations
The most common Sales and Office occupations in Annville are Office & Administration (80 | 25.2%), and Sales & Related (32 | 10.1%).
Sales and Office Occupations by Sex
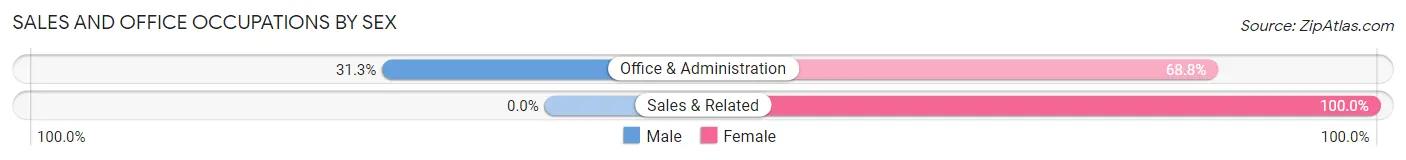
| Occupation | Male | Female |
| Sales & Related | 0 (0.0%) | 32 (100.0%) |
| Office & Administration | 25 (31.2%) | 55 (68.8%) |
| Total (Category) | 25 (22.3%) | 87 (77.7%) |
| Total (Overall) | 173 (54.4%) | 145 (45.6%) |
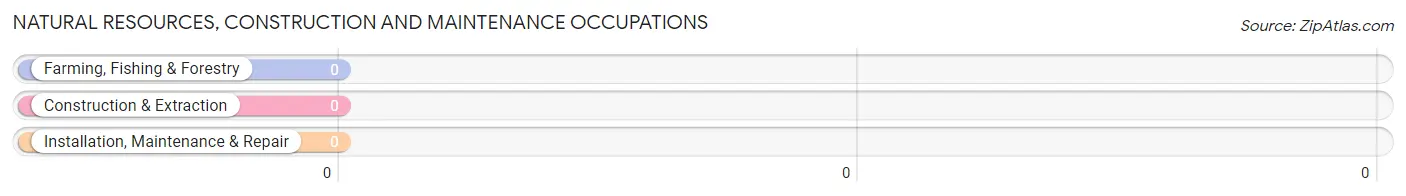
Natural Resources, Construction and Maintenance Occupations
Natural Resources, Construction and Maintenance Occupations by Sex
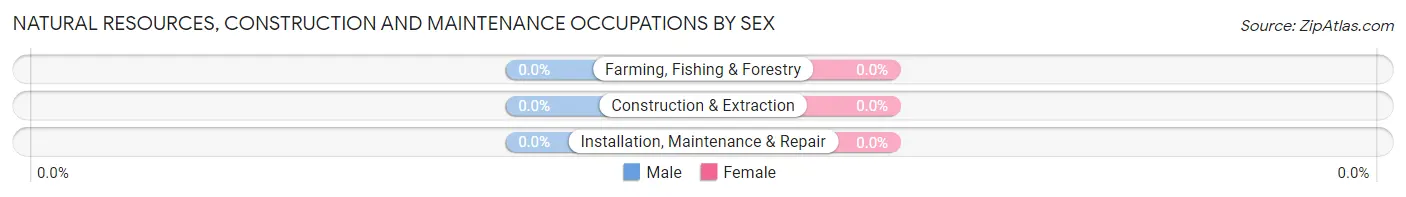
| Occupation | Male | Female |
| Farming, Fishing & Forestry | 0 (0.0%) | 0 (0.0%) |
| Construction & Extraction | 0 (0.0%) | 0 (0.0%) |
| Installation, Maintenance & Repair | 0 (0.0%) | 0 (0.0%) |
| Total (Category) | 0 (0.0%) | 0 (0.0%) |
| Total (Overall) | 173 (54.4%) | 145 (45.6%) |
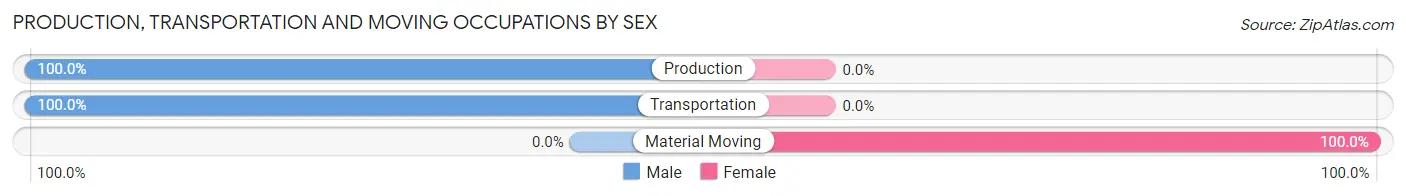
Production, Transportation and Moving Occupations
The most common Production, Transportation and Moving occupations in Annville are Production (112 | 35.2%), Transportation (27 | 8.5%), and Material Moving (1 | 0.3%).
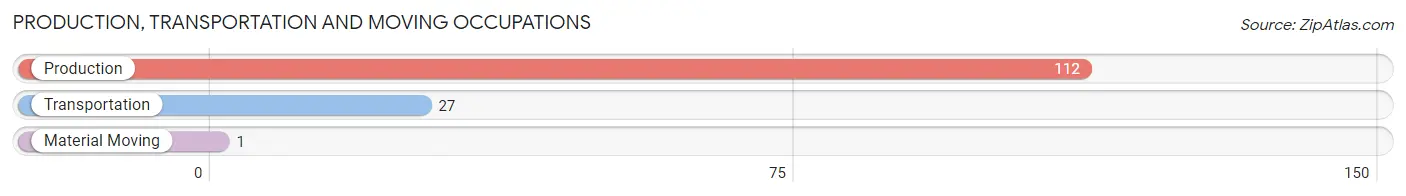
Production, Transportation and Moving Occupations by Sex
| Occupation | Male | Female |
| Production | 112 (100.0%) | 0 (0.0%) |
| Transportation | 27 (100.0%) | 0 (0.0%) |
| Material Moving | 0 (0.0%) | 1 (100.0%) |
| Total (Category) | 139 (99.3%) | 1 (0.7%) |
| Total (Overall) | 173 (54.4%) | 145 (45.6%) |
Employment Industries by Sex in Annville
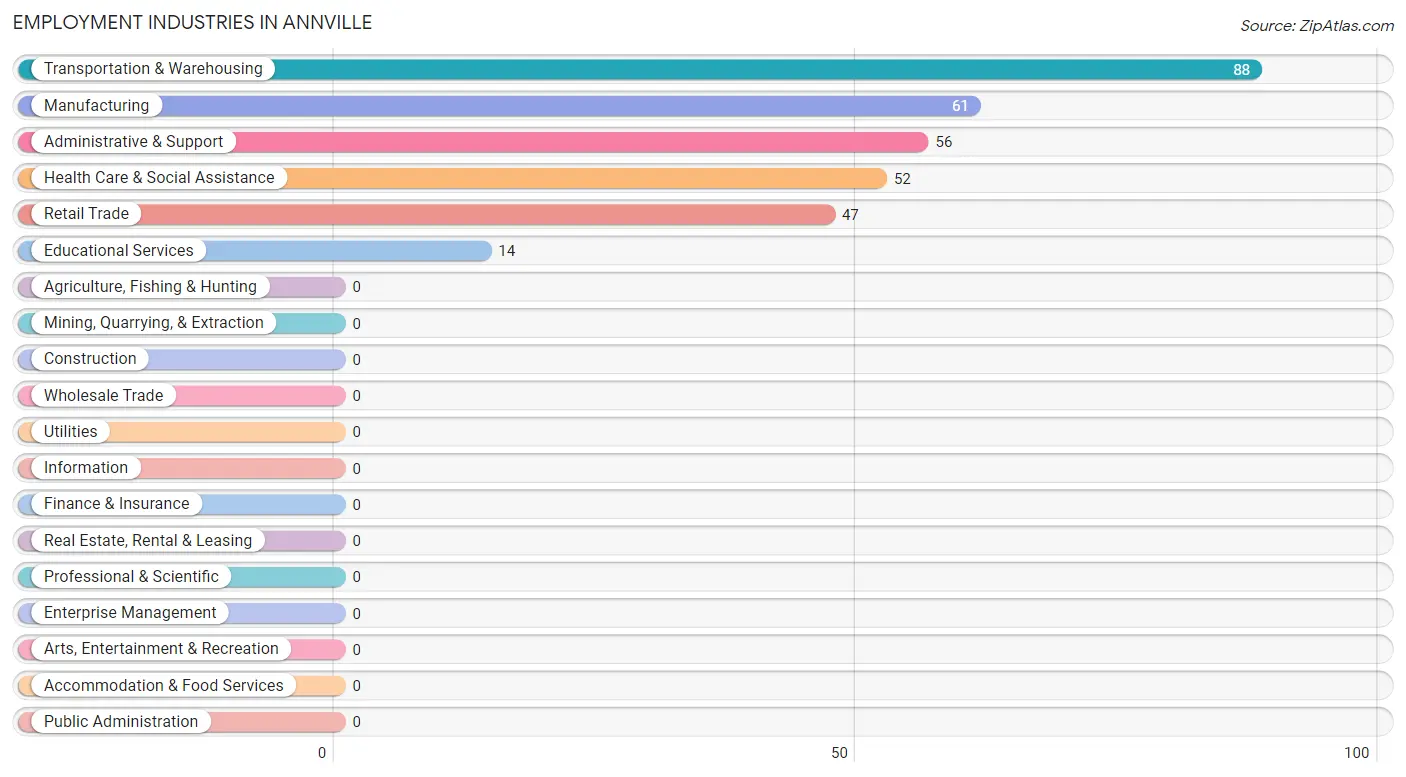
Employment Industries in Annville
The major employment industries in Annville include Transportation & Warehousing (88 | 27.7%), Manufacturing (61 | 19.2%), Administrative & Support (56 | 17.6%), Health Care & Social Assistance (52 | 16.4%), and Retail Trade (47 | 14.8%).
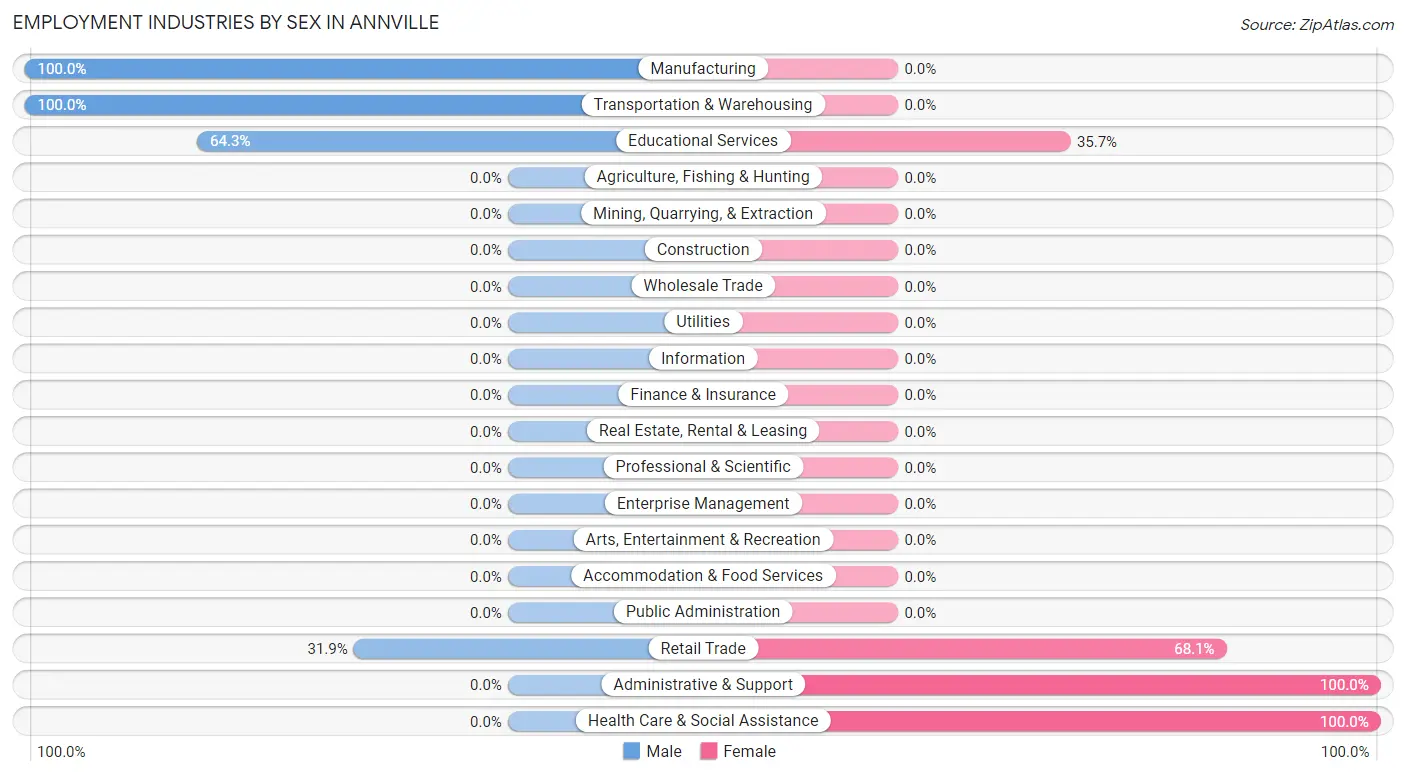
Employment Industries by Sex in Annville
The Annville industries that see more men than women are Manufacturing (100.0%), Transportation & Warehousing (100.0%), and Educational Services (64.3%), whereas the industries that tend to have a higher number of women are Administrative & Support (100.0%), Health Care & Social Assistance (100.0%), and Retail Trade (68.1%).
| Industry | Male | Female |
| Agriculture, Fishing & Hunting | 0 (0.0%) | 0 (0.0%) |
| Mining, Quarrying, & Extraction | 0 (0.0%) | 0 (0.0%) |
| Construction | 0 (0.0%) | 0 (0.0%) |
| Manufacturing | 61 (100.0%) | 0 (0.0%) |
| Wholesale Trade | 0 (0.0%) | 0 (0.0%) |
| Retail Trade | 15 (31.9%) | 32 (68.1%) |
| Transportation & Warehousing | 88 (100.0%) | 0 (0.0%) |
| Utilities | 0 (0.0%) | 0 (0.0%) |
| Information | 0 (0.0%) | 0 (0.0%) |
| Finance & Insurance | 0 (0.0%) | 0 (0.0%) |
| Real Estate, Rental & Leasing | 0 (0.0%) | 0 (0.0%) |
| Professional & Scientific | 0 (0.0%) | 0 (0.0%) |
| Enterprise Management | 0 (0.0%) | 0 (0.0%) |
| Administrative & Support | 0 (0.0%) | 56 (100.0%) |
| Educational Services | 9 (64.3%) | 5 (35.7%) |
| Health Care & Social Assistance | 0 (0.0%) | 52 (100.0%) |
| Arts, Entertainment & Recreation | 0 (0.0%) | 0 (0.0%) |
| Accommodation & Food Services | 0 (0.0%) | 0 (0.0%) |
| Public Administration | 0 (0.0%) | 0 (0.0%) |
| Total | 173 (54.4%) | 145 (45.6%) |
Education in Annville
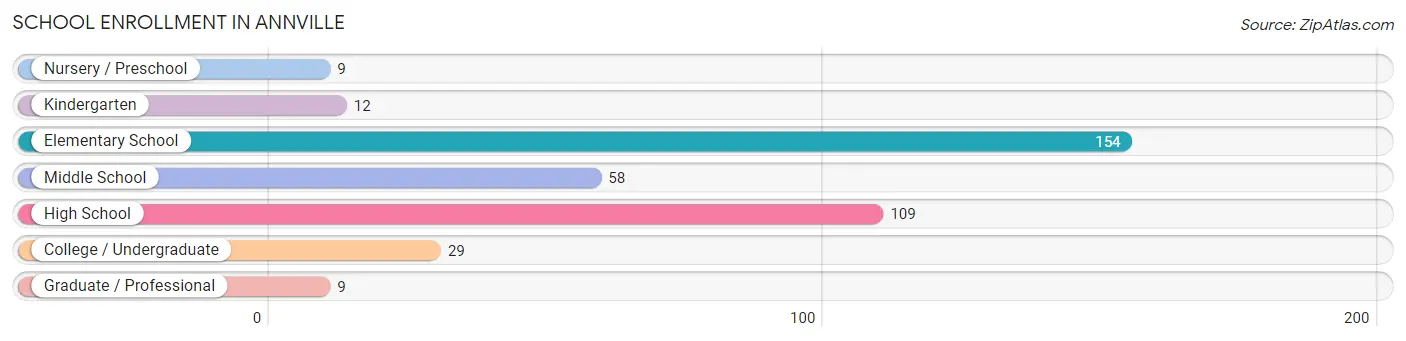
School Enrollment in Annville
The most common levels of schooling among the 380 students in Annville are elementary school (154 | 40.5%), high school (109 | 28.7%), and middle school (58 | 15.3%).
| School Level | # Students | % Students |
| Nursery / Preschool | 9 | 2.4% |
| Kindergarten | 12 | 3.2% |
| Elementary School | 154 | 40.5% |
| Middle School | 58 | 15.3% |
| High School | 109 | 28.7% |
| College / Undergraduate | 29 | 7.6% |
| Graduate / Professional | 9 | 2.4% |
| Total | 380 | 100.0% |
School Enrollment by Age by Funding Source in Annville
Out of a total of 380 students who are enrolled in schools in Annville, 76 (20.0%) attend a private institution, while the remaining 304 (80.0%) are enrolled in public schools. The age group of 18 to 19 year olds has the highest likelihood of being enrolled in private schools, with 9 (100.0% in the age bracket) enrolled. Conversely, the age group of 10 to 14 year olds has the lowest likelihood of being enrolled in a private school, with 185 (100.0% in the age bracket) attending a public institution.
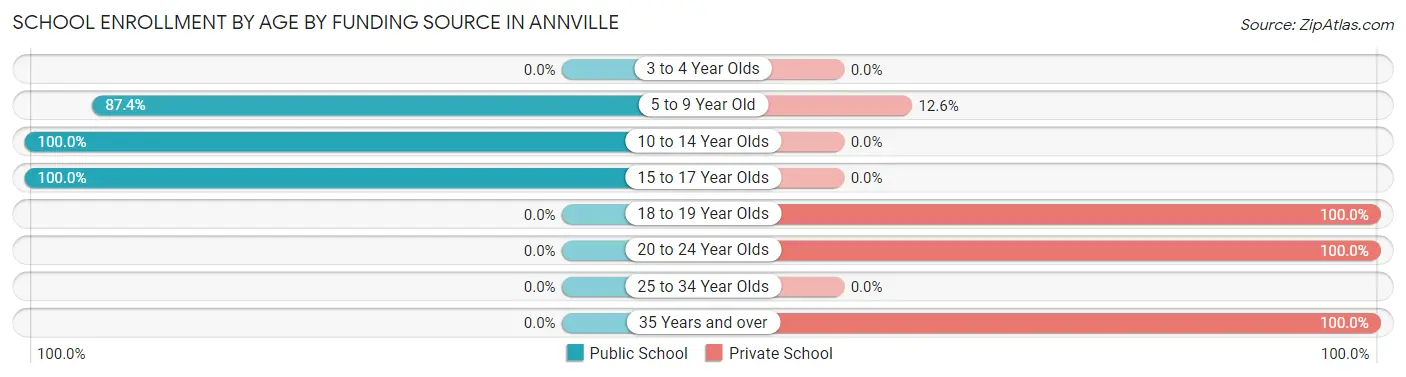
| Age Bracket | Public School | Private School |
| 3 to 4 Year Olds | 0 (0.0%) | 0 (0.0%) |
| 5 to 9 Year Old | 83 (87.4%) | 12 (12.6%) |
| 10 to 14 Year Olds | 185 (100.0%) | 0 (0.0%) |
| 15 to 17 Year Olds | 36 (100.0%) | 0 (0.0%) |
| 18 to 19 Year Olds | 0 (0.0%) | 9 (100.0%) |
| 20 to 24 Year Olds | 0 (0.0%) | 17 (100.0%) |
| 25 to 34 Year Olds | 0 (0.0%) | 0 (0.0%) |
| 35 Years and over | 0 (0.0%) | 38 (100.0%) |
| Total | 304 (80.0%) | 76 (20.0%) |
Educational Attainment by Field of Study in Annville
Computers & mathematics (18 | 40.9%), education (12 | 27.3%), arts & humanities (9 | 20.4%), and business (5 | 11.4%) are the most common fields of study among 44 individuals in Annville who have obtained a bachelor's degree or higher.
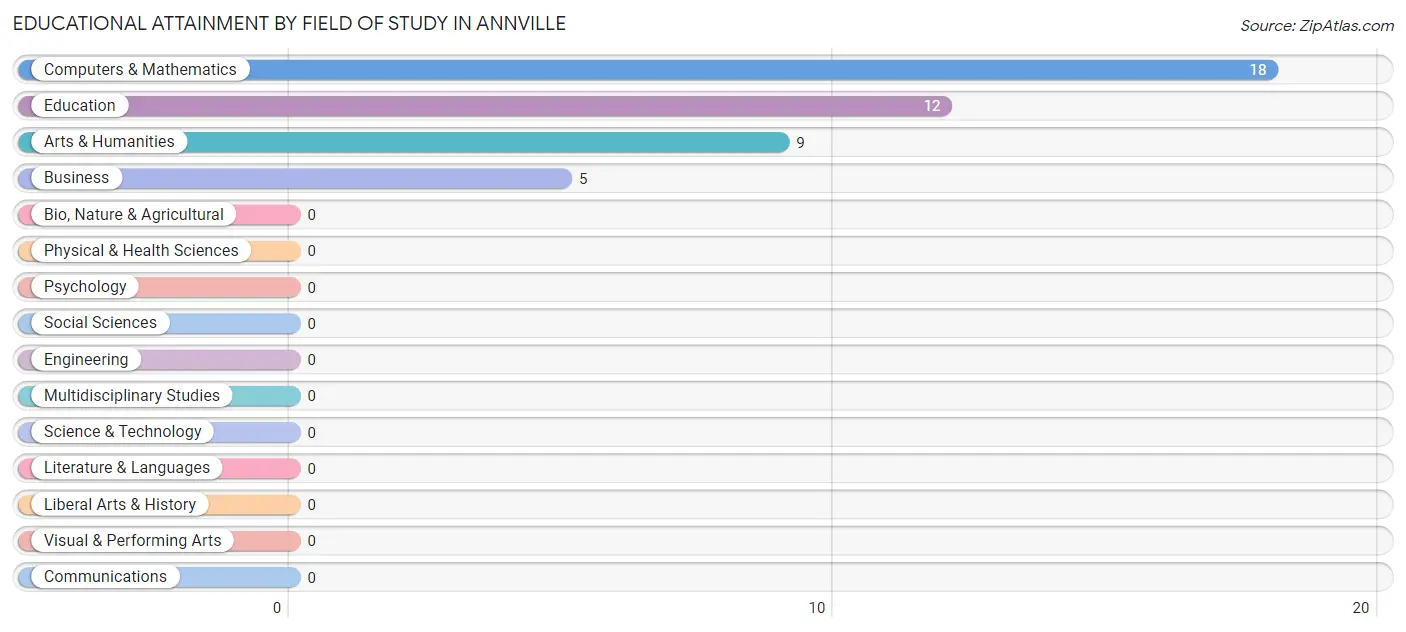
| Field of Study | # Graduates | % Graduates |
| Computers & Mathematics | 18 | 40.9% |
| Bio, Nature & Agricultural | 0 | 0.0% |
| Physical & Health Sciences | 0 | 0.0% |
| Psychology | 0 | 0.0% |
| Social Sciences | 0 | 0.0% |
| Engineering | 0 | 0.0% |
| Multidisciplinary Studies | 0 | 0.0% |
| Science & Technology | 0 | 0.0% |
| Business | 5 | 11.4% |
| Education | 12 | 27.3% |
| Literature & Languages | 0 | 0.0% |
| Liberal Arts & History | 0 | 0.0% |
| Visual & Performing Arts | 0 | 0.0% |
| Communications | 0 | 0.0% |
| Arts & Humanities | 9 | 20.4% |
| Total | 44 | 100.0% |
Transportation & Commute in Annville
Vehicle Availability by Sex in Annville
The most prevalent vehicle ownership categories in Annville are males with 1 vehicle (76, accounting for 43.9%) and females with 1 vehicle (55, making up 52.8%).
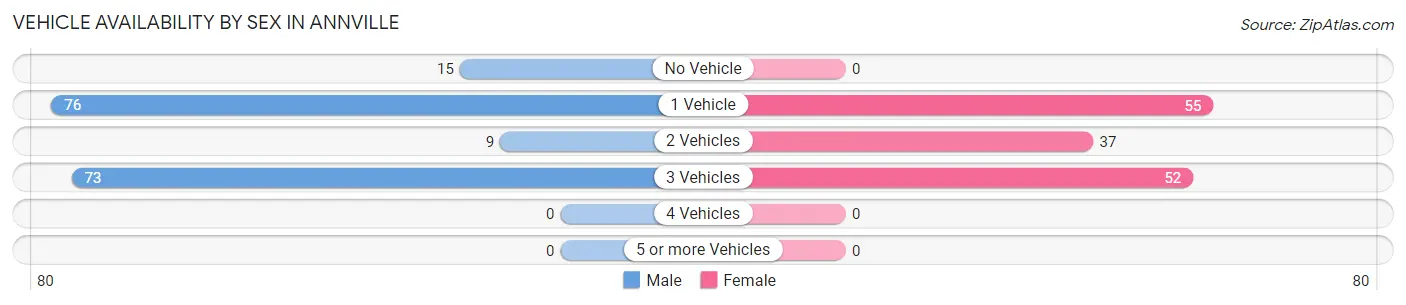
| Vehicles Available | Male | Female |
| No Vehicle | 15 (8.7%) | 0 (0.0%) |
| 1 Vehicle | 76 (43.9%) | 55 (38.2%) |
| 2 Vehicles | 9 (5.2%) | 37 (25.7%) |
| 3 Vehicles | 73 (42.2%) | 52 (36.1%) |
| 4 Vehicles | 0 (0.0%) | 0 (0.0%) |
| 5 or more Vehicles | 0 (0.0%) | 0 (0.0%) |
| Total | 173 (100.0%) | 144 (100.0%) |
Commute Time in Annville
The most frequently occuring commute durations in Annville are 30 to 34 minutes (80 commuters, 25.2%), 60 to 89 minutes (70 commuters, 22.0%), and 20 to 24 minutes (51 commuters, 16.0%).
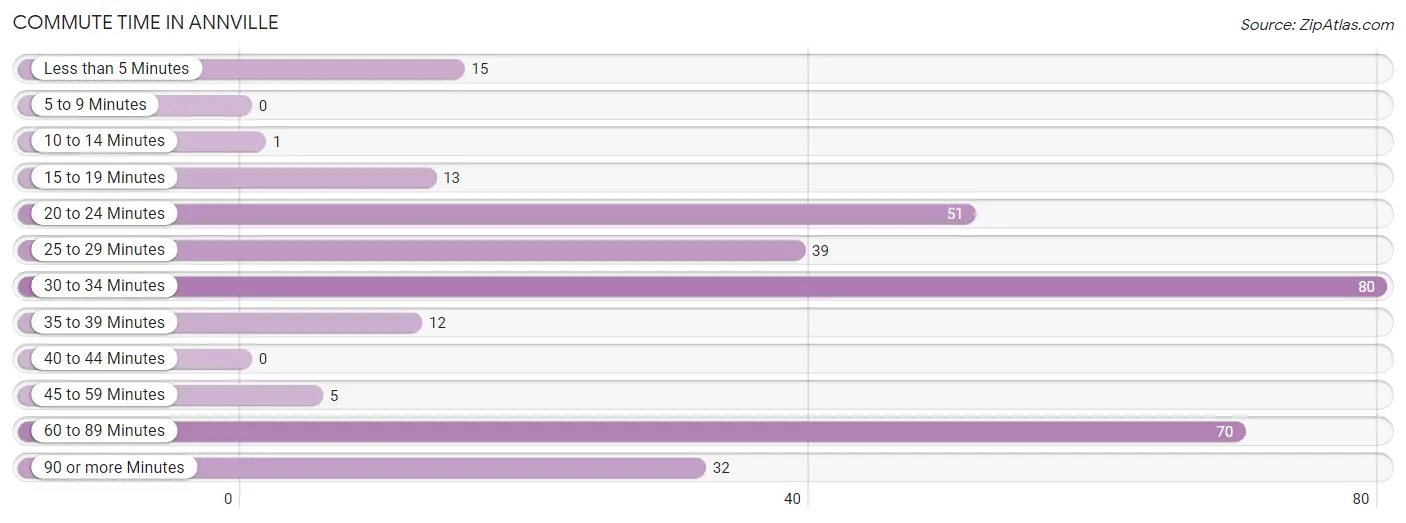
| Commute Time | # Commuters | % Commuters |
| Less than 5 Minutes | 15 | 4.7% |
| 5 to 9 Minutes | 0 | 0.0% |
| 10 to 14 Minutes | 1 | 0.3% |
| 15 to 19 Minutes | 13 | 4.1% |
| 20 to 24 Minutes | 51 | 16.0% |
| 25 to 29 Minutes | 39 | 12.3% |
| 30 to 34 Minutes | 80 | 25.2% |
| 35 to 39 Minutes | 12 | 3.8% |
| 40 to 44 Minutes | 0 | 0.0% |
| 45 to 59 Minutes | 5 | 1.6% |
| 60 to 89 Minutes | 70 | 22.0% |
| 90 or more Minutes | 32 | 10.1% |
Commute Time by Sex in Annville
The most common commute times in Annville are 60 to 89 minutes (70 commuters, 40.5%) for males and 30 to 34 minutes (55 commuters, 37.9%) for females.
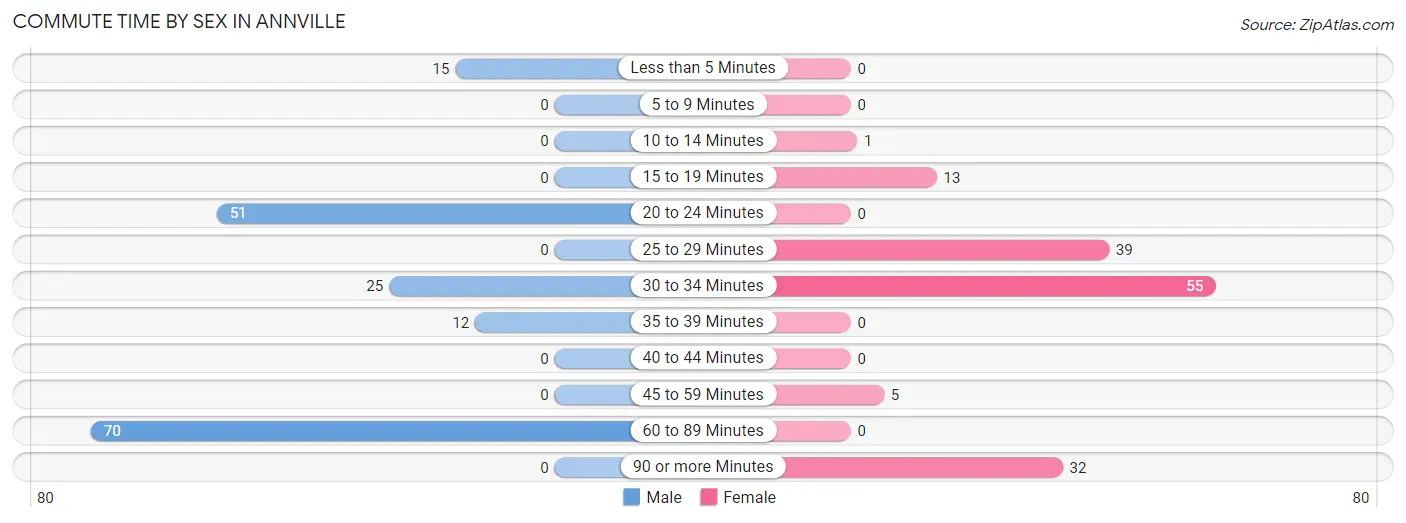
| Commute Time | Male | Female |
| Less than 5 Minutes | 15 (8.7%) | 0 (0.0%) |
| 5 to 9 Minutes | 0 (0.0%) | 0 (0.0%) |
| 10 to 14 Minutes | 0 (0.0%) | 1 (0.7%) |
| 15 to 19 Minutes | 0 (0.0%) | 13 (9.0%) |
| 20 to 24 Minutes | 51 (29.5%) | 0 (0.0%) |
| 25 to 29 Minutes | 0 (0.0%) | 39 (26.9%) |
| 30 to 34 Minutes | 25 (14.4%) | 55 (37.9%) |
| 35 to 39 Minutes | 12 (6.9%) | 0 (0.0%) |
| 40 to 44 Minutes | 0 (0.0%) | 0 (0.0%) |
| 45 to 59 Minutes | 0 (0.0%) | 5 (3.5%) |
| 60 to 89 Minutes | 70 (40.5%) | 0 (0.0%) |
| 90 or more Minutes | 0 (0.0%) | 32 (22.1%) |
Time of Departure to Work by Sex in Annville
The most frequent times of departure to work in Annville are 4:00 PM to 11:59 PM (61, 35.3%) for males and 6:00 AM to 6:29 AM (61, 42.1%) for females.
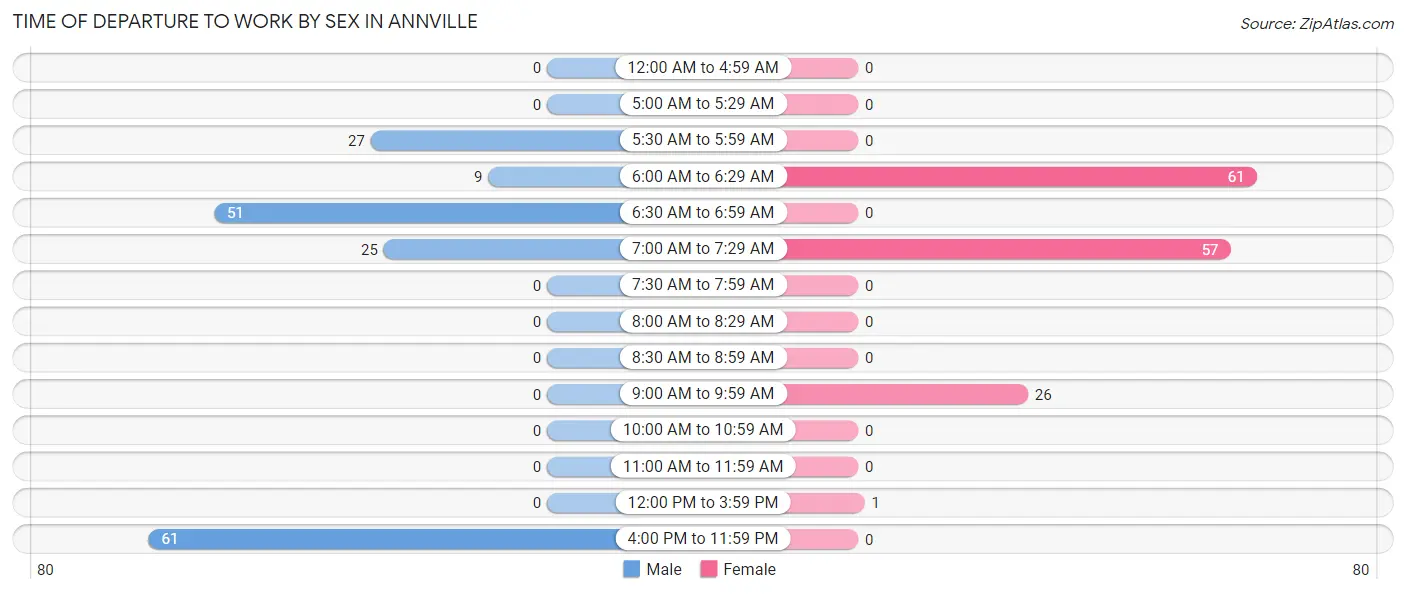
| Time of Departure | Male | Female |
| 12:00 AM to 4:59 AM | 0 (0.0%) | 0 (0.0%) |
| 5:00 AM to 5:29 AM | 0 (0.0%) | 0 (0.0%) |
| 5:30 AM to 5:59 AM | 27 (15.6%) | 0 (0.0%) |
| 6:00 AM to 6:29 AM | 9 (5.2%) | 61 (42.1%) |
| 6:30 AM to 6:59 AM | 51 (29.5%) | 0 (0.0%) |
| 7:00 AM to 7:29 AM | 25 (14.4%) | 57 (39.3%) |
| 7:30 AM to 7:59 AM | 0 (0.0%) | 0 (0.0%) |
| 8:00 AM to 8:29 AM | 0 (0.0%) | 0 (0.0%) |
| 8:30 AM to 8:59 AM | 0 (0.0%) | 0 (0.0%) |
| 9:00 AM to 9:59 AM | 0 (0.0%) | 26 (17.9%) |
| 10:00 AM to 10:59 AM | 0 (0.0%) | 0 (0.0%) |
| 11:00 AM to 11:59 AM | 0 (0.0%) | 0 (0.0%) |
| 12:00 PM to 3:59 PM | 0 (0.0%) | 1 (0.7%) |
| 4:00 PM to 11:59 PM | 61 (35.3%) | 0 (0.0%) |
| Total | 173 (100.0%) | 145 (100.0%) |
Housing Occupancy in Annville
Occupancy by Ownership in Annville
Of the total 301 dwellings in Annville, owner-occupied units account for 287 (95.4%), while renter-occupied units make up 14 (4.6%).
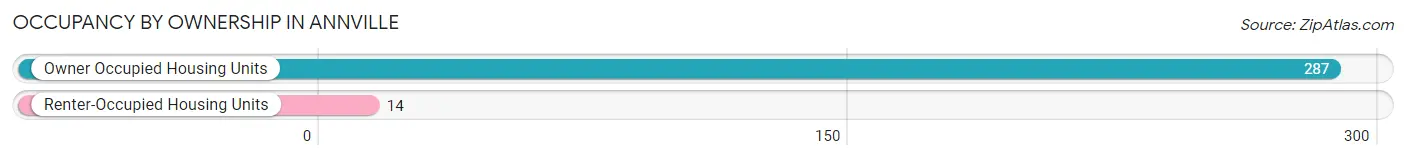
| Occupancy | # Housing Units | % Housing Units |
| Owner Occupied Housing Units | 287 | 95.4% |
| Renter-Occupied Housing Units | 14 | 4.6% |
| Total Occupied Housing Units | 301 | 100.0% |
Occupancy by Household Size in Annville
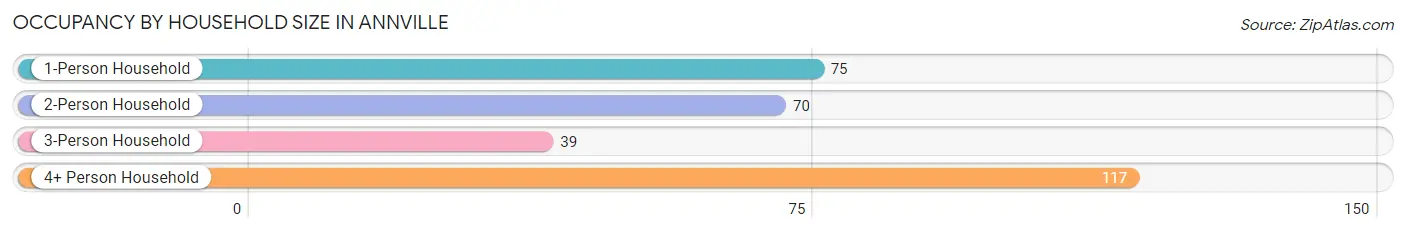
| Household Size | # Housing Units | % Housing Units |
| 1-Person Household | 75 | 24.9% |
| 2-Person Household | 70 | 23.3% |
| 3-Person Household | 39 | 13.0% |
| 4+ Person Household | 117 | 38.9% |
| Total Housing Units | 301 | 100.0% |
Occupancy by Ownership by Household Size in Annville
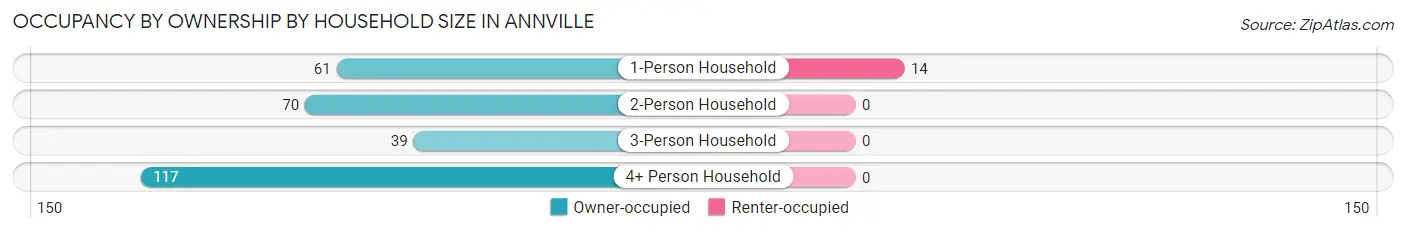
| Household Size | Owner-occupied | Renter-occupied |
| 1-Person Household | 61 (81.3%) | 14 (18.7%) |
| 2-Person Household | 70 (100.0%) | 0 (0.0%) |
| 3-Person Household | 39 (100.0%) | 0 (0.0%) |
| 4+ Person Household | 117 (100.0%) | 0 (0.0%) |
| Total Housing Units | 287 (95.4%) | 14 (4.6%) |
Occupancy by Educational Attainment in Annville
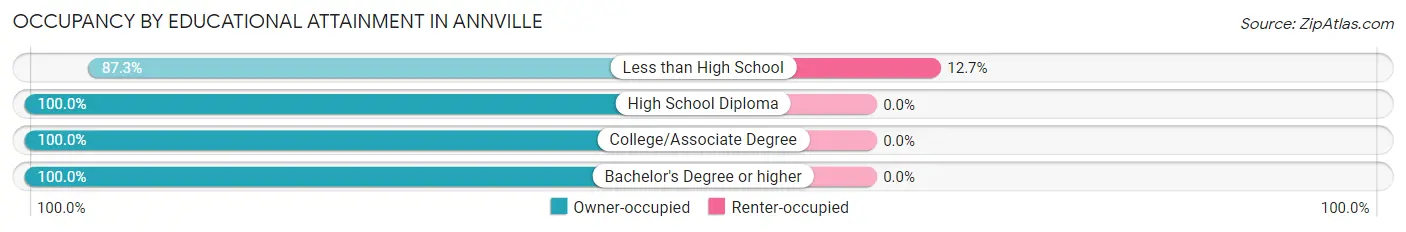
| Household Size | Owner-occupied | Renter-occupied |
| Less than High School | 96 (87.3%) | 14 (12.7%) |
| High School Diploma | 119 (100.0%) | 0 (0.0%) |
| College/Associate Degree | 54 (100.0%) | 0 (0.0%) |
| Bachelor's Degree or higher | 18 (100.0%) | 0 (0.0%) |
Occupancy by Age of Householder in Annville
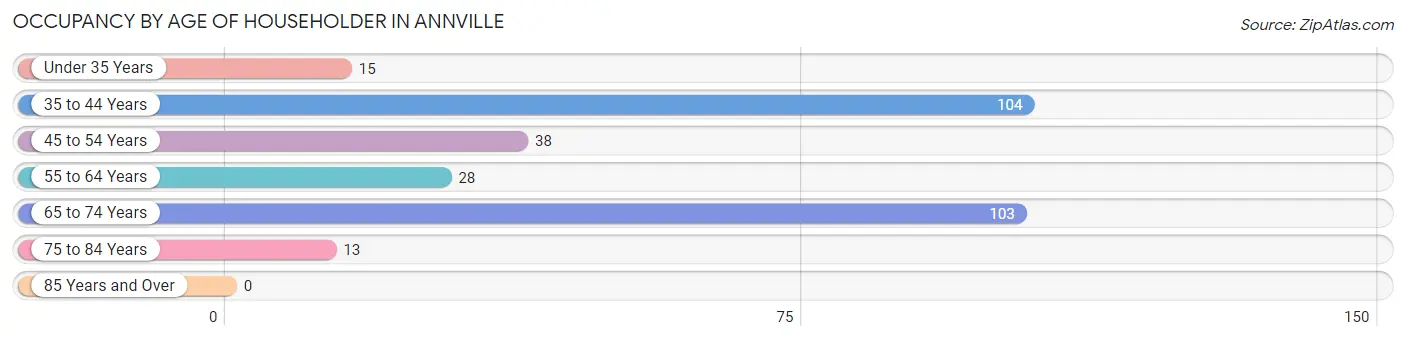
| Age Bracket | # Households | % Households |
| Under 35 Years | 15 | 5.0% |
| 35 to 44 Years | 104 | 34.5% |
| 45 to 54 Years | 38 | 12.6% |
| 55 to 64 Years | 28 | 9.3% |
| 65 to 74 Years | 103 | 34.2% |
| 75 to 84 Years | 13 | 4.3% |
| 85 Years and Over | 0 | 0.0% |
| Total | 301 | 100.0% |
Housing Finances in Annville
Median Income by Occupancy in Annville
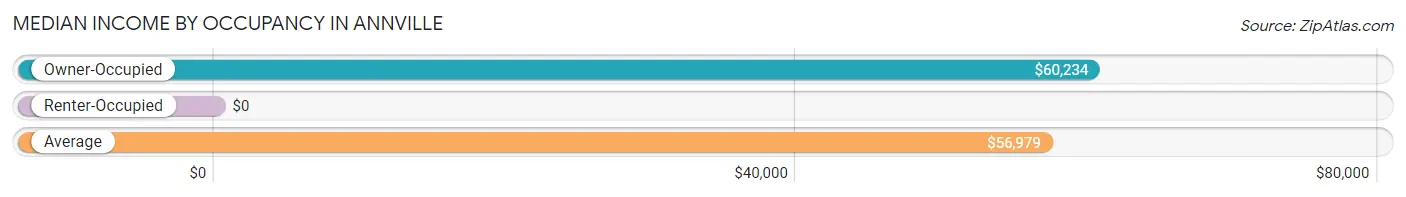
| Occupancy Type | # Households | Median Income |
| Owner-Occupied | 287 (95.4%) | $60,234 |
| Renter-Occupied | 14 (4.6%) | $0 |
| Average | 301 (100.0%) | $56,979 |
Occupancy by Householder Income Bracket in Annville
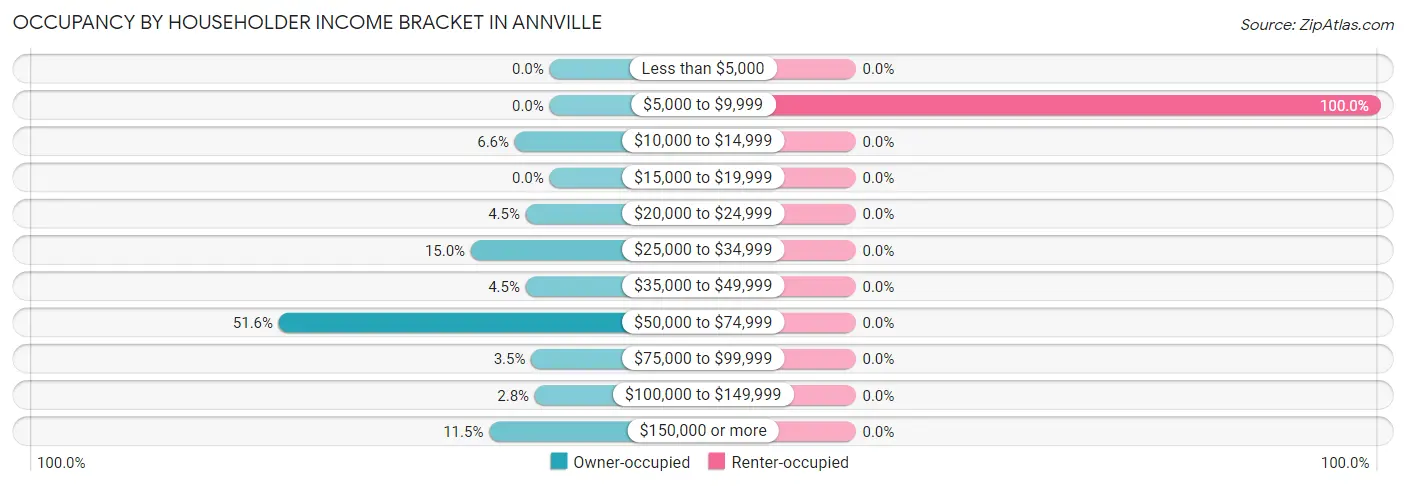
| Income Bracket | Owner-occupied | Renter-occupied |
| Less than $5,000 | 0 (0.0%) | 0 (0.0%) |
| $5,000 to $9,999 | 0 (0.0%) | 14 (100.0%) |
| $10,000 to $14,999 | 19 (6.6%) | 0 (0.0%) |
| $15,000 to $19,999 | 0 (0.0%) | 0 (0.0%) |
| $20,000 to $24,999 | 13 (4.5%) | 0 (0.0%) |
| $25,000 to $34,999 | 43 (15.0%) | 0 (0.0%) |
| $35,000 to $49,999 | 13 (4.5%) | 0 (0.0%) |
| $50,000 to $74,999 | 148 (51.6%) | 0 (0.0%) |
| $75,000 to $99,999 | 10 (3.5%) | 0 (0.0%) |
| $100,000 to $149,999 | 8 (2.8%) | 0 (0.0%) |
| $150,000 or more | 33 (11.5%) | 0 (0.0%) |
| Total | 287 (100.0%) | 14 (100.0%) |
Monthly Housing Cost Tiers in Annville
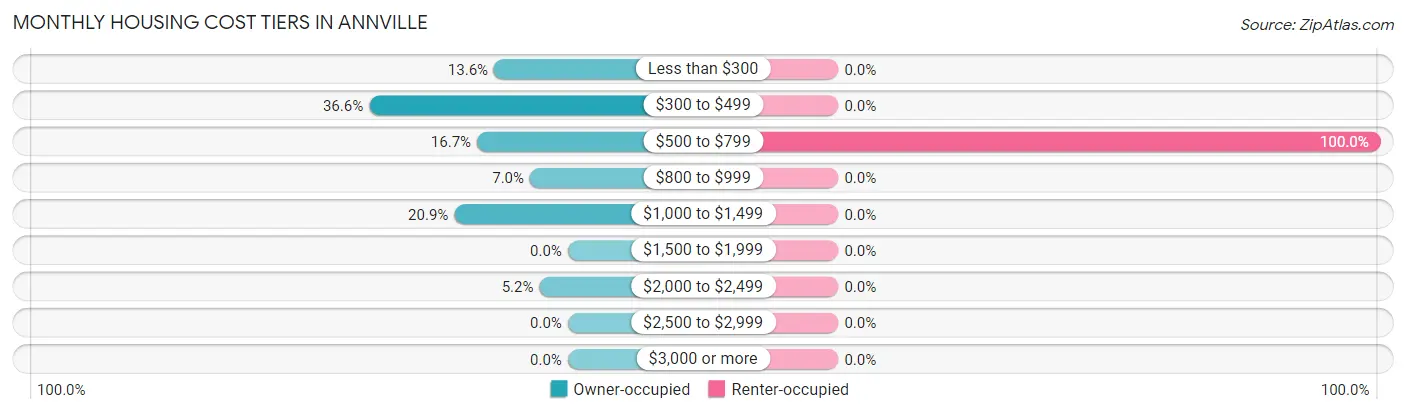
| Monthly Cost | Owner-occupied | Renter-occupied |
| Less than $300 | 39 (13.6%) | 0 (0.0%) |
| $300 to $499 | 105 (36.6%) | 0 (0.0%) |
| $500 to $799 | 48 (16.7%) | 14 (100.0%) |
| $800 to $999 | 20 (7.0%) | 0 (0.0%) |
| $1,000 to $1,499 | 60 (20.9%) | 0 (0.0%) |
| $1,500 to $1,999 | 0 (0.0%) | 0 (0.0%) |
| $2,000 to $2,499 | 15 (5.2%) | 0 (0.0%) |
| $2,500 to $2,999 | 0 (0.0%) | 0 (0.0%) |
| $3,000 or more | 0 (0.0%) | 0 (0.0%) |
| Total | 287 (100.0%) | 14 (100.0%) |
Physical Housing Characteristics in Annville
Housing Structures in Annville
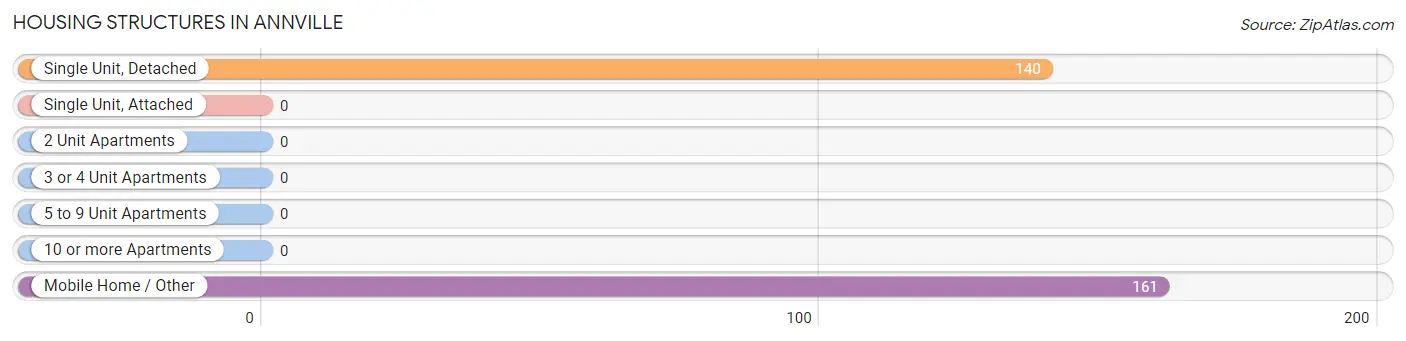
| Structure Type | # Housing Units | % Housing Units |
| Single Unit, Detached | 140 | 46.5% |
| Single Unit, Attached | 0 | 0.0% |
| 2 Unit Apartments | 0 | 0.0% |
| 3 or 4 Unit Apartments | 0 | 0.0% |
| 5 to 9 Unit Apartments | 0 | 0.0% |
| 10 or more Apartments | 0 | 0.0% |
| Mobile Home / Other | 161 | 53.5% |
| Total | 301 | 100.0% |
Housing Structures by Occupancy in Annville
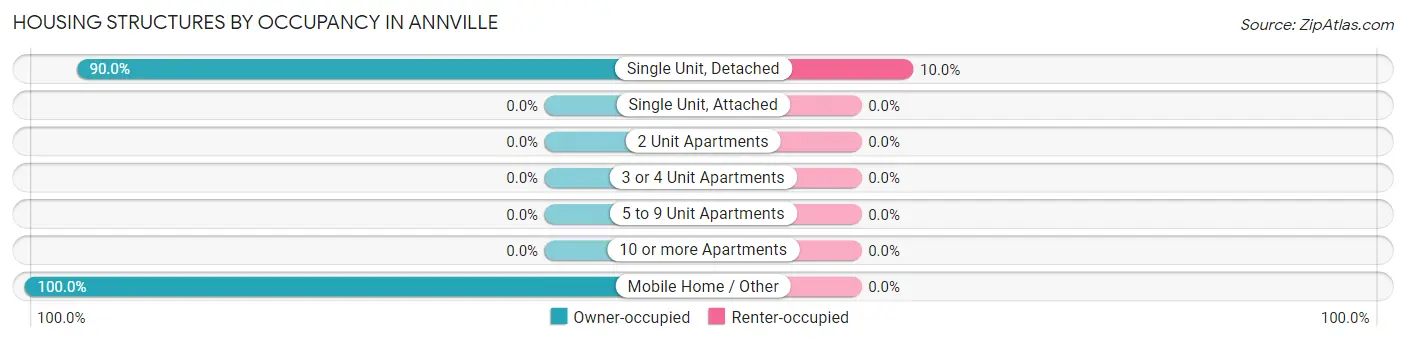
| Structure Type | Owner-occupied | Renter-occupied |
| Single Unit, Detached | 126 (90.0%) | 14 (10.0%) |
| Single Unit, Attached | 0 (0.0%) | 0 (0.0%) |
| 2 Unit Apartments | 0 (0.0%) | 0 (0.0%) |
| 3 or 4 Unit Apartments | 0 (0.0%) | 0 (0.0%) |
| 5 to 9 Unit Apartments | 0 (0.0%) | 0 (0.0%) |
| 10 or more Apartments | 0 (0.0%) | 0 (0.0%) |
| Mobile Home / Other | 161 (100.0%) | 0 (0.0%) |
| Total | 287 (95.4%) | 14 (4.6%) |
Housing Structures by Number of Rooms in Annville
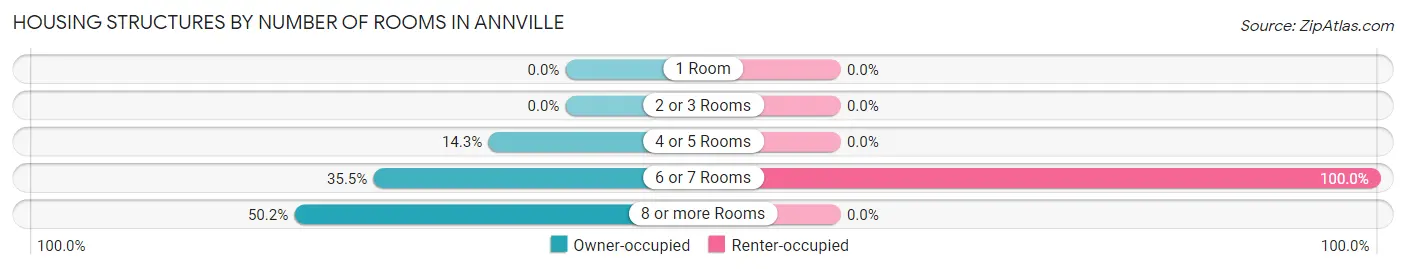
| Number of Rooms | Owner-occupied | Renter-occupied |
| 1 Room | 0 (0.0%) | 0 (0.0%) |
| 2 or 3 Rooms | 0 (0.0%) | 0 (0.0%) |
| 4 or 5 Rooms | 41 (14.3%) | 0 (0.0%) |
| 6 or 7 Rooms | 102 (35.5%) | 14 (100.0%) |
| 8 or more Rooms | 144 (50.2%) | 0 (0.0%) |
| Total | 287 (100.0%) | 14 (100.0%) |
Housing Structure by Heating Type in Annville
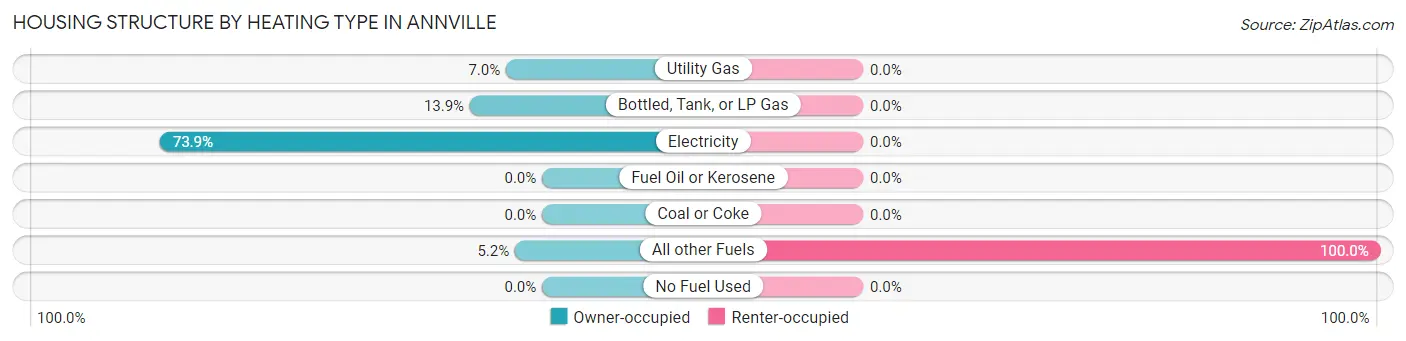
| Heating Type | Owner-occupied | Renter-occupied |
| Utility Gas | 20 (7.0%) | 0 (0.0%) |
| Bottled, Tank, or LP Gas | 40 (13.9%) | 0 (0.0%) |
| Electricity | 212 (73.9%) | 0 (0.0%) |
| Fuel Oil or Kerosene | 0 (0.0%) | 0 (0.0%) |
| Coal or Coke | 0 (0.0%) | 0 (0.0%) |
| All other Fuels | 15 (5.2%) | 14 (100.0%) |
| No Fuel Used | 0 (0.0%) | 0 (0.0%) |
| Total | 287 (100.0%) | 14 (100.0%) |
Household Vehicle Usage in Annville
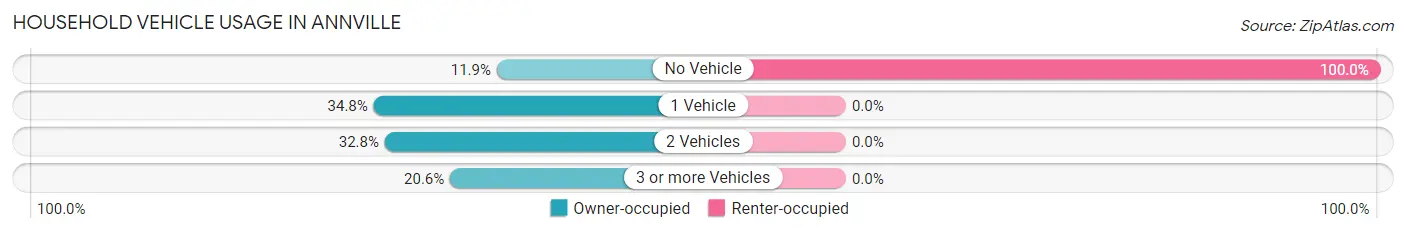
| Vehicles per Household | Owner-occupied | Renter-occupied |
| No Vehicle | 34 (11.8%) | 14 (100.0%) |
| 1 Vehicle | 100 (34.8%) | 0 (0.0%) |
| 2 Vehicles | 94 (32.8%) | 0 (0.0%) |
| 3 or more Vehicles | 59 (20.6%) | 0 (0.0%) |
| Total | 287 (100.0%) | 14 (100.0%) |
Real Estate & Mortgages in Annville
Real Estate and Mortgage Overview in Annville
| Characteristic | Without Mortgage | With Mortgage |
| Housing Units | 153 | 134 |
| Median Property Value | $66,100 | $73,200 |
| Median Household Income | $62,005 | $33 |
| Monthly Housing Costs | $434 | $0 |
| Real Estate Taxes | $199 | $12 |
Property Value by Mortgage Status in Annville
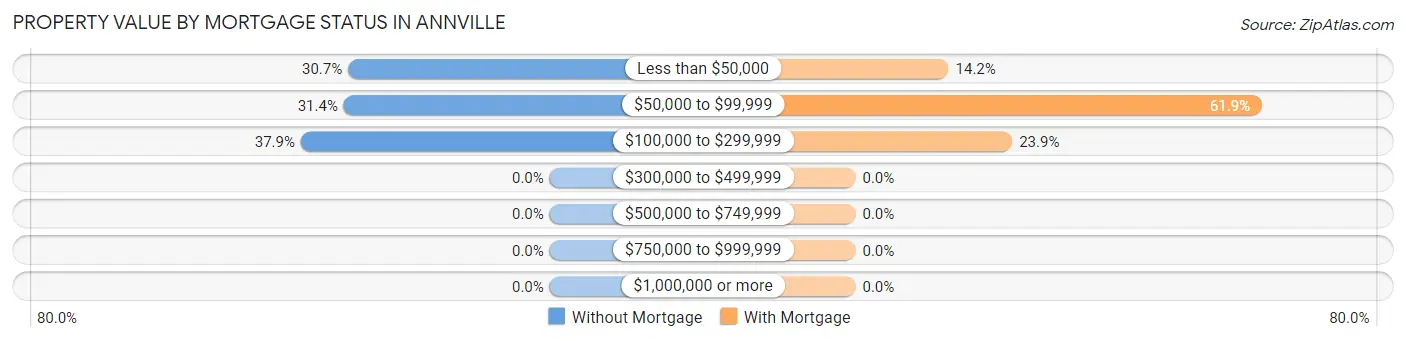
| Property Value | Without Mortgage | With Mortgage |
| Less than $50,000 | 47 (30.7%) | 19 (14.2%) |
| $50,000 to $99,999 | 48 (31.4%) | 83 (61.9%) |
| $100,000 to $299,999 | 58 (37.9%) | 32 (23.9%) |
| $300,000 to $499,999 | 0 (0.0%) | 0 (0.0%) |
| $500,000 to $749,999 | 0 (0.0%) | 0 (0.0%) |
| $750,000 to $999,999 | 0 (0.0%) | 0 (0.0%) |
| $1,000,000 or more | 0 (0.0%) | 0 (0.0%) |
| Total | 153 (100.0%) | 134 (100.0%) |
Household Income by Mortgage Status in Annville
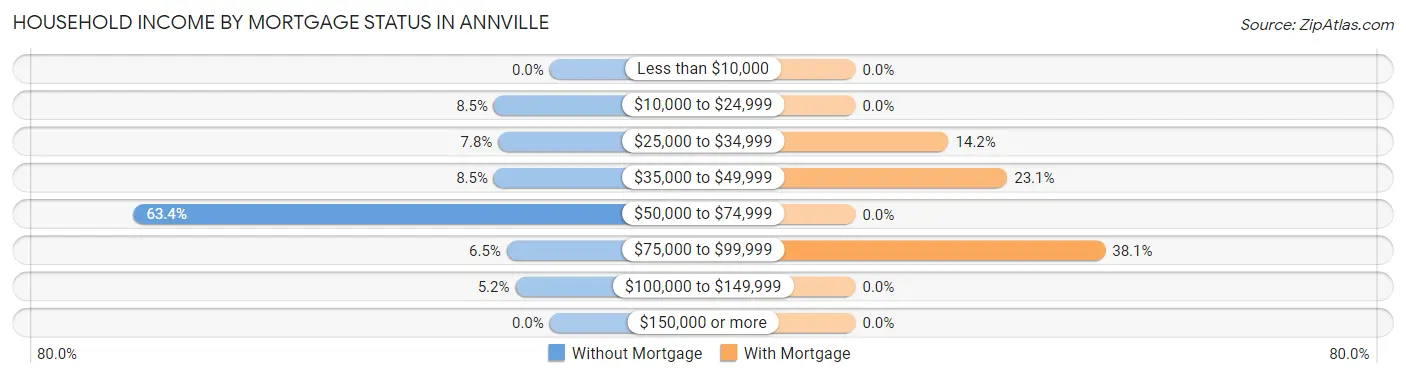
| Household Income | Without Mortgage | With Mortgage |
| Less than $10,000 | 0 (0.0%) | 0 (0.0%) |
| $10,000 to $24,999 | 13 (8.5%) | 0 (0.0%) |
| $25,000 to $34,999 | 12 (7.8%) | 19 (14.2%) |
| $35,000 to $49,999 | 13 (8.5%) | 31 (23.1%) |
| $50,000 to $74,999 | 97 (63.4%) | 0 (0.0%) |
| $75,000 to $99,999 | 10 (6.5%) | 51 (38.1%) |
| $100,000 to $149,999 | 8 (5.2%) | 0 (0.0%) |
| $150,000 or more | 0 (0.0%) | 0 (0.0%) |
| Total | 153 (100.0%) | 134 (100.0%) |
Property Value to Household Income Ratio in Annville
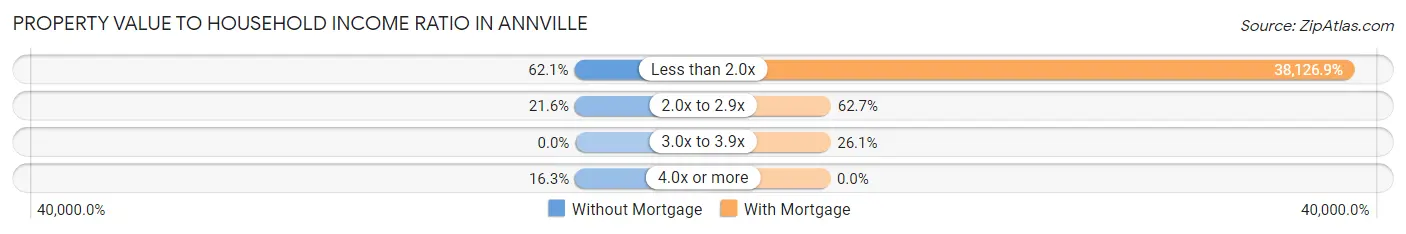
| Value-to-Income Ratio | Without Mortgage | With Mortgage |
| Less than 2.0x | 95 (62.1%) | 51,090 (38,126.9%) |
| 2.0x to 2.9x | 33 (21.6%) | 84 (62.7%) |
| 3.0x to 3.9x | 0 (0.0%) | 35 (26.1%) |
| 4.0x or more | 25 (16.3%) | 0 (0.0%) |
| Total | 153 (100.0%) | 134 (100.0%) |
Real Estate Taxes by Mortgage Status in Annville
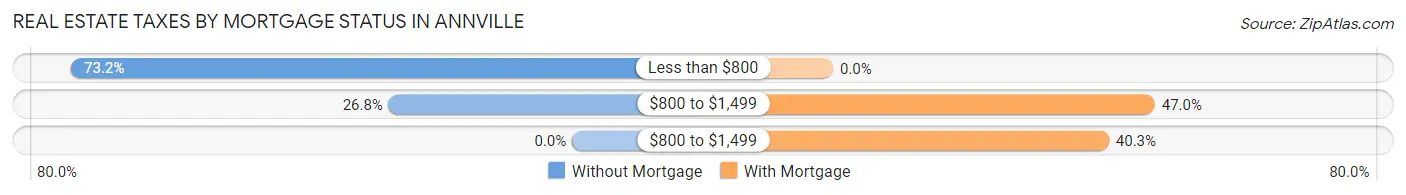
| Property Taxes | Without Mortgage | With Mortgage |
| Less than $800 | 112 (73.2%) | 0 (0.0%) |
| $800 to $1,499 | 41 (26.8%) | 63 (47.0%) |
| $800 to $1,499 | 0 (0.0%) | 54 (40.3%) |
| Total | 153 (100.0%) | 134 (100.0%) |
Health & Disability in Annville
Health Insurance Coverage by Age in Annville
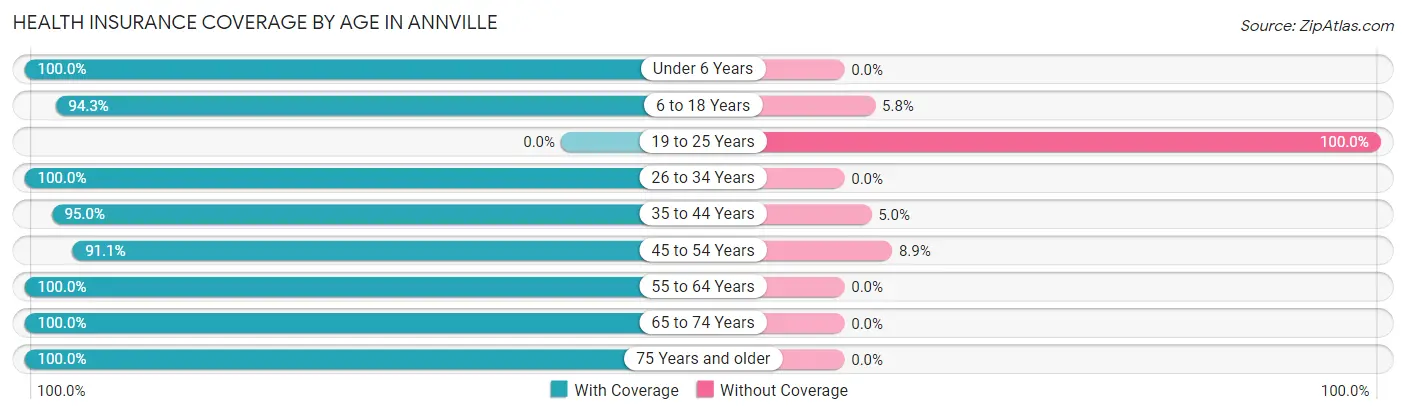
| Age Bracket | With Coverage | Without Coverage |
| Under 6 Years | 82 (100.0%) | 0 (0.0%) |
| 6 to 18 Years | 295 (94.3%) | 18 (5.8%) |
| 19 to 25 Years | 0 (0.0%) | 17 (100.0%) |
| 26 to 34 Years | 111 (100.0%) | 0 (0.0%) |
| 35 to 44 Years | 208 (95.0%) | 11 (5.0%) |
| 45 to 54 Years | 82 (91.1%) | 8 (8.9%) |
| 55 to 64 Years | 28 (100.0%) | 0 (0.0%) |
| 65 to 74 Years | 181 (100.0%) | 0 (0.0%) |
| 75 Years and older | 84 (100.0%) | 0 (0.0%) |
| Total | 1,071 (95.2%) | 54 (4.8%) |
Health Insurance Coverage by Citizenship Status in Annville
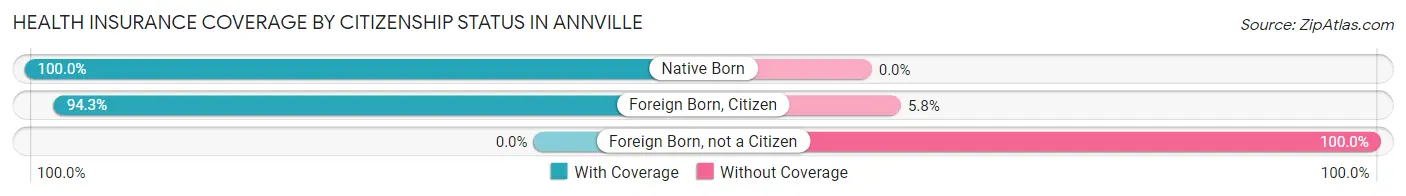
| Citizenship Status | With Coverage | Without Coverage |
| Native Born | 82 (100.0%) | 0 (0.0%) |
| Foreign Born, Citizen | 295 (94.3%) | 18 (5.8%) |
| Foreign Born, not a Citizen | 0 (0.0%) | 17 (100.0%) |
Health Insurance Coverage by Household Income in Annville
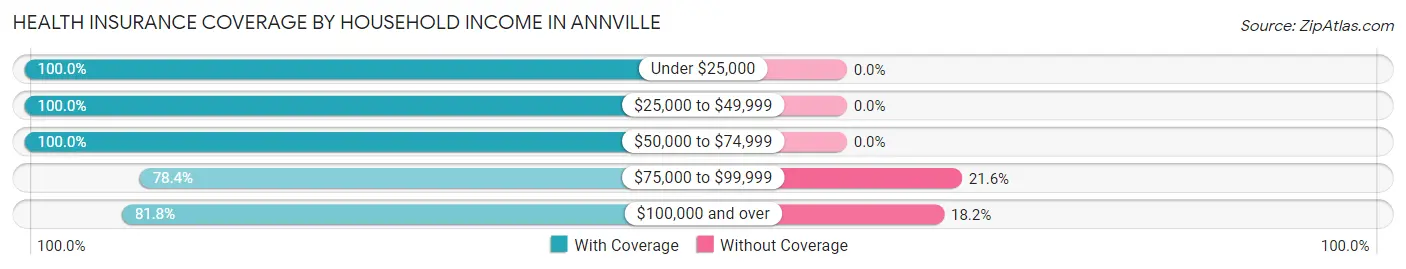
| Household Income | With Coverage | Without Coverage |
| Under $25,000 | 111 (100.0%) | 0 (0.0%) |
| $25,000 to $49,999 | 217 (100.0%) | 0 (0.0%) |
| $50,000 to $74,999 | 490 (100.0%) | 0 (0.0%) |
| $75,000 to $99,999 | 40 (78.4%) | 11 (21.6%) |
| $100,000 and over | 193 (81.8%) | 43 (18.2%) |
Public vs Private Health Insurance Coverage by Age in Annville
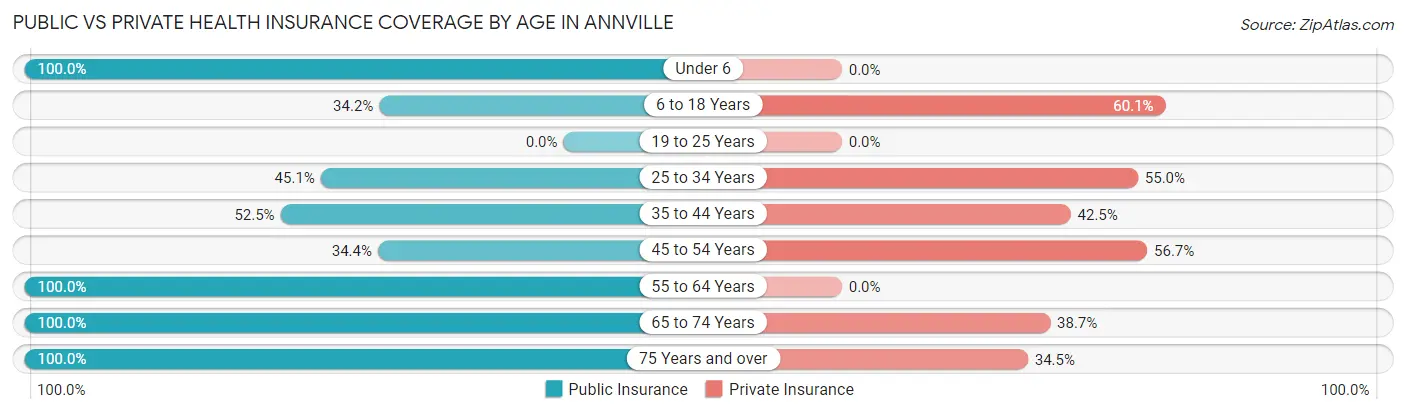
| Age Bracket | Public Insurance | Private Insurance |
| Under 6 | 82 (100.0%) | 0 (0.0%) |
| 6 to 18 Years | 107 (34.2%) | 188 (60.1%) |
| 19 to 25 Years | 0 (0.0%) | 0 (0.0%) |
| 25 to 34 Years | 50 (45.1%) | 61 (54.9%) |
| 35 to 44 Years | 115 (52.5%) | 93 (42.5%) |
| 45 to 54 Years | 31 (34.4%) | 51 (56.7%) |
| 55 to 64 Years | 28 (100.0%) | 0 (0.0%) |
| 65 to 74 Years | 181 (100.0%) | 70 (38.7%) |
| 75 Years and over | 84 (100.0%) | 29 (34.5%) |
| Total | 678 (60.3%) | 492 (43.7%) |
Disability Status by Sex by Age in Annville
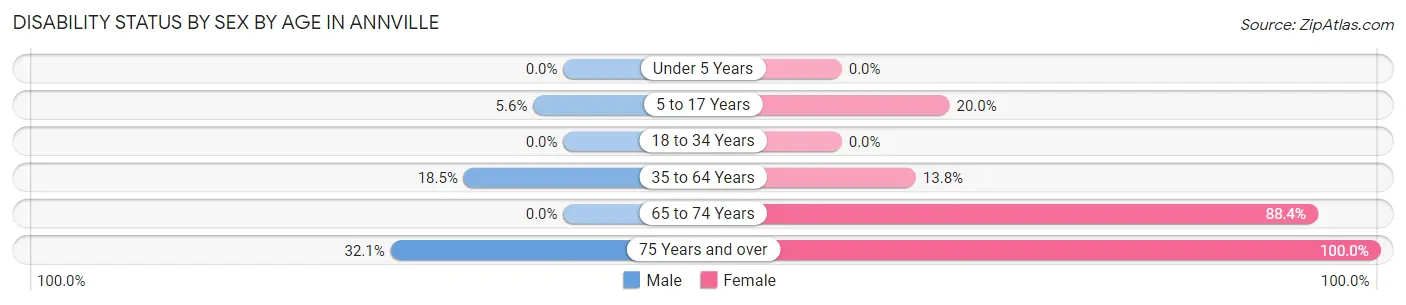
| Age Bracket | Male | Female |
| Under 5 Years | 0 (0.0%) | 0 (0.0%) |
| 5 to 17 Years | 10 (5.6%) | 27 (20.0%) |
| 18 to 34 Years | 0 (0.0%) | 0 (0.0%) |
| 35 to 64 Years | 22 (18.5%) | 30 (13.8%) |
| 65 to 74 Years | 0 (0.0%) | 91 (88.3%) |
| 75 Years and over | 17 (32.1%) | 31 (100.0%) |
Disability Class by Sex by Age in Annville
Disability Class: Hearing Difficulty
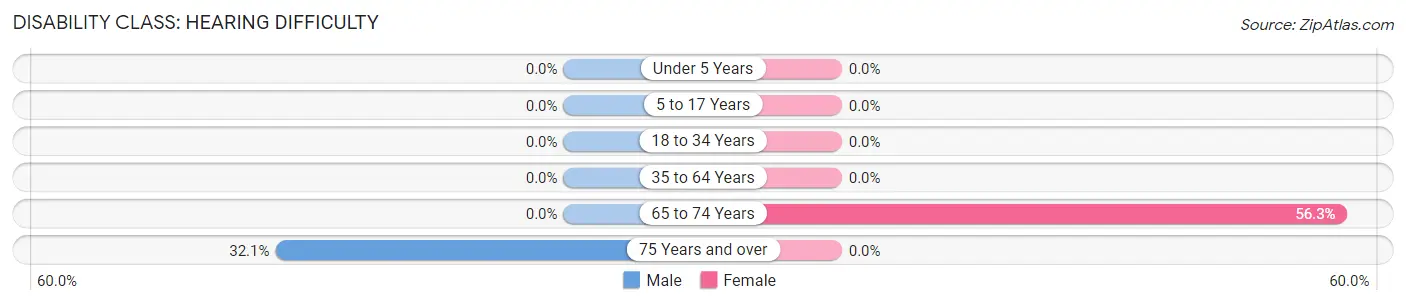
| Age Bracket | Male | Female |
| Under 5 Years | 0 (0.0%) | 0 (0.0%) |
| 5 to 17 Years | 0 (0.0%) | 0 (0.0%) |
| 18 to 34 Years | 0 (0.0%) | 0 (0.0%) |
| 35 to 64 Years | 0 (0.0%) | 0 (0.0%) |
| 65 to 74 Years | 0 (0.0%) | 58 (56.3%) |
| 75 Years and over | 17 (32.1%) | 0 (0.0%) |
Disability Class: Vision Difficulty
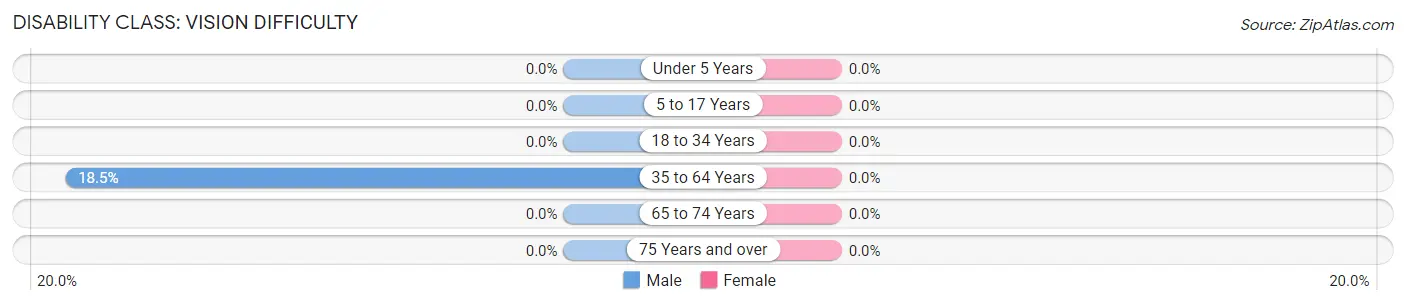
| Age Bracket | Male | Female |
| Under 5 Years | 0 (0.0%) | 0 (0.0%) |
| 5 to 17 Years | 0 (0.0%) | 0 (0.0%) |
| 18 to 34 Years | 0 (0.0%) | 0 (0.0%) |
| 35 to 64 Years | 22 (18.5%) | 0 (0.0%) |
| 65 to 74 Years | 0 (0.0%) | 0 (0.0%) |
| 75 Years and over | 0 (0.0%) | 0 (0.0%) |
Disability Class: Cognitive Difficulty
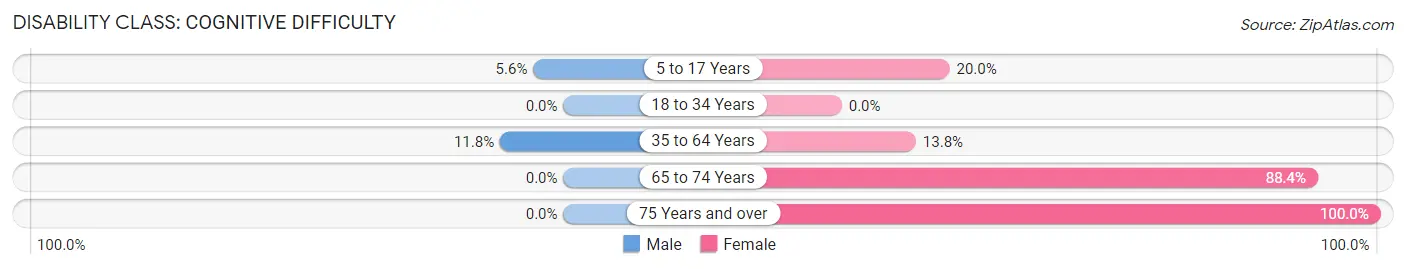
| Age Bracket | Male | Female |
| 5 to 17 Years | 10 (5.6%) | 27 (20.0%) |
| 18 to 34 Years | 0 (0.0%) | 0 (0.0%) |
| 35 to 64 Years | 14 (11.8%) | 30 (13.8%) |
| 65 to 74 Years | 0 (0.0%) | 91 (88.3%) |
| 75 Years and over | 0 (0.0%) | 31 (100.0%) |
Disability Class: Ambulatory Difficulty
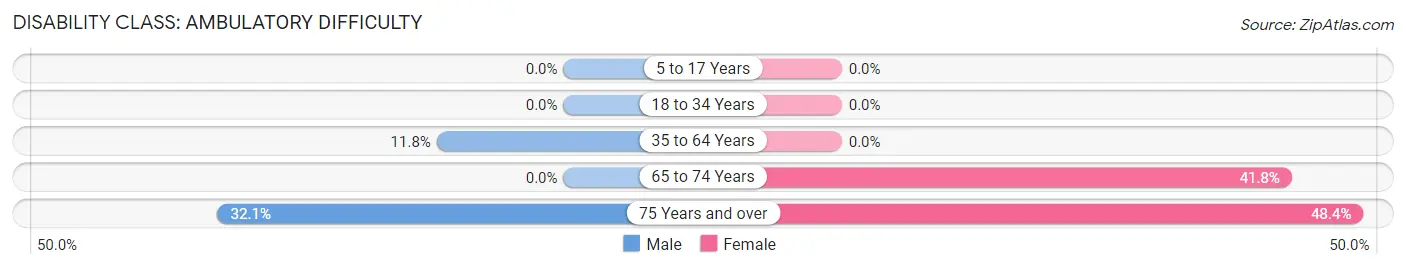
| Age Bracket | Male | Female |
| 5 to 17 Years | 0 (0.0%) | 0 (0.0%) |
| 18 to 34 Years | 0 (0.0%) | 0 (0.0%) |
| 35 to 64 Years | 14 (11.8%) | 0 (0.0%) |
| 65 to 74 Years | 0 (0.0%) | 43 (41.7%) |
| 75 Years and over | 17 (32.1%) | 15 (48.4%) |
Disability Class: Self-Care Difficulty
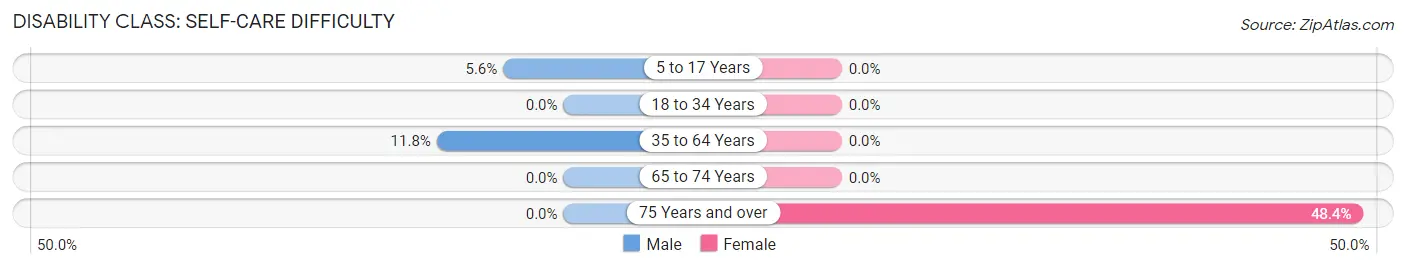
| Age Bracket | Male | Female |
| 5 to 17 Years | 10 (5.6%) | 0 (0.0%) |
| 18 to 34 Years | 0 (0.0%) | 0 (0.0%) |
| 35 to 64 Years | 14 (11.8%) | 0 (0.0%) |
| 65 to 74 Years | 0 (0.0%) | 0 (0.0%) |
| 75 Years and over | 0 (0.0%) | 15 (48.4%) |
Technology Access in Annville
Computing Device Access in Annville
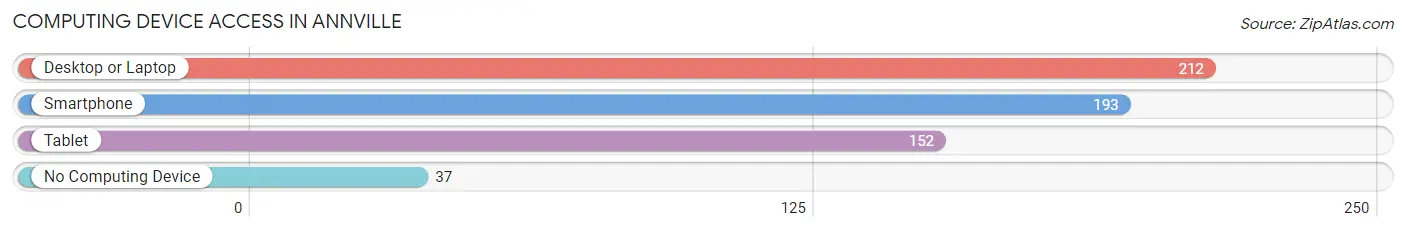
| Device Type | # Households | % Households |
| Desktop or Laptop | 212 | 70.4% |
| Smartphone | 193 | 64.1% |
| Tablet | 152 | 50.5% |
| No Computing Device | 37 | 12.3% |
| Total | 301 | 100.0% |
Internet Access in Annville
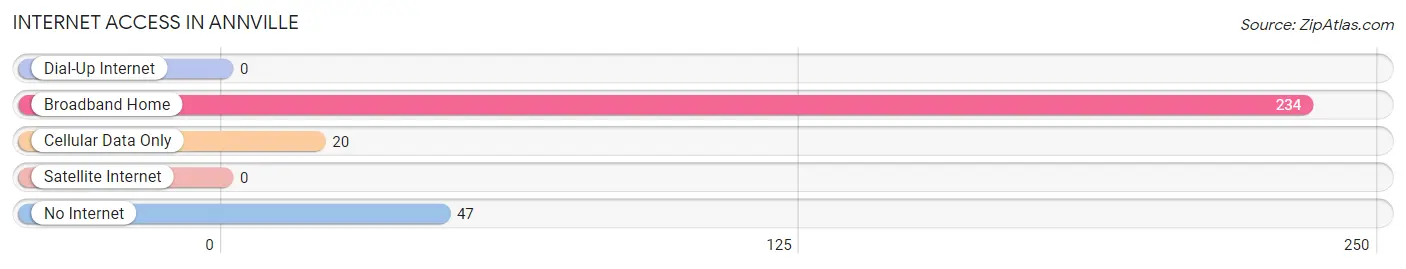
| Internet Type | # Households | % Households |
| Dial-Up Internet | 0 | 0.0% |
| Broadband Home | 234 | 77.7% |
| Cellular Data Only | 20 | 6.6% |
| Satellite Internet | 0 | 0.0% |
| No Internet | 47 | 15.6% |
| Total | 301 | 100.0% |
Annville Summary
Annville, Kentucky is a small town located in Jackson County, Kentucky. It is situated in the foothills of the Appalachian Mountains and is home to a population of just over 1,000 people. The town was founded in 1820 and has a rich history of coal mining, farming, and timber production.
Geography
Annville is located in the Appalachian Mountains of southeastern Kentucky. It is situated in the foothills of the Cumberland Plateau, which is part of the Appalachian Mountains. The town is located in Jackson County, which is bordered by Clay, Laurel, and Rockcastle counties. Annville is located at an elevation of 890 feet above sea level. The town is situated on the banks of the Rockcastle River, which is a tributary of the Cumberland River. The town is surrounded by rolling hills and lush forests.
Economy
Annville’s economy is largely based on agriculture and timber production. The town is home to several small farms, which produce a variety of crops such as corn, soybeans, and hay. The town is also home to several timber companies, which harvest and process timber for use in construction and other industries. In addition to agriculture and timber production, Annville is home to several small businesses, including restaurants, convenience stores, and a few small manufacturing companies.
Demographics
As of the 2010 census, Annville had a population of 1,072 people. The town is predominantly white, with 95.3% of the population identifying as white. The remaining 4.7% of the population is made up of African Americans, Hispanics, and other races. The median household income in Annville is $30,938, which is lower than the state median of $44,811. The median age in Annville is 41.7 years, which is slightly higher than the state median of 38.7 years.
Conclusion
Annville, Kentucky is a small town located in the foothills of the Appalachian Mountains. It is home to a population of just over 1,000 people and has a rich history of coal mining, farming, and timber production. The town’s economy is largely based on agriculture and timber production, and it is home to several small businesses. Annville is predominantly white, with a median household income of $30,938 and a median age of 41.7 years.
Common Questions
What is Per Capita Income in Annville?
Per Capita income in Annville is $19,648.
What is the Median Family Income in Annville?
Median Family Income in Annville is $52,436.
What is the Median Household income in Annville?
Median Household Income in Annville is $56,979.
What is Income or Wage Gap in Annville?
Income or Wage Gap in Annville is 37.3%.
Women in Annville earn 62.7 cents for every dollar earned by a man.
What is Inequality or Gini Index in Annville?
Inequality or Gini Index in Annville is 0.35.
What is the Total Population of Annville?
Total Population of Annville is 1,189.
What is the Total Male Population of Annville?
Total Male Population of Annville is 601.
What is the Total Female Population of Annville?
Total Female Population of Annville is 588.
What is the Ratio of Males per 100 Females in Annville?
There are 102.21 Males per 100 Females in Annville.
What is the Ratio of Females per 100 Males in Annville?
There are 97.84 Females per 100 Males in Annville.
What is the Median Population Age in Annville?
Median Population Age in Annville is 36.4 Years.
What is the Average Family Size in Annville
Average Family Size in Annville is 4.6 People.
What is the Average Household Size in Annville
Average Household Size in Annville is 3.7 People.
How Large is the Labor Force in Annville?
There are 318 People in the Labor Forcein in Annville.
What is the Percentage of People in the Labor Force in Annville?
38.0% of People are in the Labor Force in Annville.