Catlettsburg, KY Map & Demographics
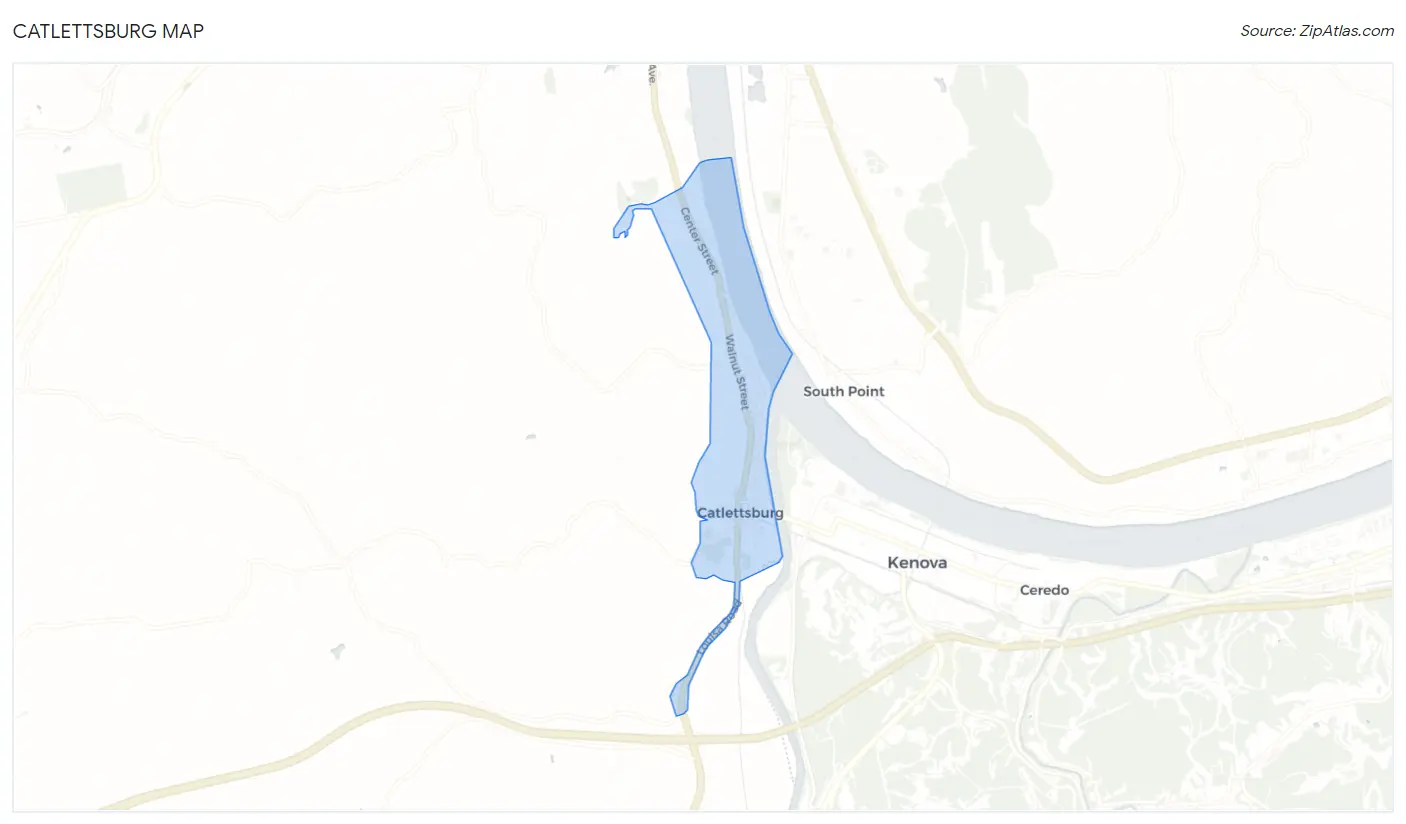
Catlettsburg Map
Catlettsburg Overview
$20,549
PER CAPITA INCOME
$50,037
AVG FAMILY INCOME
$33,047
AVG HOUSEHOLD INCOME
40.3%
WAGE / INCOME GAP [ % ]
59.7¢/ $1
WAGE / INCOME GAP [ $ ]
$10,324
FAMILY INCOME DEFICIT
0.47
INEQUALITY / GINI INDEX
1,782
TOTAL POPULATION
858
MALE POPULATION
924
FEMALE POPULATION
92.86
MALES / 100 FEMALES
107.69
FEMALES / 100 MALES
48.0
MEDIAN AGE
2.8
AVG FAMILY SIZE
2.1
AVG HOUSEHOLD SIZE
485
LABOR FORCE [ PEOPLE ]
31.7%
PERCENT IN LABOR FORCE
10.7%
UNEMPLOYMENT RATE
Catlettsburg Zip Codes
Catlettsburg Area Codes
Income in Catlettsburg
Income Overview in Catlettsburg
Per Capita Income in Catlettsburg is $20,549, while median incomes of families and households are $50,037 and $33,047 respectively.
| Characteristic | Number | Measure |
| Per Capita Income | 1,782 | $20,549 |
| Median Family Income | 356 | $50,037 |
| Mean Family Income | 356 | $52,844 |
| Median Household Income | 741 | $33,047 |
| Mean Household Income | 741 | $45,185 |
| Income Deficit | 356 | $10,324 |
| Wage / Income Gap (%) | 1,782 | 40.27% |
| Wage / Income Gap ($) | 1,782 | 59.73¢ per $1 |
| Gini / Inequality Index | 1,782 | 0.47 |
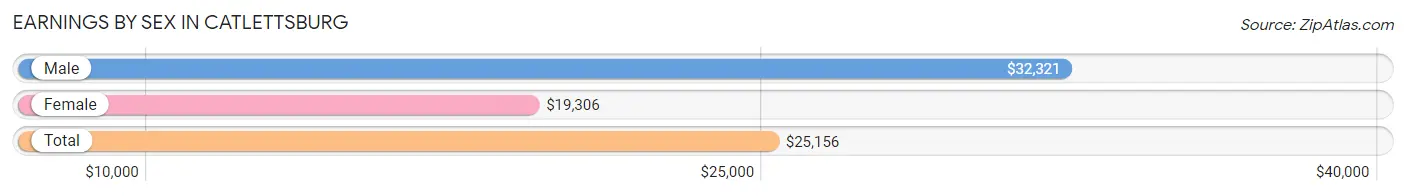
Earnings by Sex in Catlettsburg
Average Earnings in Catlettsburg are $25,156, $32,321 for men and $19,306 for women, a difference of 40.3%.
| Sex | Number | Average Earnings |
| Male | 231 (41.9%) | $32,321 |
| Female | 320 (58.1%) | $19,306 |
| Total | 551 (100.0%) | $25,156 |
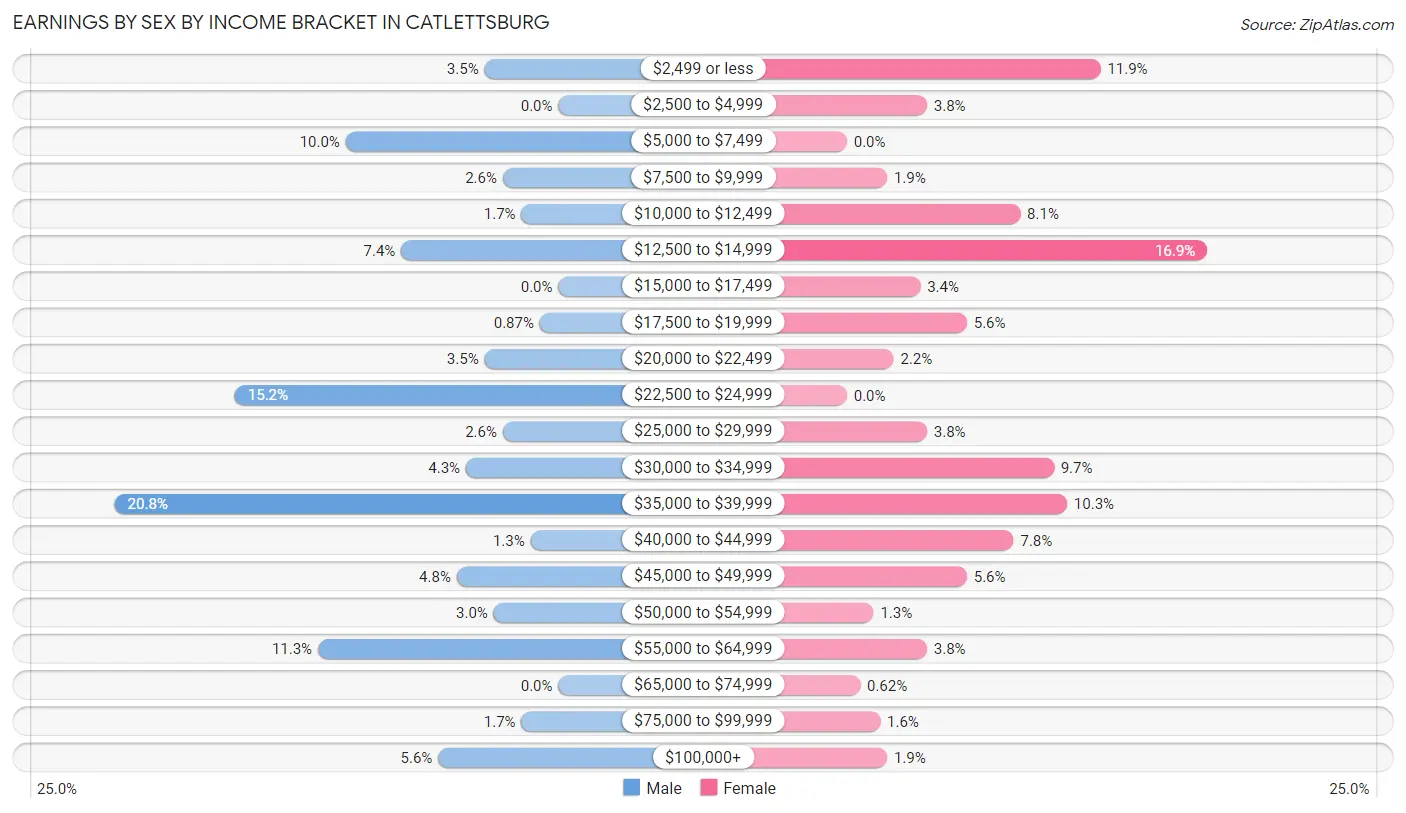
Earnings by Sex by Income Bracket in Catlettsburg
The most common earnings brackets in Catlettsburg are $35,000 to $39,999 for men (48 | 20.8%) and $12,500 to $14,999 for women (54 | 16.9%).
| Income | Male | Female |
| $2,499 or less | 8 (3.5%) | 38 (11.9%) |
| $2,500 to $4,999 | 0 (0.0%) | 12 (3.7%) |
| $5,000 to $7,499 | 23 (10.0%) | 0 (0.0%) |
| $7,500 to $9,999 | 6 (2.6%) | 6 (1.9%) |
| $10,000 to $12,499 | 4 (1.7%) | 26 (8.1%) |
| $12,500 to $14,999 | 17 (7.4%) | 54 (16.9%) |
| $15,000 to $17,499 | 0 (0.0%) | 11 (3.4%) |
| $17,500 to $19,999 | 2 (0.9%) | 18 (5.6%) |
| $20,000 to $22,499 | 8 (3.5%) | 7 (2.2%) |
| $22,500 to $24,999 | 35 (15.1%) | 0 (0.0%) |
| $25,000 to $29,999 | 6 (2.6%) | 12 (3.7%) |
| $30,000 to $34,999 | 10 (4.3%) | 31 (9.7%) |
| $35,000 to $39,999 | 48 (20.8%) | 33 (10.3%) |
| $40,000 to $44,999 | 3 (1.3%) | 25 (7.8%) |
| $45,000 to $49,999 | 11 (4.8%) | 18 (5.6%) |
| $50,000 to $54,999 | 7 (3.0%) | 4 (1.3%) |
| $55,000 to $64,999 | 26 (11.3%) | 12 (3.7%) |
| $65,000 to $74,999 | 0 (0.0%) | 2 (0.6%) |
| $75,000 to $99,999 | 4 (1.7%) | 5 (1.6%) |
| $100,000+ | 13 (5.6%) | 6 (1.9%) |
| Total | 231 (100.0%) | 320 (100.0%) |
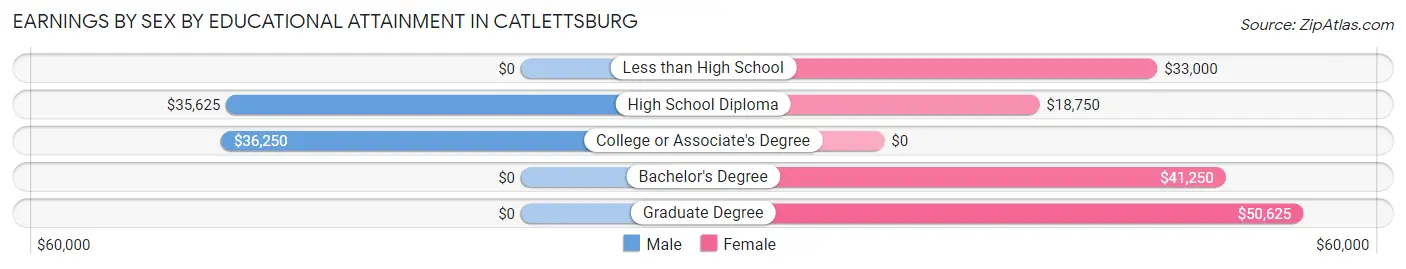
Earnings by Sex by Educational Attainment in Catlettsburg
Average earnings in Catlettsburg are $35,568 for men and $28,056 for women, a difference of 21.1%. Men with an educational attainment of college or associate's degree enjoy the highest average annual earnings of $36,250, while those with high school diploma education earn the least with $35,625. Women with an educational attainment of graduate degree earn the most with the average annual earnings of $50,625, while those with high school diploma education have the smallest earnings of $18,750.
| Educational Attainment | Male Income | Female Income |
| Less than High School | - | - |
| High School Diploma | $35,625 | $18,750 |
| College or Associate's Degree | $36,250 | $0 |
| Bachelor's Degree | - | - |
| Graduate Degree | - | - |
| Total | $35,568 | $28,056 |
Family Income in Catlettsburg
Family Income Brackets in Catlettsburg
According to the Catlettsburg family income data, there are 112 families falling into the $50,000 to $74,999 income range, which is the most common income bracket and makes up 31.5% of all families. Conversely, the $150,000 to $199,999 income bracket is the least frequent group with only 3 families (0.8%) belonging to this category.
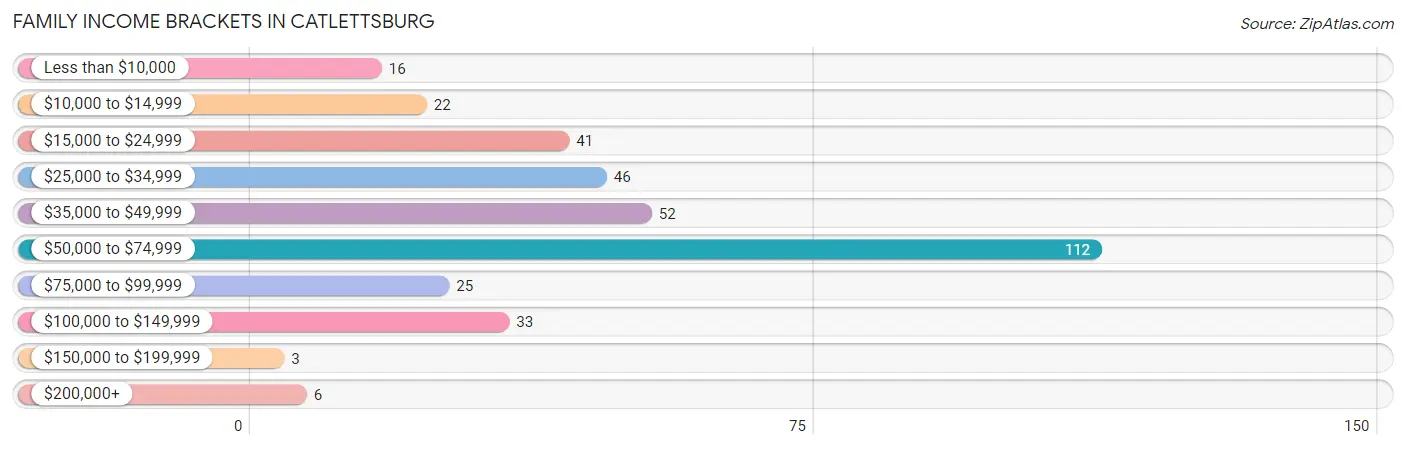
| Income Bracket | # Families | % Families |
| Less than $10,000 | 16 | 4.5% |
| $10,000 to $14,999 | 22 | 6.2% |
| $15,000 to $24,999 | 41 | 11.5% |
| $25,000 to $34,999 | 46 | 12.9% |
| $35,000 to $49,999 | 52 | 14.6% |
| $50,000 to $74,999 | 112 | 31.5% |
| $75,000 to $99,999 | 25 | 7.0% |
| $100,000 to $149,999 | 33 | 9.3% |
| $150,000 to $199,999 | 3 | 0.8% |
| $200,000+ | 6 | 1.7% |
Family Income by Famaliy Size in Catlettsburg
3-person families (39 | 11.0%) account for the highest median family income in Catlettsburg with $56,875 per family, while 2-person families (262 | 73.6%) have the highest median income of $24,688 per family member.
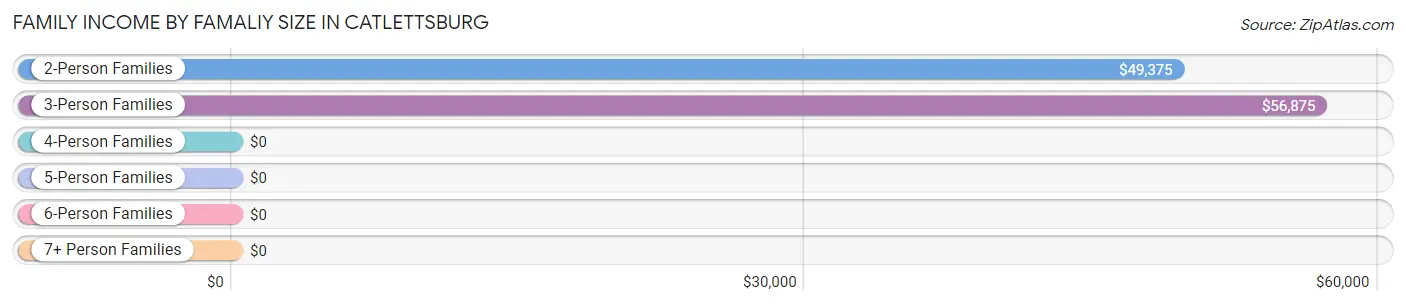
| Income Bracket | # Families | Median Income |
| 2-Person Families | 262 (73.6%) | $49,375 |
| 3-Person Families | 39 (11.0%) | $56,875 |
| 4-Person Families | 30 (8.4%) | $0 |
| 5-Person Families | 16 (4.5%) | $0 |
| 6-Person Families | 2 (0.6%) | $0 |
| 7+ Person Families | 7 (2.0%) | $0 |
| Total | 356 (100.0%) | $50,037 |
Family Income by Number of Earners in Catlettsburg
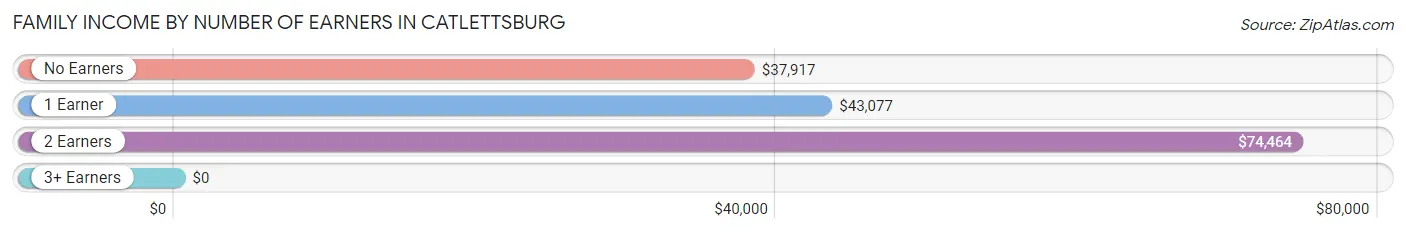
| Number of Earners | # Families | Median Income |
| No Earners | 159 (44.7%) | $37,917 |
| 1 Earner | 120 (33.7%) | $43,077 |
| 2 Earners | 71 (19.9%) | $74,464 |
| 3+ Earners | 6 (1.7%) | $0 |
| Total | 356 (100.0%) | $50,037 |
Household Income in Catlettsburg
Household Income Brackets in Catlettsburg
With 145 households falling in the category, the $50,000 to $74,999 income range is the most frequent in Catlettsburg, accounting for 19.6% of all households. In contrast, only 3 households (0.4%) fall into the $150,000 to $199,999 income bracket, making it the least populous group.
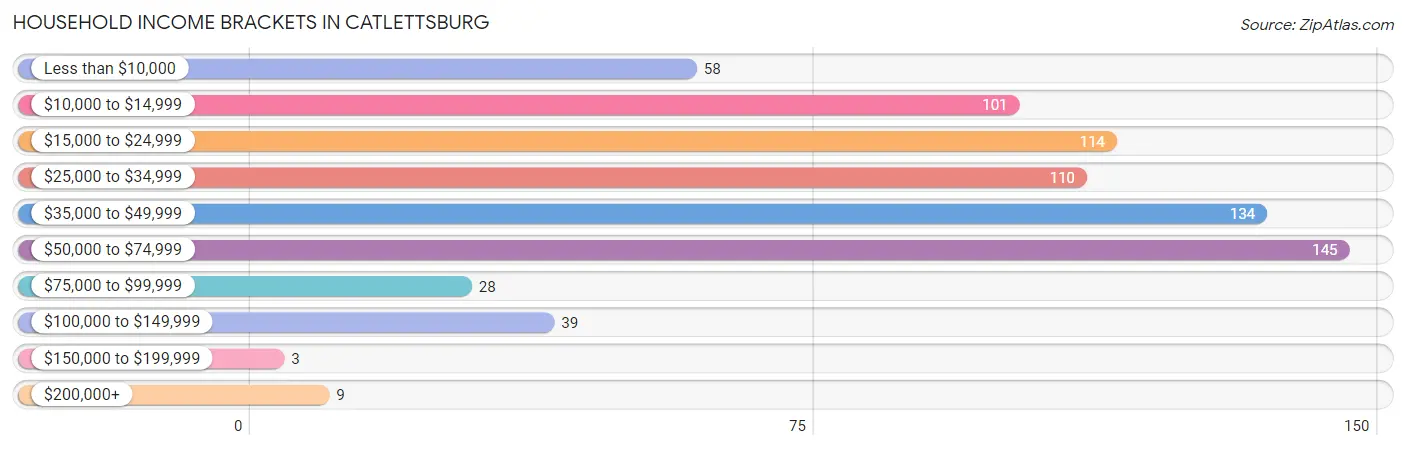
| Income Bracket | # Households | % Households |
| Less than $10,000 | 58 | 7.8% |
| $10,000 to $14,999 | 101 | 13.6% |
| $15,000 to $24,999 | 114 | 15.4% |
| $25,000 to $34,999 | 110 | 14.8% |
| $35,000 to $49,999 | 134 | 18.1% |
| $50,000 to $74,999 | 145 | 19.6% |
| $75,000 to $99,999 | 28 | 3.8% |
| $100,000 to $149,999 | 39 | 5.3% |
| $150,000 to $199,999 | 3 | 0.4% |
| $200,000+ | 9 | 1.2% |
Household Income by Householder Age in Catlettsburg
The median household income in Catlettsburg is $33,047, with the highest median household income of $44,167 found in the 45 to 64 years age bracket for the primary householder. A total of 180 households (24.3%) fall into this category. Meanwhile, the 15 to 24 years age bracket for the primary householder has the lowest median household income of $0, with 20 households (2.7%) in this group.
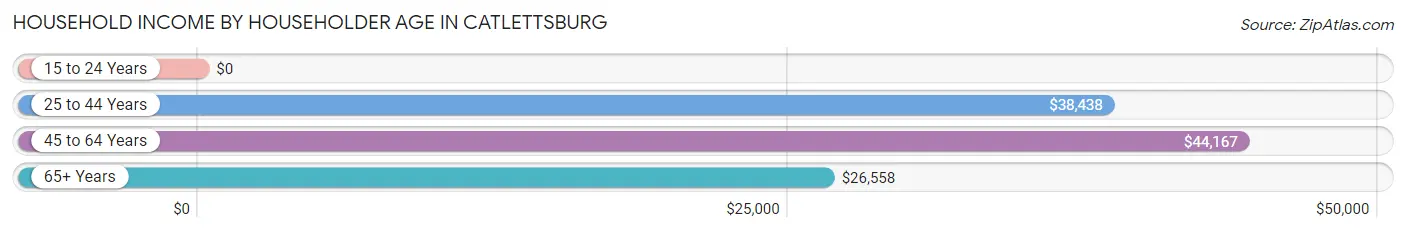
| Income Bracket | # Households | Median Income |
| 15 to 24 Years | 20 (2.7%) | $0 |
| 25 to 44 Years | 156 (21.0%) | $38,438 |
| 45 to 64 Years | 180 (24.3%) | $44,167 |
| 65+ Years | 385 (52.0%) | $26,558 |
| Total | 741 (100.0%) | $33,047 |
Poverty in Catlettsburg
Income Below Poverty by Sex and Age in Catlettsburg
With 28.1% poverty level for males and 29.9% for females among the residents of Catlettsburg, 5 year old males and 18 to 24 year old females are the most vulnerable to poverty, with 12 males (100.0%) and 29 females (59.2%) in their respective age groups living below the poverty level.
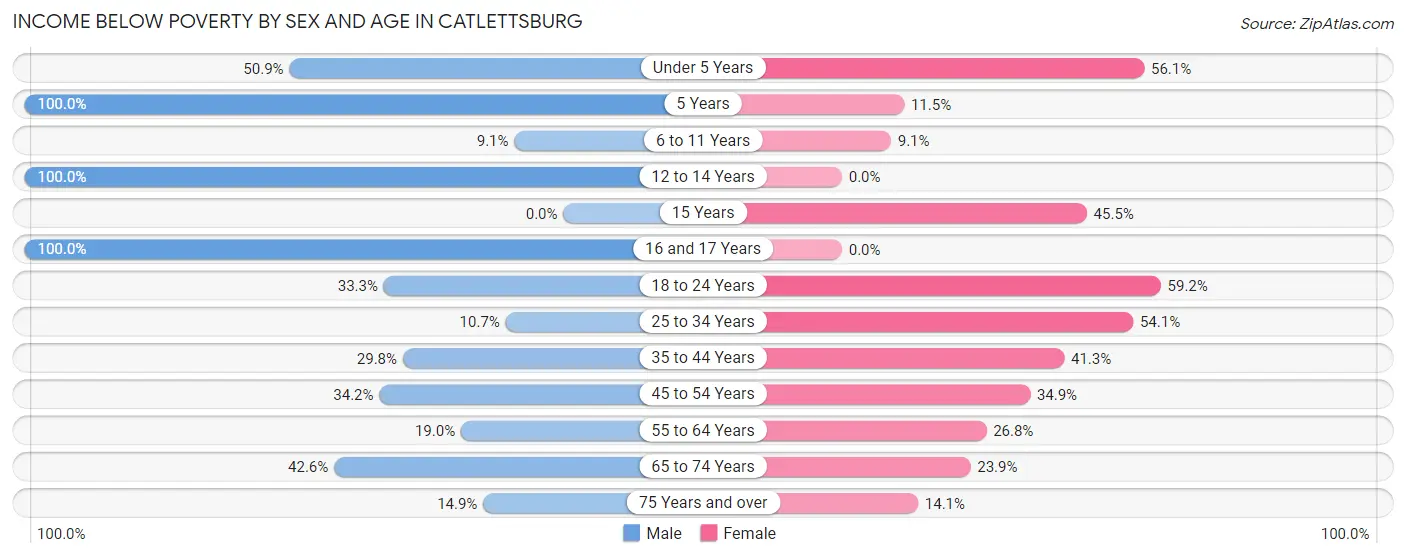
| Age Bracket | Male | Female |
| Under 5 Years | 30 (50.8%) | 23 (56.1%) |
| 5 Years | 12 (100.0%) | 3 (11.5%) |
| 6 to 11 Years | 6 (9.1%) | 2 (9.1%) |
| 12 to 14 Years | 2 (100.0%) | 0 (0.0%) |
| 15 Years | 0 (0.0%) | 5 (45.5%) |
| 16 and 17 Years | 13 (100.0%) | 0 (0.0%) |
| 18 to 24 Years | 24 (33.3%) | 29 (59.2%) |
| 25 to 34 Years | 6 (10.7%) | 40 (54.0%) |
| 35 to 44 Years | 28 (29.8%) | 33 (41.2%) |
| 45 to 54 Years | 14 (34.2%) | 22 (34.9%) |
| 55 to 64 Years | 19 (19.0%) | 26 (26.8%) |
| 65 to 74 Years | 20 (42.5%) | 52 (23.8%) |
| 75 Years and over | 18 (14.9%) | 25 (14.1%) |
| Total | 192 (28.1%) | 260 (29.9%) |
Income Above Poverty by Sex and Age in Catlettsburg
According to the poverty statistics in Catlettsburg, males aged 6 to 11 years and females aged 16 and 17 years are the age groups that are most secure financially, with 90.9% of males and 100.0% of females in these age groups living above the poverty line.
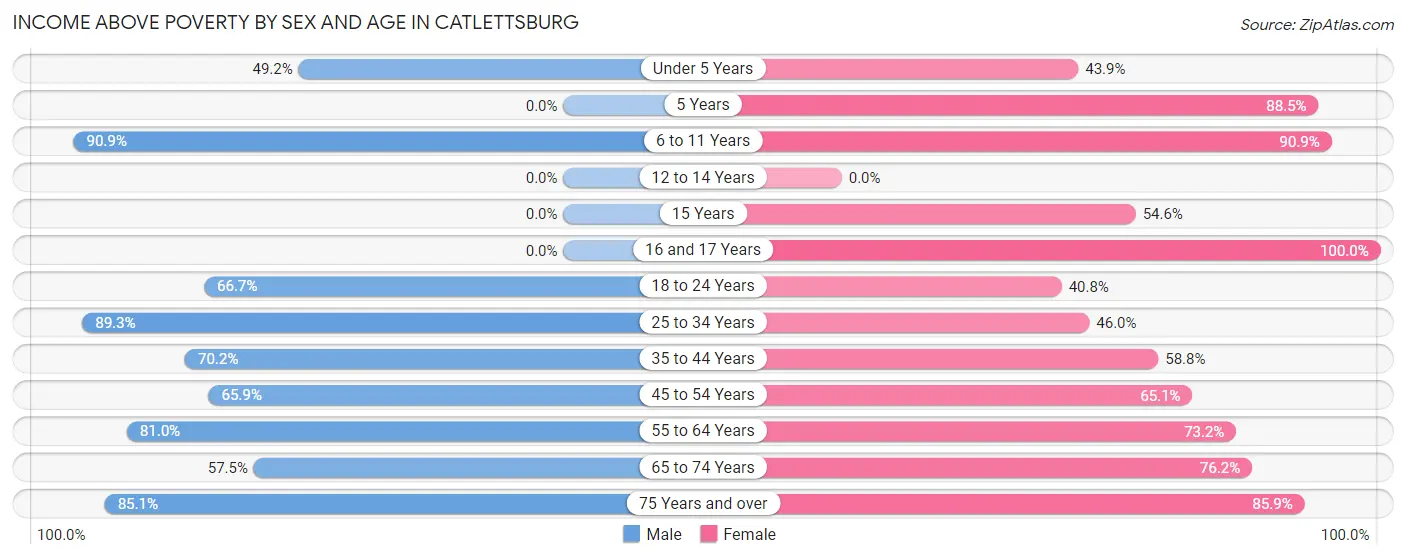
| Age Bracket | Male | Female |
| Under 5 Years | 29 (49.1%) | 18 (43.9%) |
| 5 Years | 0 (0.0%) | 23 (88.5%) |
| 6 to 11 Years | 60 (90.9%) | 20 (90.9%) |
| 12 to 14 Years | 0 (0.0%) | 0 (0.0%) |
| 15 Years | 0 (0.0%) | 6 (54.5%) |
| 16 and 17 Years | 0 (0.0%) | 12 (100.0%) |
| 18 to 24 Years | 48 (66.7%) | 20 (40.8%) |
| 25 to 34 Years | 50 (89.3%) | 34 (46.0%) |
| 35 to 44 Years | 66 (70.2%) | 47 (58.8%) |
| 45 to 54 Years | 27 (65.8%) | 41 (65.1%) |
| 55 to 64 Years | 81 (81.0%) | 71 (73.2%) |
| 65 to 74 Years | 27 (57.5%) | 166 (76.1%) |
| 75 Years and over | 103 (85.1%) | 152 (85.9%) |
| Total | 491 (71.9%) | 610 (70.1%) |
Income Below Poverty Among Married-Couple Families in Catlettsburg
The poverty statistics for married-couple families in Catlettsburg show that 9.4% or 20 of the total 213 families live below the poverty line. Families with 3 or 4 children have the highest poverty rate of 53.3%, comprising of 8 families. On the other hand, families with 1 or 2 children have the lowest poverty rate of 0.0%, which includes 0 families.
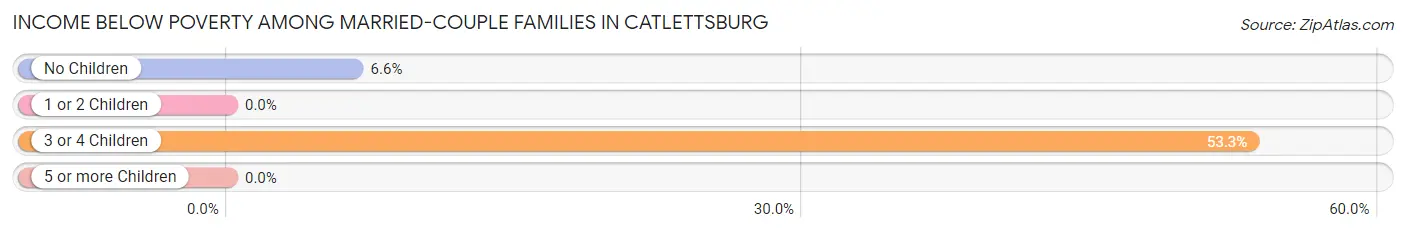
| Children | Above Poverty | Below Poverty |
| No Children | 171 (93.4%) | 12 (6.6%) |
| 1 or 2 Children | 15 (100.0%) | 0 (0.0%) |
| 3 or 4 Children | 7 (46.7%) | 8 (53.3%) |
| 5 or more Children | 0 (0.0%) | 0 (0.0%) |
| Total | 193 (90.6%) | 20 (9.4%) |
Income Below Poverty Among Single-Parent Households in Catlettsburg
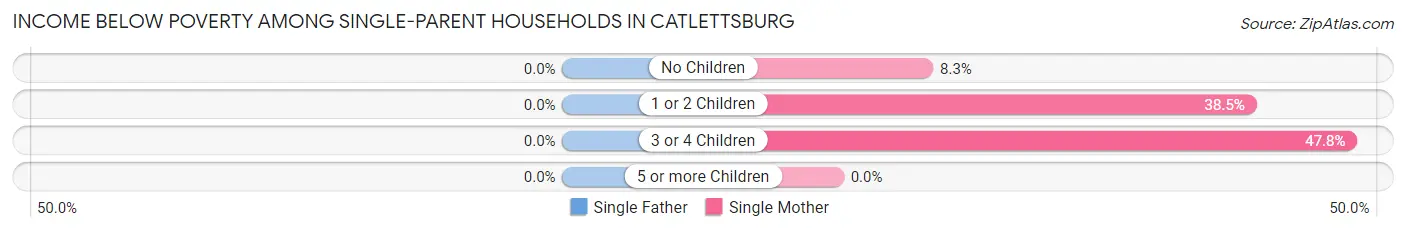
| Children | Single Father | Single Mother |
| No Children | 0 (0.0%) | 3 (8.3%) |
| 1 or 2 Children | 0 (0.0%) | 20 (38.5%) |
| 3 or 4 Children | 0 (0.0%) | 11 (47.8%) |
| 5 or more Children | 0 (0.0%) | 0 (0.0%) |
| Total | 0 (0.0%) | 34 (30.6%) |
Income Below Poverty Among Married-Couple vs Single-Parent Households in Catlettsburg
The poverty data for Catlettsburg shows that 20 of the married-couple family households (9.4%) and 34 of the single-parent households (23.8%) are living below the poverty level. Within the married-couple family households, those with 3 or 4 children have the highest poverty rate, with 8 households (53.3%) falling below the poverty line. Among the single-parent households, those with 3 or 4 children have the highest poverty rate, with 11 household (47.8%) living below poverty.
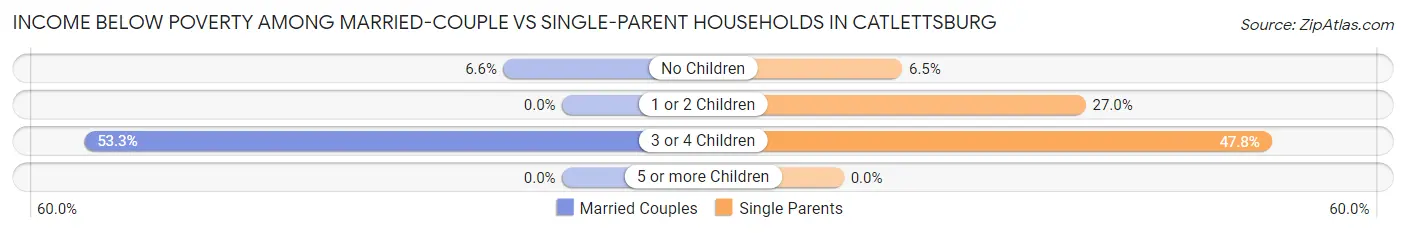
| Children | Married-Couple Families | Single-Parent Households |
| No Children | 12 (6.6%) | 3 (6.5%) |
| 1 or 2 Children | 0 (0.0%) | 20 (27.0%) |
| 3 or 4 Children | 8 (53.3%) | 11 (47.8%) |
| 5 or more Children | 0 (0.0%) | 0 (0.0%) |
| Total | 20 (9.4%) | 34 (23.8%) |
Race in Catlettsburg
The most populous races in Catlettsburg are White / Caucasian (1,600 | 89.8%), Black / African American (85 | 4.8%), and Two or more Races (75 | 4.2%).
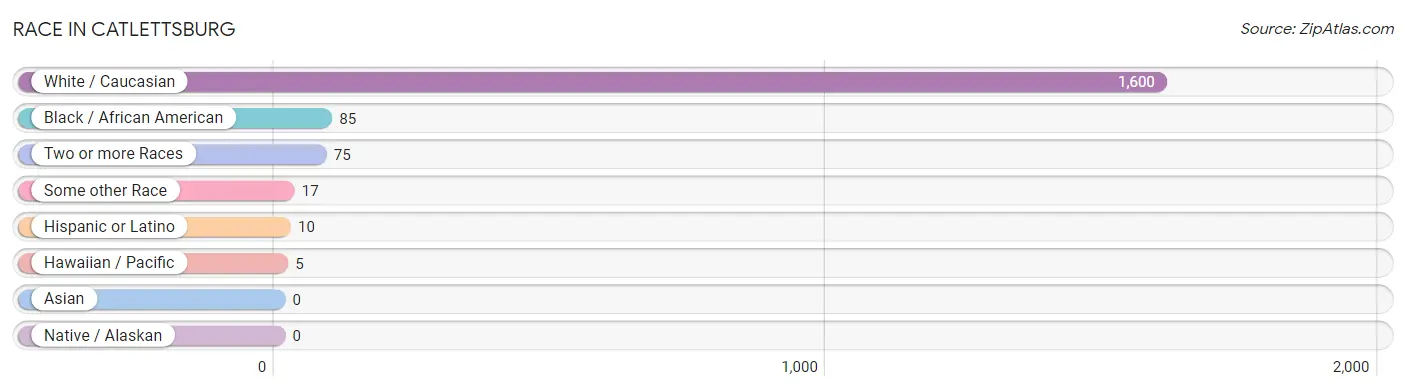
| Race | # Population | % Population |
| Asian | 0 | 0.0% |
| Black / African American | 85 | 4.8% |
| Hawaiian / Pacific | 5 | 0.3% |
| Hispanic or Latino | 10 | 0.6% |
| Native / Alaskan | 0 | 0.0% |
| White / Caucasian | 1,600 | 89.8% |
| Two or more Races | 75 | 4.2% |
| Some other Race | 17 | 0.9% |
| Total | 1,782 | 100.0% |
Ancestry in Catlettsburg
The most populous ancestries reported in Catlettsburg are American (369 | 20.7%), English (211 | 11.8%), German (127 | 7.1%), Irish (97 | 5.4%), and Scottish (72 | 4.0%), together accounting for 49.2% of all Catlettsburg residents.
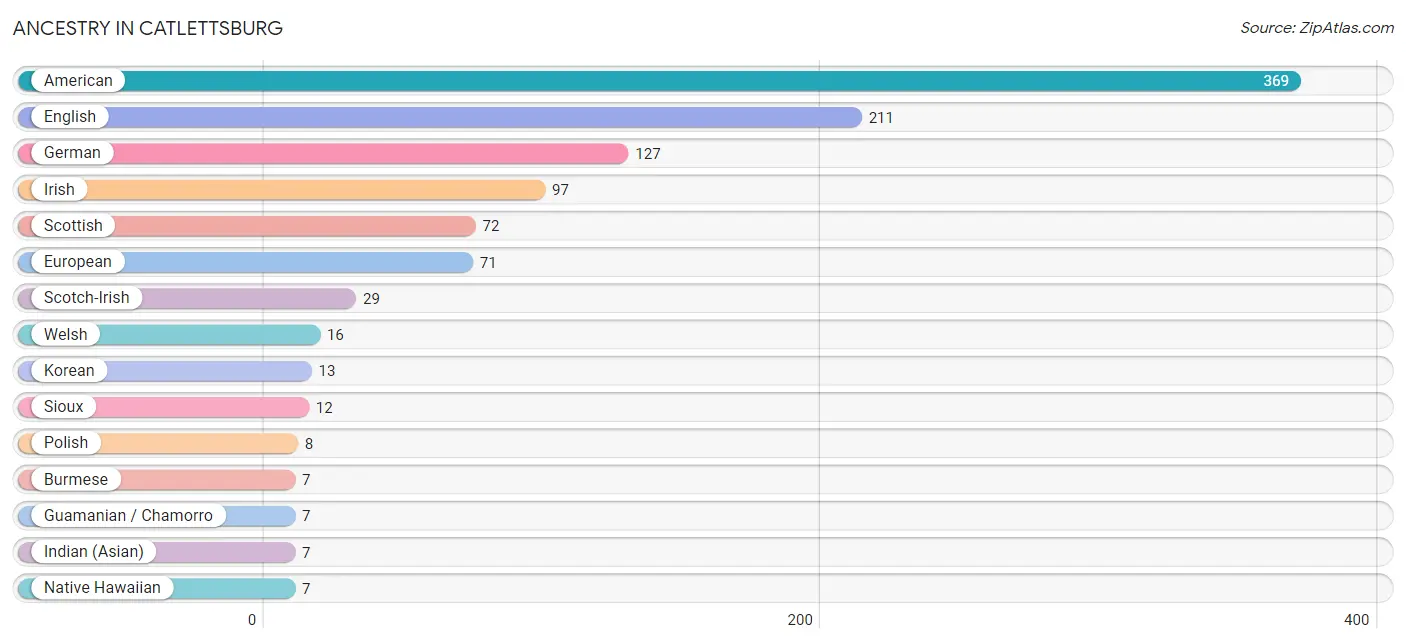
| Ancestry | # Population | % Population |
| African | 4 | 0.2% |
| American | 369 | 20.7% |
| Arab | 5 | 0.3% |
| British | 4 | 0.2% |
| Burmese | 7 | 0.4% |
| Dutch | 5 | 0.3% |
| English | 211 | 11.8% |
| European | 71 | 4.0% |
| French | 3 | 0.2% |
| German | 127 | 7.1% |
| Guamanian / Chamorro | 7 | 0.4% |
| Indian (Asian) | 7 | 0.4% |
| Irish | 97 | 5.4% |
| Italian | 3 | 0.2% |
| Korean | 13 | 0.7% |
| Mexican | 5 | 0.3% |
| Moroccan | 5 | 0.3% |
| Native Hawaiian | 7 | 0.4% |
| Polish | 8 | 0.4% |
| Samoan | 7 | 0.4% |
| Scotch-Irish | 29 | 1.6% |
| Scottish | 72 | 4.0% |
| Sioux | 12 | 0.7% |
| Sri Lankan | 7 | 0.4% |
| Subsaharan African | 4 | 0.2% |
| Thai | 7 | 0.4% |
| Welsh | 16 | 0.9% | View All 27 Rows |
Immigrants in Catlettsburg
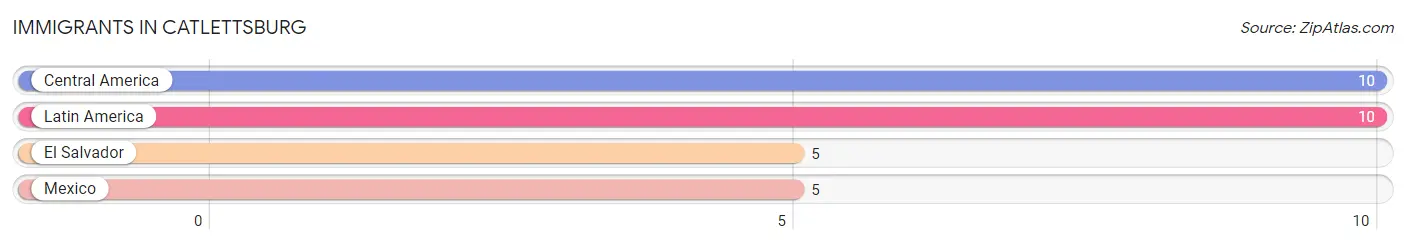
The most numerous immigrant groups reported in Catlettsburg came from Central America (10 | 0.6%), Latin America (10 | 0.6%), El Salvador (5 | 0.3%), and Mexico (5 | 0.3%), together accounting for 1.7% of all Catlettsburg residents.
| Immigration Origin | # Population | % Population |
| Central America | 10 | 0.6% |
| El Salvador | 5 | 0.3% |
| Latin America | 10 | 0.6% |
| Mexico | 5 | 0.3% | View All 4 Rows |
Sex and Age in Catlettsburg
Sex and Age in Catlettsburg
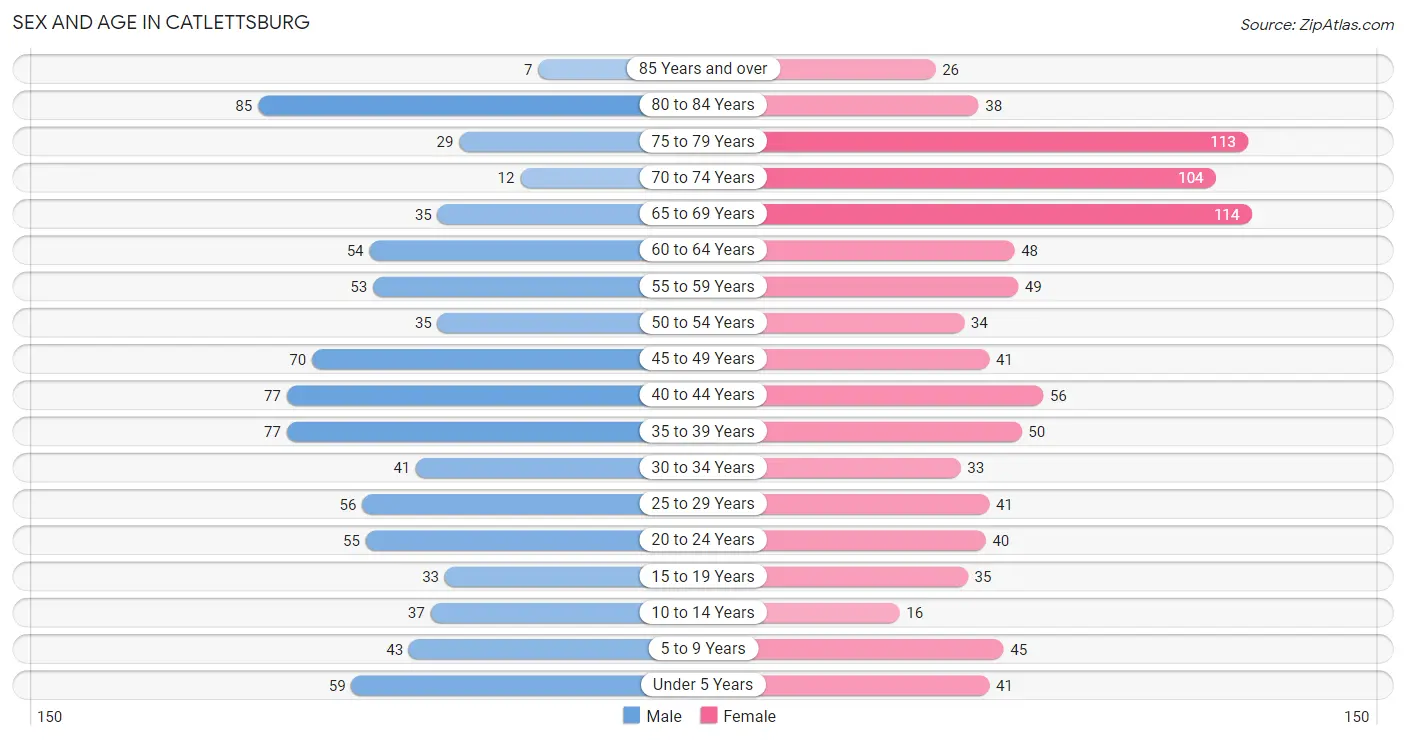
The most populous age groups in Catlettsburg are 80 to 84 Years (85 | 9.9%) for men and 65 to 69 Years (114 | 12.3%) for women.
| Age Bracket | Male | Female |
| Under 5 Years | 59 (6.9%) | 41 (4.4%) |
| 5 to 9 Years | 43 (5.0%) | 45 (4.9%) |
| 10 to 14 Years | 37 (4.3%) | 16 (1.7%) |
| 15 to 19 Years | 33 (3.8%) | 35 (3.8%) |
| 20 to 24 Years | 55 (6.4%) | 40 (4.3%) |
| 25 to 29 Years | 56 (6.5%) | 41 (4.4%) |
| 30 to 34 Years | 41 (4.8%) | 33 (3.6%) |
| 35 to 39 Years | 77 (9.0%) | 50 (5.4%) |
| 40 to 44 Years | 77 (9.0%) | 56 (6.1%) |
| 45 to 49 Years | 70 (8.2%) | 41 (4.4%) |
| 50 to 54 Years | 35 (4.1%) | 34 (3.7%) |
| 55 to 59 Years | 53 (6.2%) | 49 (5.3%) |
| 60 to 64 Years | 54 (6.3%) | 48 (5.2%) |
| 65 to 69 Years | 35 (4.1%) | 114 (12.3%) |
| 70 to 74 Years | 12 (1.4%) | 104 (11.3%) |
| 75 to 79 Years | 29 (3.4%) | 113 (12.2%) |
| 80 to 84 Years | 85 (9.9%) | 38 (4.1%) |
| 85 Years and over | 7 (0.8%) | 26 (2.8%) |
| Total | 858 (100.0%) | 924 (100.0%) |
Families and Households in Catlettsburg
Median Family Size in Catlettsburg
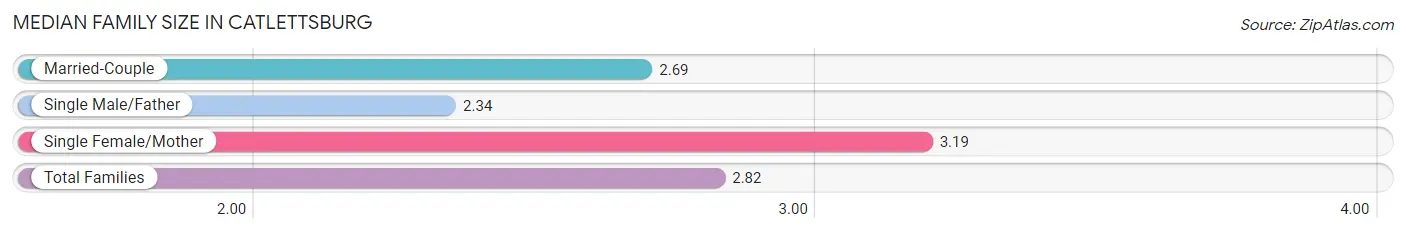
The median family size in Catlettsburg is 2.82 persons per family, with single female/mother families (111 | 31.2%) accounting for the largest median family size of 3.19 persons per family. On the other hand, single male/father families (32 | 9.0%) represent the smallest median family size with 2.34 persons per family.
| Family Type | # Families | Family Size |
| Married-Couple | 213 (59.8%) | 2.69 |
| Single Male/Father | 32 (9.0%) | 2.34 |
| Single Female/Mother | 111 (31.2%) | 3.19 |
| Total Families | 356 (100.0%) | 2.82 |
Median Household Size in Catlettsburg
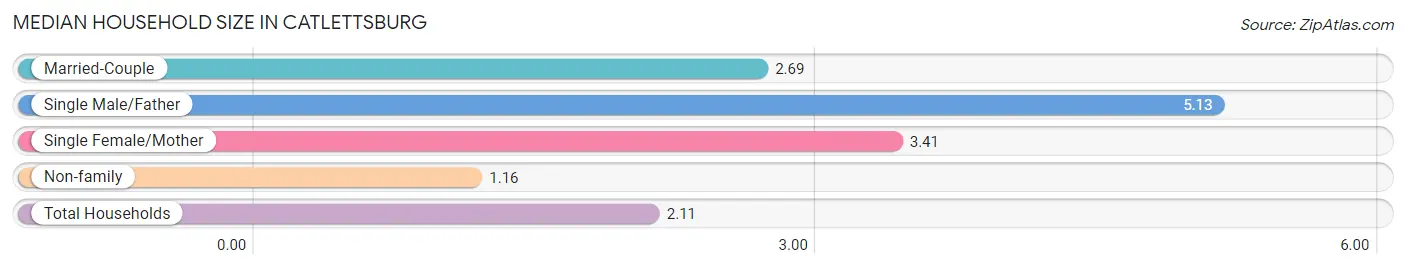
The median household size in Catlettsburg is 2.11 persons per household, with single male/father households (32 | 4.3%) accounting for the largest median household size of 5.13 persons per household. non-family households (385 | 52.0%) represent the smallest median household size with 1.16 persons per household.
| Household Type | # Households | Household Size |
| Married-Couple | 213 (28.7%) | 2.69 |
| Single Male/Father | 32 (4.3%) | 5.13 |
| Single Female/Mother | 111 (15.0%) | 3.41 |
| Non-family | 385 (52.0%) | 1.16 |
| Total Households | 741 (100.0%) | 2.11 |
Household Size by Marriage Status in Catlettsburg
Out of a total of 741 households in Catlettsburg, 356 (48.0%) are family households, while 385 (52.0%) are nonfamily households. The most numerous type of family households are 2-person households, comprising 223, and the most common type of nonfamily households are 1-person households, comprising 346.
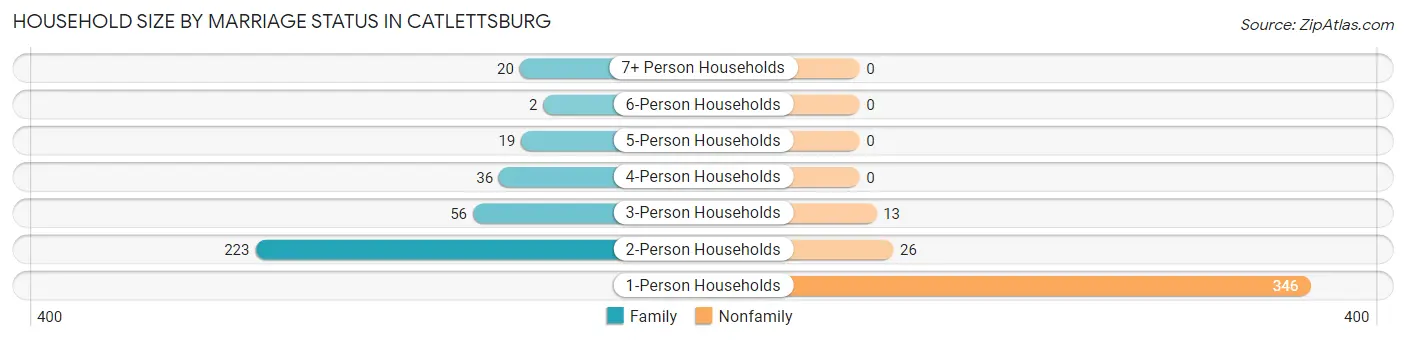
| Household Size | Family Households | Nonfamily Households |
| 1-Person Households | - | 346 (46.7%) |
| 2-Person Households | 223 (30.1%) | 26 (3.5%) |
| 3-Person Households | 56 (7.6%) | 13 (1.8%) |
| 4-Person Households | 36 (4.9%) | 0 (0.0%) |
| 5-Person Households | 19 (2.6%) | 0 (0.0%) |
| 6-Person Households | 2 (0.3%) | 0 (0.0%) |
| 7+ Person Households | 20 (2.7%) | 0 (0.0%) |
| Total | 356 (48.0%) | 385 (52.0%) |
Female Fertility in Catlettsburg
Fertility by Age in Catlettsburg
Average fertility rate in Catlettsburg is 34.0 births per 1,000 women. Women in the age bracket of 20 to 34 years have the highest fertility rate with 44.0 births per 1,000 women. Women in the age bracket of 20 to 34 years acount for 50.0% of all women with births.
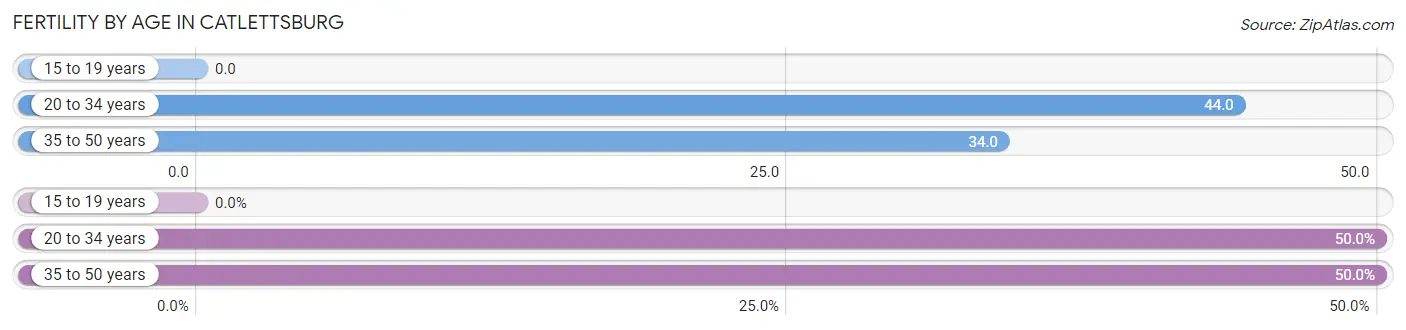
| Age Bracket | Women with Births | Births / 1,000 Women |
| 15 to 19 years | 0 (0.0%) | 0.0 |
| 20 to 34 years | 5 (50.0%) | 44.0 |
| 35 to 50 years | 5 (50.0%) | 34.0 |
| Total | 10 (100.0%) | 34.0 |
Fertility by Age by Marriage Status in Catlettsburg
70.0% of women with births (10) in Catlettsburg are married. The highest percentage of unmarried women with births falls into 20 to 34 years age bracket with 60.0% of them unmarried at the time of birth, while the lowest percentage of unmarried women with births belong to 35 to 50 years age bracket with 0.0% of them unmarried.
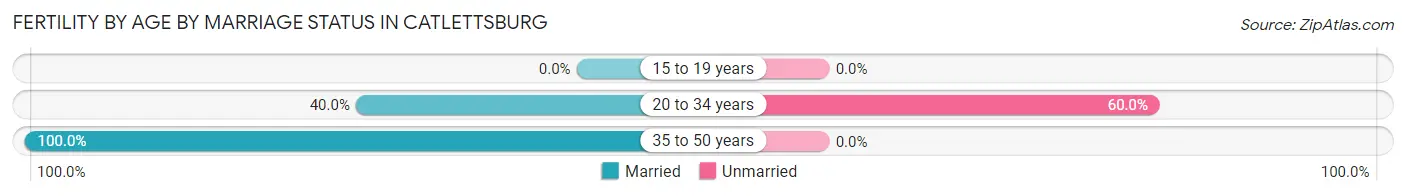
| Age Bracket | Married | Unmarried |
| 15 to 19 years | 0 (0.0%) | 0 (0.0%) |
| 20 to 34 years | 2 (40.0%) | 3 (60.0%) |
| 35 to 50 years | 5 (100.0%) | 0 (0.0%) |
| Total | 7 (70.0%) | 3 (30.0%) |
Fertility by Education in Catlettsburg
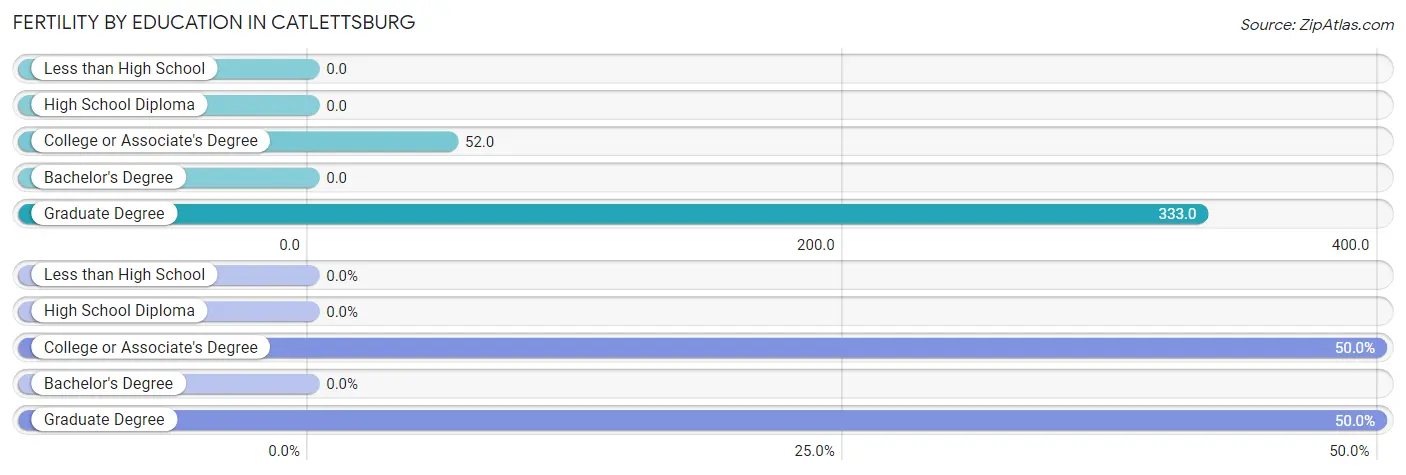
| Educational Attainment | Women with Births | Births / 1,000 Women |
| Less than High School | 0 (0.0%) | 0.0 |
| High School Diploma | 0 (0.0%) | 0.0 |
| College or Associate's Degree | 5 (50.0%) | 52.0 |
| Bachelor's Degree | 0 (0.0%) | 0.0 |
| Graduate Degree | 5 (50.0%) | 333.0 |
| Total | 10 (100.0%) | 34.0 |
Fertility by Education by Marriage Status in Catlettsburg
30.0% of women with births in Catlettsburg are unmarried. Women with the educational attainment of graduate degree are most likely to be married with 100.0% of them married at childbirth, while women with the educational attainment of college or associate's degree are least likely to be married with 60.0% of them unmarried at childbirth.
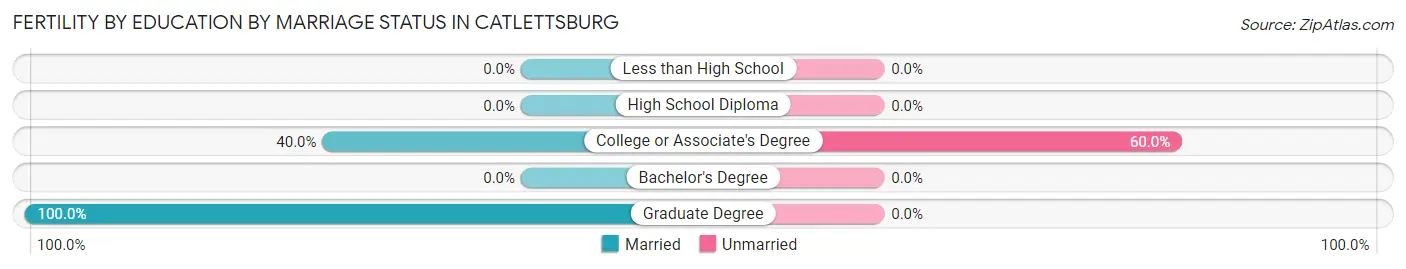
| Educational Attainment | Married | Unmarried |
| Less than High School | 0 (0.0%) | 0 (0.0%) |
| High School Diploma | 0 (0.0%) | 0 (0.0%) |
| College or Associate's Degree | 2 (40.0%) | 3 (60.0%) |
| Bachelor's Degree | 0 (0.0%) | 0 (0.0%) |
| Graduate Degree | 5 (100.0%) | 0 (0.0%) |
| Total | 7 (70.0%) | 3 (30.0%) |
Employment Characteristics in Catlettsburg
Employment by Class of Employer in Catlettsburg
Among the 433 employed individuals in Catlettsburg, private company employees (243 | 56.1%), local government employees (66 | 15.2%), and not-for-profit organizations (61 | 14.1%) make up the most common classes of employment.
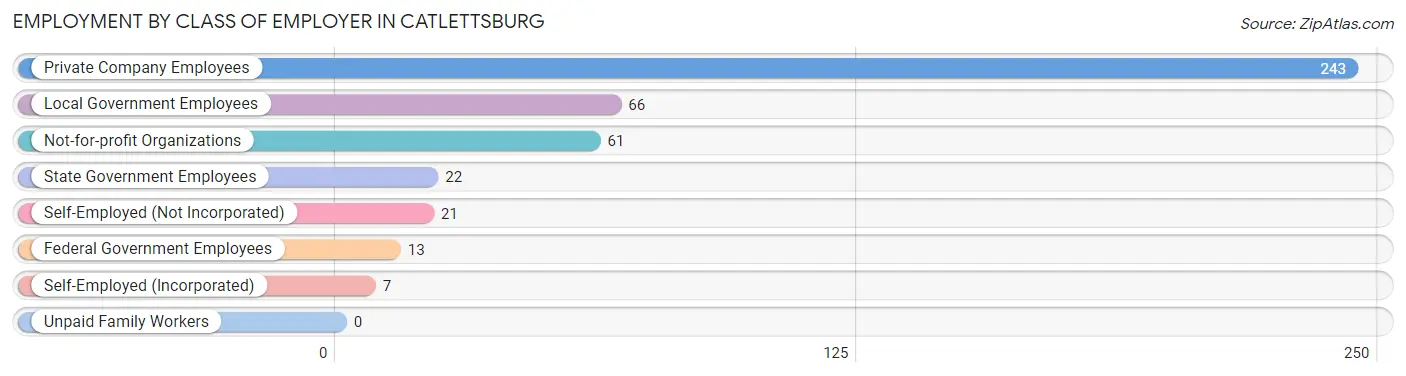
| Employer Class | # Employees | % Employees |
| Private Company Employees | 243 | 56.1% |
| Self-Employed (Incorporated) | 7 | 1.6% |
| Self-Employed (Not Incorporated) | 21 | 4.9% |
| Not-for-profit Organizations | 61 | 14.1% |
| Local Government Employees | 66 | 15.2% |
| State Government Employees | 22 | 5.1% |
| Federal Government Employees | 13 | 3.0% |
| Unpaid Family Workers | 0 | 0.0% |
| Total | 433 | 100.0% |
Employment Status by Age in Catlettsburg
According to the labor force statistics for Catlettsburg, out of the total population over 16 years of age (1,530), 31.7% or 485 individuals are in the labor force, with 10.7% or 52 of them unemployed. The age group with the highest labor force participation rate is 30 to 34 years, with 63.5% or 47 individuals in the labor force. Within the labor force, the 20 to 24 years age range has the highest percentage of unemployed individuals, with 34.0% or 17 of them being unemployed.
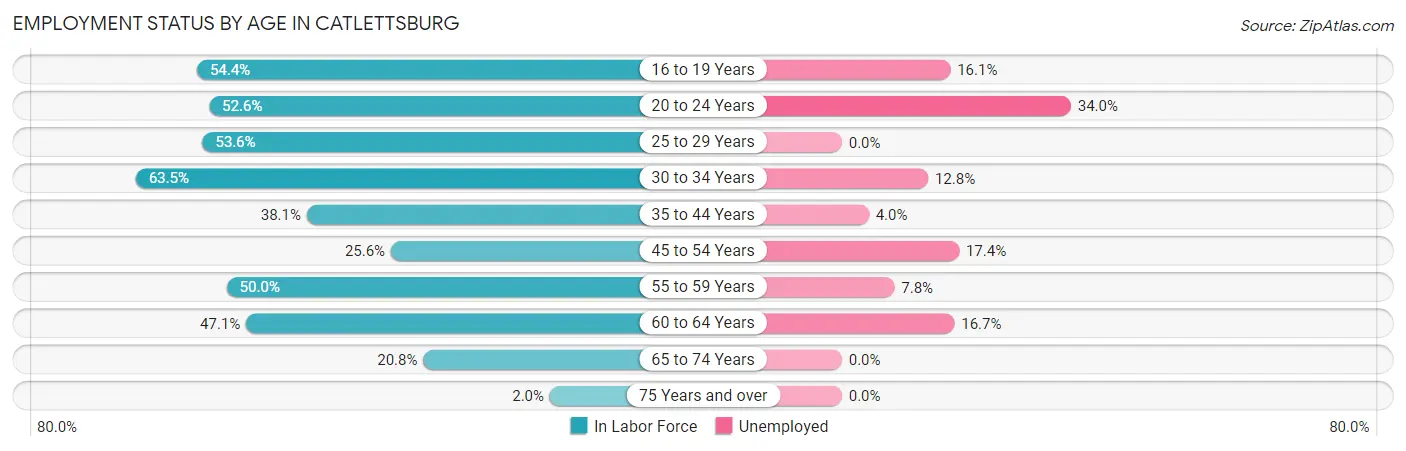
| Age Bracket | In Labor Force | Unemployed |
| 16 to 19 Years | 31 (54.4%) | 5 (16.1%) |
| 20 to 24 Years | 50 (52.6%) | 17 (34.0%) |
| 25 to 29 Years | 52 (53.6%) | 0 (0.0%) |
| 30 to 34 Years | 47 (63.5%) | 6 (12.8%) |
| 35 to 44 Years | 99 (38.1%) | 4 (4.0%) |
| 45 to 54 Years | 46 (25.6%) | 8 (17.4%) |
| 55 to 59 Years | 51 (50.0%) | 4 (7.8%) |
| 60 to 64 Years | 48 (47.1%) | 8 (16.7%) |
| 65 to 74 Years | 55 (20.8%) | 0 (0.0%) |
| 75 Years and over | 6 (2.0%) | 0 (0.0%) |
| Total | 485 (31.7%) | 52 (10.7%) |
Employment Status by Educational Attainment in Catlettsburg
According to labor force statistics for Catlettsburg, 42.1% of individuals (343) out of the total population between 25 and 64 years of age (815) are in the labor force, with 8.7% or 30 of them being unemployed. The group with the highest labor force participation rate are those with the educational attainment of bachelor's degree or higher, with 82.1% or 55 individuals in the labor force. Within the labor force, individuals with less than high school education have the highest percentage of unemployment, with 30.8% or 4 of them being unemployed.
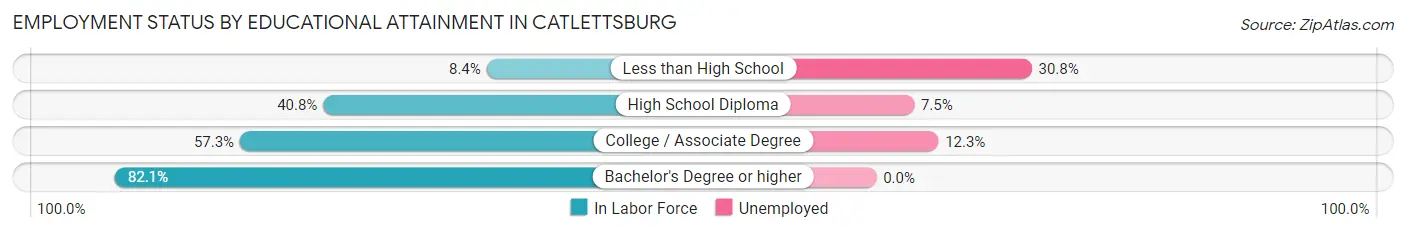
| Educational Attainment | In Labor Force | Unemployed |
| Less than High School | 13 (8.4%) | 47 (30.8%) |
| High School Diploma | 161 (40.8%) | 30 (7.5%) |
| College / Associate Degree | 114 (57.3%) | 24 (12.3%) |
| Bachelor's Degree or higher | 55 (82.1%) | 0 (0.0%) |
| Total | 343 (42.1%) | 71 (8.7%) |
Employment Occupations by Sex in Catlettsburg
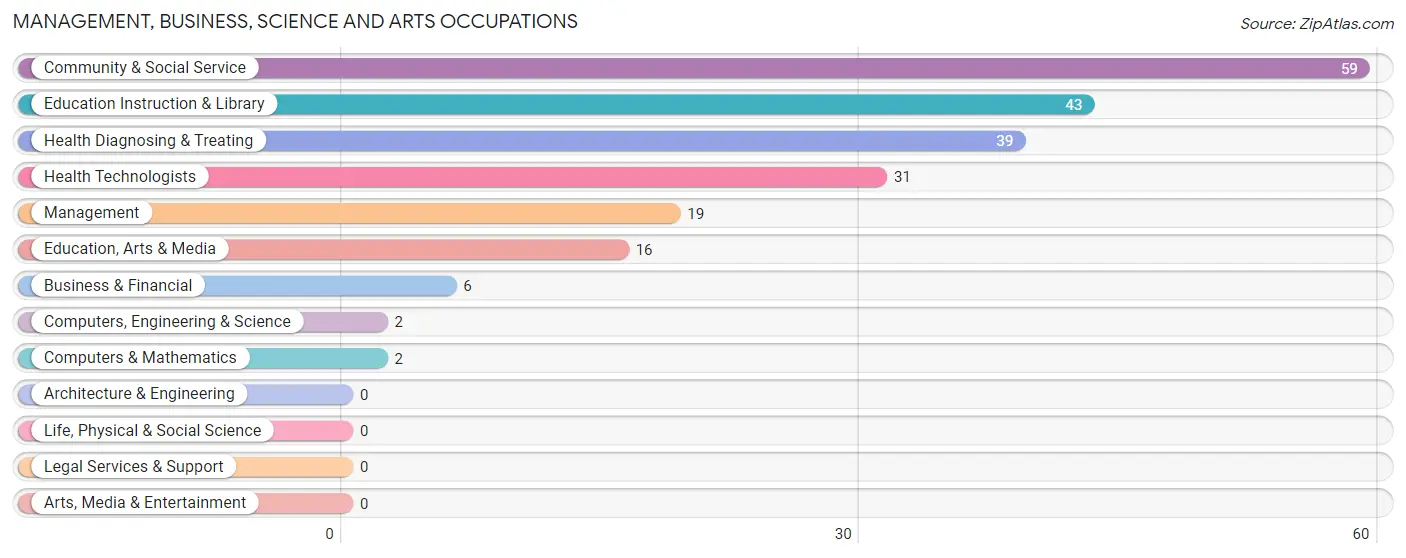
Management, Business, Science and Arts Occupations
The most common Management, Business, Science and Arts occupations in Catlettsburg are Community & Social Service (59 | 13.6%), Education Instruction & Library (43 | 9.9%), Health Diagnosing & Treating (39 | 9.0%), Health Technologists (31 | 7.2%), and Management (19 | 4.4%).
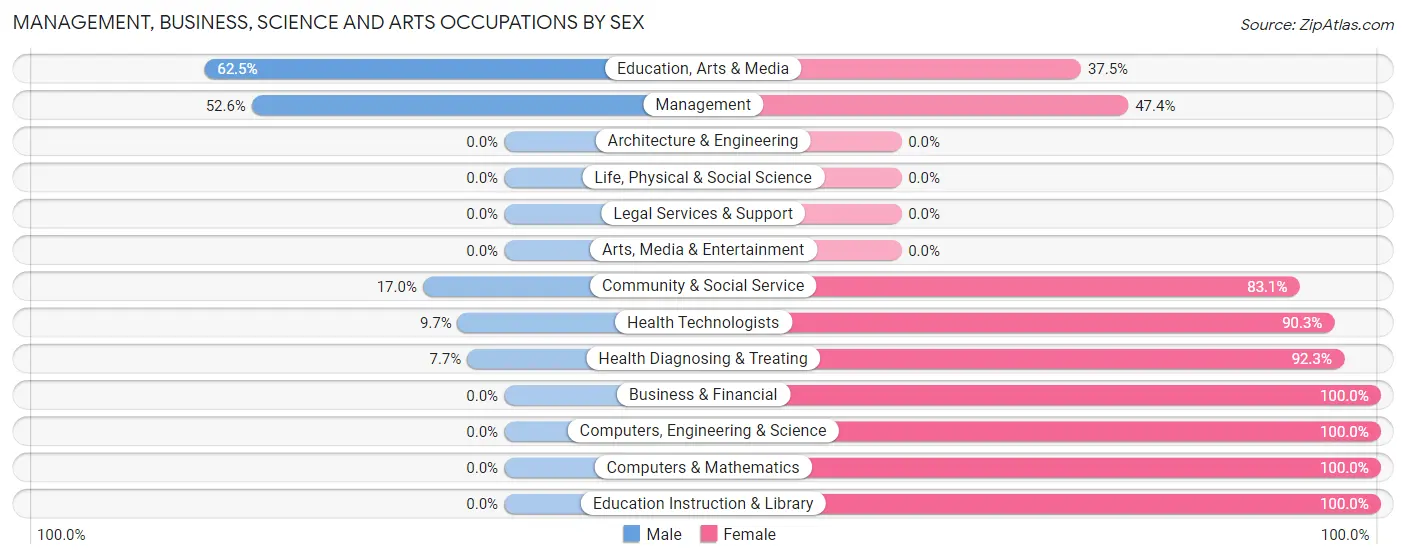
Management, Business, Science and Arts Occupations by Sex
Within the Management, Business, Science and Arts occupations in Catlettsburg, the most male-oriented occupations are Education, Arts & Media (62.5%), Management (52.6%), and Community & Social Service (17.0%), while the most female-oriented occupations are Business & Financial (100.0%), Computers, Engineering & Science (100.0%), and Computers & Mathematics (100.0%).
| Occupation | Male | Female |
| Management | 10 (52.6%) | 9 (47.4%) |
| Business & Financial | 0 (0.0%) | 6 (100.0%) |
| Computers, Engineering & Science | 0 (0.0%) | 2 (100.0%) |
| Computers & Mathematics | 0 (0.0%) | 2 (100.0%) |
| Architecture & Engineering | 0 (0.0%) | 0 (0.0%) |
| Life, Physical & Social Science | 0 (0.0%) | 0 (0.0%) |
| Community & Social Service | 10 (17.0%) | 49 (83.1%) |
| Education, Arts & Media | 10 (62.5%) | 6 (37.5%) |
| Legal Services & Support | 0 (0.0%) | 0 (0.0%) |
| Education Instruction & Library | 0 (0.0%) | 43 (100.0%) |
| Arts, Media & Entertainment | 0 (0.0%) | 0 (0.0%) |
| Health Diagnosing & Treating | 3 (7.7%) | 36 (92.3%) |
| Health Technologists | 3 (9.7%) | 28 (90.3%) |
| Total (Category) | 23 (18.4%) | 102 (81.6%) |
| Total (Overall) | 193 (44.6%) | 240 (55.4%) |
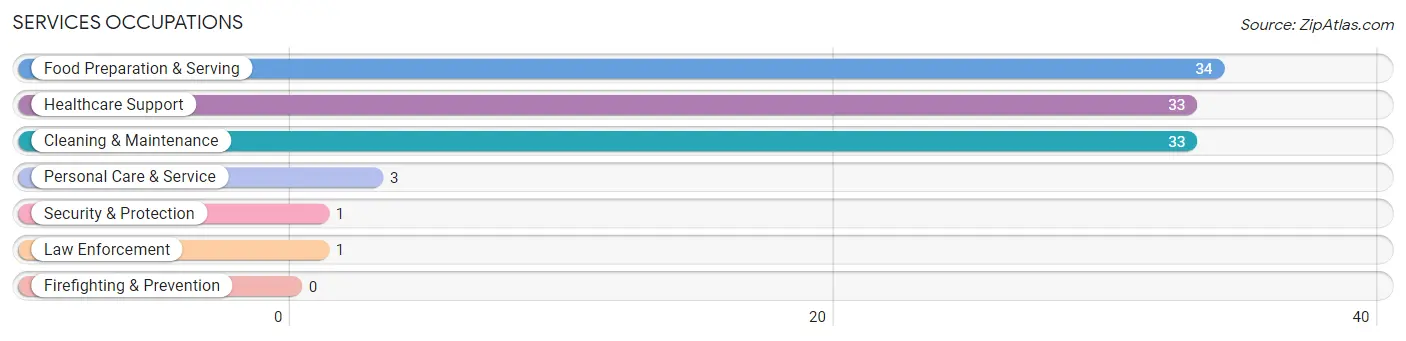
Services Occupations
The most common Services occupations in Catlettsburg are Food Preparation & Serving (34 | 7.9%), Healthcare Support (33 | 7.6%), Cleaning & Maintenance (33 | 7.6%), Personal Care & Service (3 | 0.7%), and Security & Protection (1 | 0.2%).
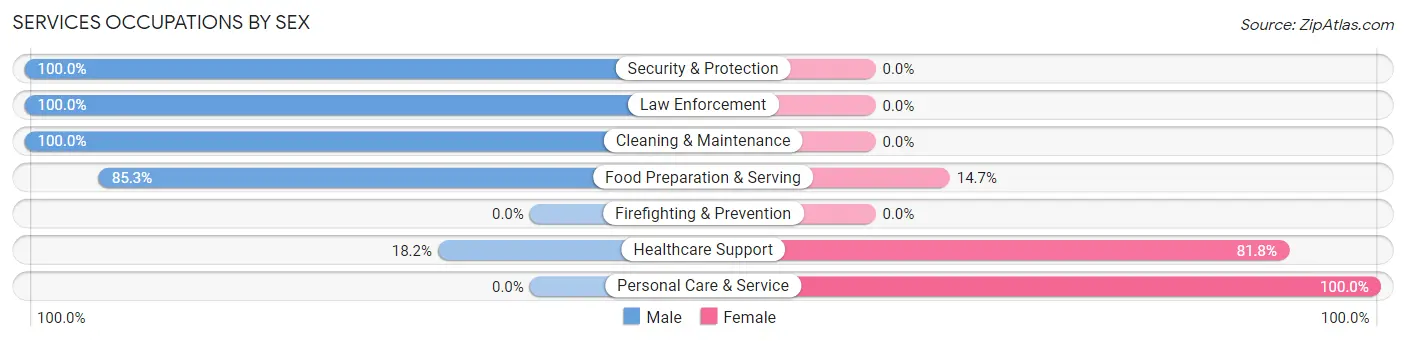
Services Occupations by Sex
Within the Services occupations in Catlettsburg, the most male-oriented occupations are Security & Protection (100.0%), Law Enforcement (100.0%), and Cleaning & Maintenance (100.0%), while the most female-oriented occupations are Personal Care & Service (100.0%), Healthcare Support (81.8%), and Food Preparation & Serving (14.7%).
| Occupation | Male | Female |
| Healthcare Support | 6 (18.2%) | 27 (81.8%) |
| Security & Protection | 1 (100.0%) | 0 (0.0%) |
| Firefighting & Prevention | 0 (0.0%) | 0 (0.0%) |
| Law Enforcement | 1 (100.0%) | 0 (0.0%) |
| Food Preparation & Serving | 29 (85.3%) | 5 (14.7%) |
| Cleaning & Maintenance | 33 (100.0%) | 0 (0.0%) |
| Personal Care & Service | 0 (0.0%) | 3 (100.0%) |
| Total (Category) | 69 (66.3%) | 35 (33.7%) |
| Total (Overall) | 193 (44.6%) | 240 (55.4%) |
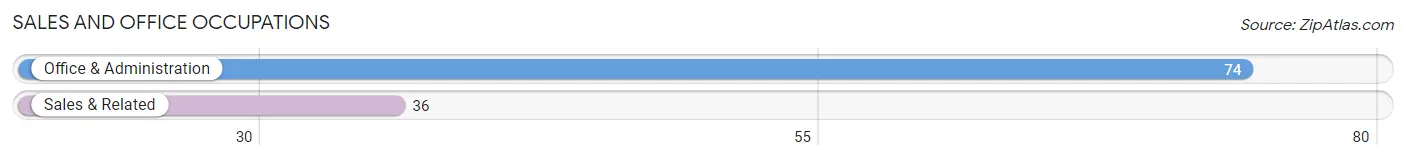
Sales and Office Occupations
The most common Sales and Office occupations in Catlettsburg are Office & Administration (74 | 17.1%), and Sales & Related (36 | 8.3%).
Sales and Office Occupations by Sex
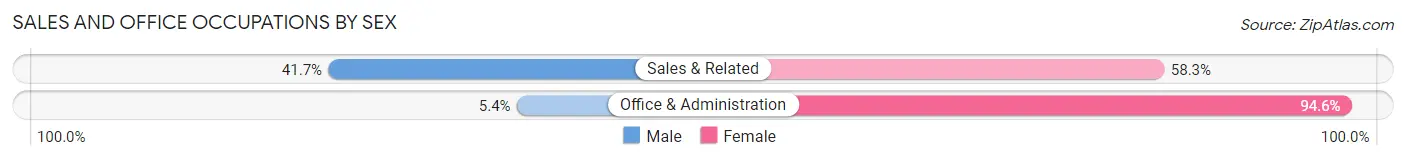
| Occupation | Male | Female |
| Sales & Related | 15 (41.7%) | 21 (58.3%) |
| Office & Administration | 4 (5.4%) | 70 (94.6%) |
| Total (Category) | 19 (17.3%) | 91 (82.7%) |
| Total (Overall) | 193 (44.6%) | 240 (55.4%) |
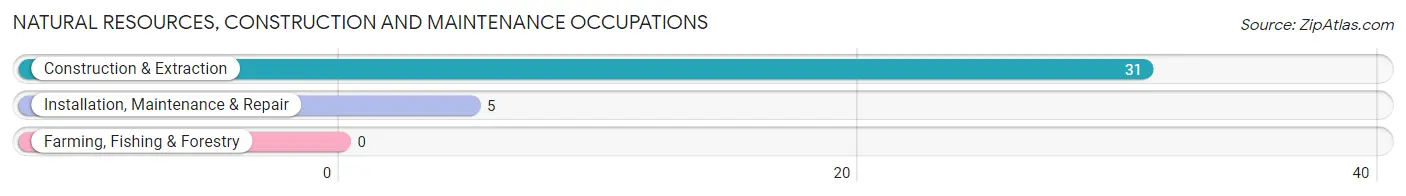
Natural Resources, Construction and Maintenance Occupations
The most common Natural Resources, Construction and Maintenance occupations in Catlettsburg are Construction & Extraction (31 | 7.2%), and Installation, Maintenance & Repair (5 | 1.1%).
Natural Resources, Construction and Maintenance Occupations by Sex
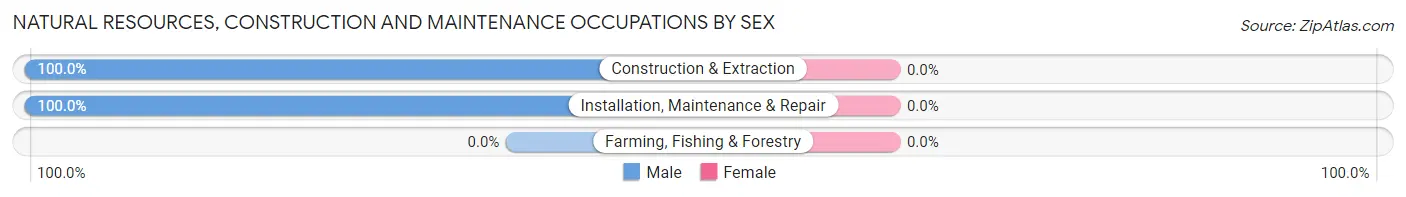
| Occupation | Male | Female |
| Farming, Fishing & Forestry | 0 (0.0%) | 0 (0.0%) |
| Construction & Extraction | 31 (100.0%) | 0 (0.0%) |
| Installation, Maintenance & Repair | 5 (100.0%) | 0 (0.0%) |
| Total (Category) | 36 (100.0%) | 0 (0.0%) |
| Total (Overall) | 193 (44.6%) | 240 (55.4%) |
Production, Transportation and Moving Occupations
The most common Production, Transportation and Moving occupations in Catlettsburg are Transportation (34 | 7.9%), and Production (24 | 5.5%).
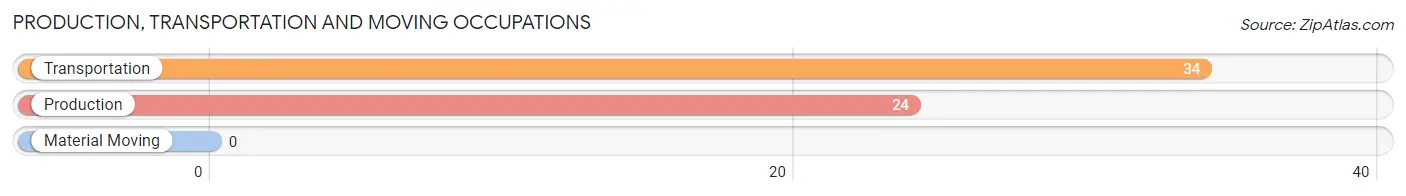
Production, Transportation and Moving Occupations by Sex
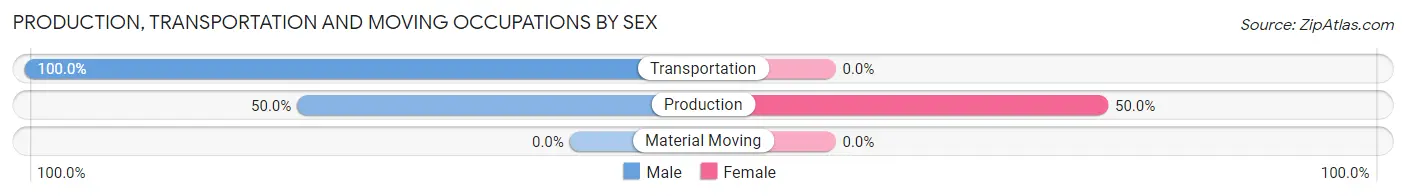
| Occupation | Male | Female |
| Production | 12 (50.0%) | 12 (50.0%) |
| Transportation | 34 (100.0%) | 0 (0.0%) |
| Material Moving | 0 (0.0%) | 0 (0.0%) |
| Total (Category) | 46 (79.3%) | 12 (20.7%) |
| Total (Overall) | 193 (44.6%) | 240 (55.4%) |
Employment Industries by Sex in Catlettsburg
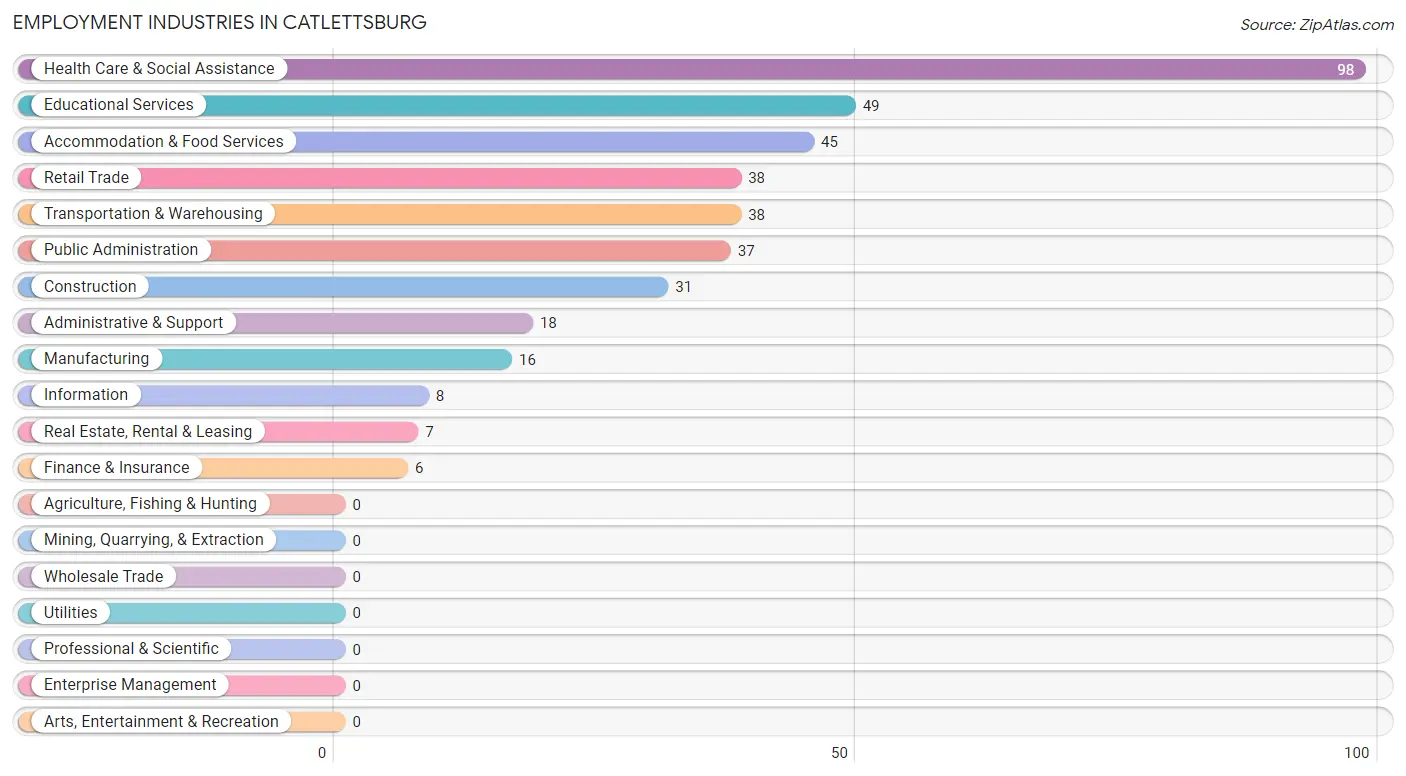
Employment Industries in Catlettsburg
The major employment industries in Catlettsburg include Health Care & Social Assistance (98 | 22.6%), Educational Services (49 | 11.3%), Accommodation & Food Services (45 | 10.4%), Retail Trade (38 | 8.8%), and Transportation & Warehousing (38 | 8.8%).
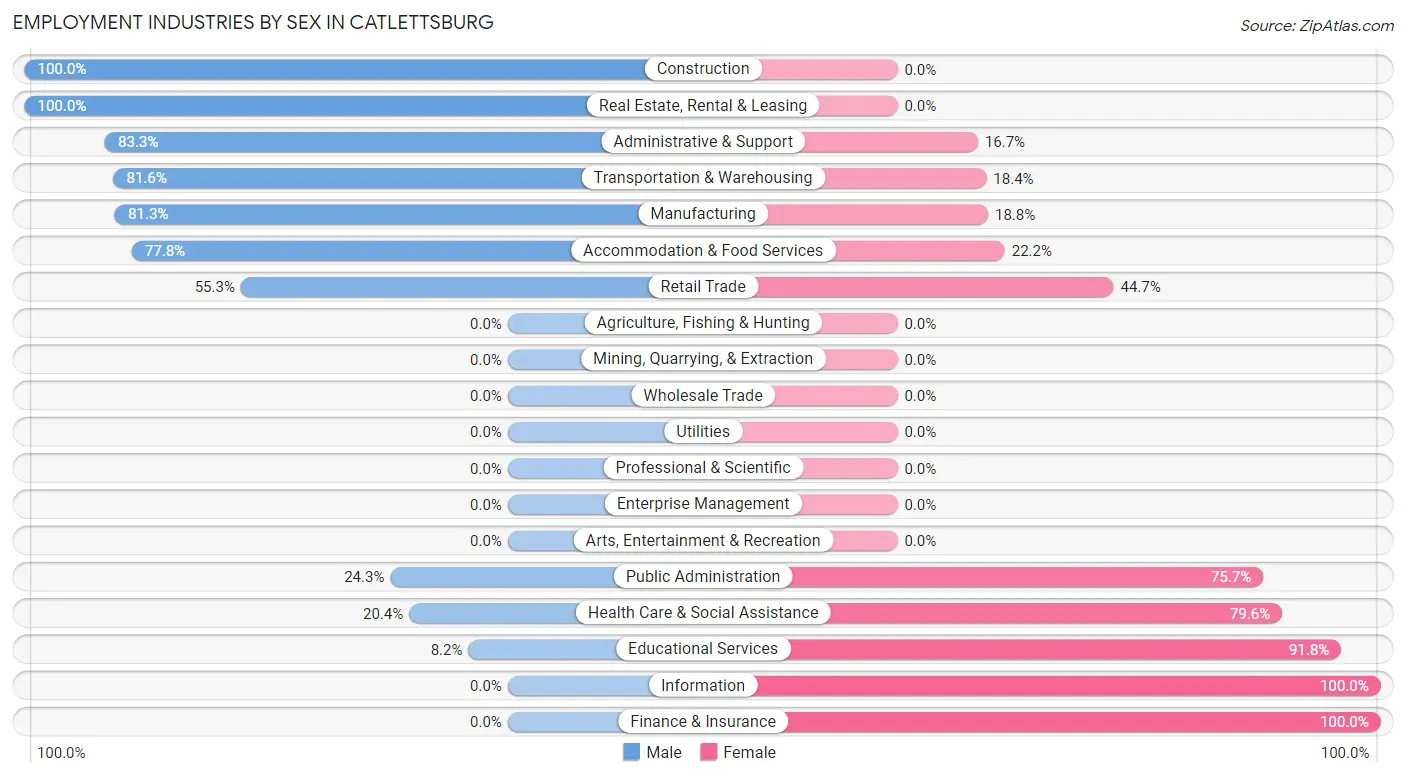
Employment Industries by Sex in Catlettsburg
The Catlettsburg industries that see more men than women are Construction (100.0%), Real Estate, Rental & Leasing (100.0%), and Administrative & Support (83.3%), whereas the industries that tend to have a higher number of women are Information (100.0%), Finance & Insurance (100.0%), and Educational Services (91.8%).
| Industry | Male | Female |
| Agriculture, Fishing & Hunting | 0 (0.0%) | 0 (0.0%) |
| Mining, Quarrying, & Extraction | 0 (0.0%) | 0 (0.0%) |
| Construction | 31 (100.0%) | 0 (0.0%) |
| Manufacturing | 13 (81.2%) | 3 (18.8%) |
| Wholesale Trade | 0 (0.0%) | 0 (0.0%) |
| Retail Trade | 21 (55.3%) | 17 (44.7%) |
| Transportation & Warehousing | 31 (81.6%) | 7 (18.4%) |
| Utilities | 0 (0.0%) | 0 (0.0%) |
| Information | 0 (0.0%) | 8 (100.0%) |
| Finance & Insurance | 0 (0.0%) | 6 (100.0%) |
| Real Estate, Rental & Leasing | 7 (100.0%) | 0 (0.0%) |
| Professional & Scientific | 0 (0.0%) | 0 (0.0%) |
| Enterprise Management | 0 (0.0%) | 0 (0.0%) |
| Administrative & Support | 15 (83.3%) | 3 (16.7%) |
| Educational Services | 4 (8.2%) | 45 (91.8%) |
| Health Care & Social Assistance | 20 (20.4%) | 78 (79.6%) |
| Arts, Entertainment & Recreation | 0 (0.0%) | 0 (0.0%) |
| Accommodation & Food Services | 35 (77.8%) | 10 (22.2%) |
| Public Administration | 9 (24.3%) | 28 (75.7%) |
| Total | 193 (44.6%) | 240 (55.4%) |
Education in Catlettsburg
School Enrollment in Catlettsburg
The most common levels of schooling among the 265 students in Catlettsburg are elementary school (55 | 20.7%), high school (54 | 20.4%), and nursery / preschool (48 | 18.1%).
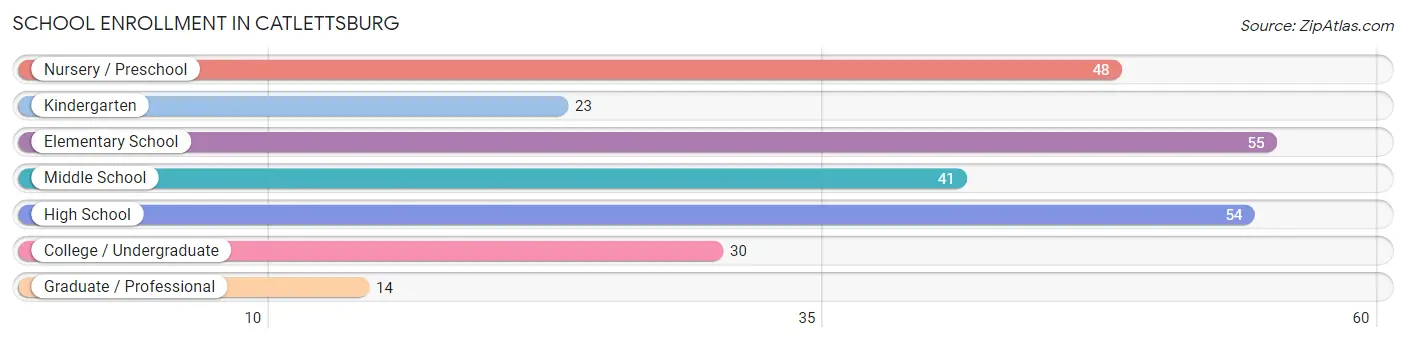
| School Level | # Students | % Students |
| Nursery / Preschool | 48 | 18.1% |
| Kindergarten | 23 | 8.7% |
| Elementary School | 55 | 20.7% |
| Middle School | 41 | 15.5% |
| High School | 54 | 20.4% |
| College / Undergraduate | 30 | 11.3% |
| Graduate / Professional | 14 | 5.3% |
| Total | 265 | 100.0% |
School Enrollment by Age by Funding Source in Catlettsburg
Out of a total of 265 students who are enrolled in schools in Catlettsburg, 4 (1.5%) attend a private institution, while the remaining 261 (98.5%) are enrolled in public schools. The age group of 35 years and over has the highest likelihood of being enrolled in private schools, with 4 (50.0% in the age bracket) enrolled. Conversely, the age group of 3 to 4 year olds has the lowest likelihood of being enrolled in a private school, with 32 (100.0% in the age bracket) attending a public institution.
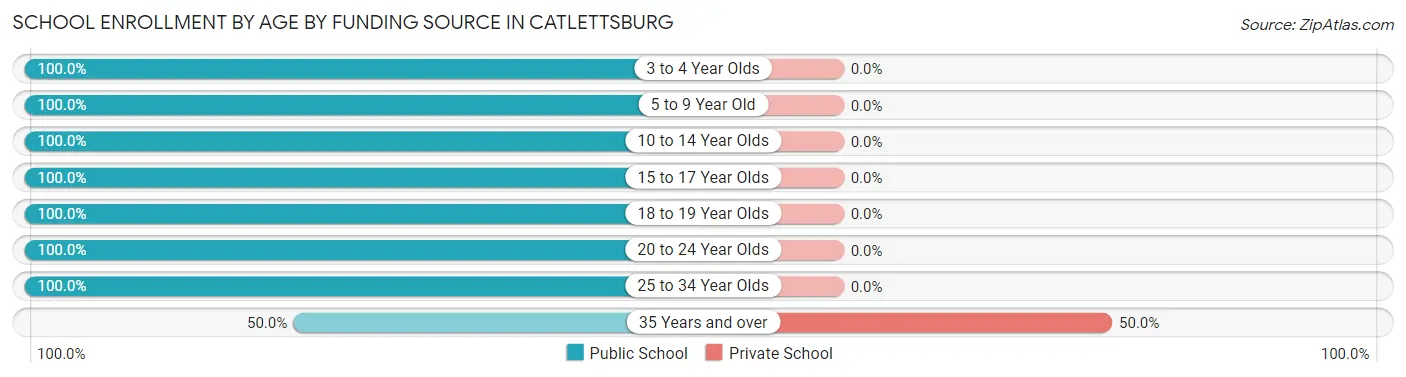
| Age Bracket | Public School | Private School |
| 3 to 4 Year Olds | 32 (100.0%) | 0 (0.0%) |
| 5 to 9 Year Old | 84 (100.0%) | 0 (0.0%) |
| 10 to 14 Year Olds | 53 (100.0%) | 0 (0.0%) |
| 15 to 17 Year Olds | 36 (100.0%) | 0 (0.0%) |
| 18 to 19 Year Olds | 24 (100.0%) | 0 (0.0%) |
| 20 to 24 Year Olds | 17 (100.0%) | 0 (0.0%) |
| 25 to 34 Year Olds | 11 (100.0%) | 0 (0.0%) |
| 35 Years and over | 4 (50.0%) | 4 (50.0%) |
| Total | 261 (98.5%) | 4 (1.5%) |
Educational Attainment by Field of Study in Catlettsburg
Education (30 | 35.3%), science & technology (20 | 23.5%), liberal arts & history (8 | 9.4%), business (7 | 8.2%), and visual & performing arts (7 | 8.2%) are the most common fields of study among 85 individuals in Catlettsburg who have obtained a bachelor's degree or higher.
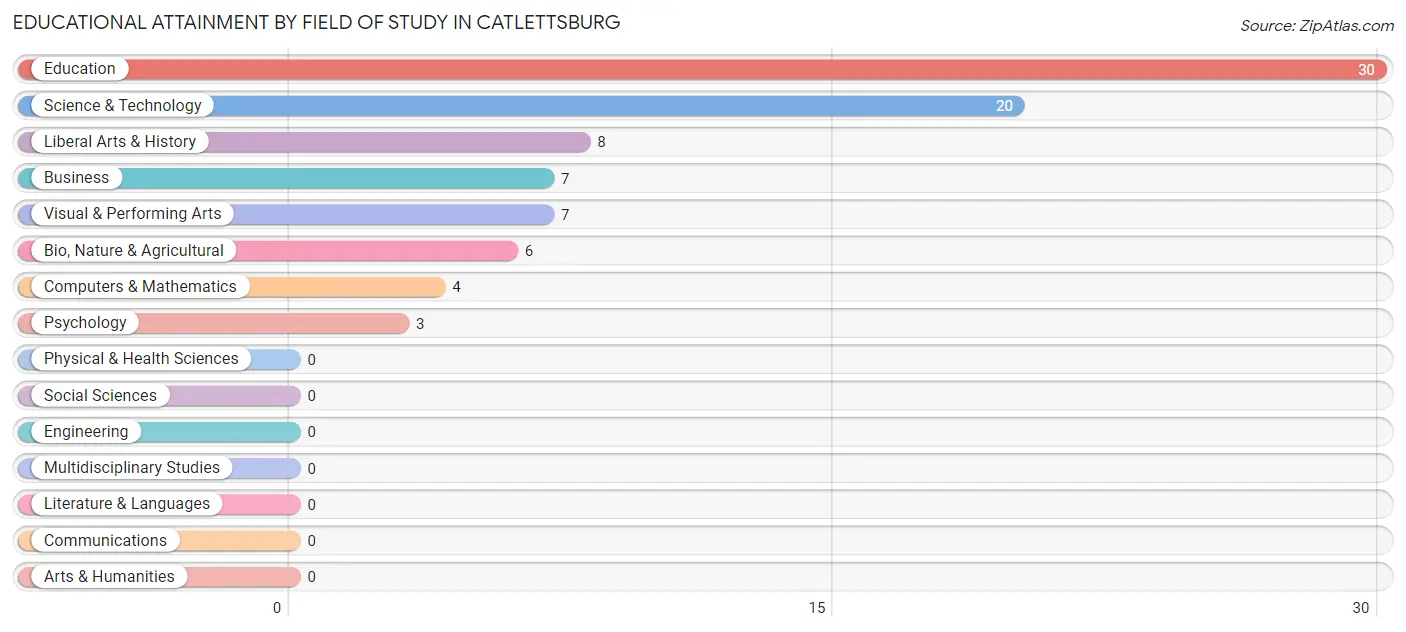
| Field of Study | # Graduates | % Graduates |
| Computers & Mathematics | 4 | 4.7% |
| Bio, Nature & Agricultural | 6 | 7.1% |
| Physical & Health Sciences | 0 | 0.0% |
| Psychology | 3 | 3.5% |
| Social Sciences | 0 | 0.0% |
| Engineering | 0 | 0.0% |
| Multidisciplinary Studies | 0 | 0.0% |
| Science & Technology | 20 | 23.5% |
| Business | 7 | 8.2% |
| Education | 30 | 35.3% |
| Literature & Languages | 0 | 0.0% |
| Liberal Arts & History | 8 | 9.4% |
| Visual & Performing Arts | 7 | 8.2% |
| Communications | 0 | 0.0% |
| Arts & Humanities | 0 | 0.0% |
| Total | 85 | 100.0% |
Transportation & Commute in Catlettsburg
Vehicle Availability by Sex in Catlettsburg
The most prevalent vehicle ownership categories in Catlettsburg are males with 2 vehicles (89, accounting for 46.1%) and females with 2 vehicles (81, making up 37.1%).
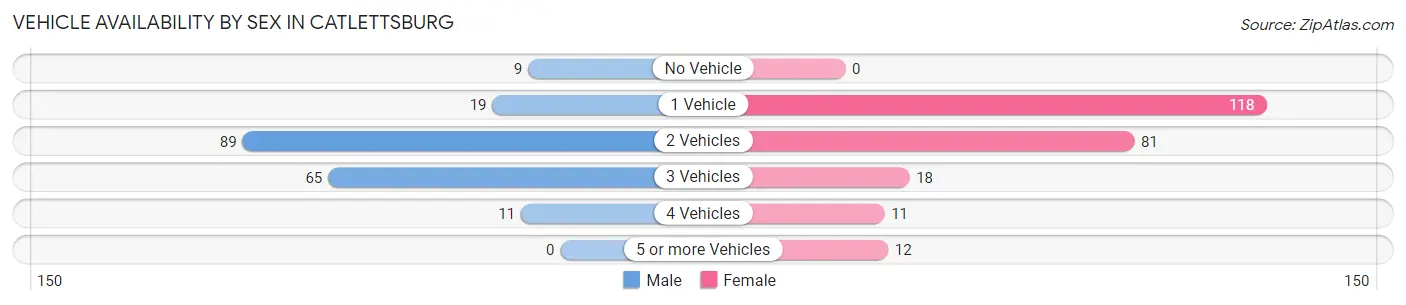
| Vehicles Available | Male | Female |
| No Vehicle | 9 (4.7%) | 0 (0.0%) |
| 1 Vehicle | 19 (9.8%) | 118 (49.2%) |
| 2 Vehicles | 89 (46.1%) | 81 (33.8%) |
| 3 Vehicles | 65 (33.7%) | 18 (7.5%) |
| 4 Vehicles | 11 (5.7%) | 11 (4.6%) |
| 5 or more Vehicles | 0 (0.0%) | 12 (5.0%) |
| Total | 193 (100.0%) | 240 (100.0%) |
Commute Time in Catlettsburg
The most frequently occuring commute durations in Catlettsburg are 20 to 24 minutes (88 commuters, 21.8%), 15 to 19 minutes (76 commuters, 18.9%), and 10 to 14 minutes (63 commuters, 15.6%).
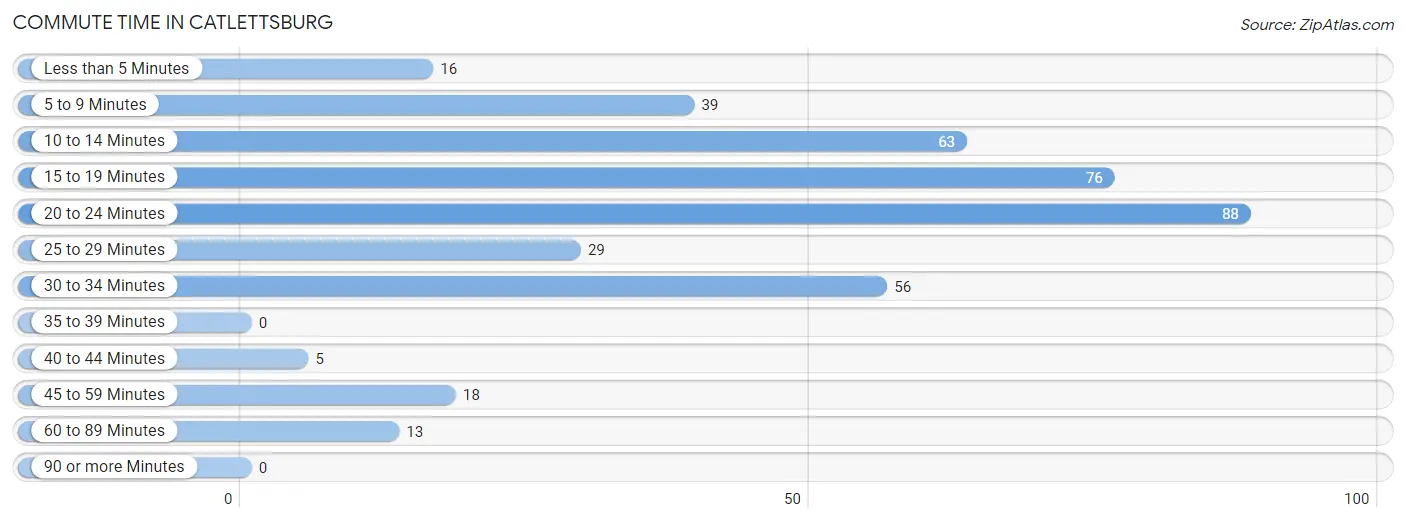
| Commute Time | # Commuters | % Commuters |
| Less than 5 Minutes | 16 | 4.0% |
| 5 to 9 Minutes | 39 | 9.7% |
| 10 to 14 Minutes | 63 | 15.6% |
| 15 to 19 Minutes | 76 | 18.9% |
| 20 to 24 Minutes | 88 | 21.8% |
| 25 to 29 Minutes | 29 | 7.2% |
| 30 to 34 Minutes | 56 | 13.9% |
| 35 to 39 Minutes | 0 | 0.0% |
| 40 to 44 Minutes | 5 | 1.2% |
| 45 to 59 Minutes | 18 | 4.5% |
| 60 to 89 Minutes | 13 | 3.2% |
| 90 or more Minutes | 0 | 0.0% |
Commute Time by Sex in Catlettsburg
The most common commute times in Catlettsburg are 15 to 19 minutes (39 commuters, 22.8%) for males and 20 to 24 minutes (58 commuters, 25.0%) for females.
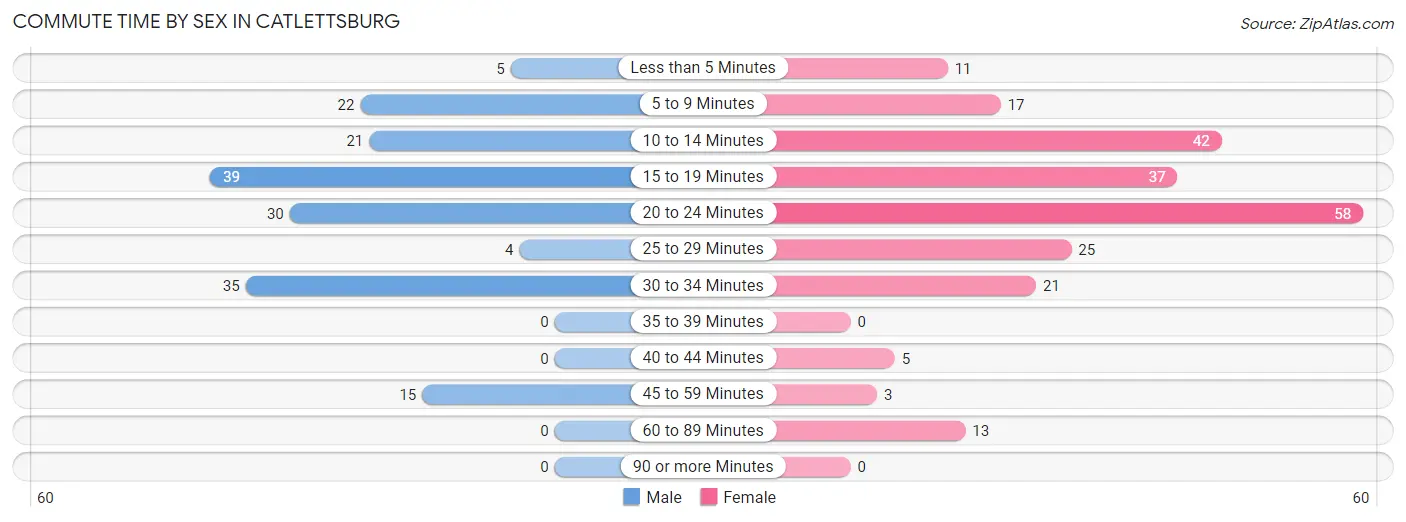
| Commute Time | Male | Female |
| Less than 5 Minutes | 5 (2.9%) | 11 (4.7%) |
| 5 to 9 Minutes | 22 (12.9%) | 17 (7.3%) |
| 10 to 14 Minutes | 21 (12.3%) | 42 (18.1%) |
| 15 to 19 Minutes | 39 (22.8%) | 37 (16.0%) |
| 20 to 24 Minutes | 30 (17.5%) | 58 (25.0%) |
| 25 to 29 Minutes | 4 (2.3%) | 25 (10.8%) |
| 30 to 34 Minutes | 35 (20.5%) | 21 (9.0%) |
| 35 to 39 Minutes | 0 (0.0%) | 0 (0.0%) |
| 40 to 44 Minutes | 0 (0.0%) | 5 (2.2%) |
| 45 to 59 Minutes | 15 (8.8%) | 3 (1.3%) |
| 60 to 89 Minutes | 0 (0.0%) | 13 (5.6%) |
| 90 or more Minutes | 0 (0.0%) | 0 (0.0%) |
Time of Departure to Work by Sex in Catlettsburg
The most frequent times of departure to work in Catlettsburg are 6:30 AM to 6:59 AM (30, 17.5%) for males and 8:00 AM to 8:29 AM (69, 29.7%) for females.
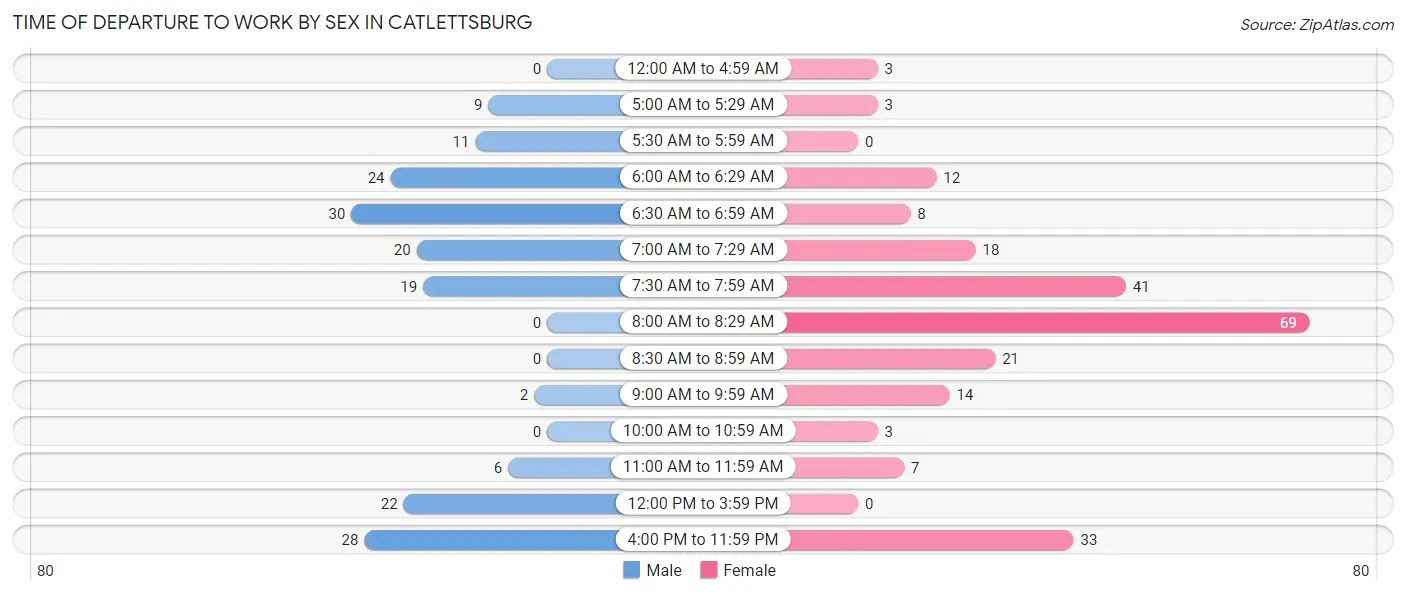
| Time of Departure | Male | Female |
| 12:00 AM to 4:59 AM | 0 (0.0%) | 3 (1.3%) |
| 5:00 AM to 5:29 AM | 9 (5.3%) | 3 (1.3%) |
| 5:30 AM to 5:59 AM | 11 (6.4%) | 0 (0.0%) |
| 6:00 AM to 6:29 AM | 24 (14.0%) | 12 (5.2%) |
| 6:30 AM to 6:59 AM | 30 (17.5%) | 8 (3.5%) |
| 7:00 AM to 7:29 AM | 20 (11.7%) | 18 (7.8%) |
| 7:30 AM to 7:59 AM | 19 (11.1%) | 41 (17.7%) |
| 8:00 AM to 8:29 AM | 0 (0.0%) | 69 (29.7%) |
| 8:30 AM to 8:59 AM | 0 (0.0%) | 21 (9.0%) |
| 9:00 AM to 9:59 AM | 2 (1.2%) | 14 (6.0%) |
| 10:00 AM to 10:59 AM | 0 (0.0%) | 3 (1.3%) |
| 11:00 AM to 11:59 AM | 6 (3.5%) | 7 (3.0%) |
| 12:00 PM to 3:59 PM | 22 (12.9%) | 0 (0.0%) |
| 4:00 PM to 11:59 PM | 28 (16.4%) | 33 (14.2%) |
| Total | 171 (100.0%) | 232 (100.0%) |
Housing Occupancy in Catlettsburg
Occupancy by Ownership in Catlettsburg
Of the total 741 dwellings in Catlettsburg, owner-occupied units account for 378 (51.0%), while renter-occupied units make up 363 (49.0%).
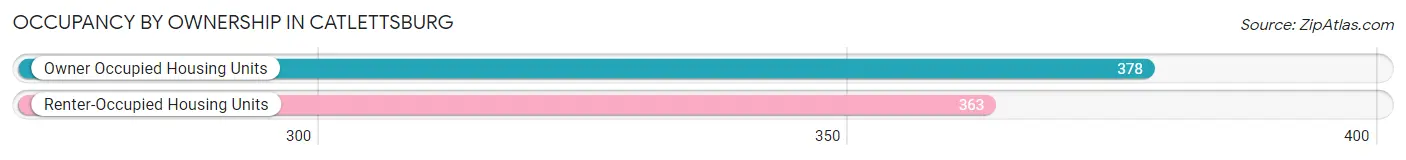
| Occupancy | # Housing Units | % Housing Units |
| Owner Occupied Housing Units | 378 | 51.0% |
| Renter-Occupied Housing Units | 363 | 49.0% |
| Total Occupied Housing Units | 741 | 100.0% |
Occupancy by Household Size in Catlettsburg
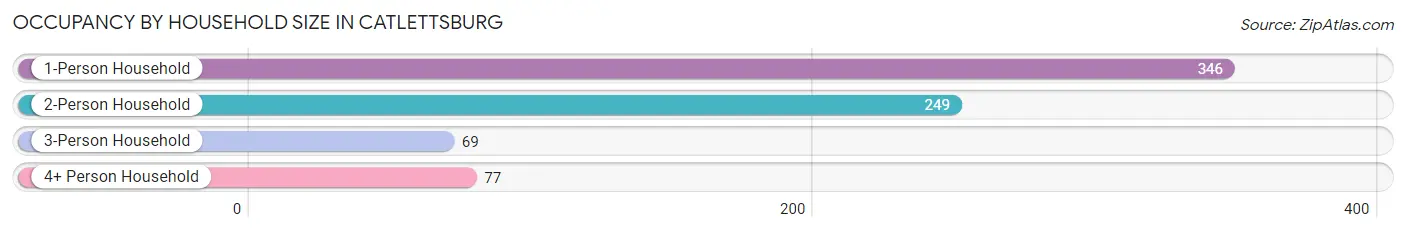
| Household Size | # Housing Units | % Housing Units |
| 1-Person Household | 346 | 46.7% |
| 2-Person Household | 249 | 33.6% |
| 3-Person Household | 69 | 9.3% |
| 4+ Person Household | 77 | 10.4% |
| Total Housing Units | 741 | 100.0% |
Occupancy by Ownership by Household Size in Catlettsburg
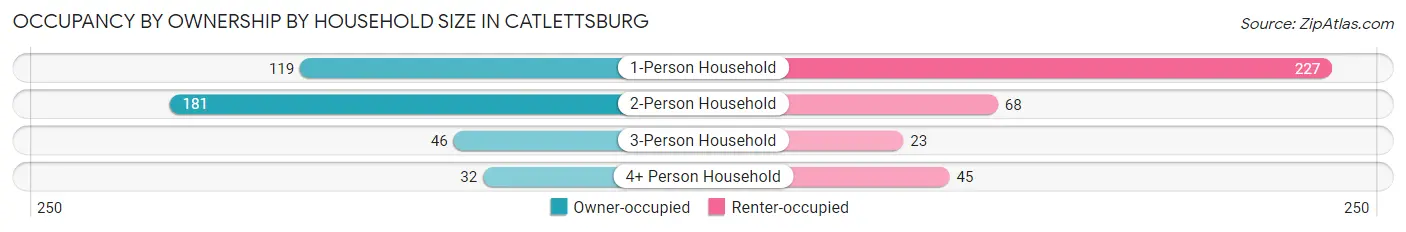
| Household Size | Owner-occupied | Renter-occupied |
| 1-Person Household | 119 (34.4%) | 227 (65.6%) |
| 2-Person Household | 181 (72.7%) | 68 (27.3%) |
| 3-Person Household | 46 (66.7%) | 23 (33.3%) |
| 4+ Person Household | 32 (41.6%) | 45 (58.4%) |
| Total Housing Units | 378 (51.0%) | 363 (49.0%) |
Occupancy by Educational Attainment in Catlettsburg
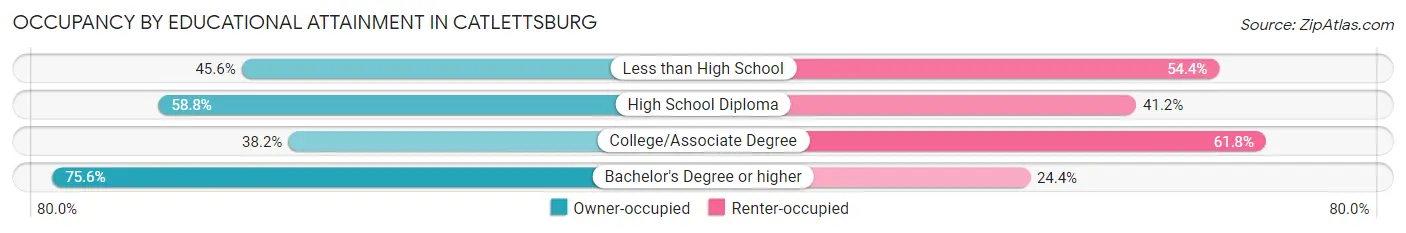
| Household Size | Owner-occupied | Renter-occupied |
| Less than High School | 57 (45.6%) | 68 (54.4%) |
| High School Diploma | 201 (58.8%) | 141 (41.2%) |
| College/Associate Degree | 89 (38.2%) | 144 (61.8%) |
| Bachelor's Degree or higher | 31 (75.6%) | 10 (24.4%) |
Occupancy by Age of Householder in Catlettsburg
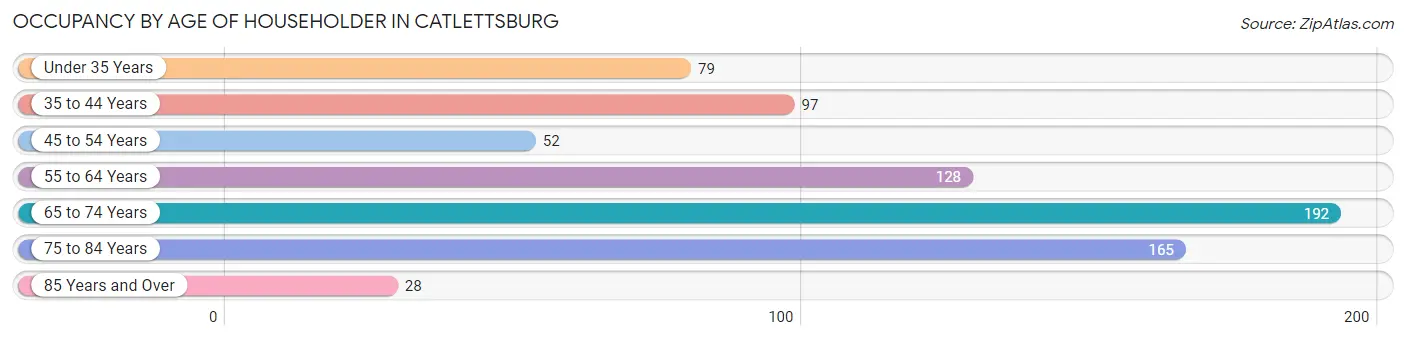
| Age Bracket | # Households | % Households |
| Under 35 Years | 79 | 10.7% |
| 35 to 44 Years | 97 | 13.1% |
| 45 to 54 Years | 52 | 7.0% |
| 55 to 64 Years | 128 | 17.3% |
| 65 to 74 Years | 192 | 25.9% |
| 75 to 84 Years | 165 | 22.3% |
| 85 Years and Over | 28 | 3.8% |
| Total | 741 | 100.0% |
Housing Finances in Catlettsburg
Median Income by Occupancy in Catlettsburg
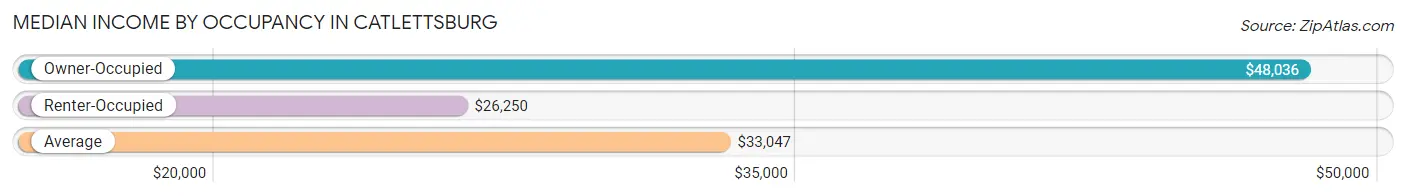
| Occupancy Type | # Households | Median Income |
| Owner-Occupied | 378 (51.0%) | $48,036 |
| Renter-Occupied | 363 (49.0%) | $26,250 |
| Average | 741 (100.0%) | $33,047 |
Occupancy by Householder Income Bracket in Catlettsburg
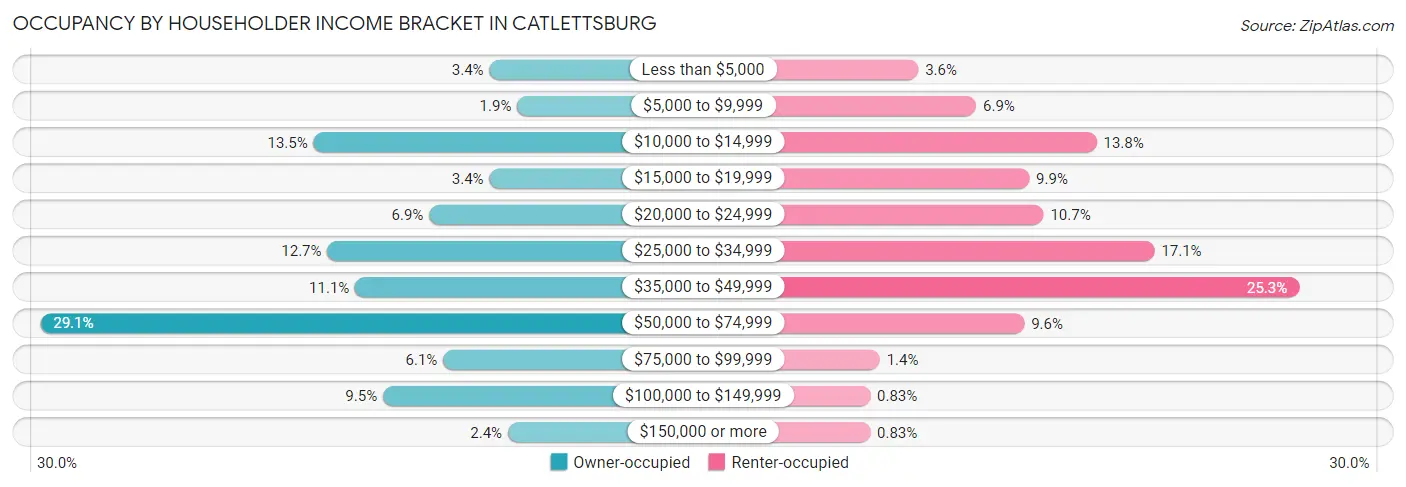
| Income Bracket | Owner-occupied | Renter-occupied |
| Less than $5,000 | 13 (3.4%) | 13 (3.6%) |
| $5,000 to $9,999 | 7 (1.8%) | 25 (6.9%) |
| $10,000 to $14,999 | 51 (13.5%) | 50 (13.8%) |
| $15,000 to $19,999 | 13 (3.4%) | 36 (9.9%) |
| $20,000 to $24,999 | 26 (6.9%) | 39 (10.7%) |
| $25,000 to $34,999 | 48 (12.7%) | 62 (17.1%) |
| $35,000 to $49,999 | 42 (11.1%) | 92 (25.3%) |
| $50,000 to $74,999 | 110 (29.1%) | 35 (9.6%) |
| $75,000 to $99,999 | 23 (6.1%) | 5 (1.4%) |
| $100,000 to $149,999 | 36 (9.5%) | 3 (0.8%) |
| $150,000 or more | 9 (2.4%) | 3 (0.8%) |
| Total | 378 (100.0%) | 363 (100.0%) |
Monthly Housing Cost Tiers in Catlettsburg
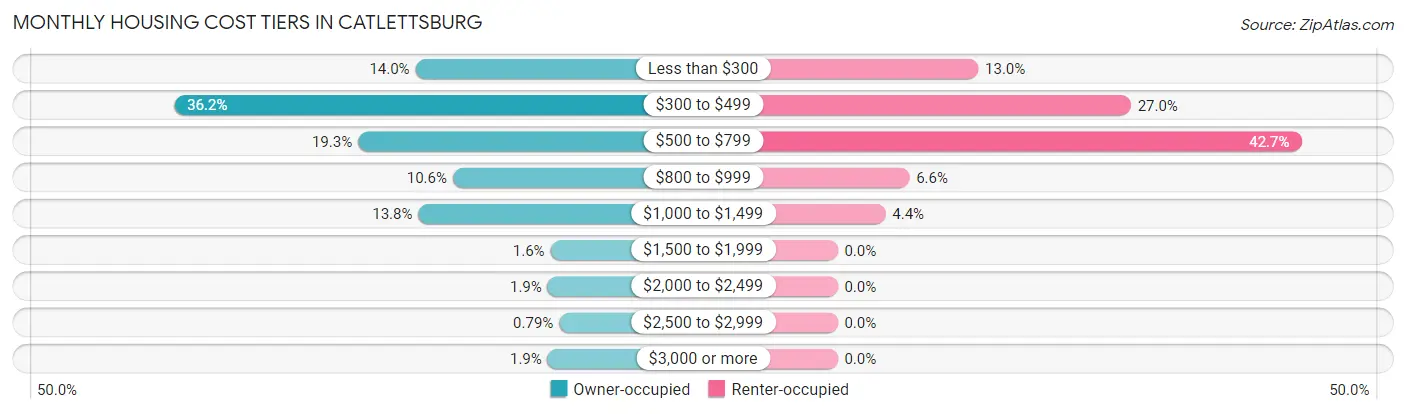
| Monthly Cost | Owner-occupied | Renter-occupied |
| Less than $300 | 53 (14.0%) | 47 (13.0%) |
| $300 to $499 | 137 (36.2%) | 98 (27.0%) |
| $500 to $799 | 73 (19.3%) | 155 (42.7%) |
| $800 to $999 | 40 (10.6%) | 24 (6.6%) |
| $1,000 to $1,499 | 52 (13.8%) | 16 (4.4%) |
| $1,500 to $1,999 | 6 (1.6%) | 0 (0.0%) |
| $2,000 to $2,499 | 7 (1.8%) | 0 (0.0%) |
| $2,500 to $2,999 | 3 (0.8%) | 0 (0.0%) |
| $3,000 or more | 7 (1.8%) | 0 (0.0%) |
| Total | 378 (100.0%) | 363 (100.0%) |
Physical Housing Characteristics in Catlettsburg
Housing Structures in Catlettsburg
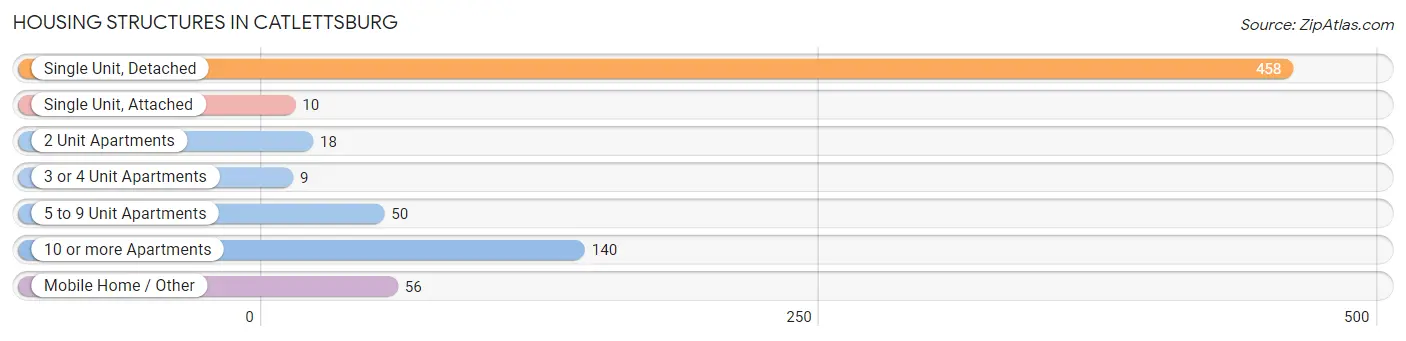
| Structure Type | # Housing Units | % Housing Units |
| Single Unit, Detached | 458 | 61.8% |
| Single Unit, Attached | 10 | 1.3% |
| 2 Unit Apartments | 18 | 2.4% |
| 3 or 4 Unit Apartments | 9 | 1.2% |
| 5 to 9 Unit Apartments | 50 | 6.8% |
| 10 or more Apartments | 140 | 18.9% |
| Mobile Home / Other | 56 | 7.6% |
| Total | 741 | 100.0% |
Housing Structures by Occupancy in Catlettsburg
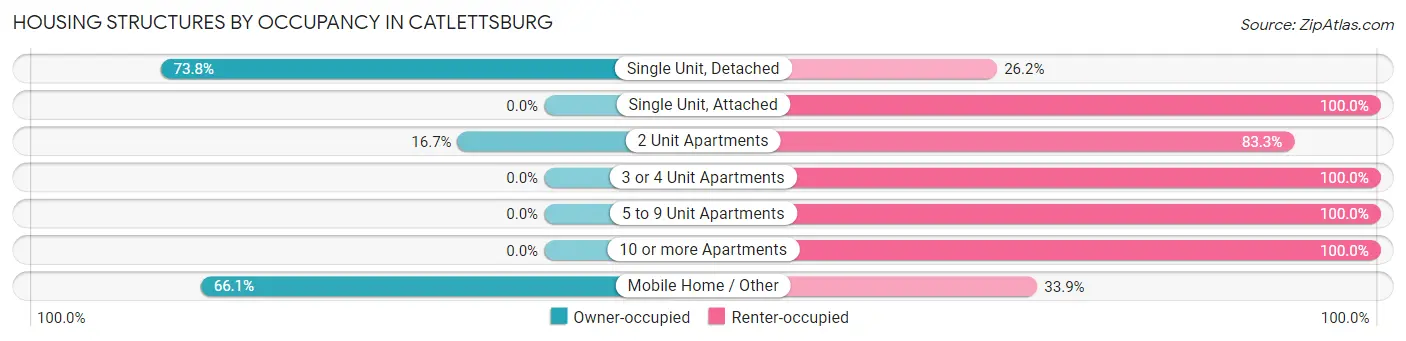
| Structure Type | Owner-occupied | Renter-occupied |
| Single Unit, Detached | 338 (73.8%) | 120 (26.2%) |
| Single Unit, Attached | 0 (0.0%) | 10 (100.0%) |
| 2 Unit Apartments | 3 (16.7%) | 15 (83.3%) |
| 3 or 4 Unit Apartments | 0 (0.0%) | 9 (100.0%) |
| 5 to 9 Unit Apartments | 0 (0.0%) | 50 (100.0%) |
| 10 or more Apartments | 0 (0.0%) | 140 (100.0%) |
| Mobile Home / Other | 37 (66.1%) | 19 (33.9%) |
| Total | 378 (51.0%) | 363 (49.0%) |
Housing Structures by Number of Rooms in Catlettsburg
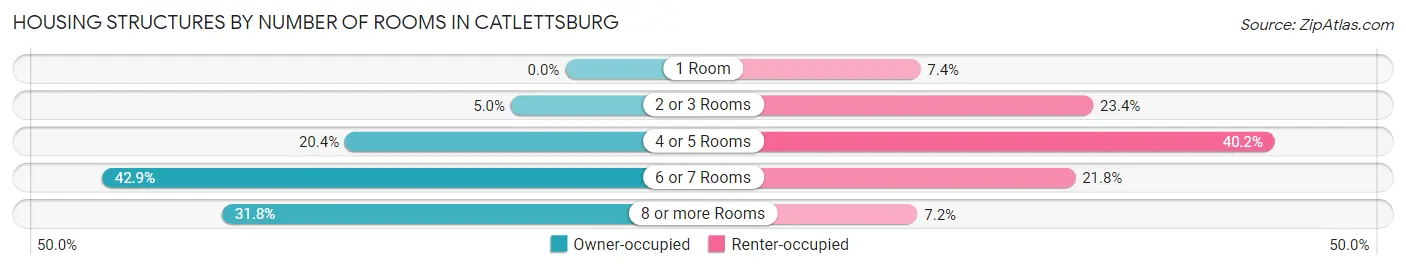
| Number of Rooms | Owner-occupied | Renter-occupied |
| 1 Room | 0 (0.0%) | 27 (7.4%) |
| 2 or 3 Rooms | 19 (5.0%) | 85 (23.4%) |
| 4 or 5 Rooms | 77 (20.4%) | 146 (40.2%) |
| 6 or 7 Rooms | 162 (42.9%) | 79 (21.8%) |
| 8 or more Rooms | 120 (31.8%) | 26 (7.2%) |
| Total | 378 (100.0%) | 363 (100.0%) |
Housing Structure by Heating Type in Catlettsburg
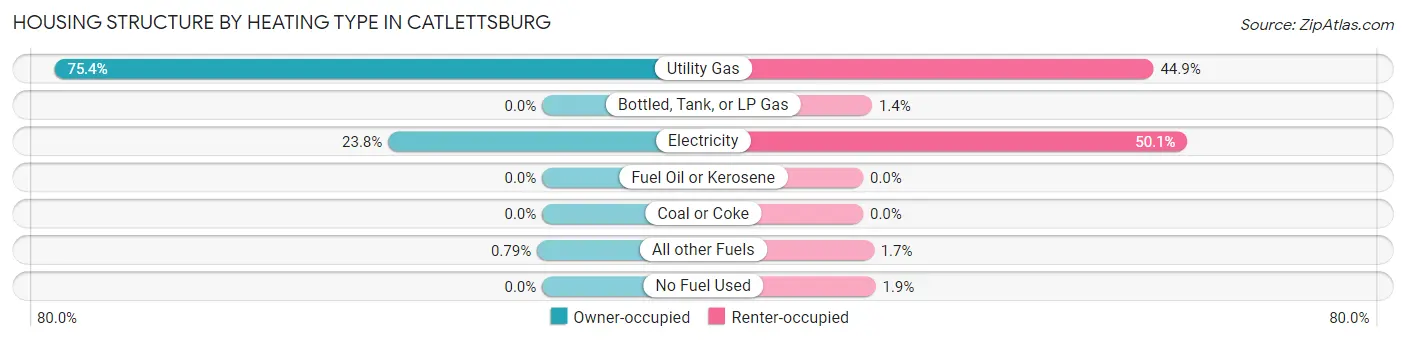
| Heating Type | Owner-occupied | Renter-occupied |
| Utility Gas | 285 (75.4%) | 163 (44.9%) |
| Bottled, Tank, or LP Gas | 0 (0.0%) | 5 (1.4%) |
| Electricity | 90 (23.8%) | 182 (50.1%) |
| Fuel Oil or Kerosene | 0 (0.0%) | 0 (0.0%) |
| Coal or Coke | 0 (0.0%) | 0 (0.0%) |
| All other Fuels | 3 (0.8%) | 6 (1.7%) |
| No Fuel Used | 0 (0.0%) | 7 (1.9%) |
| Total | 378 (100.0%) | 363 (100.0%) |
Household Vehicle Usage in Catlettsburg
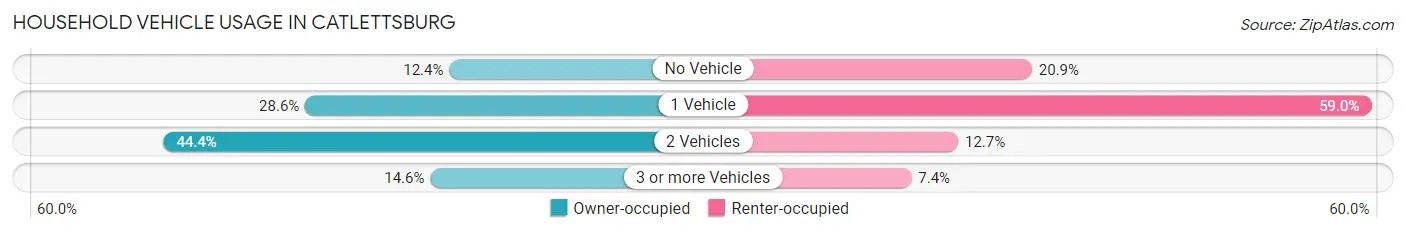
| Vehicles per Household | Owner-occupied | Renter-occupied |
| No Vehicle | 47 (12.4%) | 76 (20.9%) |
| 1 Vehicle | 108 (28.6%) | 214 (59.0%) |
| 2 Vehicles | 168 (44.4%) | 46 (12.7%) |
| 3 or more Vehicles | 55 (14.5%) | 27 (7.4%) |
| Total | 378 (100.0%) | 363 (100.0%) |
Real Estate & Mortgages in Catlettsburg
Real Estate and Mortgage Overview in Catlettsburg
| Characteristic | Without Mortgage | With Mortgage |
| Housing Units | 220 | 158 |
| Median Property Value | $70,100 | $95,000 |
| Median Household Income | $39,583 | $3 |
| Monthly Housing Costs | $428 | $4 |
| Real Estate Taxes | $615 | $12 |
Property Value by Mortgage Status in Catlettsburg
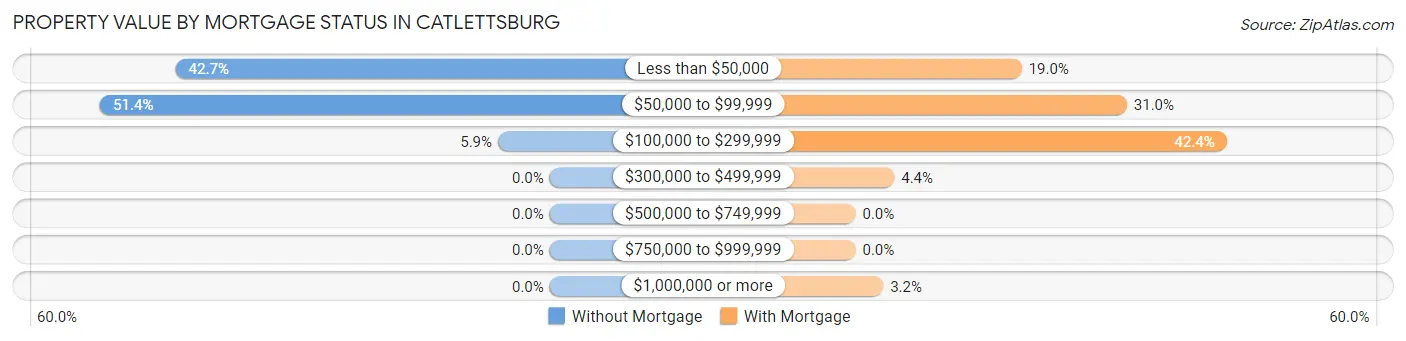
| Property Value | Without Mortgage | With Mortgage |
| Less than $50,000 | 94 (42.7%) | 30 (19.0%) |
| $50,000 to $99,999 | 113 (51.4%) | 49 (31.0%) |
| $100,000 to $299,999 | 13 (5.9%) | 67 (42.4%) |
| $300,000 to $499,999 | 0 (0.0%) | 7 (4.4%) |
| $500,000 to $749,999 | 0 (0.0%) | 0 (0.0%) |
| $750,000 to $999,999 | 0 (0.0%) | 0 (0.0%) |
| $1,000,000 or more | 0 (0.0%) | 5 (3.2%) |
| Total | 220 (100.0%) | 158 (100.0%) |
Household Income by Mortgage Status in Catlettsburg
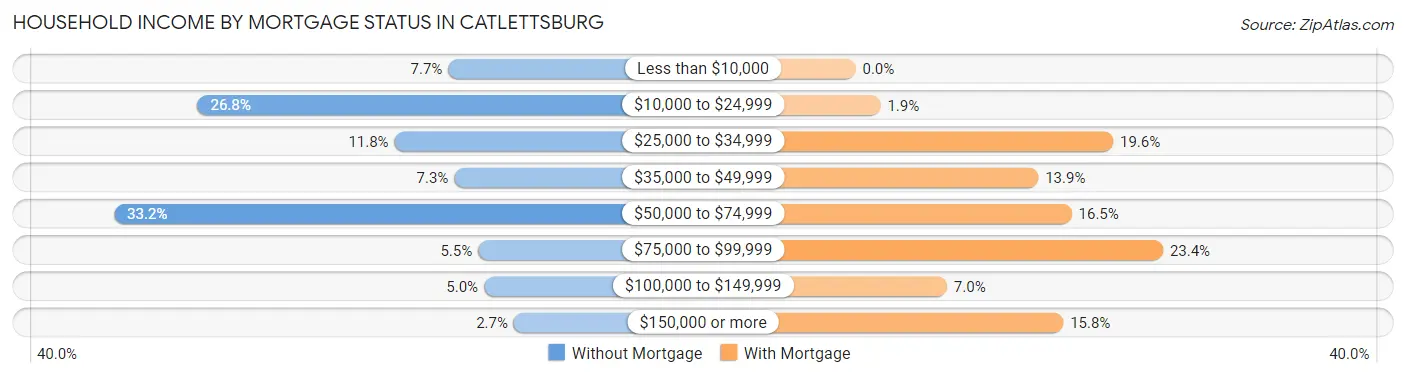
| Household Income | Without Mortgage | With Mortgage |
| Less than $10,000 | 17 (7.7%) | 0 (0.0%) |
| $10,000 to $24,999 | 59 (26.8%) | 3 (1.9%) |
| $25,000 to $34,999 | 26 (11.8%) | 31 (19.6%) |
| $35,000 to $49,999 | 16 (7.3%) | 22 (13.9%) |
| $50,000 to $74,999 | 73 (33.2%) | 26 (16.5%) |
| $75,000 to $99,999 | 12 (5.4%) | 37 (23.4%) |
| $100,000 to $149,999 | 11 (5.0%) | 11 (7.0%) |
| $150,000 or more | 6 (2.7%) | 25 (15.8%) |
| Total | 220 (100.0%) | 158 (100.0%) |
Property Value to Household Income Ratio in Catlettsburg
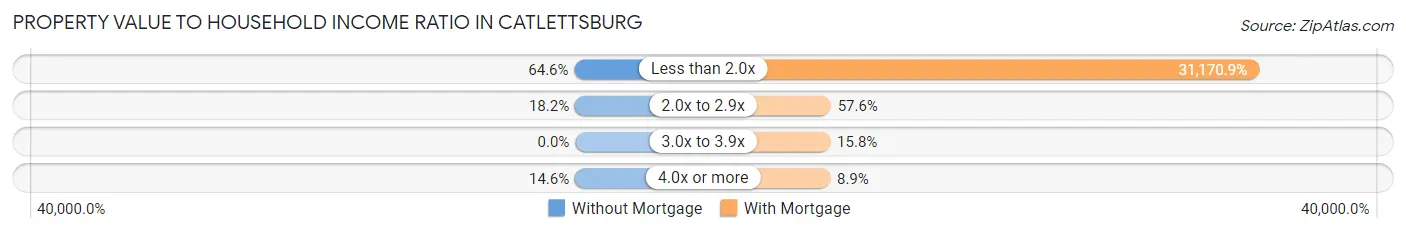
| Value-to-Income Ratio | Without Mortgage | With Mortgage |
| Less than 2.0x | 142 (64.5%) | 49,250 (31,170.9%) |
| 2.0x to 2.9x | 40 (18.2%) | 91 (57.6%) |
| 3.0x to 3.9x | 0 (0.0%) | 25 (15.8%) |
| 4.0x or more | 32 (14.5%) | 14 (8.9%) |
| Total | 220 (100.0%) | 158 (100.0%) |
Real Estate Taxes by Mortgage Status in Catlettsburg
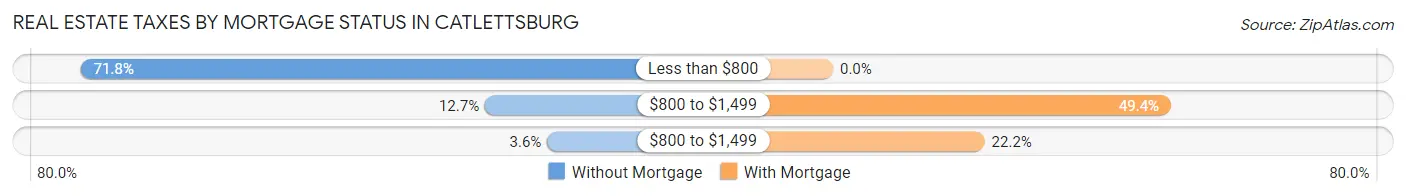
| Property Taxes | Without Mortgage | With Mortgage |
| Less than $800 | 158 (71.8%) | 0 (0.0%) |
| $800 to $1,499 | 28 (12.7%) | 78 (49.4%) |
| $800 to $1,499 | 8 (3.6%) | 35 (22.2%) |
| Total | 220 (100.0%) | 158 (100.0%) |
Health & Disability in Catlettsburg
Health Insurance Coverage by Age in Catlettsburg
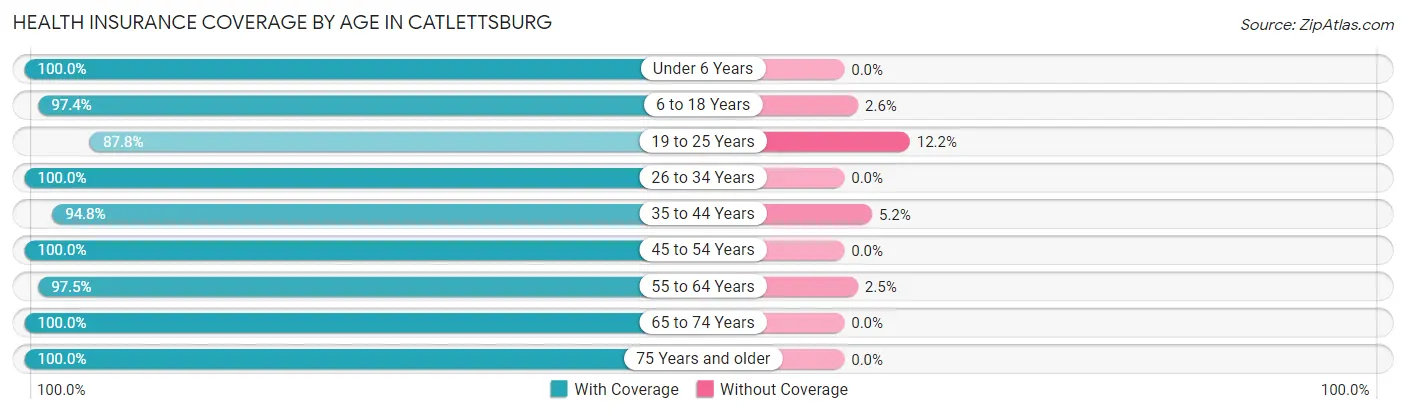
| Age Bracket | With Coverage | Without Coverage |
| Under 6 Years | 138 (100.0%) | 0 (0.0%) |
| 6 to 18 Years | 151 (97.4%) | 4 (2.6%) |
| 19 to 25 Years | 115 (87.8%) | 16 (12.2%) |
| 26 to 34 Years | 104 (100.0%) | 0 (0.0%) |
| 35 to 44 Years | 165 (94.8%) | 9 (5.2%) |
| 45 to 54 Years | 104 (100.0%) | 0 (0.0%) |
| 55 to 64 Years | 192 (97.5%) | 5 (2.5%) |
| 65 to 74 Years | 265 (100.0%) | 0 (0.0%) |
| 75 Years and older | 298 (100.0%) | 0 (0.0%) |
| Total | 1,532 (97.8%) | 34 (2.2%) |
Health Insurance Coverage by Citizenship Status in Catlettsburg
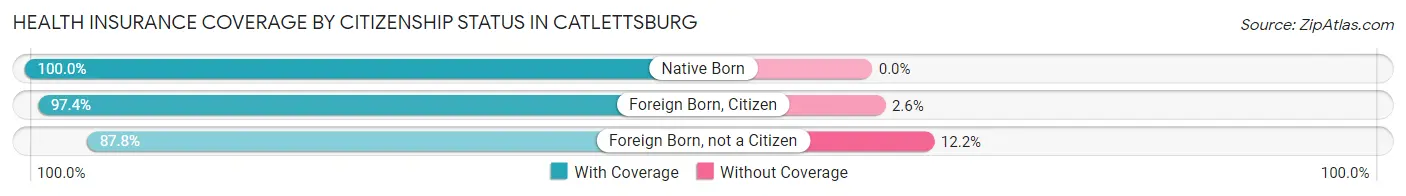
| Citizenship Status | With Coverage | Without Coverage |
| Native Born | 138 (100.0%) | 0 (0.0%) |
| Foreign Born, Citizen | 151 (97.4%) | 4 (2.6%) |
| Foreign Born, not a Citizen | 115 (87.8%) | 16 (12.2%) |
Health Insurance Coverage by Household Income in Catlettsburg
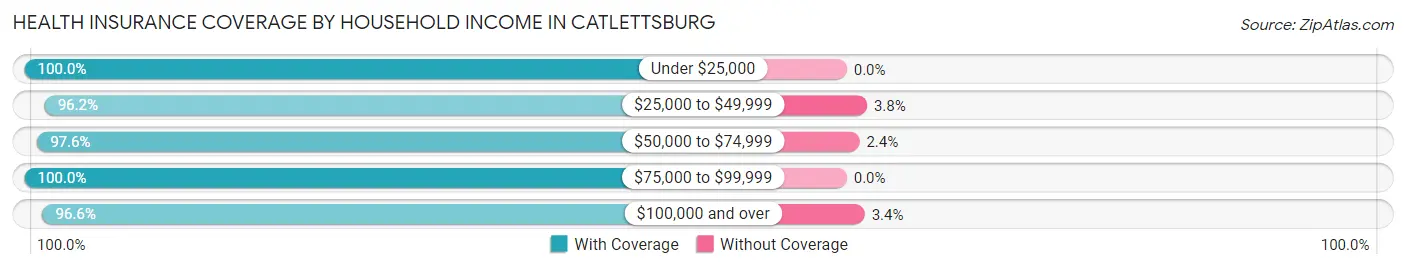
| Household Income | With Coverage | Without Coverage |
| Under $25,000 | 392 (100.0%) | 0 (0.0%) |
| $25,000 to $49,999 | 458 (96.2%) | 18 (3.8%) |
| $50,000 to $74,999 | 453 (97.6%) | 11 (2.4%) |
| $75,000 to $99,999 | 84 (100.0%) | 0 (0.0%) |
| $100,000 and over | 144 (96.6%) | 5 (3.4%) |
Public vs Private Health Insurance Coverage by Age in Catlettsburg
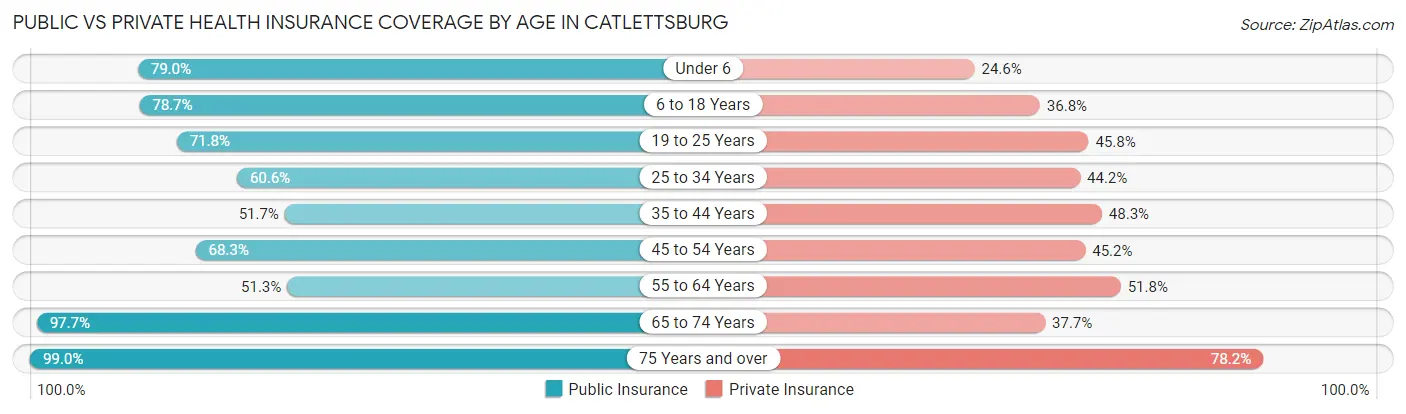
| Age Bracket | Public Insurance | Private Insurance |
| Under 6 | 109 (79.0%) | 34 (24.6%) |
| 6 to 18 Years | 122 (78.7%) | 57 (36.8%) |
| 19 to 25 Years | 94 (71.8%) | 60 (45.8%) |
| 25 to 34 Years | 63 (60.6%) | 46 (44.2%) |
| 35 to 44 Years | 90 (51.7%) | 84 (48.3%) |
| 45 to 54 Years | 71 (68.3%) | 47 (45.2%) |
| 55 to 64 Years | 101 (51.3%) | 102 (51.8%) |
| 65 to 74 Years | 259 (97.7%) | 100 (37.7%) |
| 75 Years and over | 295 (99.0%) | 233 (78.2%) |
| Total | 1,204 (76.9%) | 763 (48.7%) |
Disability Status by Sex by Age in Catlettsburg
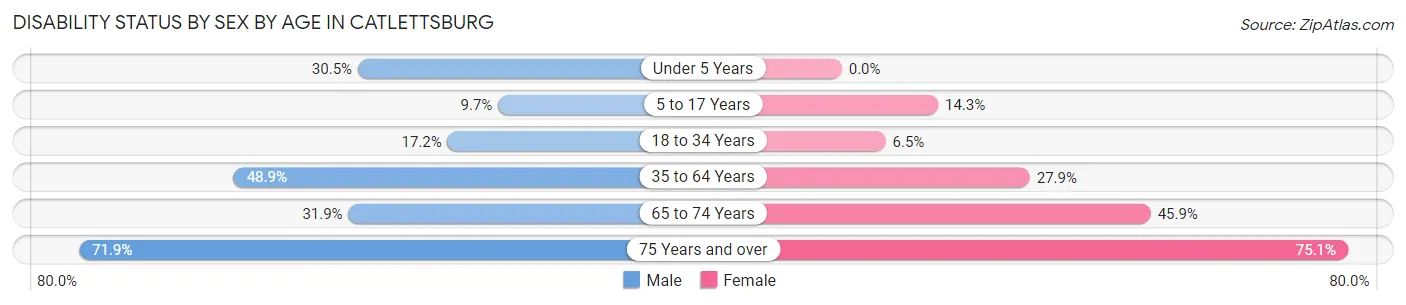
| Age Bracket | Male | Female |
| Under 5 Years | 18 (30.5%) | 0 (0.0%) |
| 5 to 17 Years | 9 (9.7%) | 12 (14.3%) |
| 18 to 34 Years | 22 (17.2%) | 8 (6.5%) |
| 35 to 64 Years | 115 (48.9%) | 67 (27.9%) |
| 65 to 74 Years | 15 (31.9%) | 100 (45.9%) |
| 75 Years and over | 87 (71.9%) | 133 (75.1%) |
Disability Class by Sex by Age in Catlettsburg
Disability Class: Hearing Difficulty
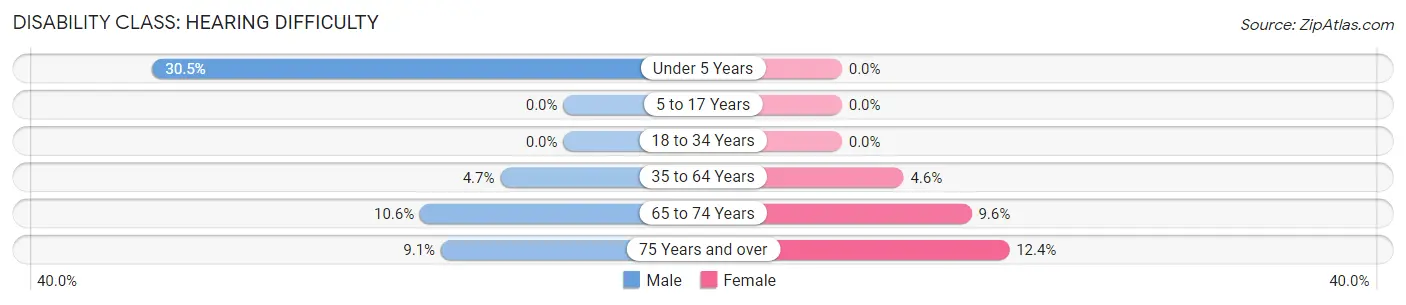
| Age Bracket | Male | Female |
| Under 5 Years | 18 (30.5%) | 0 (0.0%) |
| 5 to 17 Years | 0 (0.0%) | 0 (0.0%) |
| 18 to 34 Years | 0 (0.0%) | 0 (0.0%) |
| 35 to 64 Years | 11 (4.7%) | 11 (4.6%) |
| 65 to 74 Years | 5 (10.6%) | 21 (9.6%) |
| 75 Years and over | 11 (9.1%) | 22 (12.4%) |
Disability Class: Vision Difficulty
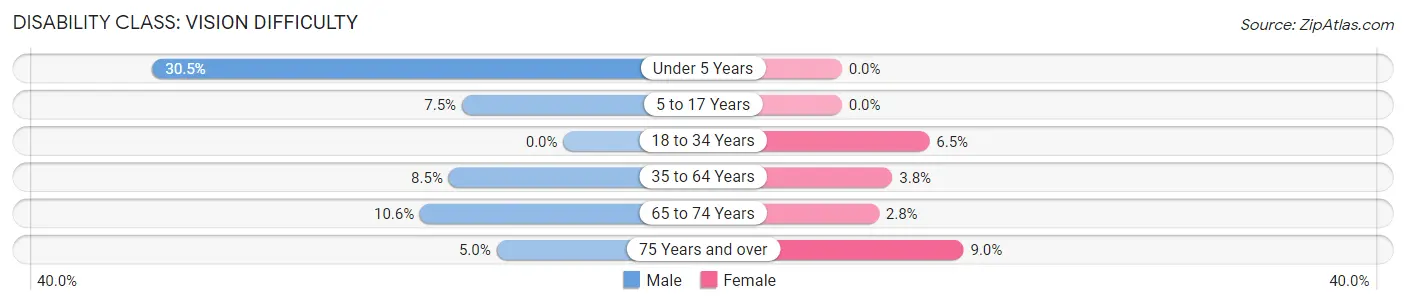
| Age Bracket | Male | Female |
| Under 5 Years | 18 (30.5%) | 0 (0.0%) |
| 5 to 17 Years | 7 (7.5%) | 0 (0.0%) |
| 18 to 34 Years | 0 (0.0%) | 8 (6.5%) |
| 35 to 64 Years | 20 (8.5%) | 9 (3.7%) |
| 65 to 74 Years | 5 (10.6%) | 6 (2.8%) |
| 75 Years and over | 6 (5.0%) | 16 (9.0%) |
Disability Class: Cognitive Difficulty
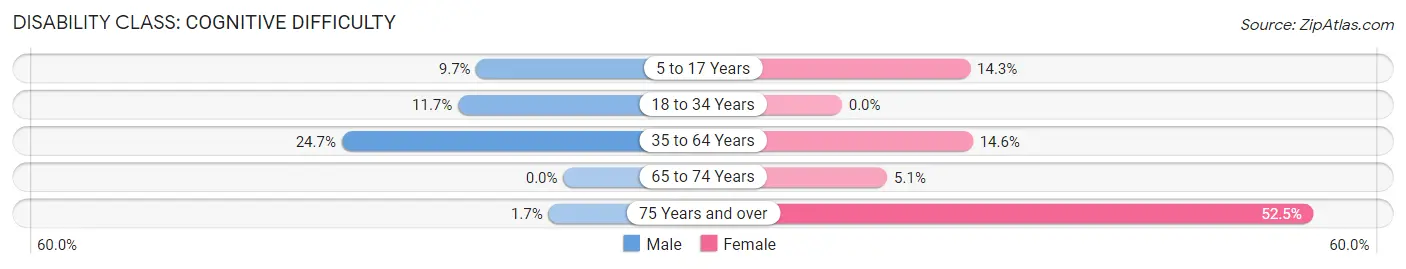
| Age Bracket | Male | Female |
| 5 to 17 Years | 9 (9.7%) | 12 (14.3%) |
| 18 to 34 Years | 15 (11.7%) | 0 (0.0%) |
| 35 to 64 Years | 58 (24.7%) | 35 (14.6%) |
| 65 to 74 Years | 0 (0.0%) | 11 (5.1%) |
| 75 Years and over | 2 (1.7%) | 93 (52.5%) |
Disability Class: Ambulatory Difficulty
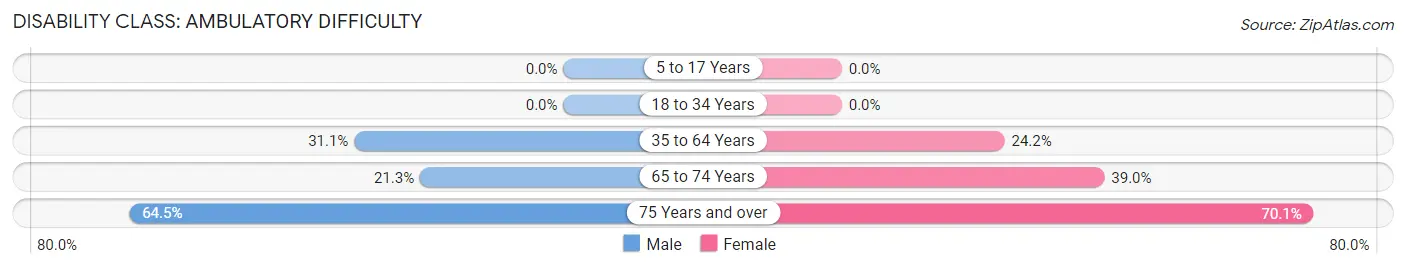
| Age Bracket | Male | Female |
| 5 to 17 Years | 0 (0.0%) | 0 (0.0%) |
| 18 to 34 Years | 0 (0.0%) | 0 (0.0%) |
| 35 to 64 Years | 73 (31.1%) | 58 (24.2%) |
| 65 to 74 Years | 10 (21.3%) | 85 (39.0%) |
| 75 Years and over | 78 (64.5%) | 124 (70.1%) |
Disability Class: Self-Care Difficulty
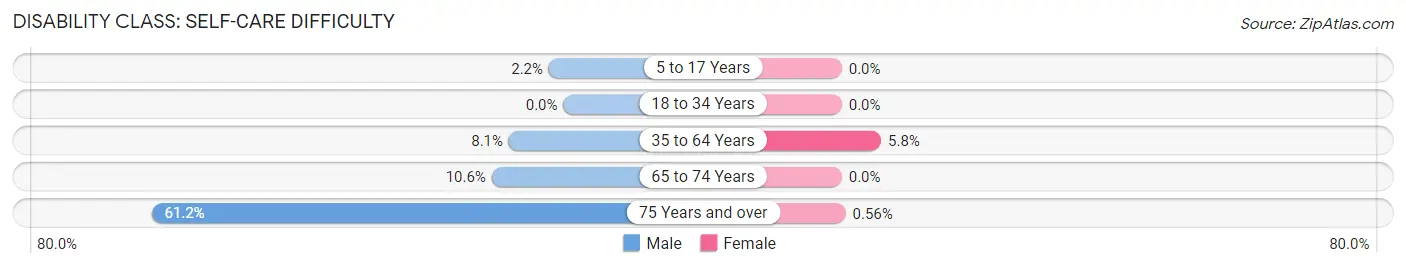
| Age Bracket | Male | Female |
| 5 to 17 Years | 2 (2.1%) | 0 (0.0%) |
| 18 to 34 Years | 0 (0.0%) | 0 (0.0%) |
| 35 to 64 Years | 19 (8.1%) | 14 (5.8%) |
| 65 to 74 Years | 5 (10.6%) | 0 (0.0%) |
| 75 Years and over | 74 (61.2%) | 1 (0.6%) |
Technology Access in Catlettsburg
Computing Device Access in Catlettsburg
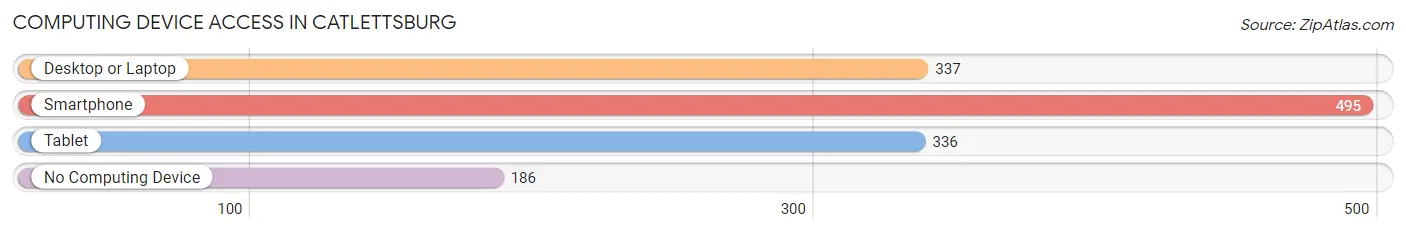
| Device Type | # Households | % Households |
| Desktop or Laptop | 337 | 45.5% |
| Smartphone | 495 | 66.8% |
| Tablet | 336 | 45.3% |
| No Computing Device | 186 | 25.1% |
| Total | 741 | 100.0% |
Internet Access in Catlettsburg
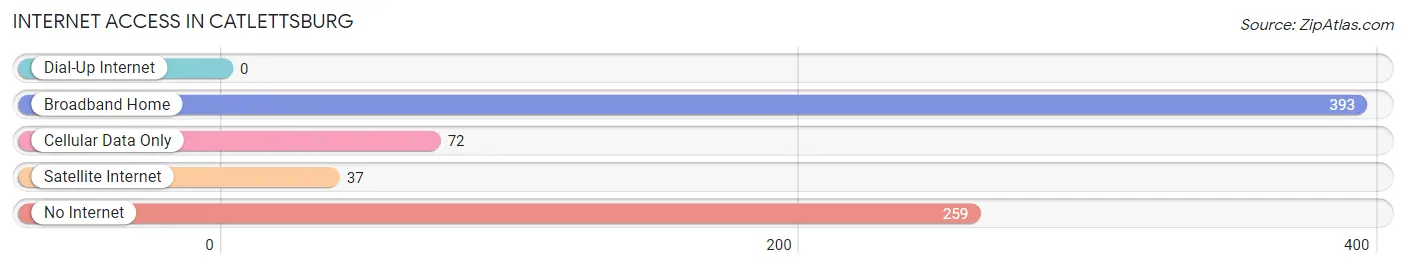
| Internet Type | # Households | % Households |
| Dial-Up Internet | 0 | 0.0% |
| Broadband Home | 393 | 53.0% |
| Cellular Data Only | 72 | 9.7% |
| Satellite Internet | 37 | 5.0% |
| No Internet | 259 | 34.9% |
| Total | 741 | 100.0% |
Catlettsburg Summary
Catlettsburg, Kentucky is a small city located in Boyd County, Kentucky, United States. It is situated along the Big Sandy River, near the border of West Virginia. The city is part of the Huntington-Ashland Metropolitan Statistical Area, which is the second largest metropolitan area in Kentucky. As of the 2010 census, the city had a population of 2,368.
History
Catlettsburg was founded in 1820 by William Catlett, a Revolutionary War veteran. The city was originally known as Catlett's Station, and was a stop on the Big Sandy River. In 1854, the city was officially incorporated as Catlettsburg.
The city was an important port on the Big Sandy River, and was a major hub for the steamboat trade. During the Civil War, Catlettsburg was a major supply center for the Confederate Army. After the war, the city continued to be an important port, and was a major center for the timber and coal industries.
In the late 19th century, Catlettsburg was home to several large distilleries, including the Catlettsburg Distillery, which was the largest distillery in the United States at the time. The distillery was destroyed by fire in 1891, but was rebuilt and continued to operate until the early 20th century.
Geography
Catlettsburg is located at 38°20'25" North, 82°37'45" West (38.340278, -82.629167). The city is situated along the Big Sandy River, near the border of West Virginia. The city has a total area of 1.3 square miles, all of which is land.
Economy
Catlettsburg is home to several large industries, including Marathon Petroleum, which operates a large oil refinery in the city. The city is also home to several other industries, including a steel mill, a paper mill, and a chemical plant.
The city is also home to several retail stores, restaurants, and other businesses. The city is served by the Catlettsburg-Boyd County Airport, which provides general aviation services.
Demographics
As of the 2010 census, there were 2,368 people, 990 households, and 645 families residing in the city. The population density was 1,817.2 people per square mile. The racial makeup of the city was 95.2% White, 1.7% African American, 0.2% Native American, 0.7% Asian, 0.1% Pacific Islander, 0.7% from other races, and 1.4% from two or more races. Hispanic or Latino of any race were 1.7% of the population.
There were 990 households, out of which 28.2% had children under the age of 18 living with them, 43.3% were married couples living together, 15.3% had a female householder with no husband present, and 36.4% were non-families. 32.2% of all households were made up of individuals, and 14.2% had someone living alone who was 65 years of age or older. The average household size was 2.35 and the average family size was 2.93.
In the city, the population was spread out, with 24.2% under the age of 18, 8.2% from 18 to 24, 27.2% from 25 to 44, 24.2% from 45 to 64, and 16.2% who were 65 years of age or older. The median age was 38 years. For every 100 females, there were 87.2 males. For every 100 females age 18 and over, there were 83.2 males.
The median income for a household in the city was $30,938, and the median income for a family was $37,813. Males had a median income of $31,964 versus $21,917 for females. The per capita income for the city was $16,945. About 13.2% of families and 16.2% of the population were below the poverty line, including 22.2% of those under age 18 and 11.2% of those age 65 or over.
Common Questions
What is Per Capita Income in Catlettsburg?
Per Capita income in Catlettsburg is $20,549.
What is the Median Family Income in Catlettsburg?
Median Family Income in Catlettsburg is $50,037.
What is the Median Household income in Catlettsburg?
Median Household Income in Catlettsburg is $33,047.
What is Income or Wage Gap in Catlettsburg?
Income or Wage Gap in Catlettsburg is 40.3%.
Women in Catlettsburg earn 59.7 cents for every dollar earned by a man.
What is Family Income Deficit in Catlettsburg?
Family Income Deficit in Catlettsburg is $10,324.
Families that are below poverty line in Catlettsburg earn $10,324 less on average than the poverty threshold level.
What is Inequality or Gini Index in Catlettsburg?
Inequality or Gini Index in Catlettsburg is 0.47.
What is the Total Population of Catlettsburg?
Total Population of Catlettsburg is 1,782.
What is the Total Male Population of Catlettsburg?
Total Male Population of Catlettsburg is 858.
What is the Total Female Population of Catlettsburg?
Total Female Population of Catlettsburg is 924.
What is the Ratio of Males per 100 Females in Catlettsburg?
There are 92.86 Males per 100 Females in Catlettsburg.
What is the Ratio of Females per 100 Males in Catlettsburg?
There are 107.69 Females per 100 Males in Catlettsburg.
What is the Median Population Age in Catlettsburg?
Median Population Age in Catlettsburg is 48.0 Years.
What is the Average Family Size in Catlettsburg
Average Family Size in Catlettsburg is 2.8 People.
What is the Average Household Size in Catlettsburg
Average Household Size in Catlettsburg is 2.1 People.
How Large is the Labor Force in Catlettsburg?
There are 485 People in the Labor Forcein in Catlettsburg.
What is the Percentage of People in the Labor Force in Catlettsburg?
31.7% of People are in the Labor Force in Catlettsburg.
What is the Unemployment Rate in Catlettsburg?
Unemployment Rate in Catlettsburg is 10.7%.