Livingston, KY Map & Demographics
Livingston Map
Livingston Overview
$15,907
PER CAPITA INCOME
0.43
INEQUALITY / GINI INDEX
158
TOTAL POPULATION
62
MALE POPULATION
96
FEMALE POPULATION
64.58
MALES / 100 FEMALES
154.84
FEMALES / 100 MALES
39.0
MEDIAN AGE
3.8
AVG FAMILY SIZE
2.2
AVG HOUSEHOLD SIZE
50
LABOR FORCE [ PEOPLE ]
38.2%
PERCENT IN LABOR FORCE
Livingston Zip Codes
Livingston Area Codes
Income in Livingston
Income Overview in Livingston
| Characteristic | Number | Measure |
| Per Capita Income | 158 | $15,907 |
| Median Family Income | 27 | $0 |
| Mean Family Income | 27 | $48,630 |
| Median Household Income | 71 | $0 |
| Mean Household Income | 71 | $33,635 |
| Income Deficit | 27 | $0 |
| Wage / Income Gap (%) | 158 | 0.00% |
| Wage / Income Gap ($) | 158 | 100.00¢ per $1 |
| Gini / Inequality Index | 158 | 0.43 |
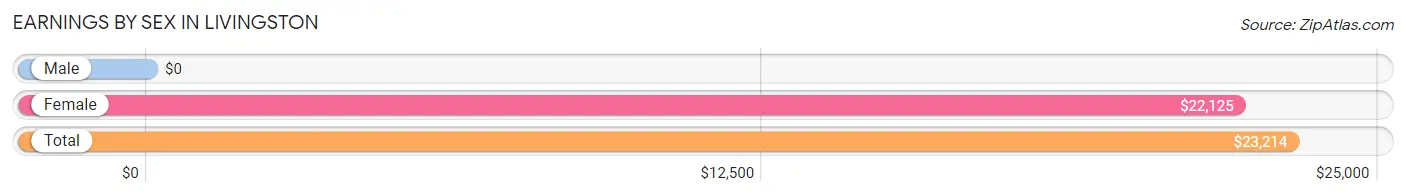
Earnings by Sex in Livingston
| Sex | Number | Average Earnings |
| Male | 31 (50.0%) | $0 |
| Female | 31 (50.0%) | $22,125 |
| Total | 62 (100.0%) | $23,214 |
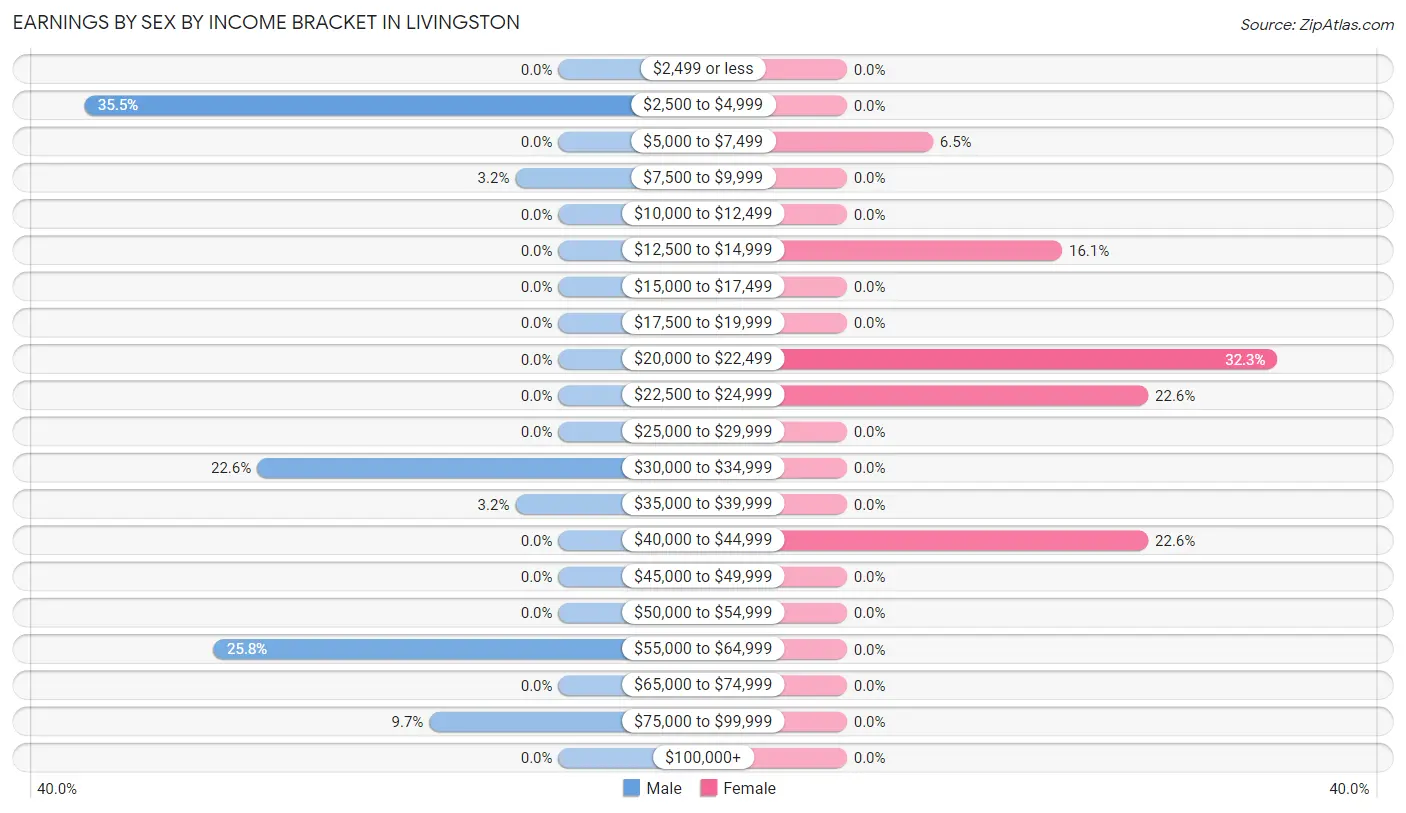
Earnings by Sex by Income Bracket in Livingston
The most common earnings brackets in Livingston are $2,500 to $4,999 for men (11 | 35.5%) and $20,000 to $22,499 for women (10 | 32.3%).
| Income | Male | Female |
| $2,499 or less | 0 (0.0%) | 0 (0.0%) |
| $2,500 to $4,999 | 11 (35.5%) | 0 (0.0%) |
| $5,000 to $7,499 | 0 (0.0%) | 2 (6.5%) |
| $7,500 to $9,999 | 1 (3.2%) | 0 (0.0%) |
| $10,000 to $12,499 | 0 (0.0%) | 0 (0.0%) |
| $12,500 to $14,999 | 0 (0.0%) | 5 (16.1%) |
| $15,000 to $17,499 | 0 (0.0%) | 0 (0.0%) |
| $17,500 to $19,999 | 0 (0.0%) | 0 (0.0%) |
| $20,000 to $22,499 | 0 (0.0%) | 10 (32.3%) |
| $22,500 to $24,999 | 0 (0.0%) | 7 (22.6%) |
| $25,000 to $29,999 | 0 (0.0%) | 0 (0.0%) |
| $30,000 to $34,999 | 7 (22.6%) | 0 (0.0%) |
| $35,000 to $39,999 | 1 (3.2%) | 0 (0.0%) |
| $40,000 to $44,999 | 0 (0.0%) | 7 (22.6%) |
| $45,000 to $49,999 | 0 (0.0%) | 0 (0.0%) |
| $50,000 to $54,999 | 0 (0.0%) | 0 (0.0%) |
| $55,000 to $64,999 | 8 (25.8%) | 0 (0.0%) |
| $65,000 to $74,999 | 0 (0.0%) | 0 (0.0%) |
| $75,000 to $99,999 | 3 (9.7%) | 0 (0.0%) |
| $100,000+ | 0 (0.0%) | 0 (0.0%) |
| Total | 31 (100.0%) | 31 (100.0%) |
Earnings by Sex by Educational Attainment in Livingston
| Educational Attainment | Male Income | Female Income |
| Less than High School | - | - |
| High School Diploma | - | - |
| College or Associate's Degree | - | - |
| Bachelor's Degree | - | - |
| Graduate Degree | - | - |
| Total | - | - |
Family Income in Livingston
Family Income Brackets in Livingston
According to the Livingston family income data, there are 8 families falling into the $50,000 to $74,999 income range, which is the most common income bracket and makes up 29.6% of all families.
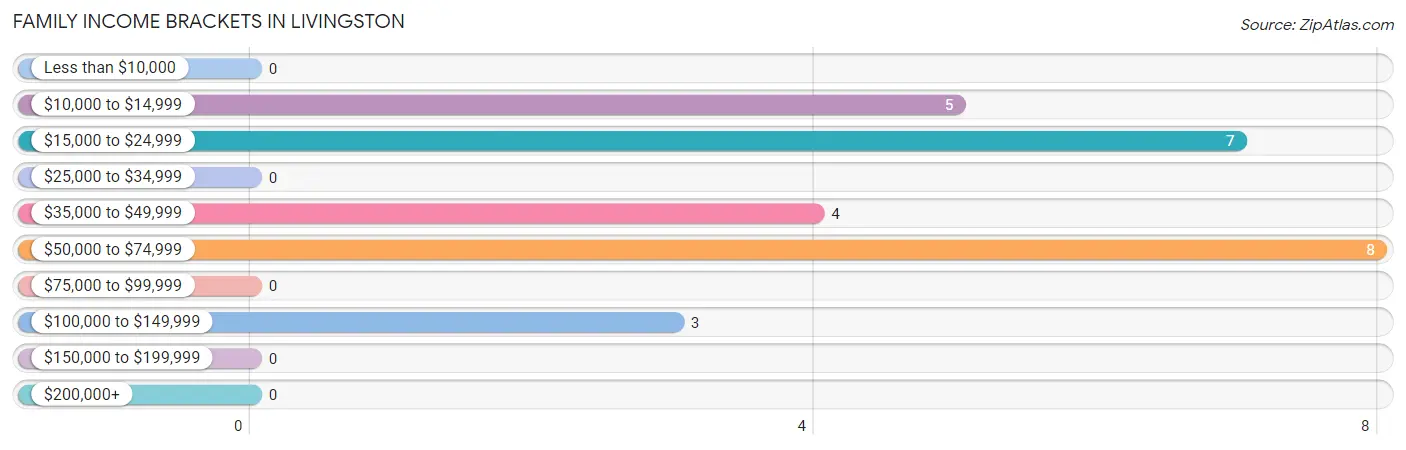
| Income Bracket | # Families | % Families |
| Less than $10,000 | 0 | 0.0% |
| $10,000 to $14,999 | 5 | 18.5% |
| $15,000 to $24,999 | 7 | 25.9% |
| $25,000 to $34,999 | 0 | 0.0% |
| $35,000 to $49,999 | 4 | 14.8% |
| $50,000 to $74,999 | 8 | 29.6% |
| $75,000 to $99,999 | 0 | 0.0% |
| $100,000 to $149,999 | 3 | 11.1% |
| $150,000 to $199,999 | 0 | 0.0% |
| $200,000+ | 0 | 0.0% |
Family Income by Famaliy Size in Livingston
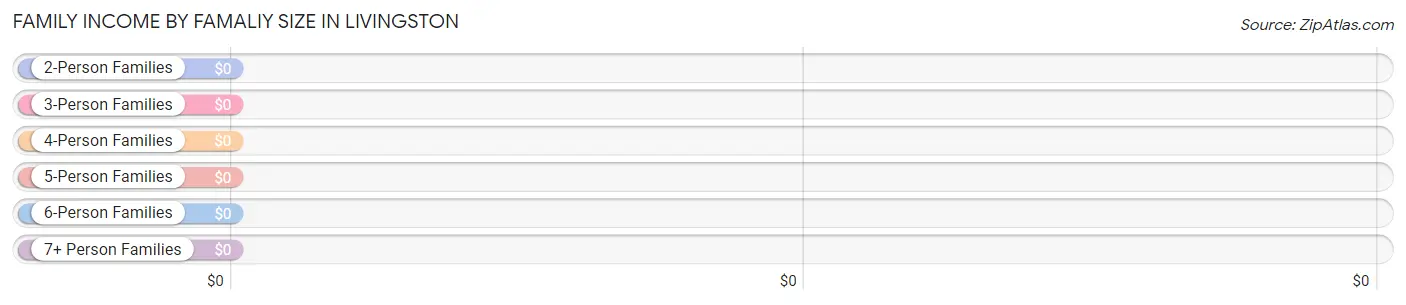
| Income Bracket | # Families | Median Income |
| 2-Person Families | 5 (18.5%) | $0 |
| 3-Person Families | 5 (18.5%) | $0 |
| 4-Person Families | 10 (37.0%) | $0 |
| 5-Person Families | 7 (25.9%) | $0 |
| 6-Person Families | 0 (0.0%) | $0 |
| 7+ Person Families | 0 (0.0%) | $0 |
| Total | 27 (100.0%) | $0 |
Family Income by Number of Earners in Livingston
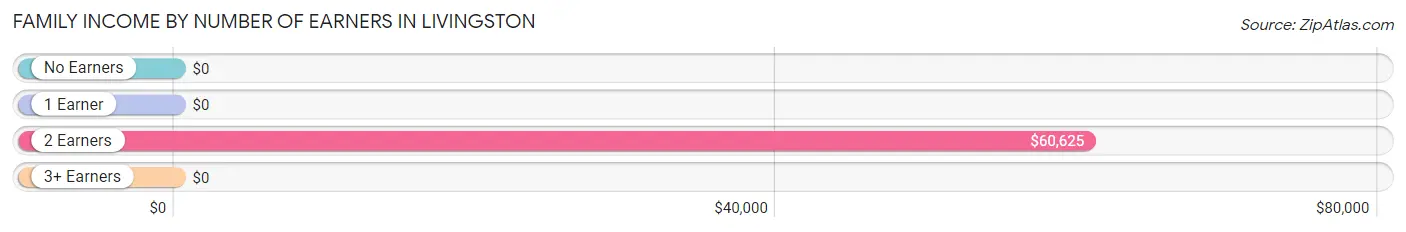
| Number of Earners | # Families | Median Income |
| No Earners | 4 (14.8%) | $0 |
| 1 Earner | 5 (18.5%) | $0 |
| 2 Earners | 18 (66.7%) | $60,625 |
| 3+ Earners | 0 (0.0%) | $0 |
| Total | 27 (100.0%) | $0 |
Household Income in Livingston
Household Income Brackets in Livingston
With 23 households falling in the category, the $10,000 to $14,999 income range is the most frequent in Livingston, accounting for 32.4% of all households.
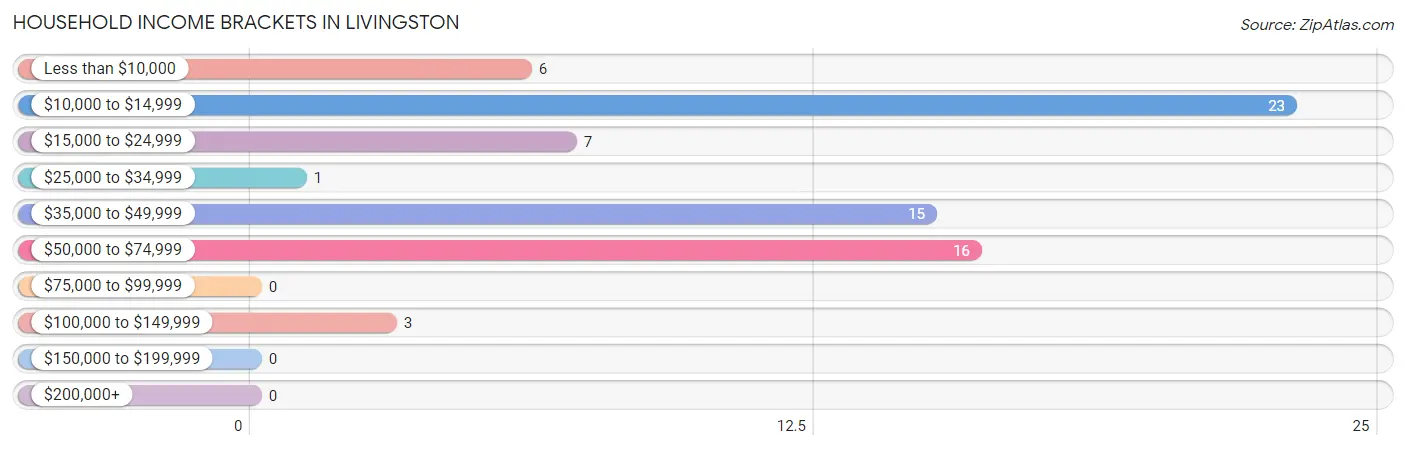
| Income Bracket | # Households | % Households |
| Less than $10,000 | 6 | 8.5% |
| $10,000 to $14,999 | 23 | 32.4% |
| $15,000 to $24,999 | 7 | 9.9% |
| $25,000 to $34,999 | 1 | 1.4% |
| $35,000 to $49,999 | 15 | 21.1% |
| $50,000 to $74,999 | 16 | 22.5% |
| $75,000 to $99,999 | 0 | 0.0% |
| $100,000 to $149,999 | 3 | 4.2% |
| $150,000 to $199,999 | 0 | 0.0% |
| $200,000+ | 0 | 0.0% |
Household Income by Householder Age in Livingston
The median household income in Livingston is $0, with the highest median household income of $11,528 found in the 65+ years age bracket for the primary householder. A total of 15 households (21.1%) fall into this category.
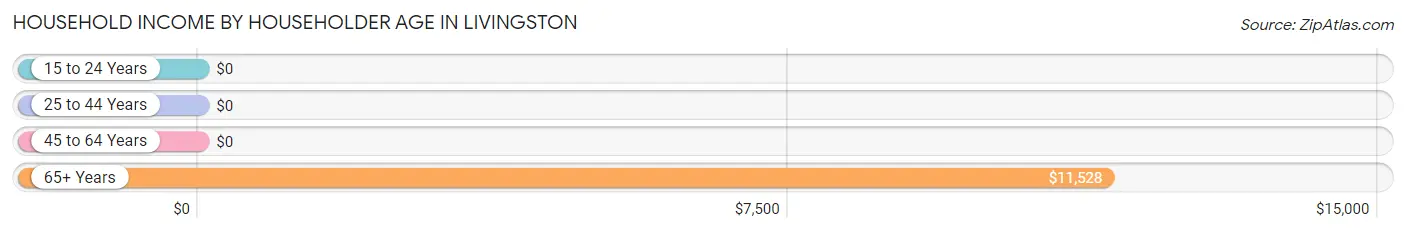
| Income Bracket | # Households | Median Income |
| 15 to 24 Years | 0 (0.0%) | $0 |
| 25 to 44 Years | 10 (14.1%) | $0 |
| 45 to 64 Years | 46 (64.8%) | $0 |
| 65+ Years | 15 (21.1%) | $11,528 |
| Total | 71 (100.0%) | $0 |
Poverty in Livingston
Income Below Poverty by Sex and Age in Livingston
With 40.3% poverty level for males and 55.2% for females among the residents of Livingston, 16 and 17 year old males and 18 to 24 year old females are the most vulnerable to poverty, with 4 males (100.0%) and 6 females (100.0%) in their respective age groups living below the poverty level.
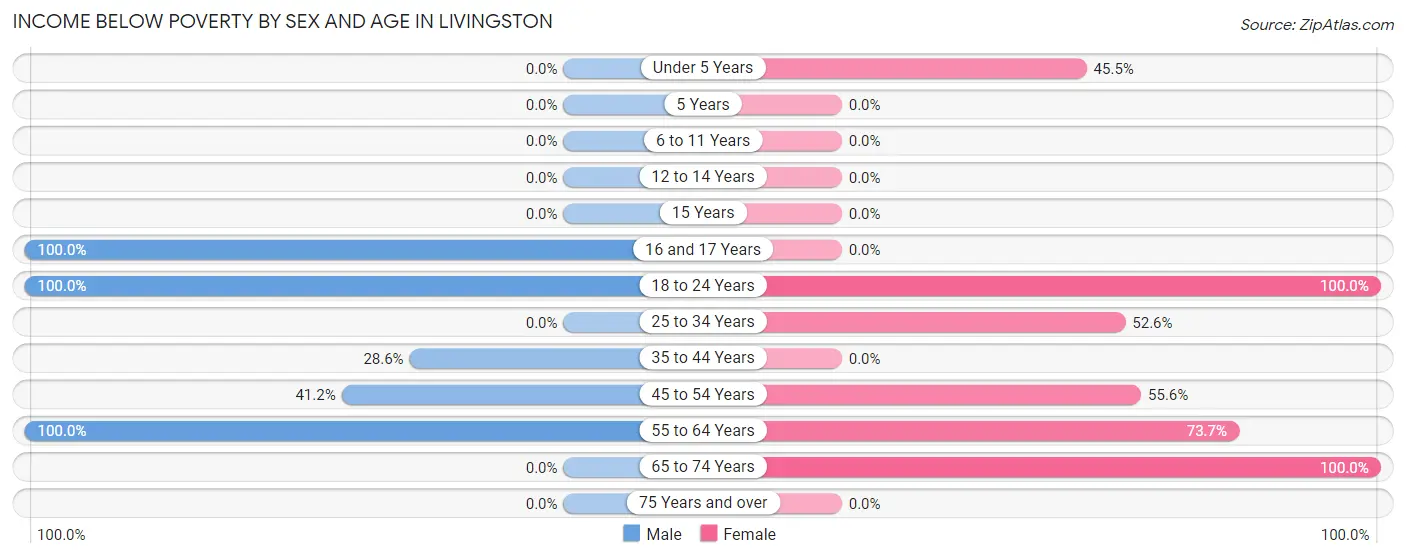
| Age Bracket | Male | Female |
| Under 5 Years | 0 (0.0%) | 5 (45.5%) |
| 5 Years | 0 (0.0%) | 0 (0.0%) |
| 6 to 11 Years | 0 (0.0%) | 0 (0.0%) |
| 12 to 14 Years | 0 (0.0%) | 0 (0.0%) |
| 15 Years | 0 (0.0%) | 0 (0.0%) |
| 16 and 17 Years | 4 (100.0%) | 0 (0.0%) |
| 18 to 24 Years | 8 (100.0%) | 6 (100.0%) |
| 25 to 34 Years | 0 (0.0%) | 10 (52.6%) |
| 35 to 44 Years | 4 (28.6%) | 0 (0.0%) |
| 45 to 54 Years | 7 (41.2%) | 5 (55.6%) |
| 55 to 64 Years | 2 (100.0%) | 14 (73.7%) |
| 65 to 74 Years | 0 (0.0%) | 13 (100.0%) |
| 75 Years and over | 0 (0.0%) | 0 (0.0%) |
| Total | 25 (40.3%) | 53 (55.2%) |
Income Above Poverty by Sex and Age in Livingston
According to the poverty statistics in Livingston, males aged 6 to 11 years and females aged 6 to 11 years are the age groups that are most secure financially, with 100.0% of males and 100.0% of females in these age groups living above the poverty line.
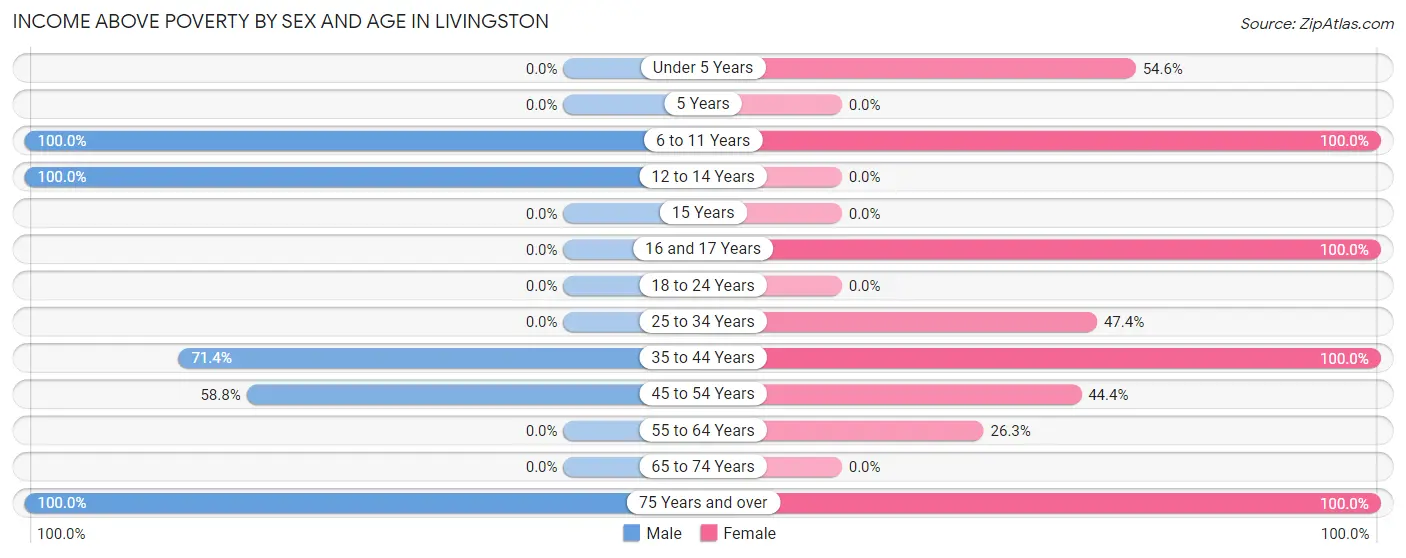
| Age Bracket | Male | Female |
| Under 5 Years | 0 (0.0%) | 6 (54.5%) |
| 5 Years | 0 (0.0%) | 0 (0.0%) |
| 6 to 11 Years | 8 (100.0%) | 5 (100.0%) |
| 12 to 14 Years | 3 (100.0%) | 0 (0.0%) |
| 15 Years | 0 (0.0%) | 0 (0.0%) |
| 16 and 17 Years | 0 (0.0%) | 4 (100.0%) |
| 18 to 24 Years | 0 (0.0%) | 0 (0.0%) |
| 25 to 34 Years | 0 (0.0%) | 9 (47.4%) |
| 35 to 44 Years | 10 (71.4%) | 3 (100.0%) |
| 45 to 54 Years | 10 (58.8%) | 4 (44.4%) |
| 55 to 64 Years | 0 (0.0%) | 5 (26.3%) |
| 65 to 74 Years | 0 (0.0%) | 0 (0.0%) |
| 75 Years and over | 6 (100.0%) | 7 (100.0%) |
| Total | 37 (59.7%) | 43 (44.8%) |
Income Below Poverty Among Married-Couple Families in Livingston
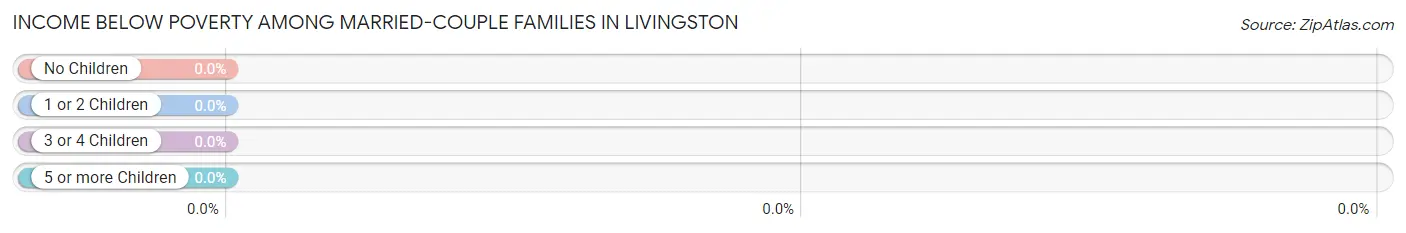
| Children | Above Poverty | Below Poverty |
| No Children | 1 (100.0%) | 0 (0.0%) |
| 1 or 2 Children | 3 (100.0%) | 0 (0.0%) |
| 3 or 4 Children | 7 (100.0%) | 0 (0.0%) |
| 5 or more Children | 0 (0.0%) | 0 (0.0%) |
| Total | 11 (100.0%) | 0 (0.0%) |
Income Below Poverty Among Single-Parent Households in Livingston
According to the poverty data in Livingston, 100.0% or 7 single-father households and 55.6% or 5 single-mother households are living below the poverty line. Among single-father households, those with 1 or 2 children have the highest poverty rate, with 7 households (100.0%) experiencing poverty. Likewise, among single-mother households, those with 1 or 2 children have the highest poverty rate, with 5 households (100.0%) falling below the poverty line.
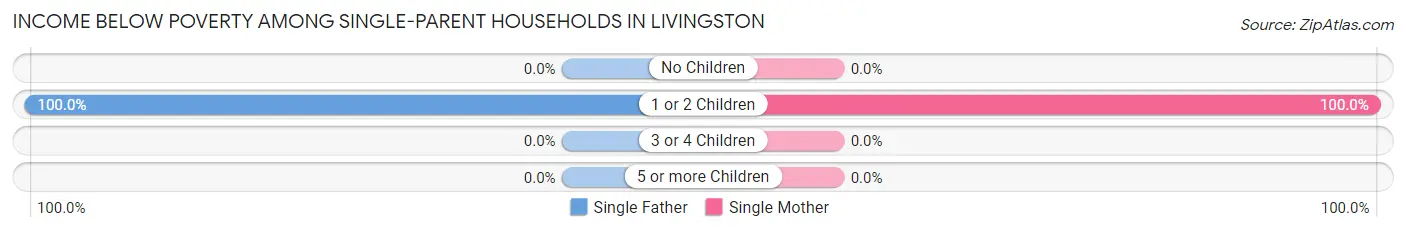
| Children | Single Father | Single Mother |
| No Children | 0 (0.0%) | 0 (0.0%) |
| 1 or 2 Children | 7 (100.0%) | 5 (100.0%) |
| 3 or 4 Children | 0 (0.0%) | 0 (0.0%) |
| 5 or more Children | 0 (0.0%) | 0 (0.0%) |
| Total | 7 (100.0%) | 5 (55.6%) |
Income Below Poverty Among Married-Couple vs Single-Parent Households in Livingston
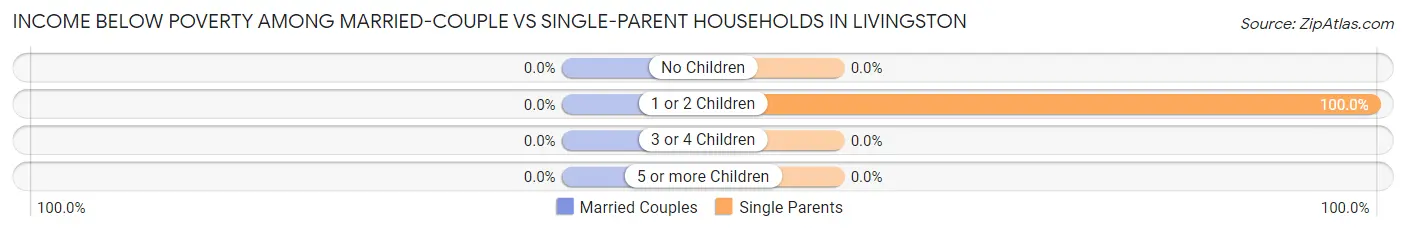
| Children | Married-Couple Families | Single-Parent Households |
| No Children | 0 (0.0%) | 0 (0.0%) |
| 1 or 2 Children | 0 (0.0%) | 12 (100.0%) |
| 3 or 4 Children | 0 (0.0%) | 0 (0.0%) |
| 5 or more Children | 0 (0.0%) | 0 (0.0%) |
| Total | 0 (0.0%) | 12 (75.0%) |
Race in Livingston
The most populous races in Livingston are , and White / Caucasian (158 | 100.0%).
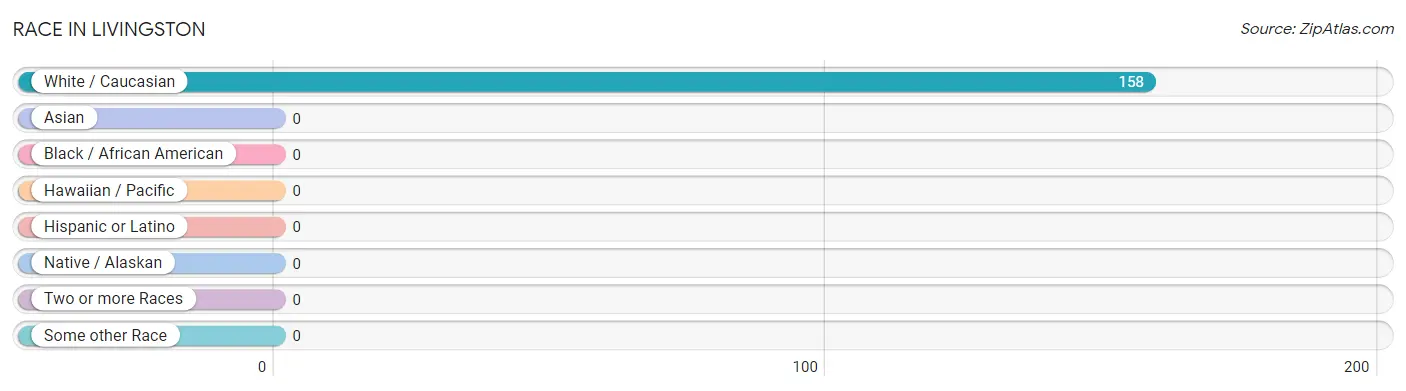
| Race | # Population | % Population |
| Asian | 0 | 0.0% |
| Black / African American | 0 | 0.0% |
| Hawaiian / Pacific | 0 | 0.0% |
| Hispanic or Latino | 0 | 0.0% |
| Native / Alaskan | 0 | 0.0% |
| White / Caucasian | 158 | 100.0% |
| Two or more Races | 0 | 0.0% |
| Some other Race | 0 | 0.0% |
| Total | 158 | 100.0% |
Ancestry in Livingston
The most populous ancestries reported in Livingston are Irish (40 | 25.3%), European (26 | 16.5%), American (8 | 5.1%), French (8 | 5.1%), and Eastern European (7 | 4.4%), together accounting for 56.3% of all Livingston residents.
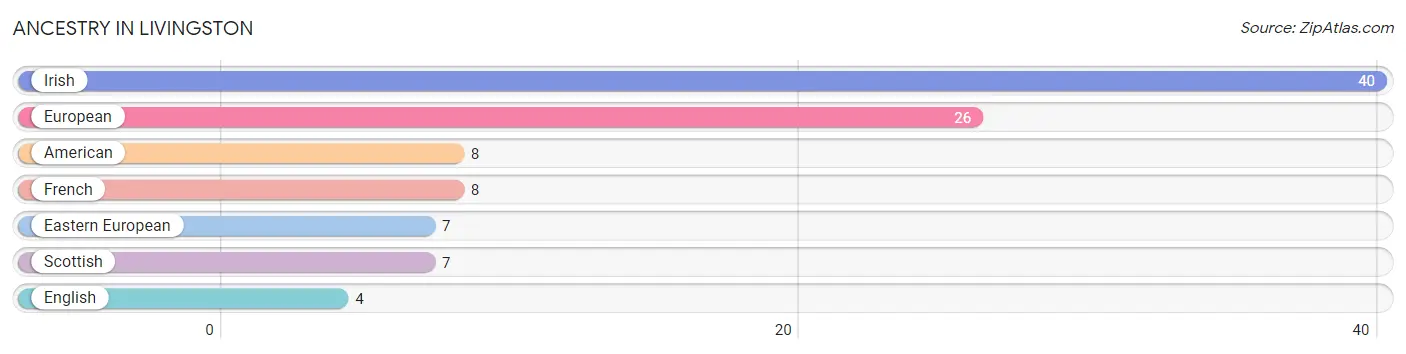
| Ancestry | # Population | % Population |
| American | 8 | 5.1% |
| Eastern European | 7 | 4.4% |
| English | 4 | 2.5% |
| European | 26 | 16.5% |
| French | 8 | 5.1% |
| Irish | 40 | 25.3% |
| Scottish | 7 | 4.4% | View All 7 Rows |
Immigrants in Livingston

| Immigration Origin | # Population | % Population | View All 0 Rows |
Sex and Age in Livingston
Sex and Age in Livingston
The most populous age groups in Livingston are 45 to 49 Years (16 | 25.8%) for men and 55 to 59 Years (15 | 15.6%) for women.
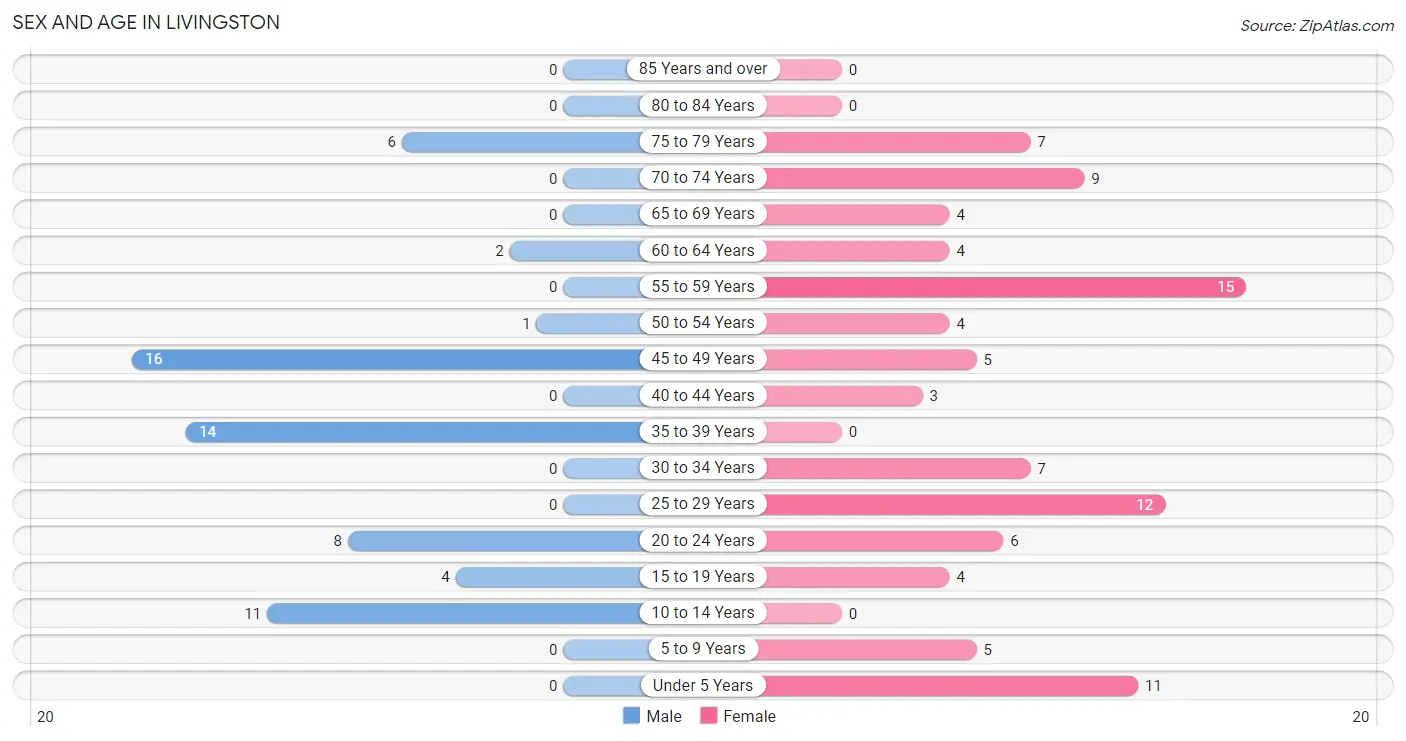
| Age Bracket | Male | Female |
| Under 5 Years | 0 (0.0%) | 11 (11.5%) |
| 5 to 9 Years | 0 (0.0%) | 5 (5.2%) |
| 10 to 14 Years | 11 (17.7%) | 0 (0.0%) |
| 15 to 19 Years | 4 (6.5%) | 4 (4.2%) |
| 20 to 24 Years | 8 (12.9%) | 6 (6.2%) |
| 25 to 29 Years | 0 (0.0%) | 12 (12.5%) |
| 30 to 34 Years | 0 (0.0%) | 7 (7.3%) |
| 35 to 39 Years | 14 (22.6%) | 0 (0.0%) |
| 40 to 44 Years | 0 (0.0%) | 3 (3.1%) |
| 45 to 49 Years | 16 (25.8%) | 5 (5.2%) |
| 50 to 54 Years | 1 (1.6%) | 4 (4.2%) |
| 55 to 59 Years | 0 (0.0%) | 15 (15.6%) |
| 60 to 64 Years | 2 (3.2%) | 4 (4.2%) |
| 65 to 69 Years | 0 (0.0%) | 4 (4.2%) |
| 70 to 74 Years | 0 (0.0%) | 9 (9.4%) |
| 75 to 79 Years | 6 (9.7%) | 7 (7.3%) |
| 80 to 84 Years | 0 (0.0%) | 0 (0.0%) |
| 85 Years and over | 0 (0.0%) | 0 (0.0%) |
| Total | 62 (100.0%) | 96 (100.0%) |
Families and Households in Livingston
Median Family Size in Livingston
The median family size in Livingston is 3.78 persons per family, with married-couple families (11 | 40.7%) accounting for the largest median family size of 4.55 persons per family. On the other hand, single female/mother families (9 | 33.3%) represent the smallest median family size with 2.67 persons per family.
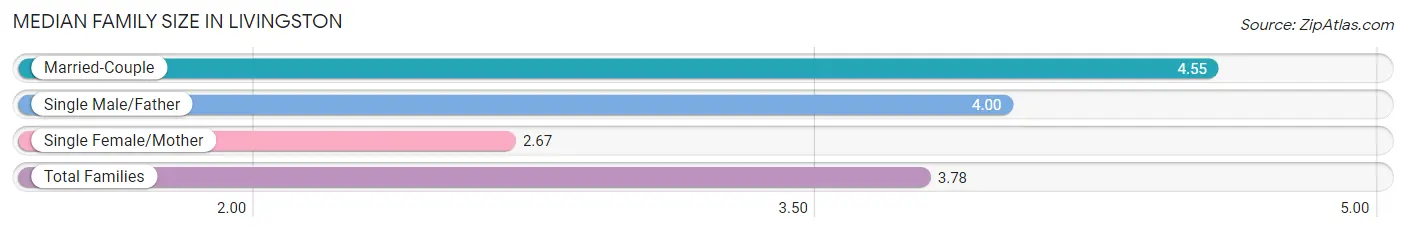
| Family Type | # Families | Family Size |
| Married-Couple | 11 (40.7%) | 4.55 |
| Single Male/Father | 7 (25.9%) | 4.00 |
| Single Female/Mother | 9 (33.3%) | 2.67 |
| Total Families | 27 (100.0%) | 3.78 |
Median Household Size in Livingston
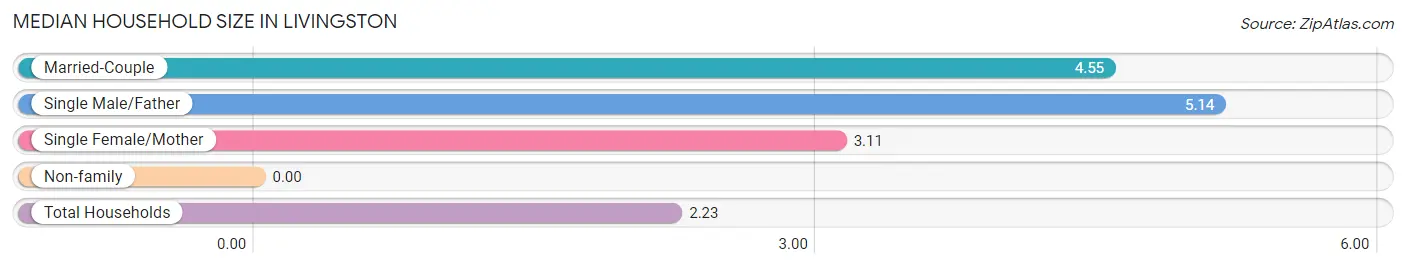
| Household Type | # Households | Household Size |
| Married-Couple | 11 (15.5%) | 4.55 |
| Single Male/Father | 7 (9.9%) | 5.14 |
| Single Female/Mother | 9 (12.7%) | 3.11 |
| Non-family | 44 (62.0%) | - |
| Total Households | 71 (100.0%) | 2.23 |
Household Size by Marriage Status in Livingston
Out of a total of 71 households in Livingston, 27 (38.0%) are family households, while 44 (62.0%) are nonfamily households. The most numerous type of family households are 5-person households, comprising 14, and the most common type of nonfamily households are 1-person households, comprising 44.
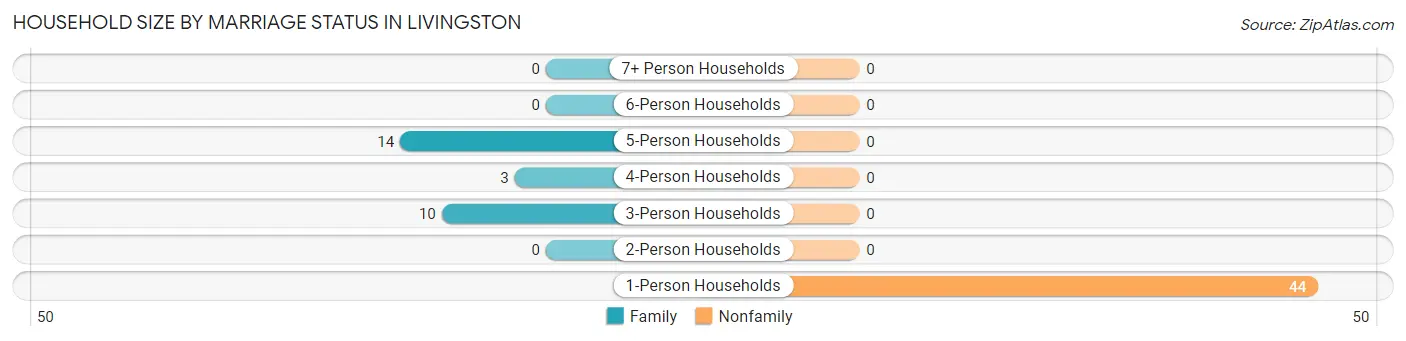
| Household Size | Family Households | Nonfamily Households |
| 1-Person Households | - | 44 (62.0%) |
| 2-Person Households | 0 (0.0%) | 0 (0.0%) |
| 3-Person Households | 10 (14.1%) | 0 (0.0%) |
| 4-Person Households | 3 (4.2%) | 0 (0.0%) |
| 5-Person Households | 14 (19.7%) | 0 (0.0%) |
| 6-Person Households | 0 (0.0%) | 0 (0.0%) |
| 7+ Person Households | 0 (0.0%) | 0 (0.0%) |
| Total | 27 (38.0%) | 44 (62.0%) |
Female Fertility in Livingston
Fertility by Age in Livingston
| Age Bracket | Women with Births | Births / 1,000 Women |
| 15 to 19 years | 0 (0.0%) | 0.0 |
| 20 to 34 years | 0 (0.0%) | 0.0 |
| 35 to 50 years | 0 (0.0%) | 0.0 |
| Total | 0 (0.0%) | 0.0 |
Fertility by Age by Marriage Status in Livingston
| Age Bracket | Married | Unmarried |
| 15 to 19 years | 0 (0.0%) | 0 (0.0%) |
| 20 to 34 years | 0 (0.0%) | 0 (0.0%) |
| 35 to 50 years | 0 (0.0%) | 0 (0.0%) |
| Total | 0 (0.0%) | 0 (0.0%) |
Fertility by Education in Livingston
| Educational Attainment | Women with Births | Births / 1,000 Women |
| Less than High School | 0 (0.0%) | 0.0 |
| High School Diploma | 0 (0.0%) | 0.0 |
| College or Associate's Degree | 0 (0.0%) | 0.0 |
| Bachelor's Degree | 0 (0.0%) | 0.0 |
| Graduate Degree | 0 (0.0%) | 0.0 |
| Total | 0 (0.0%) | 0.0 |
Fertility by Education by Marriage Status in Livingston
| Educational Attainment | Married | Unmarried |
| Less than High School | 0 (0.0%) | 0 (0.0%) |
| High School Diploma | 0 (0.0%) | 0 (0.0%) |
| College or Associate's Degree | 0 (0.0%) | 0 (0.0%) |
| Bachelor's Degree | 0 (0.0%) | 0 (0.0%) |
| Graduate Degree | 0 (0.0%) | 0 (0.0%) |
| Total | 0 (0.0%) | 0 (0.0%) |
Employment Characteristics in Livingston
Employment by Class of Employer in Livingston
Among the 50 employed individuals in Livingston, private company employees (39 | 78.0%), local government employees (7 | 14.0%), and not-for-profit organizations (3 | 6.0%) make up the most common classes of employment.
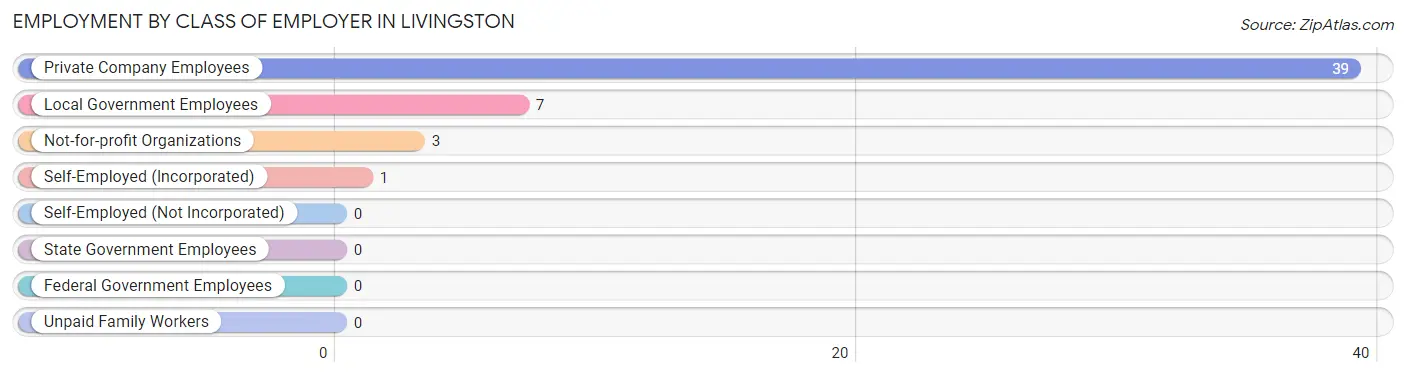
| Employer Class | # Employees | % Employees |
| Private Company Employees | 39 | 78.0% |
| Self-Employed (Incorporated) | 1 | 2.0% |
| Self-Employed (Not Incorporated) | 0 | 0.0% |
| Not-for-profit Organizations | 3 | 6.0% |
| Local Government Employees | 7 | 14.0% |
| State Government Employees | 0 | 0.0% |
| Federal Government Employees | 0 | 0.0% |
| Unpaid Family Workers | 0 | 0.0% |
| Total | 50 | 100.0% |
Employment Status by Age in Livingston
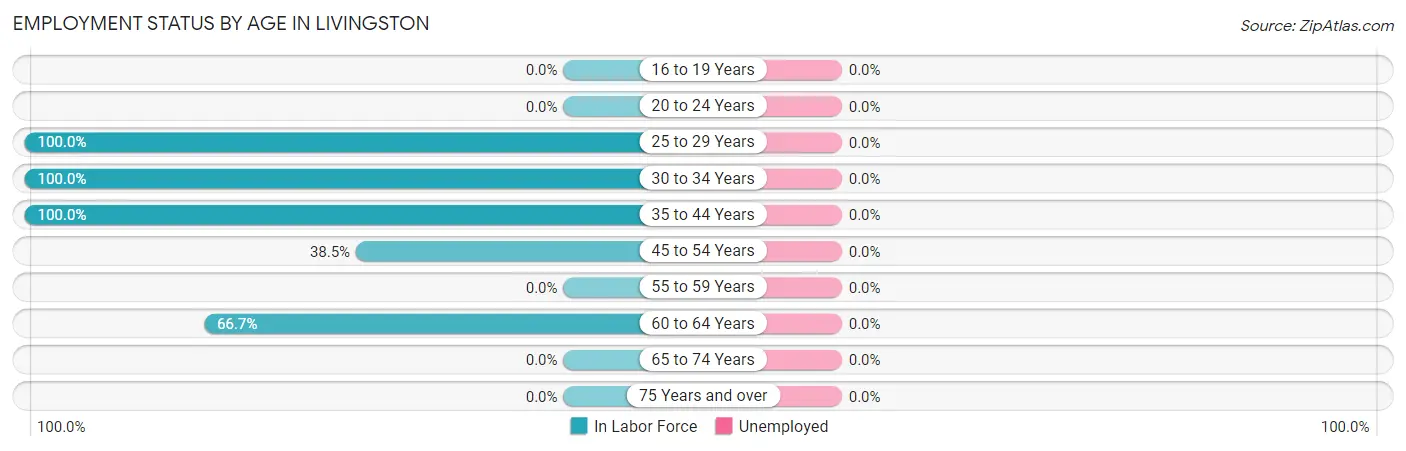
| Age Bracket | In Labor Force | Unemployed |
| 16 to 19 Years | 0 (0.0%) | 0 (0.0%) |
| 20 to 24 Years | 0 (0.0%) | 0 (0.0%) |
| 25 to 29 Years | 12 (100.0%) | 0 (0.0%) |
| 30 to 34 Years | 7 (100.0%) | 0 (0.0%) |
| 35 to 44 Years | 17 (100.0%) | 0 (0.0%) |
| 45 to 54 Years | 10 (38.5%) | 0 (0.0%) |
| 55 to 59 Years | 0 (0.0%) | 0 (0.0%) |
| 60 to 64 Years | 4 (66.7%) | 0 (0.0%) |
| 65 to 74 Years | 0 (0.0%) | 0 (0.0%) |
| 75 Years and over | 0 (0.0%) | 0 (0.0%) |
| Total | 50 (38.2%) | 0 (0.0%) |
Employment Status by Educational Attainment in Livingston
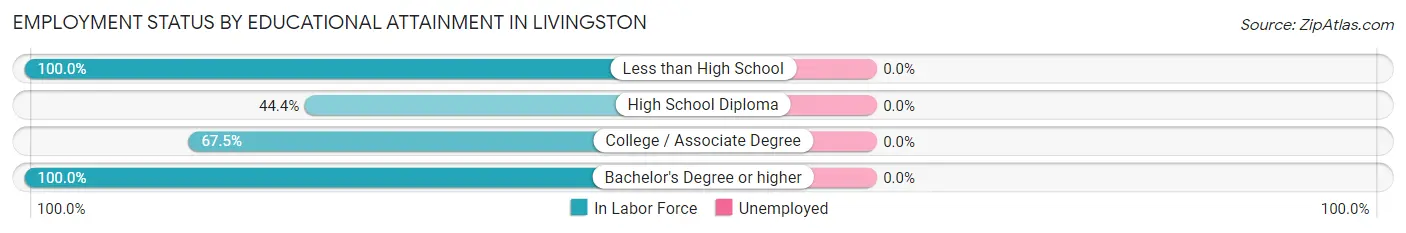
| Educational Attainment | In Labor Force | Unemployed |
| Less than High School | 4 (100.0%) | 0 (0.0%) |
| High School Diploma | 16 (44.4%) | 0 (0.0%) |
| College / Associate Degree | 27 (67.5%) | 0 (0.0%) |
| Bachelor's Degree or higher | 3 (100.0%) | 0 (0.0%) |
| Total | 50 (60.2%) | 0 (0.0%) |
Employment Occupations by Sex in Livingston
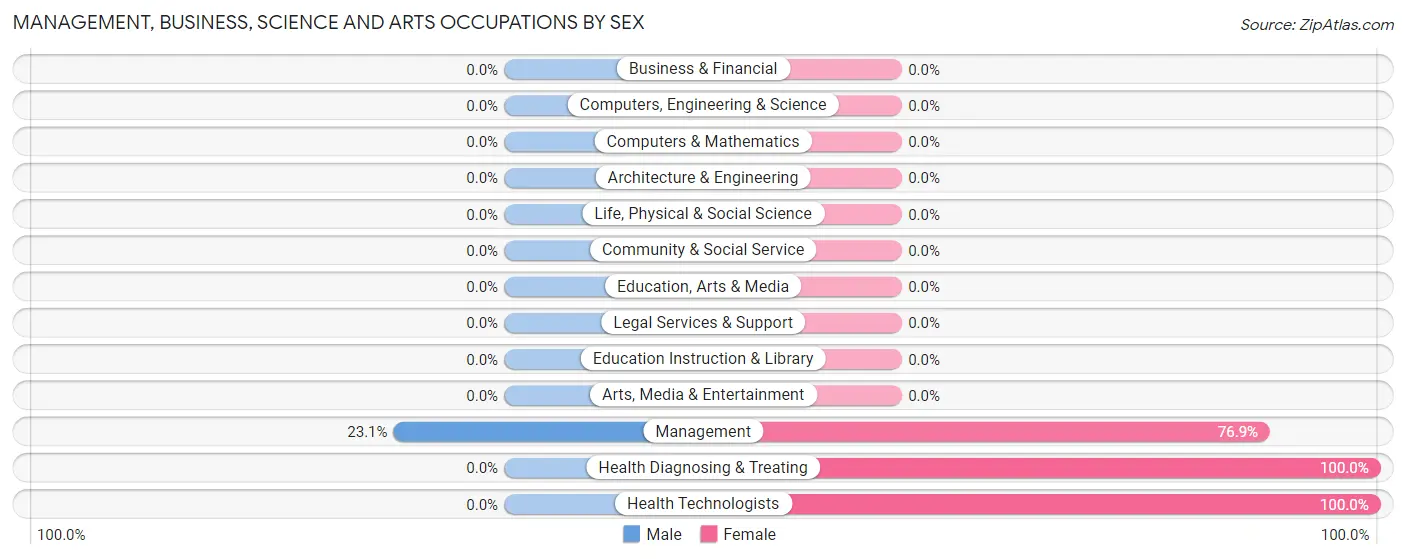
Management, Business, Science and Arts Occupations
The most common Management, Business, Science and Arts occupations in Livingston are Management (13 | 26.0%), Health Diagnosing & Treating (3 | 6.0%), and Health Technologists (3 | 6.0%).
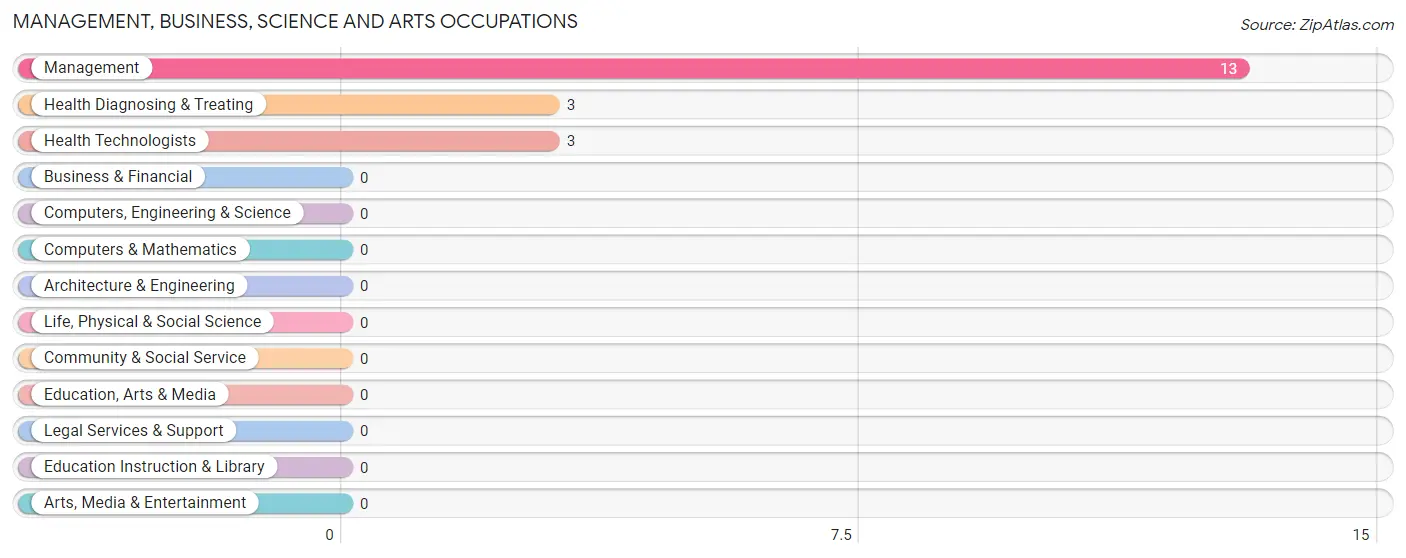
Management, Business, Science and Arts Occupations by Sex
| Occupation | Male | Female |
| Management | 3 (23.1%) | 10 (76.9%) |
| Business & Financial | 0 (0.0%) | 0 (0.0%) |
| Computers, Engineering & Science | 0 (0.0%) | 0 (0.0%) |
| Computers & Mathematics | 0 (0.0%) | 0 (0.0%) |
| Architecture & Engineering | 0 (0.0%) | 0 (0.0%) |
| Life, Physical & Social Science | 0 (0.0%) | 0 (0.0%) |
| Community & Social Service | 0 (0.0%) | 0 (0.0%) |
| Education, Arts & Media | 0 (0.0%) | 0 (0.0%) |
| Legal Services & Support | 0 (0.0%) | 0 (0.0%) |
| Education Instruction & Library | 0 (0.0%) | 0 (0.0%) |
| Arts, Media & Entertainment | 0 (0.0%) | 0 (0.0%) |
| Health Diagnosing & Treating | 0 (0.0%) | 3 (100.0%) |
| Health Technologists | 0 (0.0%) | 3 (100.0%) |
| Total (Category) | 3 (18.8%) | 13 (81.2%) |
| Total (Overall) | 24 (48.0%) | 26 (52.0%) |
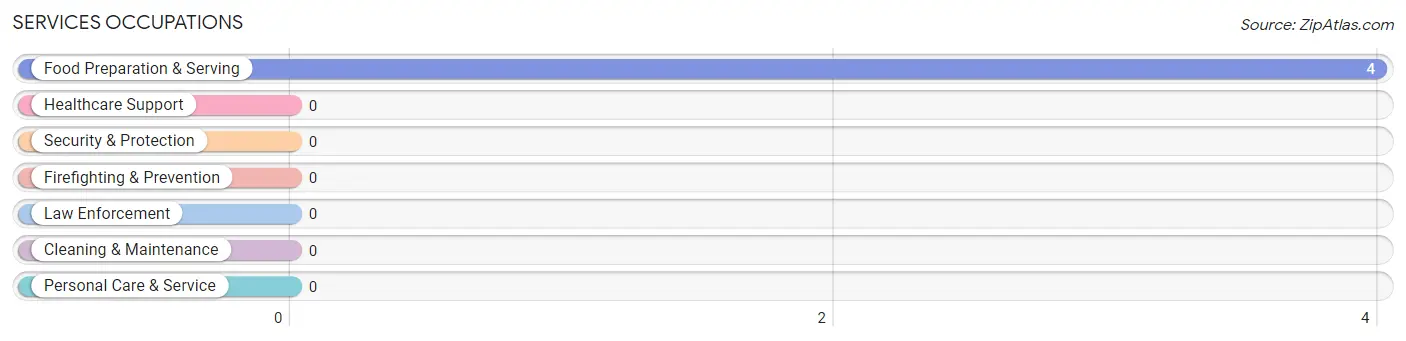
Services Occupations
The most common Services occupations in Livingston are , and Food Preparation & Serving (4 | 8.0%).
Services Occupations by Sex
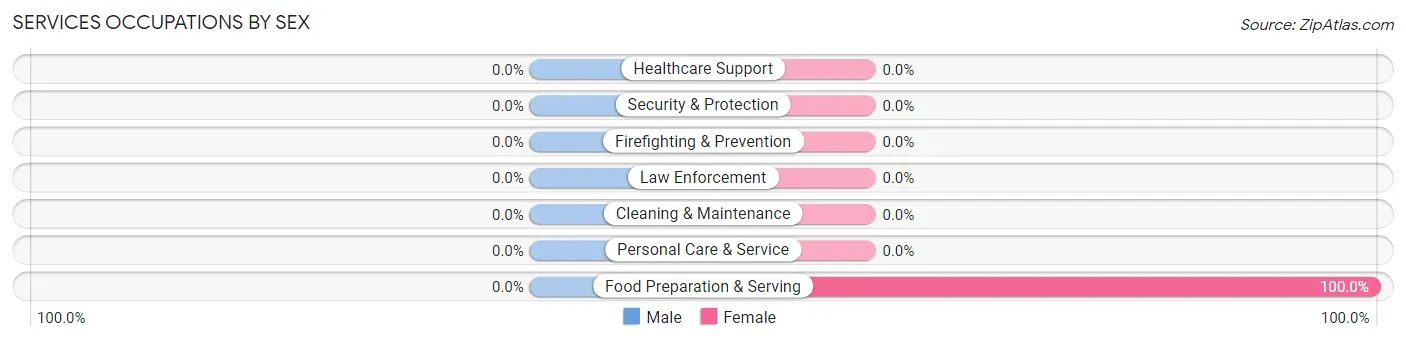
| Occupation | Male | Female |
| Healthcare Support | 0 (0.0%) | 0 (0.0%) |
| Security & Protection | 0 (0.0%) | 0 (0.0%) |
| Firefighting & Prevention | 0 (0.0%) | 0 (0.0%) |
| Law Enforcement | 0 (0.0%) | 0 (0.0%) |
| Food Preparation & Serving | 0 (0.0%) | 4 (100.0%) |
| Cleaning & Maintenance | 0 (0.0%) | 0 (0.0%) |
| Personal Care & Service | 0 (0.0%) | 0 (0.0%) |
| Total (Category) | 0 (0.0%) | 4 (100.0%) |
| Total (Overall) | 24 (48.0%) | 26 (52.0%) |
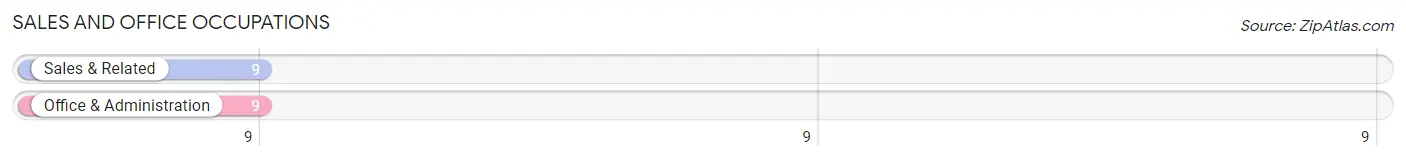
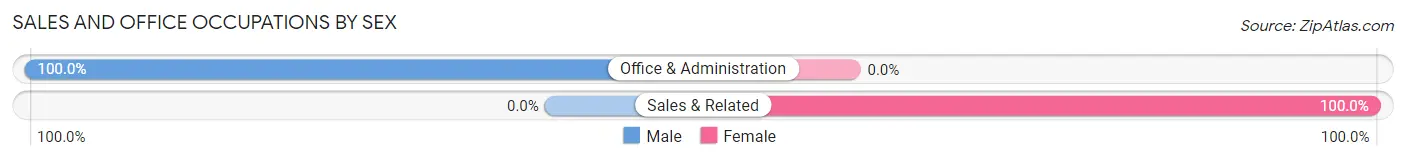
Sales and Office Occupations
The most common Sales and Office occupations in Livingston are Sales & Related (9 | 18.0%), and Office & Administration (9 | 18.0%).
Sales and Office Occupations by Sex
| Occupation | Male | Female |
| Sales & Related | 0 (0.0%) | 9 (100.0%) |
| Office & Administration | 9 (100.0%) | 0 (0.0%) |
| Total (Category) | 9 (50.0%) | 9 (50.0%) |
| Total (Overall) | 24 (48.0%) | 26 (52.0%) |
Natural Resources, Construction and Maintenance Occupations
The most common Natural Resources, Construction and Maintenance occupations in Livingston are , and Construction & Extraction (12 | 24.0%).
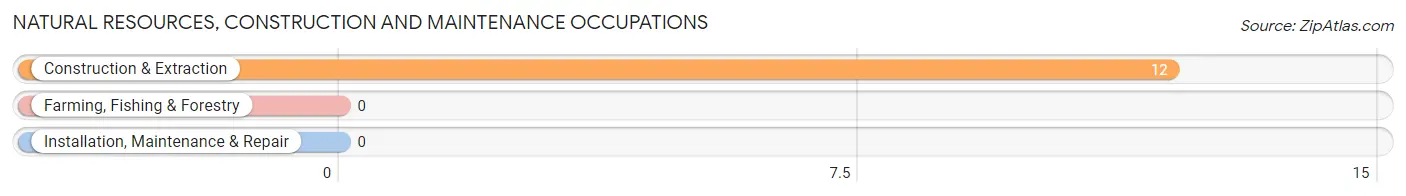
Natural Resources, Construction and Maintenance Occupations by Sex
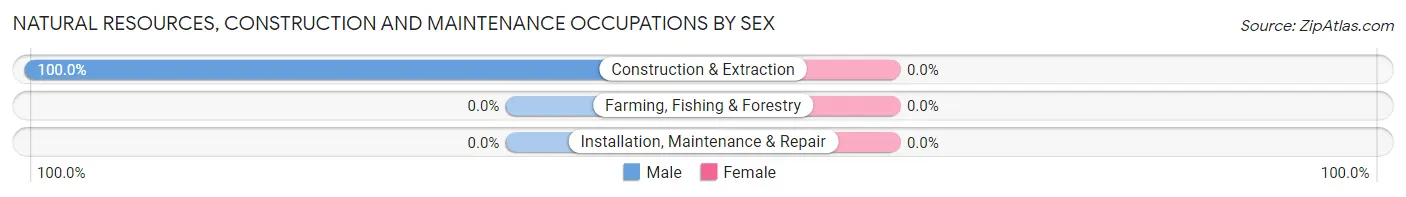
| Occupation | Male | Female |
| Farming, Fishing & Forestry | 0 (0.0%) | 0 (0.0%) |
| Construction & Extraction | 12 (100.0%) | 0 (0.0%) |
| Installation, Maintenance & Repair | 0 (0.0%) | 0 (0.0%) |
| Total (Category) | 12 (100.0%) | 0 (0.0%) |
| Total (Overall) | 24 (48.0%) | 26 (52.0%) |
Production, Transportation and Moving Occupations
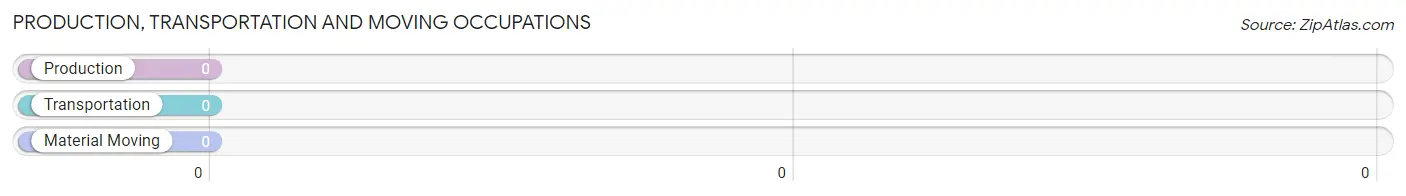
Production, Transportation and Moving Occupations by Sex
| Occupation | Male | Female |
| Production | 0 (0.0%) | 0 (0.0%) |
| Transportation | 0 (0.0%) | 0 (0.0%) |
| Material Moving | 0 (0.0%) | 0 (0.0%) |
| Total (Category) | 0 (0.0%) | 0 (0.0%) |
| Total (Overall) | 24 (48.0%) | 26 (52.0%) |
Employment Industries by Sex in Livingston
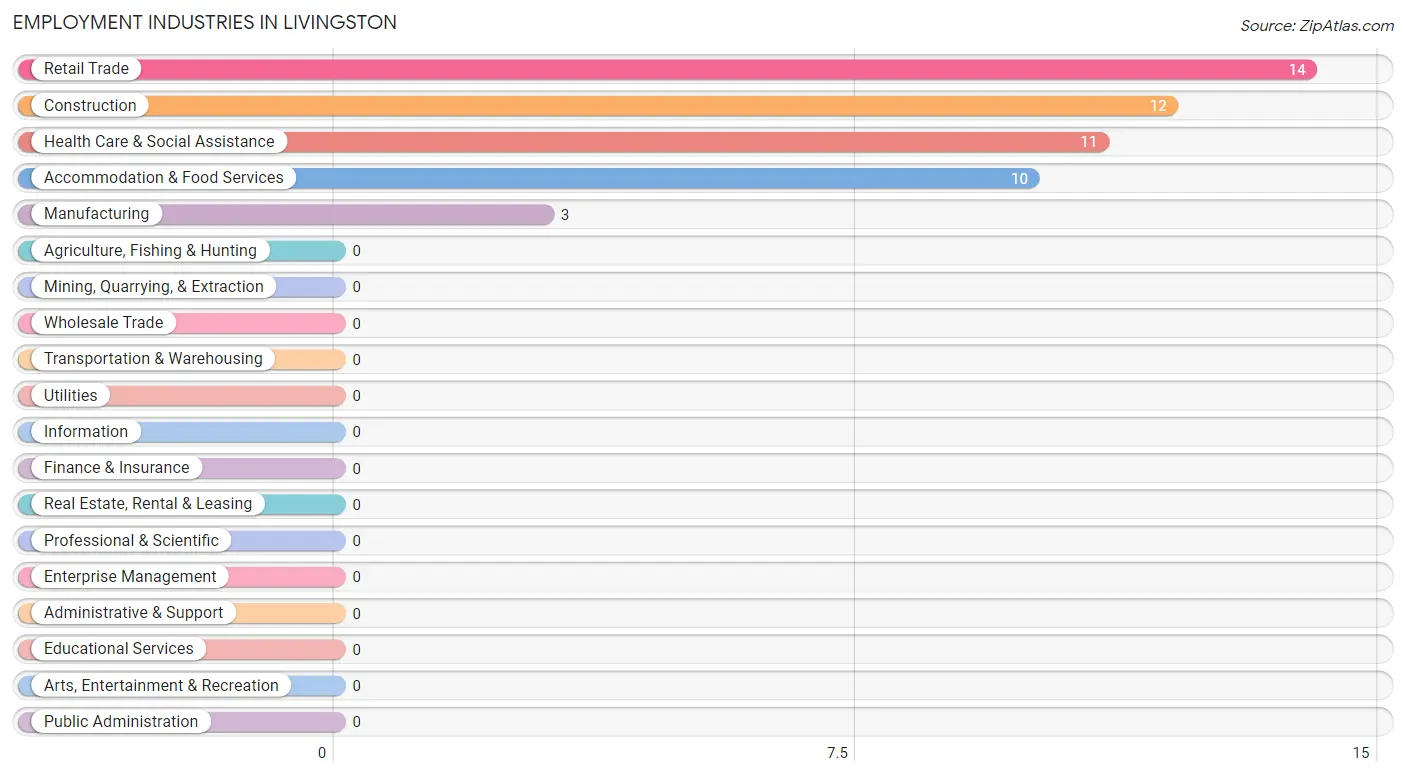
Employment Industries in Livingston
The major employment industries in Livingston include Retail Trade (14 | 28.0%), Construction (12 | 24.0%), Health Care & Social Assistance (11 | 22.0%), Accommodation & Food Services (10 | 20.0%), and Manufacturing (3 | 6.0%).
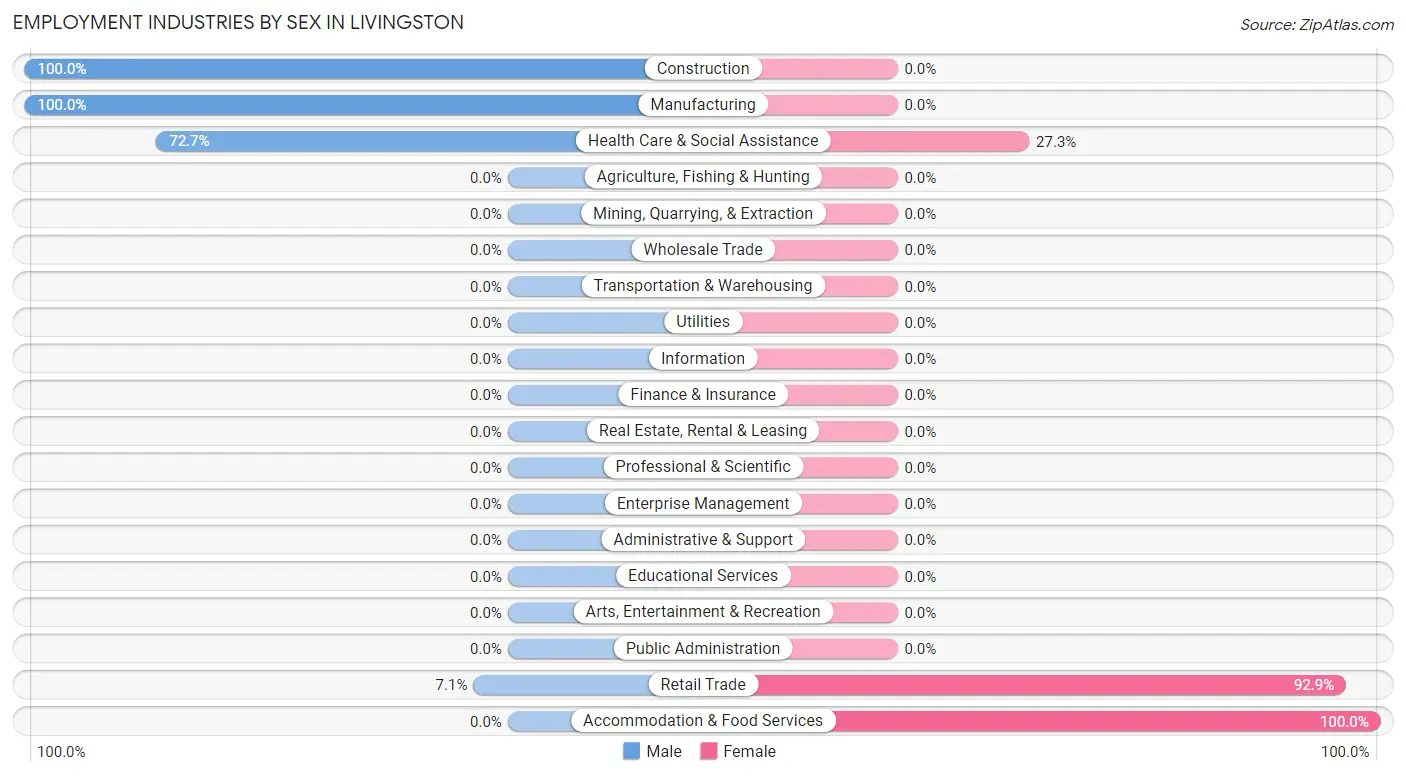
Employment Industries by Sex in Livingston
The Livingston industries that see more men than women are Construction (100.0%), Manufacturing (100.0%), and Health Care & Social Assistance (72.7%), whereas the industries that tend to have a higher number of women are Accommodation & Food Services (100.0%), Retail Trade (92.9%), and Health Care & Social Assistance (27.3%).
| Industry | Male | Female |
| Agriculture, Fishing & Hunting | 0 (0.0%) | 0 (0.0%) |
| Mining, Quarrying, & Extraction | 0 (0.0%) | 0 (0.0%) |
| Construction | 12 (100.0%) | 0 (0.0%) |
| Manufacturing | 3 (100.0%) | 0 (0.0%) |
| Wholesale Trade | 0 (0.0%) | 0 (0.0%) |
| Retail Trade | 1 (7.1%) | 13 (92.9%) |
| Transportation & Warehousing | 0 (0.0%) | 0 (0.0%) |
| Utilities | 0 (0.0%) | 0 (0.0%) |
| Information | 0 (0.0%) | 0 (0.0%) |
| Finance & Insurance | 0 (0.0%) | 0 (0.0%) |
| Real Estate, Rental & Leasing | 0 (0.0%) | 0 (0.0%) |
| Professional & Scientific | 0 (0.0%) | 0 (0.0%) |
| Enterprise Management | 0 (0.0%) | 0 (0.0%) |
| Administrative & Support | 0 (0.0%) | 0 (0.0%) |
| Educational Services | 0 (0.0%) | 0 (0.0%) |
| Health Care & Social Assistance | 8 (72.7%) | 3 (27.3%) |
| Arts, Entertainment & Recreation | 0 (0.0%) | 0 (0.0%) |
| Accommodation & Food Services | 0 (0.0%) | 10 (100.0%) |
| Public Administration | 0 (0.0%) | 0 (0.0%) |
| Total | 24 (48.0%) | 26 (52.0%) |
Education in Livingston
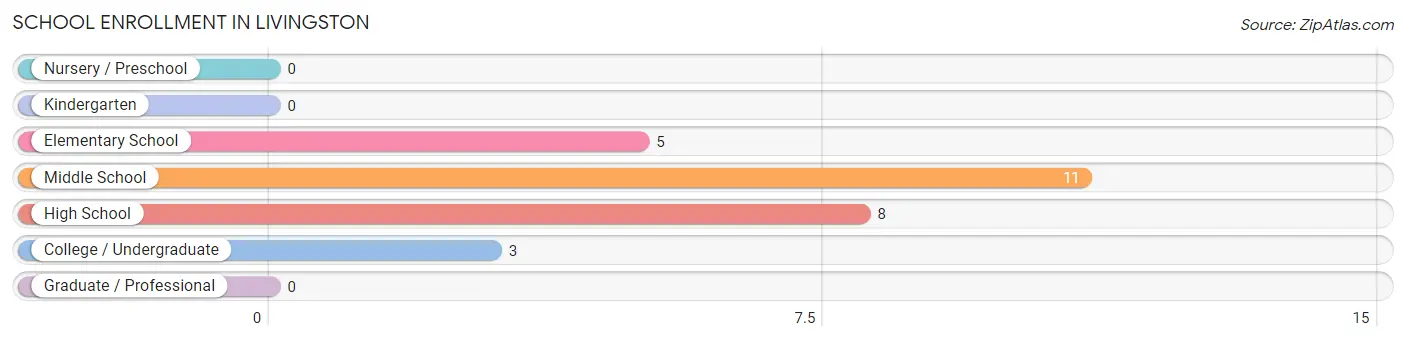
School Enrollment in Livingston
The most common levels of schooling among the 27 students in Livingston are middle school (11 | 40.7%), high school (8 | 29.6%), and elementary school (5 | 18.5%).
| School Level | # Students | % Students |
| Nursery / Preschool | 0 | 0.0% |
| Kindergarten | 0 | 0.0% |
| Elementary School | 5 | 18.5% |
| Middle School | 11 | 40.7% |
| High School | 8 | 29.6% |
| College / Undergraduate | 3 | 11.1% |
| Graduate / Professional | 0 | 0.0% |
| Total | 27 | 100.0% |
School Enrollment by Age by Funding Source in Livingston
Out of a total of 27 students who are enrolled in schools in Livingston, 3 (11.1%) attend a private institution, while the remaining 24 (88.9%) are enrolled in public schools. The age group of 35 years and over has the highest likelihood of being enrolled in private schools, with 3 (100.0% in the age bracket) enrolled. Conversely, the age group of 5 to 9 year old has the lowest likelihood of being enrolled in a private school, with 5 (100.0% in the age bracket) attending a public institution.
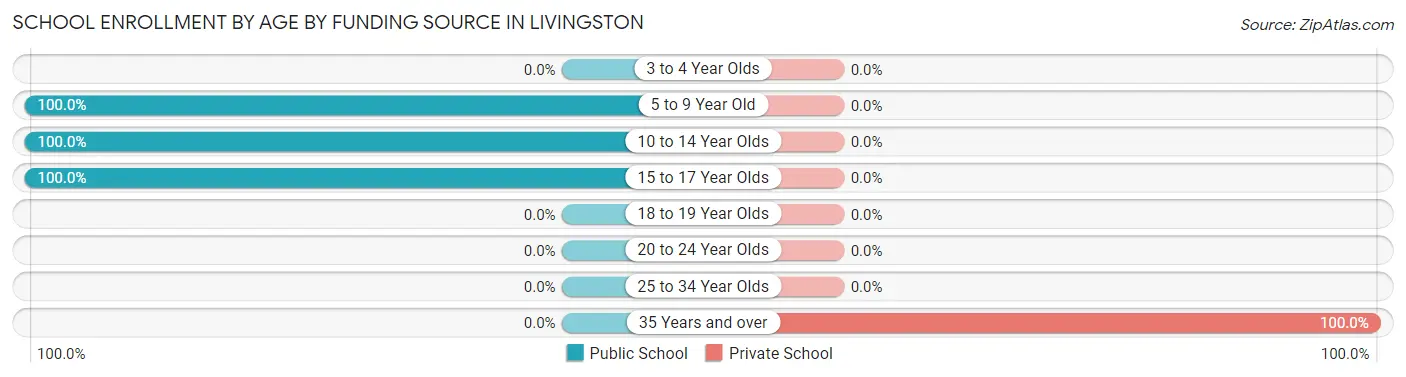
| Age Bracket | Public School | Private School |
| 3 to 4 Year Olds | 0 (0.0%) | 0 (0.0%) |
| 5 to 9 Year Old | 5 (100.0%) | 0 (0.0%) |
| 10 to 14 Year Olds | 11 (100.0%) | 0 (0.0%) |
| 15 to 17 Year Olds | 8 (100.0%) | 0 (0.0%) |
| 18 to 19 Year Olds | 0 (0.0%) | 0 (0.0%) |
| 20 to 24 Year Olds | 0 (0.0%) | 0 (0.0%) |
| 25 to 34 Year Olds | 0 (0.0%) | 0 (0.0%) |
| 35 Years and over | 0 (0.0%) | 3 (100.0%) |
| Total | 24 (88.9%) | 3 (11.1%) |
Educational Attainment by Field of Study in Livingston
, and science & technology (3 | 100.0%) are the most common fields of study among 3 individuals in Livingston who have obtained a bachelor's degree or higher.
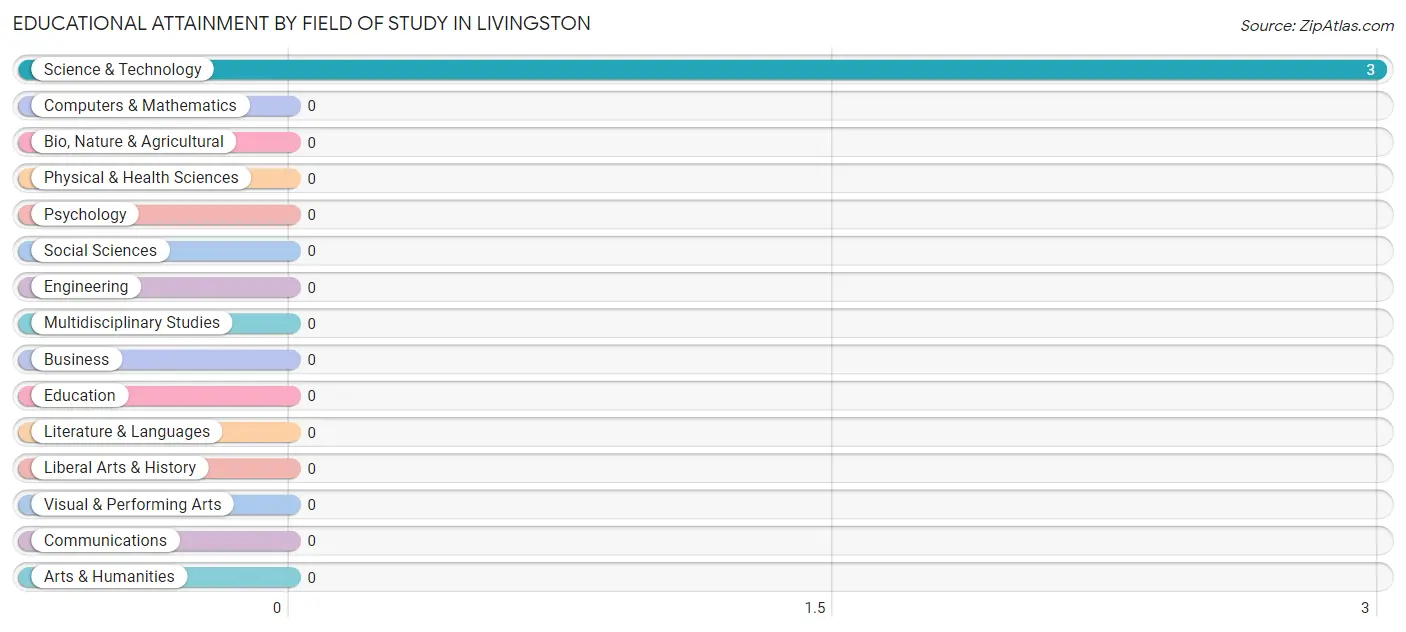
| Field of Study | # Graduates | % Graduates |
| Computers & Mathematics | 0 | 0.0% |
| Bio, Nature & Agricultural | 0 | 0.0% |
| Physical & Health Sciences | 0 | 0.0% |
| Psychology | 0 | 0.0% |
| Social Sciences | 0 | 0.0% |
| Engineering | 0 | 0.0% |
| Multidisciplinary Studies | 0 | 0.0% |
| Science & Technology | 3 | 100.0% |
| Business | 0 | 0.0% |
| Education | 0 | 0.0% |
| Literature & Languages | 0 | 0.0% |
| Liberal Arts & History | 0 | 0.0% |
| Visual & Performing Arts | 0 | 0.0% |
| Communications | 0 | 0.0% |
| Arts & Humanities | 0 | 0.0% |
| Total | 3 | 100.0% |
Transportation & Commute in Livingston
Vehicle Availability by Sex in Livingston
The most prevalent vehicle ownership categories in Livingston are males with 3 vehicles (14, accounting for 58.3%) and females with 3 vehicles (10, making up 53.8%).
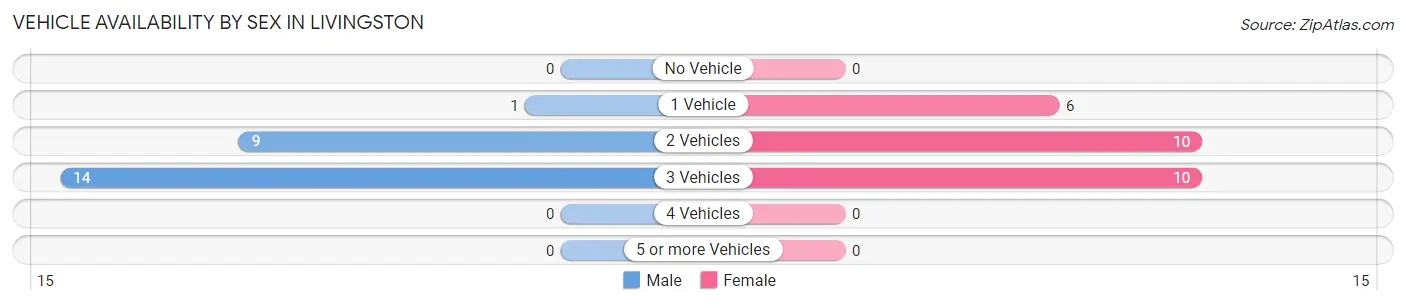
| Vehicles Available | Male | Female |
| No Vehicle | 0 (0.0%) | 0 (0.0%) |
| 1 Vehicle | 1 (4.2%) | 6 (23.1%) |
| 2 Vehicles | 9 (37.5%) | 10 (38.5%) |
| 3 Vehicles | 14 (58.3%) | 10 (38.5%) |
| 4 Vehicles | 0 (0.0%) | 0 (0.0%) |
| 5 or more Vehicles | 0 (0.0%) | 0 (0.0%) |
| Total | 24 (100.0%) | 26 (100.0%) |
Commute Time in Livingston
The most frequently occuring commute durations in Livingston are 15 to 19 minutes (12 commuters, 24.0%), 60 to 89 minutes (12 commuters, 24.0%), and 10 to 14 minutes (7 commuters, 14.0%).
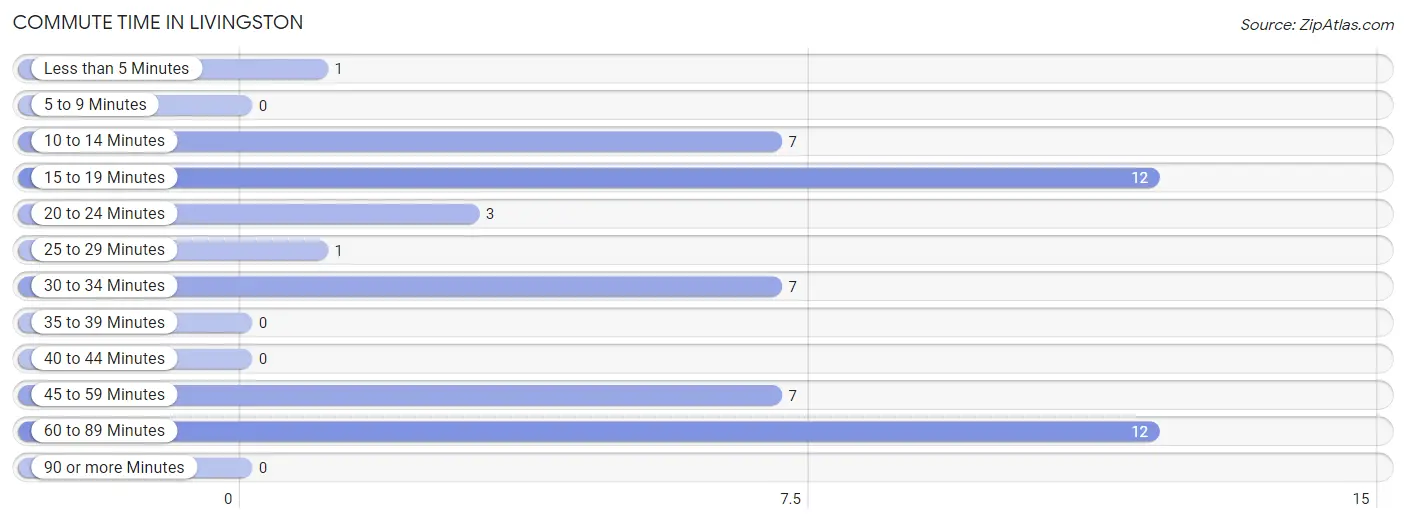
| Commute Time | # Commuters | % Commuters |
| Less than 5 Minutes | 1 | 2.0% |
| 5 to 9 Minutes | 0 | 0.0% |
| 10 to 14 Minutes | 7 | 14.0% |
| 15 to 19 Minutes | 12 | 24.0% |
| 20 to 24 Minutes | 3 | 6.0% |
| 25 to 29 Minutes | 1 | 2.0% |
| 30 to 34 Minutes | 7 | 14.0% |
| 35 to 39 Minutes | 0 | 0.0% |
| 40 to 44 Minutes | 0 | 0.0% |
| 45 to 59 Minutes | 7 | 14.0% |
| 60 to 89 Minutes | 12 | 24.0% |
| 90 or more Minutes | 0 | 0.0% |
Commute Time by Sex in Livingston
The most common commute times in Livingston are 60 to 89 minutes (12 commuters, 50.0%) for males and 15 to 19 minutes (12 commuters, 46.2%) for females.
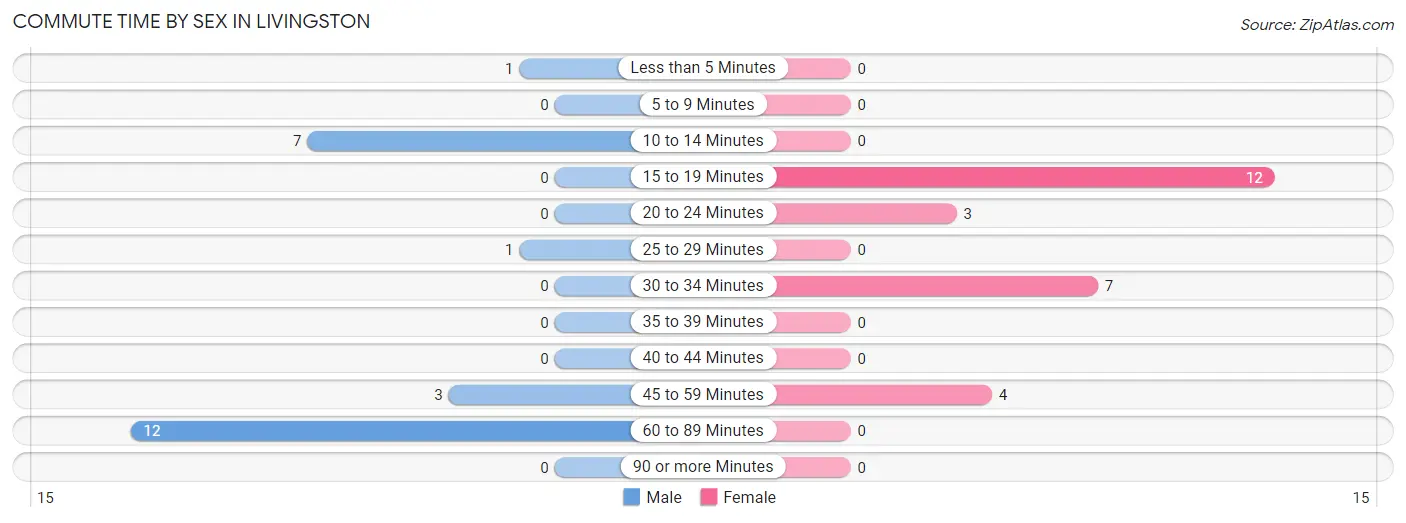
| Commute Time | Male | Female |
| Less than 5 Minutes | 1 (4.2%) | 0 (0.0%) |
| 5 to 9 Minutes | 0 (0.0%) | 0 (0.0%) |
| 10 to 14 Minutes | 7 (29.2%) | 0 (0.0%) |
| 15 to 19 Minutes | 0 (0.0%) | 12 (46.2%) |
| 20 to 24 Minutes | 0 (0.0%) | 3 (11.5%) |
| 25 to 29 Minutes | 1 (4.2%) | 0 (0.0%) |
| 30 to 34 Minutes | 0 (0.0%) | 7 (26.9%) |
| 35 to 39 Minutes | 0 (0.0%) | 0 (0.0%) |
| 40 to 44 Minutes | 0 (0.0%) | 0 (0.0%) |
| 45 to 59 Minutes | 3 (12.5%) | 4 (15.4%) |
| 60 to 89 Minutes | 12 (50.0%) | 0 (0.0%) |
| 90 or more Minutes | 0 (0.0%) | 0 (0.0%) |
Time of Departure to Work by Sex in Livingston
The most frequent times of departure to work in Livingston are 7:00 AM to 7:29 AM (11, 45.8%) for males and 8:00 AM to 8:29 AM (16, 61.5%) for females.
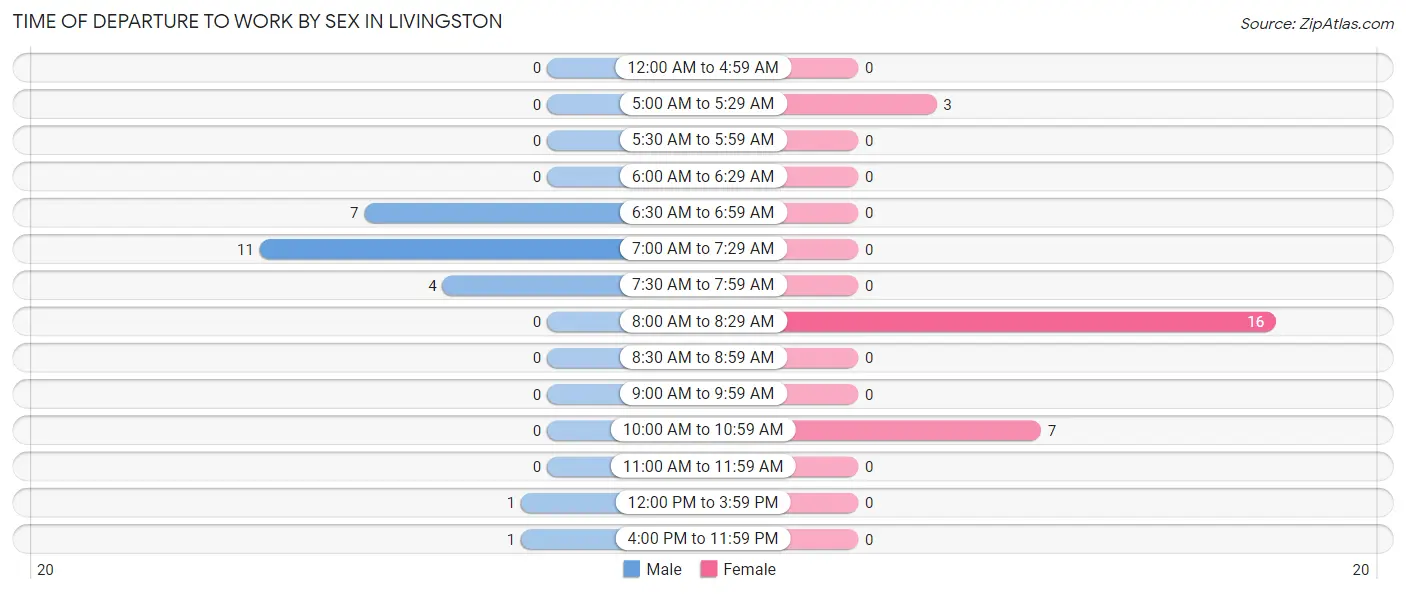
| Time of Departure | Male | Female |
| 12:00 AM to 4:59 AM | 0 (0.0%) | 0 (0.0%) |
| 5:00 AM to 5:29 AM | 0 (0.0%) | 3 (11.5%) |
| 5:30 AM to 5:59 AM | 0 (0.0%) | 0 (0.0%) |
| 6:00 AM to 6:29 AM | 0 (0.0%) | 0 (0.0%) |
| 6:30 AM to 6:59 AM | 7 (29.2%) | 0 (0.0%) |
| 7:00 AM to 7:29 AM | 11 (45.8%) | 0 (0.0%) |
| 7:30 AM to 7:59 AM | 4 (16.7%) | 0 (0.0%) |
| 8:00 AM to 8:29 AM | 0 (0.0%) | 16 (61.5%) |
| 8:30 AM to 8:59 AM | 0 (0.0%) | 0 (0.0%) |
| 9:00 AM to 9:59 AM | 0 (0.0%) | 0 (0.0%) |
| 10:00 AM to 10:59 AM | 0 (0.0%) | 7 (26.9%) |
| 11:00 AM to 11:59 AM | 0 (0.0%) | 0 (0.0%) |
| 12:00 PM to 3:59 PM | 1 (4.2%) | 0 (0.0%) |
| 4:00 PM to 11:59 PM | 1 (4.2%) | 0 (0.0%) |
| Total | 24 (100.0%) | 26 (100.0%) |
Housing Occupancy in Livingston
Occupancy by Ownership in Livingston
Of the total 71 dwellings in Livingston, owner-occupied units account for 36 (50.7%), while renter-occupied units make up 35 (49.3%).
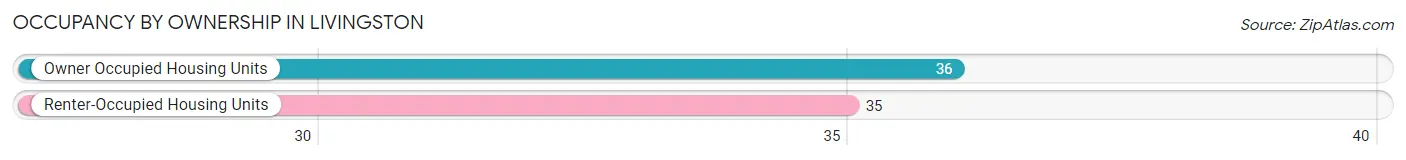
| Occupancy | # Housing Units | % Housing Units |
| Owner Occupied Housing Units | 36 | 50.7% |
| Renter-Occupied Housing Units | 35 | 49.3% |
| Total Occupied Housing Units | 71 | 100.0% |
Occupancy by Household Size in Livingston
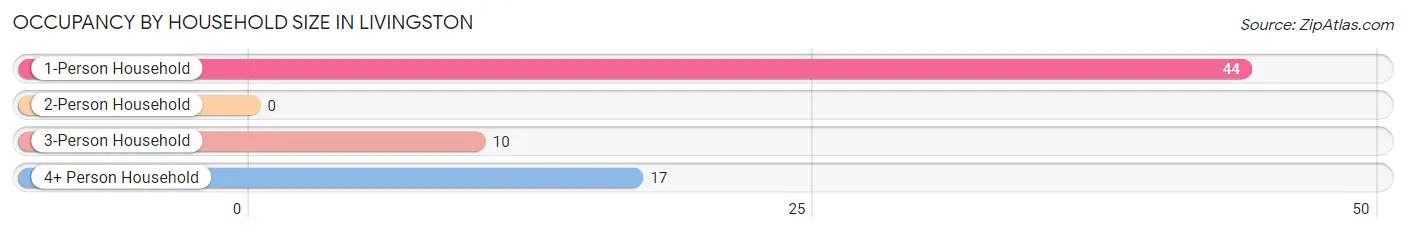
| Household Size | # Housing Units | % Housing Units |
| 1-Person Household | 44 | 62.0% |
| 2-Person Household | 0 | 0.0% |
| 3-Person Household | 10 | 14.1% |
| 4+ Person Household | 17 | 23.9% |
| Total Housing Units | 71 | 100.0% |
Occupancy by Ownership by Household Size in Livingston
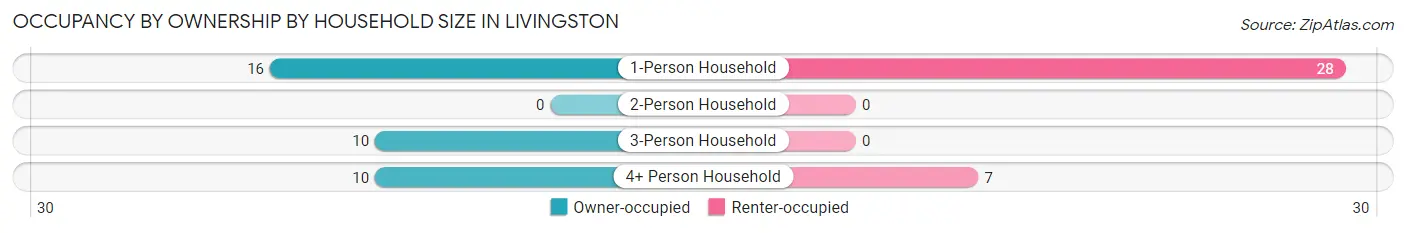
| Household Size | Owner-occupied | Renter-occupied |
| 1-Person Household | 16 (36.4%) | 28 (63.6%) |
| 2-Person Household | 0 (0.0%) | 0 (0.0%) |
| 3-Person Household | 10 (100.0%) | 0 (0.0%) |
| 4+ Person Household | 10 (58.8%) | 7 (41.2%) |
| Total Housing Units | 36 (50.7%) | 35 (49.3%) |
Occupancy by Educational Attainment in Livingston
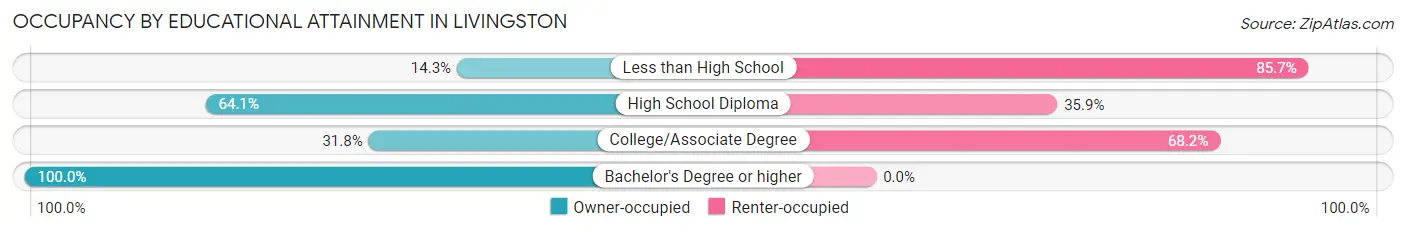
| Household Size | Owner-occupied | Renter-occupied |
| Less than High School | 1 (14.3%) | 6 (85.7%) |
| High School Diploma | 25 (64.1%) | 14 (35.9%) |
| College/Associate Degree | 7 (31.8%) | 15 (68.2%) |
| Bachelor's Degree or higher | 3 (100.0%) | 0 (0.0%) |
Occupancy by Age of Householder in Livingston
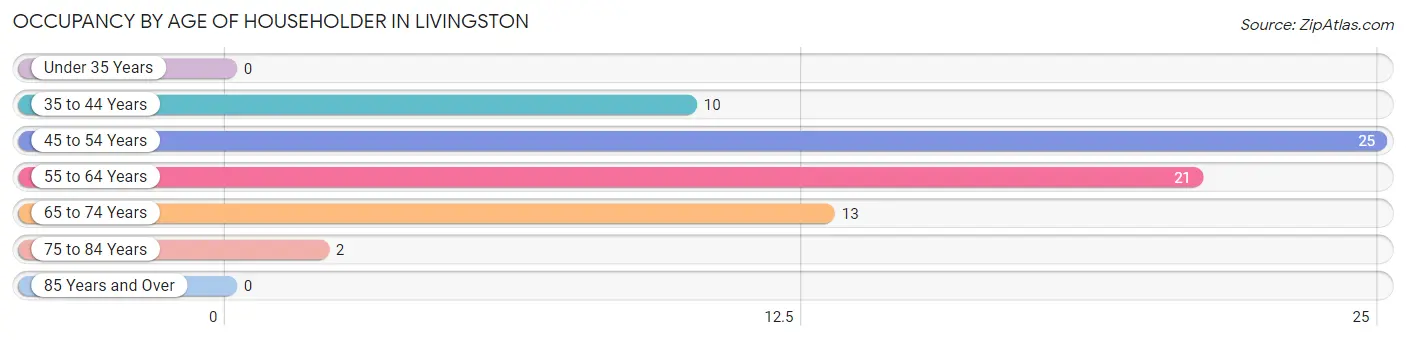
| Age Bracket | # Households | % Households |
| Under 35 Years | 0 | 0.0% |
| 35 to 44 Years | 10 | 14.1% |
| 45 to 54 Years | 25 | 35.2% |
| 55 to 64 Years | 21 | 29.6% |
| 65 to 74 Years | 13 | 18.3% |
| 75 to 84 Years | 2 | 2.8% |
| 85 Years and Over | 0 | 0.0% |
| Total | 71 | 100.0% |
Housing Finances in Livingston
Median Income by Occupancy in Livingston
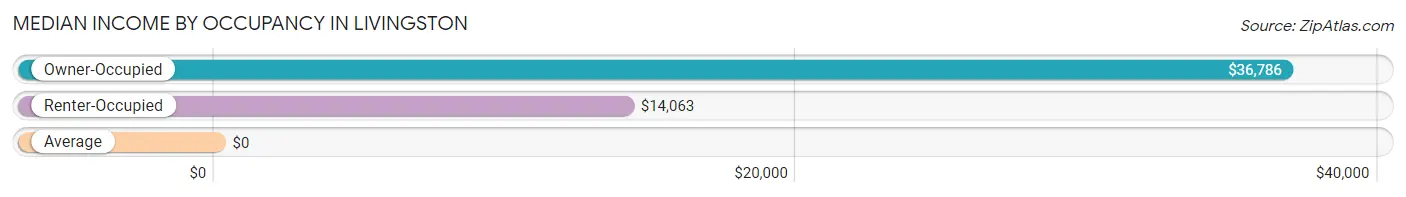
| Occupancy Type | # Households | Median Income |
| Owner-Occupied | 36 (50.7%) | $36,786 |
| Renter-Occupied | 35 (49.3%) | $14,063 |
| Average | 71 (100.0%) | $0 |
Occupancy by Householder Income Bracket in Livingston
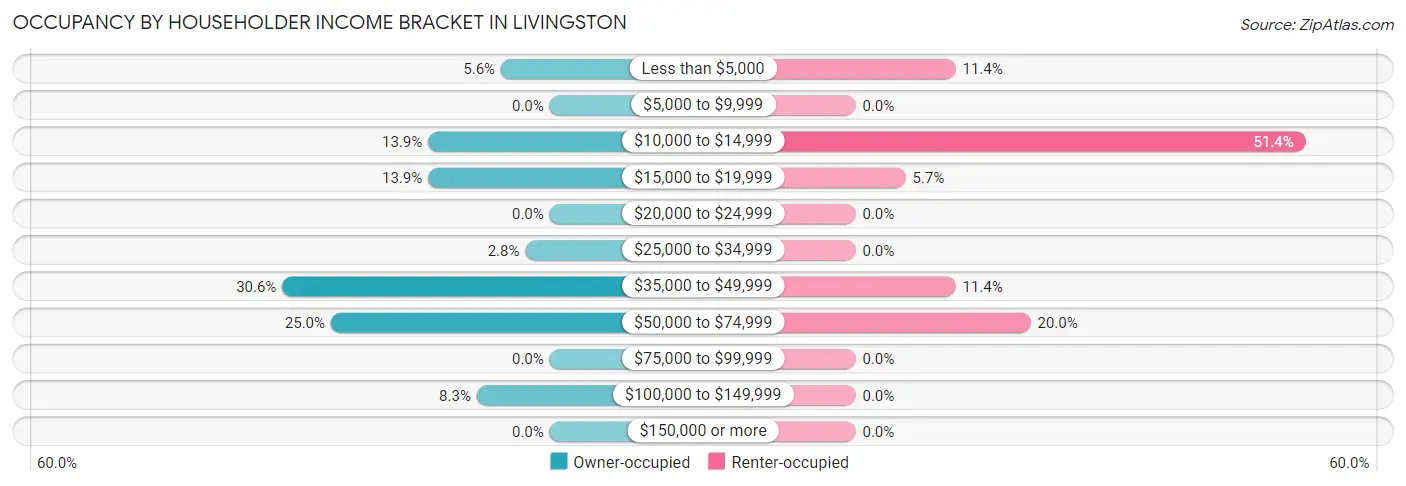
| Income Bracket | Owner-occupied | Renter-occupied |
| Less than $5,000 | 2 (5.6%) | 4 (11.4%) |
| $5,000 to $9,999 | 0 (0.0%) | 0 (0.0%) |
| $10,000 to $14,999 | 5 (13.9%) | 18 (51.4%) |
| $15,000 to $19,999 | 5 (13.9%) | 2 (5.7%) |
| $20,000 to $24,999 | 0 (0.0%) | 0 (0.0%) |
| $25,000 to $34,999 | 1 (2.8%) | 0 (0.0%) |
| $35,000 to $49,999 | 11 (30.6%) | 4 (11.4%) |
| $50,000 to $74,999 | 9 (25.0%) | 7 (20.0%) |
| $75,000 to $99,999 | 0 (0.0%) | 0 (0.0%) |
| $100,000 to $149,999 | 3 (8.3%) | 0 (0.0%) |
| $150,000 or more | 0 (0.0%) | 0 (0.0%) |
| Total | 36 (100.0%) | 35 (100.0%) |
Monthly Housing Cost Tiers in Livingston
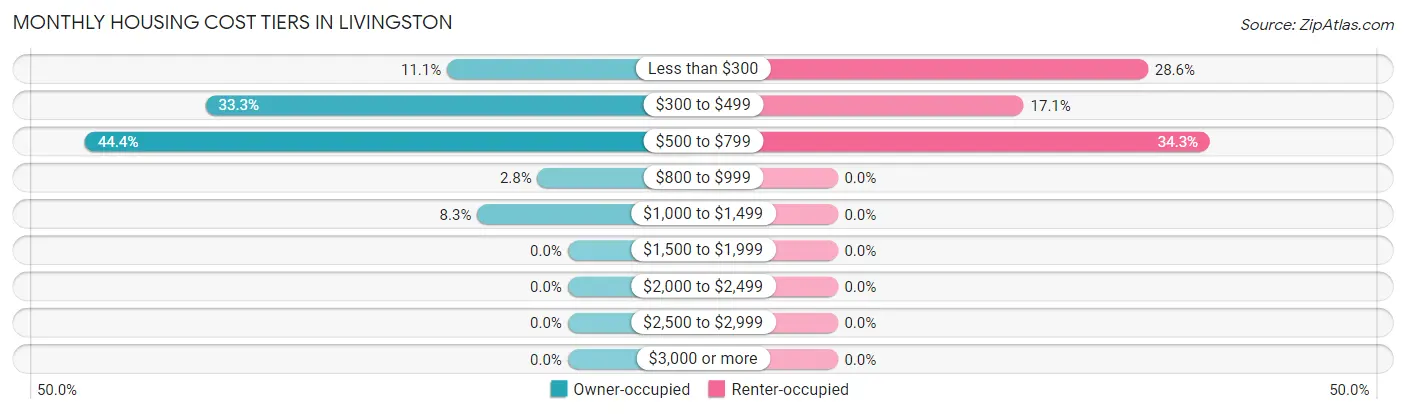
| Monthly Cost | Owner-occupied | Renter-occupied |
| Less than $300 | 4 (11.1%) | 10 (28.6%) |
| $300 to $499 | 12 (33.3%) | 6 (17.1%) |
| $500 to $799 | 16 (44.4%) | 12 (34.3%) |
| $800 to $999 | 1 (2.8%) | 0 (0.0%) |
| $1,000 to $1,499 | 3 (8.3%) | 0 (0.0%) |
| $1,500 to $1,999 | 0 (0.0%) | 0 (0.0%) |
| $2,000 to $2,499 | 0 (0.0%) | 0 (0.0%) |
| $2,500 to $2,999 | 0 (0.0%) | 0 (0.0%) |
| $3,000 or more | 0 (0.0%) | 0 (0.0%) |
| Total | 36 (100.0%) | 35 (100.0%) |
Physical Housing Characteristics in Livingston
Housing Structures in Livingston
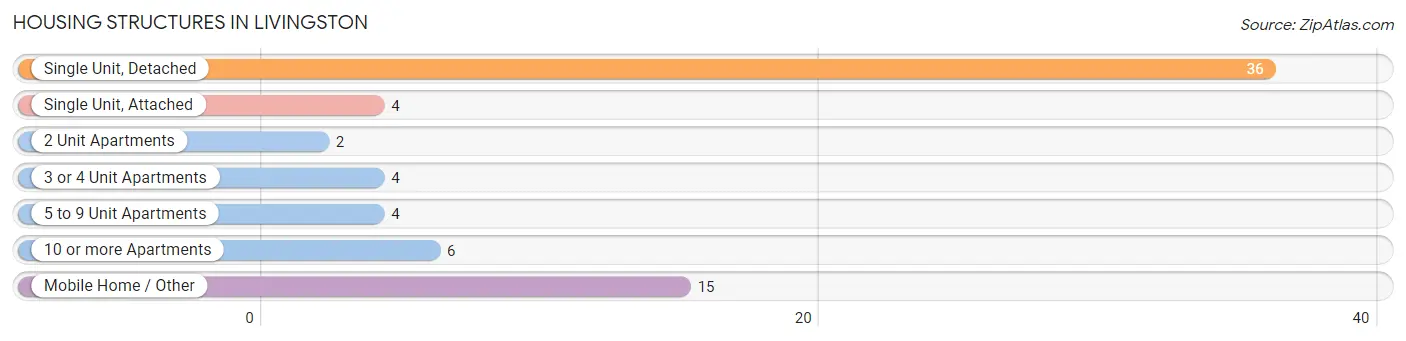
| Structure Type | # Housing Units | % Housing Units |
| Single Unit, Detached | 36 | 50.7% |
| Single Unit, Attached | 4 | 5.6% |
| 2 Unit Apartments | 2 | 2.8% |
| 3 or 4 Unit Apartments | 4 | 5.6% |
| 5 to 9 Unit Apartments | 4 | 5.6% |
| 10 or more Apartments | 6 | 8.5% |
| Mobile Home / Other | 15 | 21.1% |
| Total | 71 | 100.0% |
Housing Structures by Occupancy in Livingston
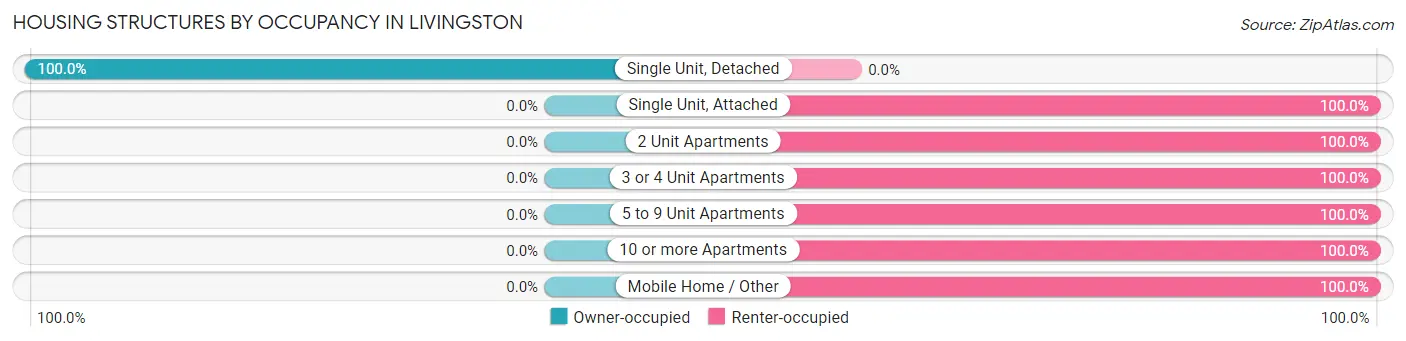
| Structure Type | Owner-occupied | Renter-occupied |
| Single Unit, Detached | 36 (100.0%) | 0 (0.0%) |
| Single Unit, Attached | 0 (0.0%) | 4 (100.0%) |
| 2 Unit Apartments | 0 (0.0%) | 2 (100.0%) |
| 3 or 4 Unit Apartments | 0 (0.0%) | 4 (100.0%) |
| 5 to 9 Unit Apartments | 0 (0.0%) | 4 (100.0%) |
| 10 or more Apartments | 0 (0.0%) | 6 (100.0%) |
| Mobile Home / Other | 0 (0.0%) | 15 (100.0%) |
| Total | 36 (50.7%) | 35 (49.3%) |
Housing Structures by Number of Rooms in Livingston
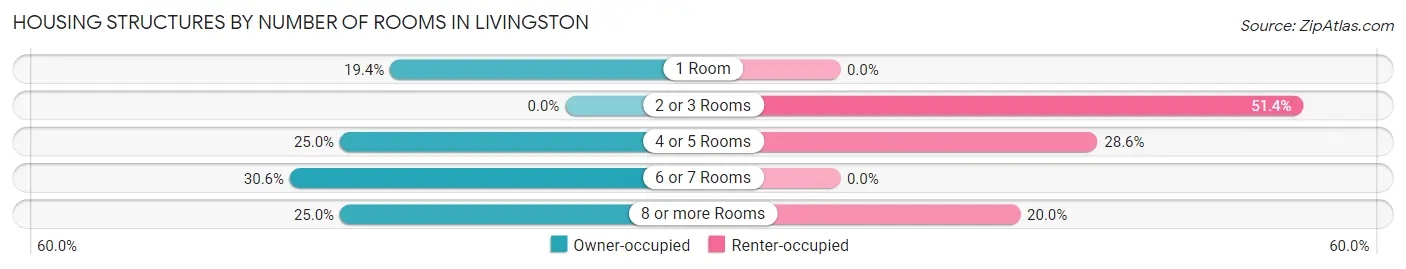
| Number of Rooms | Owner-occupied | Renter-occupied |
| 1 Room | 7 (19.4%) | 0 (0.0%) |
| 2 or 3 Rooms | 0 (0.0%) | 18 (51.4%) |
| 4 or 5 Rooms | 9 (25.0%) | 10 (28.6%) |
| 6 or 7 Rooms | 11 (30.6%) | 0 (0.0%) |
| 8 or more Rooms | 9 (25.0%) | 7 (20.0%) |
| Total | 36 (100.0%) | 35 (100.0%) |
Housing Structure by Heating Type in Livingston
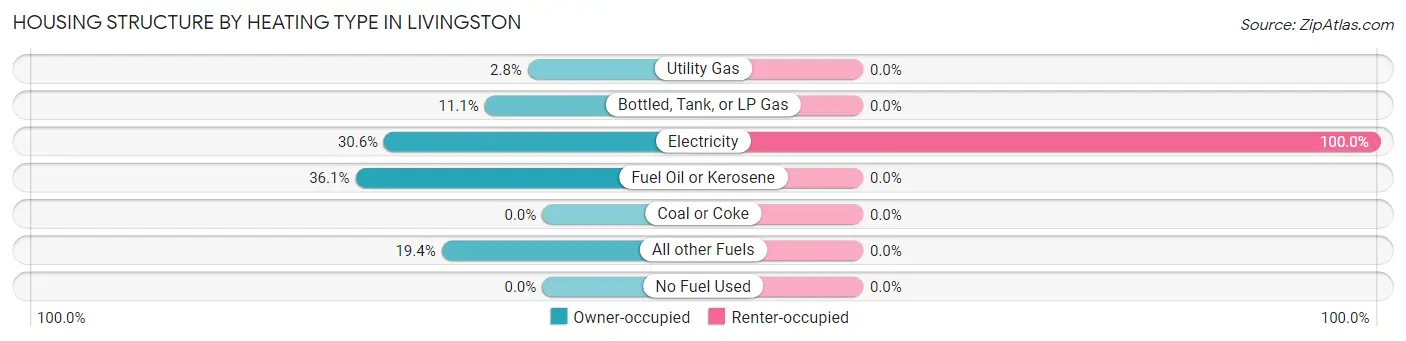
| Heating Type | Owner-occupied | Renter-occupied |
| Utility Gas | 1 (2.8%) | 0 (0.0%) |
| Bottled, Tank, or LP Gas | 4 (11.1%) | 0 (0.0%) |
| Electricity | 11 (30.6%) | 35 (100.0%) |
| Fuel Oil or Kerosene | 13 (36.1%) | 0 (0.0%) |
| Coal or Coke | 0 (0.0%) | 0 (0.0%) |
| All other Fuels | 7 (19.4%) | 0 (0.0%) |
| No Fuel Used | 0 (0.0%) | 0 (0.0%) |
| Total | 36 (100.0%) | 35 (100.0%) |
Household Vehicle Usage in Livingston
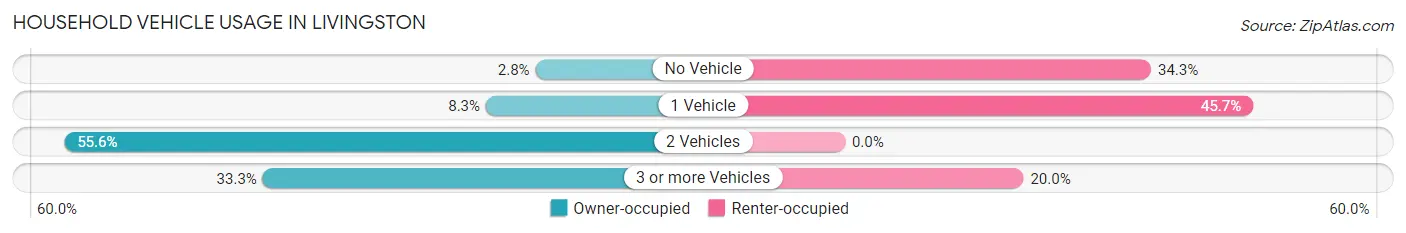
| Vehicles per Household | Owner-occupied | Renter-occupied |
| No Vehicle | 1 (2.8%) | 12 (34.3%) |
| 1 Vehicle | 3 (8.3%) | 16 (45.7%) |
| 2 Vehicles | 20 (55.6%) | 0 (0.0%) |
| 3 or more Vehicles | 12 (33.3%) | 7 (20.0%) |
| Total | 36 (100.0%) | 35 (100.0%) |
Real Estate & Mortgages in Livingston
Real Estate and Mortgage Overview in Livingston
| Characteristic | Without Mortgage | With Mortgage |
| Housing Units | 33 | 3 |
| Median Property Value | - | - |
| Median Household Income | $36,250 | $0 |
| Monthly Housing Costs | $506 | $0 |
| Real Estate Taxes | $388 | $0 |
Property Value by Mortgage Status in Livingston
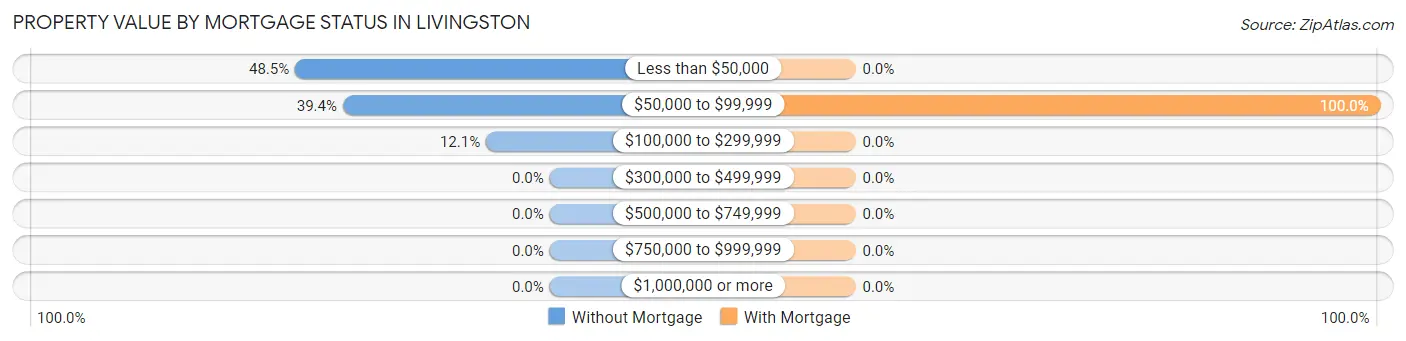
| Property Value | Without Mortgage | With Mortgage |
| Less than $50,000 | 16 (48.5%) | 0 (0.0%) |
| $50,000 to $99,999 | 13 (39.4%) | 3 (100.0%) |
| $100,000 to $299,999 | 4 (12.1%) | 0 (0.0%) |
| $300,000 to $499,999 | 0 (0.0%) | 0 (0.0%) |
| $500,000 to $749,999 | 0 (0.0%) | 0 (0.0%) |
| $750,000 to $999,999 | 0 (0.0%) | 0 (0.0%) |
| $1,000,000 or more | 0 (0.0%) | 0 (0.0%) |
| Total | 33 (100.0%) | 3 (100.0%) |
Household Income by Mortgage Status in Livingston
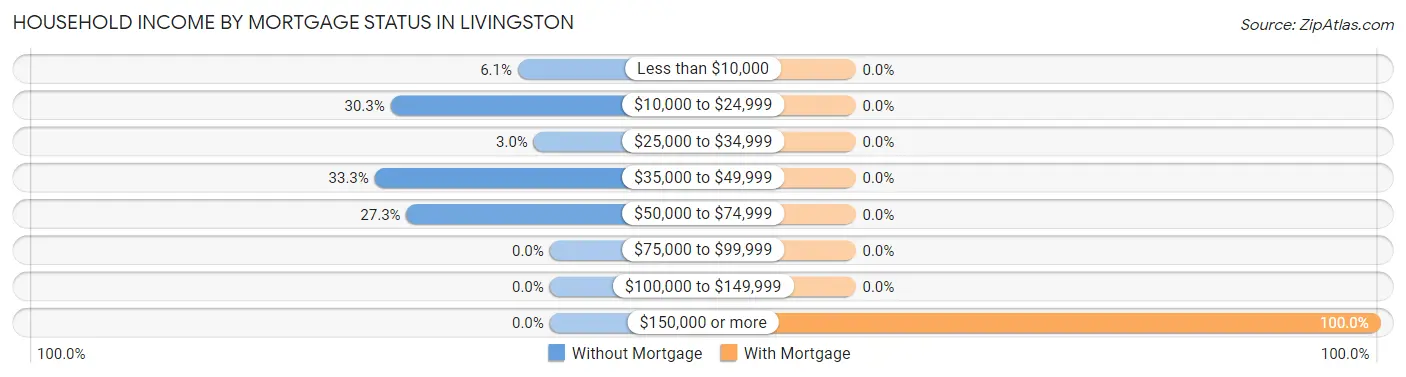
| Household Income | Without Mortgage | With Mortgage |
| Less than $10,000 | 2 (6.1%) | 0 (0.0%) |
| $10,000 to $24,999 | 10 (30.3%) | 0 (0.0%) |
| $25,000 to $34,999 | 1 (3.0%) | 0 (0.0%) |
| $35,000 to $49,999 | 11 (33.3%) | 0 (0.0%) |
| $50,000 to $74,999 | 9 (27.3%) | 0 (0.0%) |
| $75,000 to $99,999 | 0 (0.0%) | 0 (0.0%) |
| $100,000 to $149,999 | 0 (0.0%) | 0 (0.0%) |
| $150,000 or more | 0 (0.0%) | 3 (100.0%) |
| Total | 33 (100.0%) | 3 (100.0%) |
Property Value to Household Income Ratio in Livingston
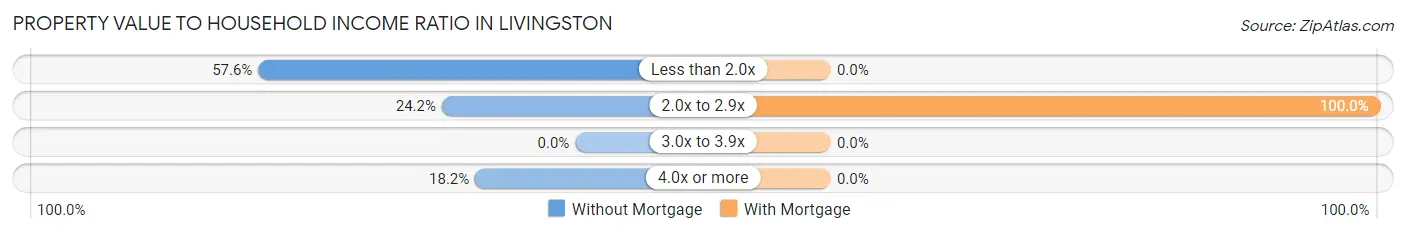
| Value-to-Income Ratio | Without Mortgage | With Mortgage |
| Less than 2.0x | 19 (57.6%) | 0 (0.0%) |
| 2.0x to 2.9x | 8 (24.2%) | 3 (100.0%) |
| 3.0x to 3.9x | 0 (0.0%) | 0 (0.0%) |
| 4.0x or more | 6 (18.2%) | 0 (0.0%) |
| Total | 33 (100.0%) | 3 (100.0%) |
Real Estate Taxes by Mortgage Status in Livingston
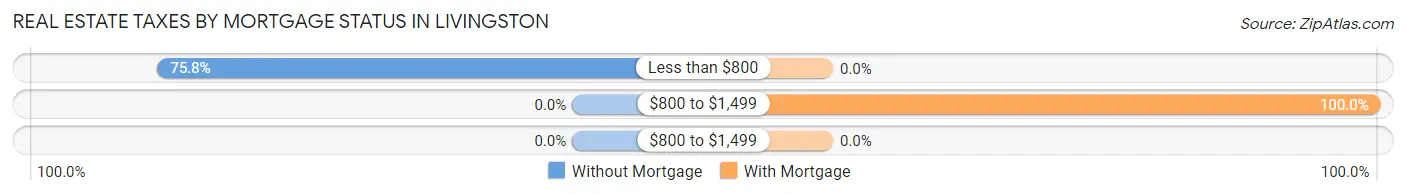
| Property Taxes | Without Mortgage | With Mortgage |
| Less than $800 | 25 (75.8%) | 0 (0.0%) |
| $800 to $1,499 | 0 (0.0%) | 3 (100.0%) |
| $800 to $1,499 | 0 (0.0%) | 0 (0.0%) |
| Total | 33 (100.0%) | 3 (100.0%) |
Health & Disability in Livingston
Health Insurance Coverage by Age in Livingston
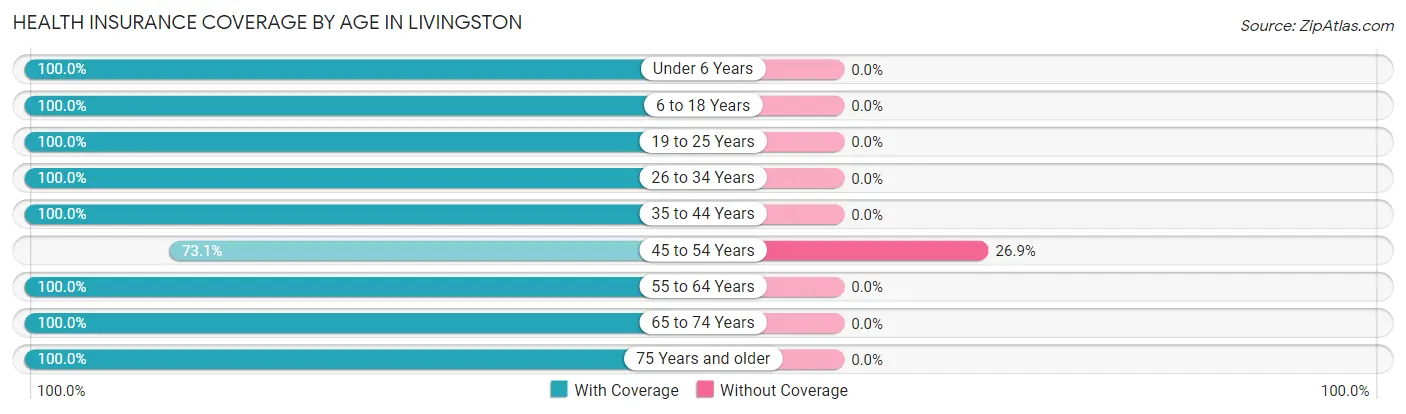
| Age Bracket | With Coverage | Without Coverage |
| Under 6 Years | 11 (100.0%) | 0 (0.0%) |
| 6 to 18 Years | 24 (100.0%) | 0 (0.0%) |
| 19 to 25 Years | 24 (100.0%) | 0 (0.0%) |
| 26 to 34 Years | 9 (100.0%) | 0 (0.0%) |
| 35 to 44 Years | 17 (100.0%) | 0 (0.0%) |
| 45 to 54 Years | 19 (73.1%) | 7 (26.9%) |
| 55 to 64 Years | 21 (100.0%) | 0 (0.0%) |
| 65 to 74 Years | 13 (100.0%) | 0 (0.0%) |
| 75 Years and older | 13 (100.0%) | 0 (0.0%) |
| Total | 151 (95.6%) | 7 (4.4%) |
Health Insurance Coverage by Citizenship Status in Livingston
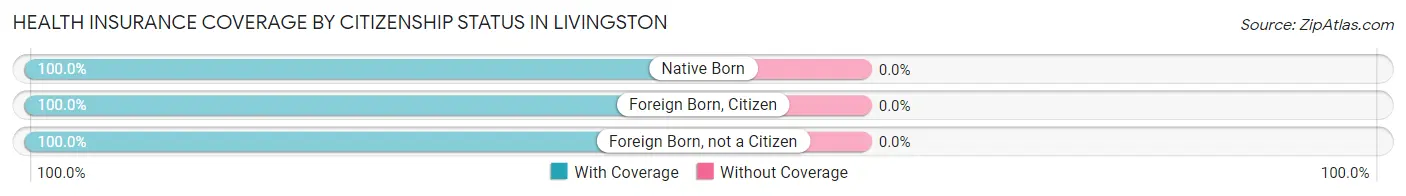
| Citizenship Status | With Coverage | Without Coverage |
| Native Born | 11 (100.0%) | 0 (0.0%) |
| Foreign Born, Citizen | 24 (100.0%) | 0 (0.0%) |
| Foreign Born, not a Citizen | 24 (100.0%) | 0 (0.0%) |
Health Insurance Coverage by Household Income in Livingston
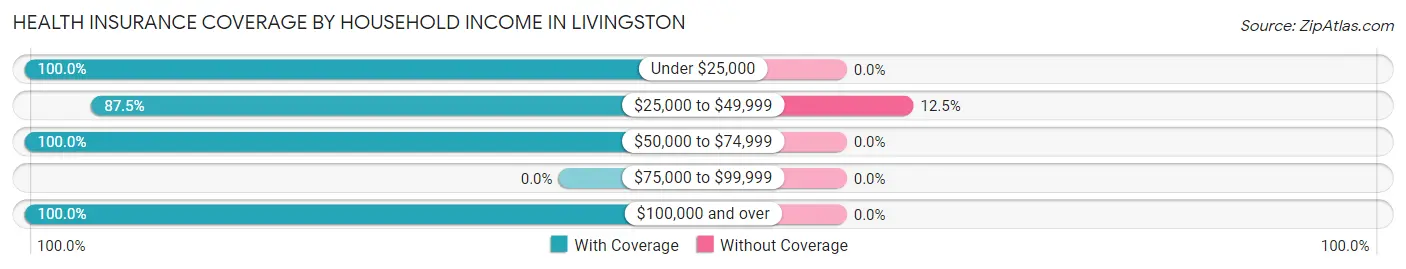
| Household Income | With Coverage | Without Coverage |
| Under $25,000 | 44 (100.0%) | 0 (0.0%) |
| $25,000 to $49,999 | 49 (87.5%) | 7 (12.5%) |
| $50,000 to $74,999 | 45 (100.0%) | 0 (0.0%) |
| $75,000 to $99,999 | 0 (0.0%) | 0 (0.0%) |
| $100,000 and over | 13 (100.0%) | 0 (0.0%) |
Public vs Private Health Insurance Coverage by Age in Livingston
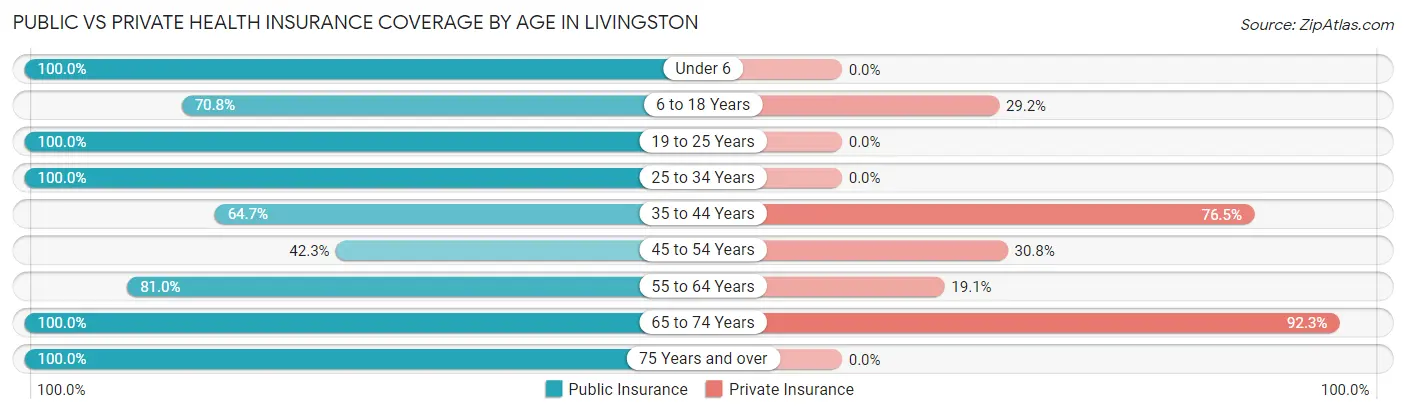
| Age Bracket | Public Insurance | Private Insurance |
| Under 6 | 11 (100.0%) | 0 (0.0%) |
| 6 to 18 Years | 17 (70.8%) | 7 (29.2%) |
| 19 to 25 Years | 24 (100.0%) | 0 (0.0%) |
| 25 to 34 Years | 9 (100.0%) | 0 (0.0%) |
| 35 to 44 Years | 11 (64.7%) | 13 (76.5%) |
| 45 to 54 Years | 11 (42.3%) | 8 (30.8%) |
| 55 to 64 Years | 17 (80.9%) | 4 (19.1%) |
| 65 to 74 Years | 13 (100.0%) | 12 (92.3%) |
| 75 Years and over | 13 (100.0%) | 0 (0.0%) |
| Total | 126 (79.7%) | 44 (27.9%) |
Disability Status by Sex by Age in Livingston
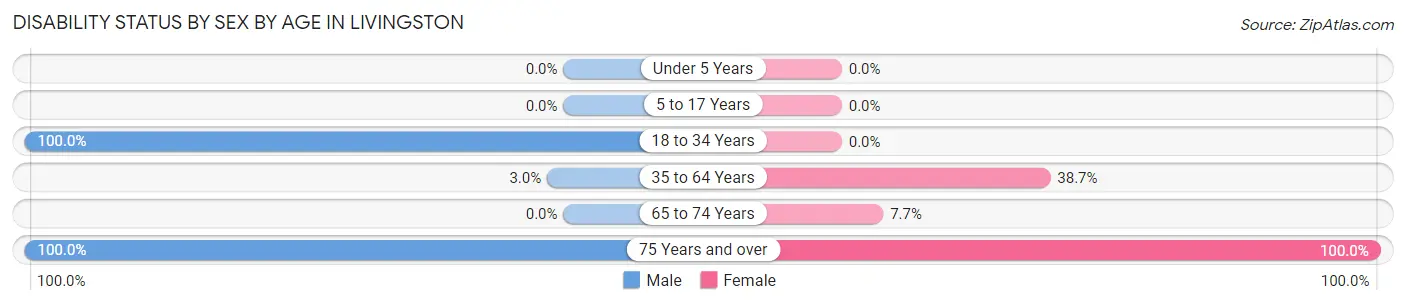
| Age Bracket | Male | Female |
| Under 5 Years | 0 (0.0%) | 0 (0.0%) |
| 5 to 17 Years | 0 (0.0%) | 0 (0.0%) |
| 18 to 34 Years | 8 (100.0%) | 0 (0.0%) |
| 35 to 64 Years | 1 (3.0%) | 12 (38.7%) |
| 65 to 74 Years | 0 (0.0%) | 1 (7.7%) |
| 75 Years and over | 6 (100.0%) | 7 (100.0%) |
Disability Class by Sex by Age in Livingston
Disability Class: Hearing Difficulty
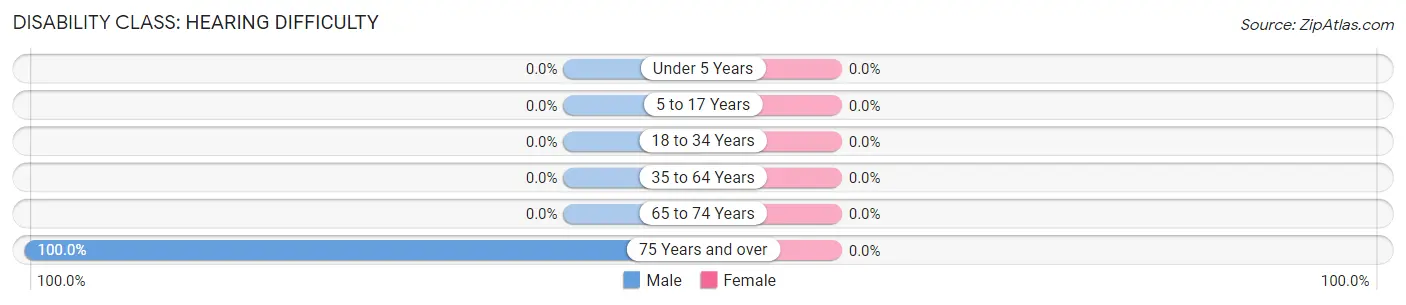
| Age Bracket | Male | Female |
| Under 5 Years | 0 (0.0%) | 0 (0.0%) |
| 5 to 17 Years | 0 (0.0%) | 0 (0.0%) |
| 18 to 34 Years | 0 (0.0%) | 0 (0.0%) |
| 35 to 64 Years | 0 (0.0%) | 0 (0.0%) |
| 65 to 74 Years | 0 (0.0%) | 0 (0.0%) |
| 75 Years and over | 6 (100.0%) | 0 (0.0%) |
Disability Class: Vision Difficulty
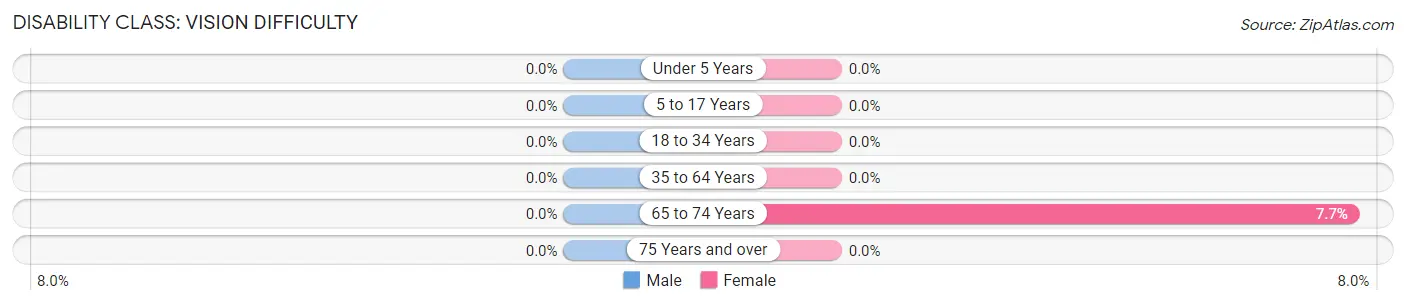
| Age Bracket | Male | Female |
| Under 5 Years | 0 (0.0%) | 0 (0.0%) |
| 5 to 17 Years | 0 (0.0%) | 0 (0.0%) |
| 18 to 34 Years | 0 (0.0%) | 0 (0.0%) |
| 35 to 64 Years | 0 (0.0%) | 0 (0.0%) |
| 65 to 74 Years | 0 (0.0%) | 1 (7.7%) |
| 75 Years and over | 0 (0.0%) | 0 (0.0%) |
Disability Class: Cognitive Difficulty
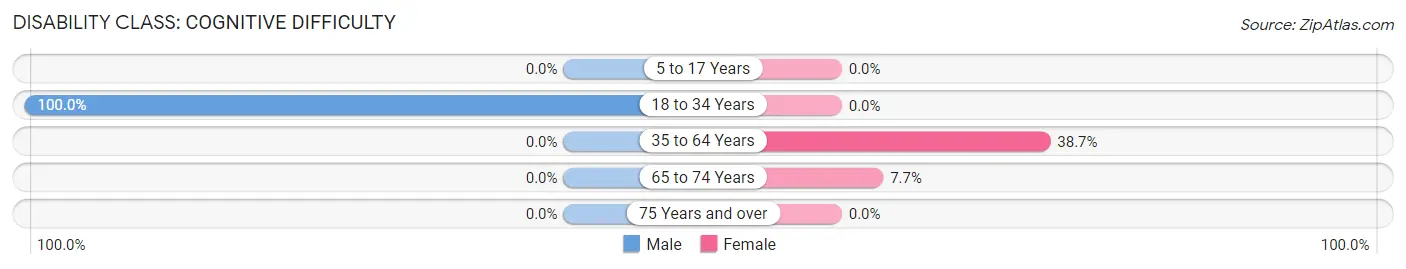
| Age Bracket | Male | Female |
| 5 to 17 Years | 0 (0.0%) | 0 (0.0%) |
| 18 to 34 Years | 8 (100.0%) | 0 (0.0%) |
| 35 to 64 Years | 0 (0.0%) | 12 (38.7%) |
| 65 to 74 Years | 0 (0.0%) | 1 (7.7%) |
| 75 Years and over | 0 (0.0%) | 0 (0.0%) |
Disability Class: Ambulatory Difficulty
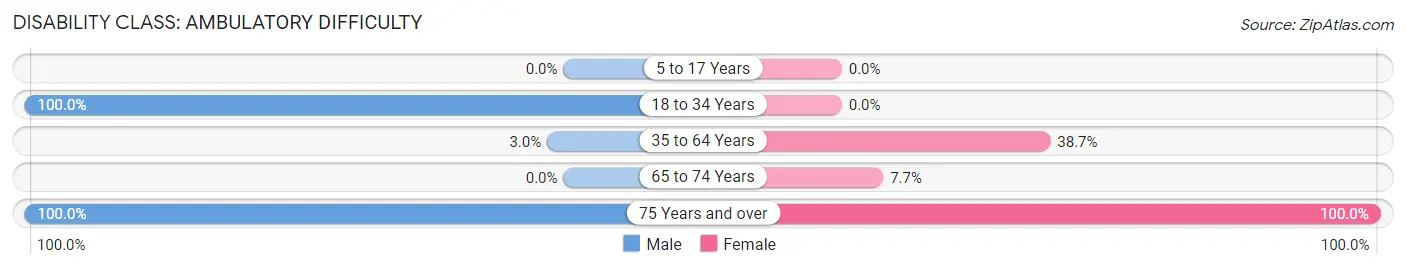
| Age Bracket | Male | Female |
| 5 to 17 Years | 0 (0.0%) | 0 (0.0%) |
| 18 to 34 Years | 8 (100.0%) | 0 (0.0%) |
| 35 to 64 Years | 1 (3.0%) | 12 (38.7%) |
| 65 to 74 Years | 0 (0.0%) | 1 (7.7%) |
| 75 Years and over | 6 (100.0%) | 7 (100.0%) |
Disability Class: Self-Care Difficulty
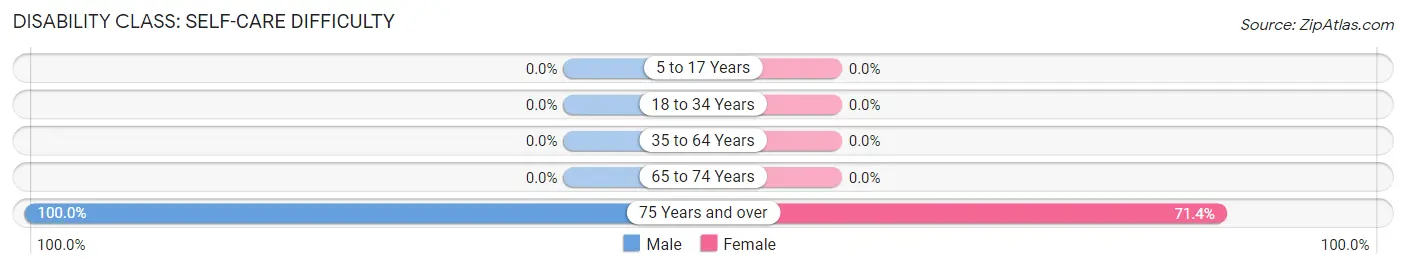
| Age Bracket | Male | Female |
| 5 to 17 Years | 0 (0.0%) | 0 (0.0%) |
| 18 to 34 Years | 0 (0.0%) | 0 (0.0%) |
| 35 to 64 Years | 0 (0.0%) | 0 (0.0%) |
| 65 to 74 Years | 0 (0.0%) | 0 (0.0%) |
| 75 Years and over | 6 (100.0%) | 5 (71.4%) |
Technology Access in Livingston
Computing Device Access in Livingston
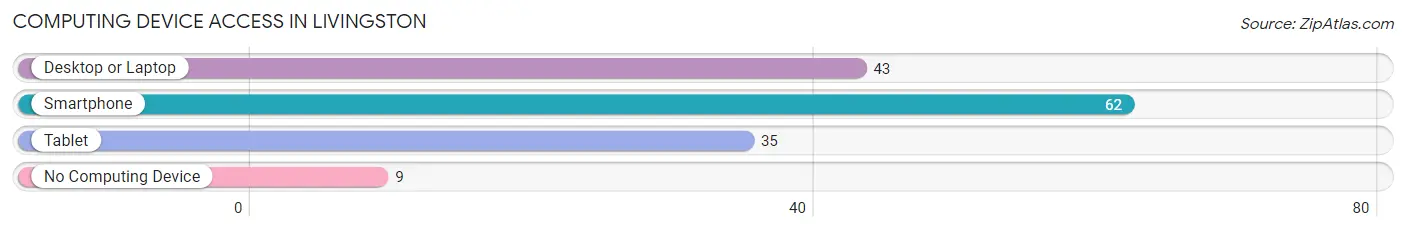
| Device Type | # Households | % Households |
| Desktop or Laptop | 43 | 60.6% |
| Smartphone | 62 | 87.3% |
| Tablet | 35 | 49.3% |
| No Computing Device | 9 | 12.7% |
| Total | 71 | 100.0% |
Internet Access in Livingston
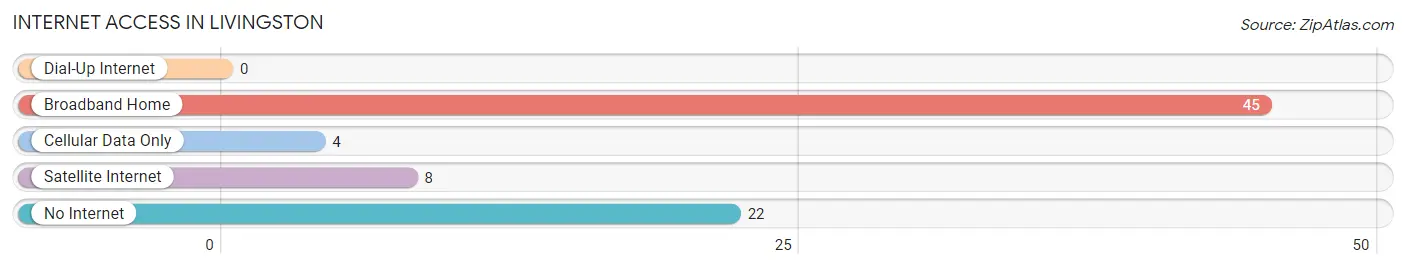
| Internet Type | # Households | % Households |
| Dial-Up Internet | 0 | 0.0% |
| Broadband Home | 45 | 63.4% |
| Cellular Data Only | 4 | 5.6% |
| Satellite Internet | 8 | 11.3% |
| No Internet | 22 | 31.0% |
| Total | 71 | 100.0% |
Livingston Summary
Livingston, Kentucky is a small town located in the western part of the state, in the foothills of the Appalachian Mountains. It is situated in the heart of the Daniel Boone National Forest, and is surrounded by rolling hills and lush forests. The town has a population of just over 1,000 people, and is the county seat of Livingston County.
Livingston has a rich history that dates back to the early 1800s. The town was founded in 1819 by a group of settlers from Virginia, led by William Livingston. The town was named after him, and he served as the first mayor. The town quickly grew, and by the mid-1800s, it was a thriving community with a variety of businesses, including a sawmill, a gristmill, a blacksmith shop, and a general store.
Livingston has a humid subtropical climate, with hot summers and mild winters. The average temperature in the summer is around 80 degrees Fahrenheit, and in the winter it is around 40 degrees Fahrenheit. The town receives an average of 45 inches of rain per year, and the average snowfall is around 10 inches.
Livingston is a small town, but it has a vibrant economy. The town is home to a variety of businesses, including a grocery store, a hardware store, a pharmacy, a bank, and a variety of restaurants. The town also has a number of small manufacturing businesses, including a furniture factory and a woodworking shop. The town is also home to a number of small farms, which produce a variety of crops, including corn, soybeans, and hay.
Livingston has a diverse population, with a variety of ethnic backgrounds. The majority of the population is white, but there is also a significant African American population, as well as a small Hispanic population. The town also has a small Native American population, as well as a small Asian population.
Livingston is a small town, but it has a lot to offer. It is a great place to live, work, and raise a family. The town has a rich history, a vibrant economy, and a diverse population. It is a great place to call home.
Common Questions
What is Per Capita Income in Livingston?
Per Capita income in Livingston is $15,907.
What is Inequality or Gini Index in Livingston?
Inequality or Gini Index in Livingston is 0.43.
What is the Total Population of Livingston?
Total Population of Livingston is 158.
What is the Total Male Population of Livingston?
Total Male Population of Livingston is 62.
What is the Total Female Population of Livingston?
Total Female Population of Livingston is 96.
What is the Ratio of Males per 100 Females in Livingston?
There are 64.58 Males per 100 Females in Livingston.
What is the Ratio of Females per 100 Males in Livingston?
There are 154.84 Females per 100 Males in Livingston.
What is the Median Population Age in Livingston?
Median Population Age in Livingston is 39.0 Years.
What is the Average Family Size in Livingston
Average Family Size in Livingston is 3.8 People.
What is the Average Household Size in Livingston
Average Household Size in Livingston is 2.2 People.
How Large is the Labor Force in Livingston?
There are 50 People in the Labor Forcein in Livingston.
What is the Percentage of People in the Labor Force in Livingston?
38.2% of People are in the Labor Force in Livingston.