Westport, KY Map & Demographics
Westport Map
Westport Overview
$33,973
PER CAPITA INCOME
$84,141
AVG FAMILY INCOME
$48,750
AVG HOUSEHOLD INCOME
0.39
INEQUALITY / GINI INDEX
206
TOTAL POPULATION
77
MALE POPULATION
129
FEMALE POPULATION
59.69
MALES / 100 FEMALES
167.53
FEMALES / 100 MALES
32.4
MEDIAN AGE
2.5
AVG FAMILY SIZE
1.9
AVG HOUSEHOLD SIZE
148
LABOR FORCE [ PEOPLE ]
80.0%
PERCENT IN LABOR FORCE
8.8%
UNEMPLOYMENT RATE
Westport Zip Codes
Westport Area Codes
Income in Westport
Income Overview in Westport
Per Capita Income in Westport is $33,973, while median incomes of families and households are $84,141 and $48,750 respectively.
| Characteristic | Number | Measure |
| Per Capita Income | 206 | $33,973 |
| Median Family Income | 63 | $84,141 |
| Mean Family Income | 63 | $83,810 |
| Median Household Income | 111 | $48,750 |
| Mean Household Income | 111 | $63,498 |
| Income Deficit | 63 | $0 |
| Wage / Income Gap (%) | 206 | 0.00% |
| Wage / Income Gap ($) | 206 | 100.00¢ per $1 |
| Gini / Inequality Index | 206 | 0.39 |
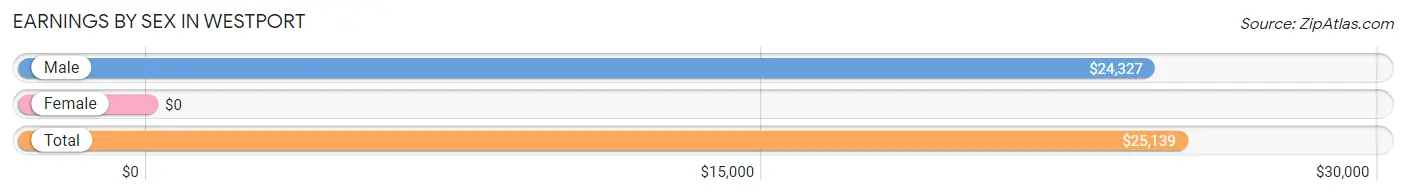
Earnings by Sex in Westport
| Sex | Number | Average Earnings |
| Male | 61 (39.4%) | $24,327 |
| Female | 94 (60.7%) | $0 |
| Total | 155 (100.0%) | $25,139 |
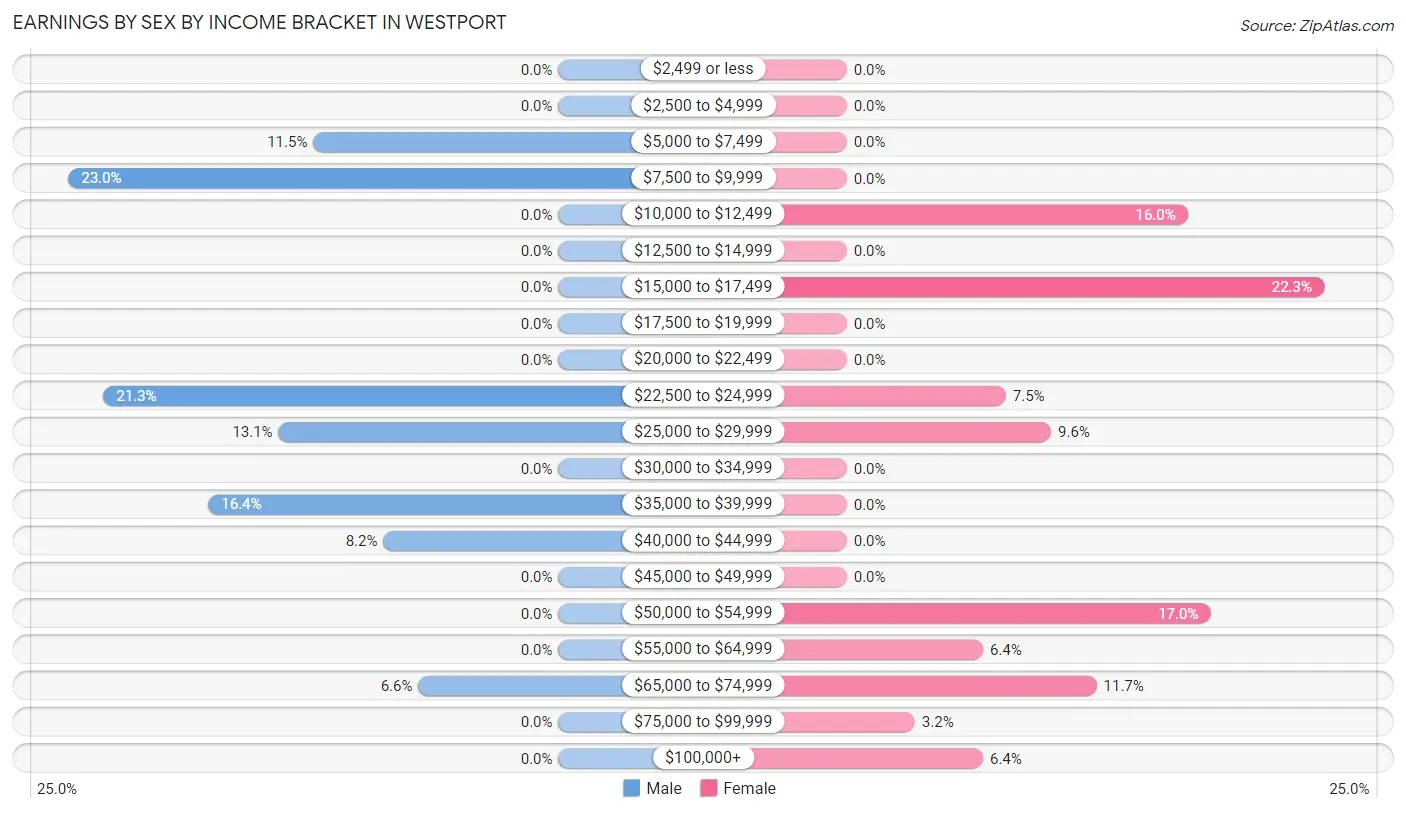
Earnings by Sex by Income Bracket in Westport
The most common earnings brackets in Westport are $7,500 to $9,999 for men (14 | 23.0%) and $15,000 to $17,499 for women (21 | 22.3%).
| Income | Male | Female |
| $2,499 or less | 0 (0.0%) | 0 (0.0%) |
| $2,500 to $4,999 | 0 (0.0%) | 0 (0.0%) |
| $5,000 to $7,499 | 7 (11.5%) | 0 (0.0%) |
| $7,500 to $9,999 | 14 (23.0%) | 0 (0.0%) |
| $10,000 to $12,499 | 0 (0.0%) | 15 (16.0%) |
| $12,500 to $14,999 | 0 (0.0%) | 0 (0.0%) |
| $15,000 to $17,499 | 0 (0.0%) | 21 (22.3%) |
| $17,500 to $19,999 | 0 (0.0%) | 0 (0.0%) |
| $20,000 to $22,499 | 0 (0.0%) | 0 (0.0%) |
| $22,500 to $24,999 | 13 (21.3%) | 7 (7.4%) |
| $25,000 to $29,999 | 8 (13.1%) | 9 (9.6%) |
| $30,000 to $34,999 | 0 (0.0%) | 0 (0.0%) |
| $35,000 to $39,999 | 10 (16.4%) | 0 (0.0%) |
| $40,000 to $44,999 | 5 (8.2%) | 0 (0.0%) |
| $45,000 to $49,999 | 0 (0.0%) | 0 (0.0%) |
| $50,000 to $54,999 | 0 (0.0%) | 16 (17.0%) |
| $55,000 to $64,999 | 0 (0.0%) | 6 (6.4%) |
| $65,000 to $74,999 | 4 (6.6%) | 11 (11.7%) |
| $75,000 to $99,999 | 0 (0.0%) | 3 (3.2%) |
| $100,000+ | 0 (0.0%) | 6 (6.4%) |
| Total | 61 (100.0%) | 94 (100.0%) |
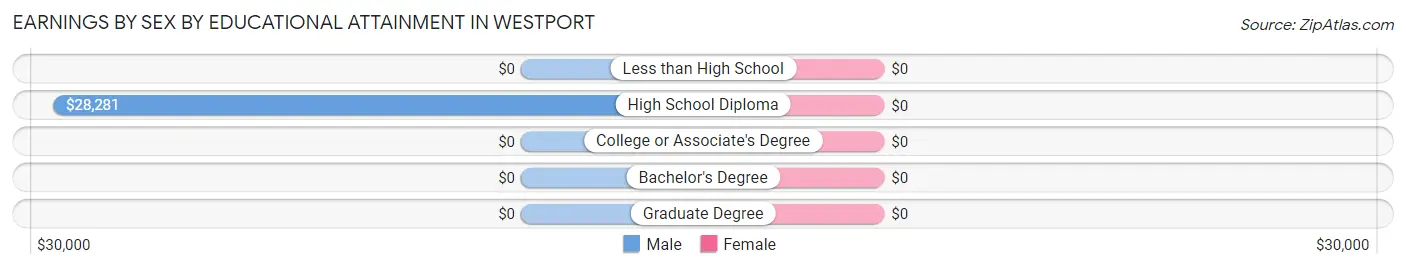
Earnings by Sex by Educational Attainment in Westport
| Educational Attainment | Male Income | Female Income |
| Less than High School | - | - |
| High School Diploma | $28,281 | $0 |
| College or Associate's Degree | - | - |
| Bachelor's Degree | - | - |
| Graduate Degree | - | - |
| Total | $24,712 | $0 |
Family Income in Westport
Family Income Brackets in Westport
According to the Westport family income data, there are 22 families falling into the $100,000 to $149,999 income range, which is the most common income bracket and makes up 34.9% of all families.

| Income Bracket | # Families | % Families |
| Less than $10,000 | 0 | 0.0% |
| $10,000 to $14,999 | 0 | 0.0% |
| $15,000 to $24,999 | 21 | 33.3% |
| $25,000 to $34,999 | 0 | 0.0% |
| $35,000 to $49,999 | 0 | 0.0% |
| $50,000 to $74,999 | 0 | 0.0% |
| $75,000 to $99,999 | 16 | 25.4% |
| $100,000 to $149,999 | 22 | 34.9% |
| $150,000 to $199,999 | 4 | 6.3% |
| $200,000+ | 0 | 0.0% |
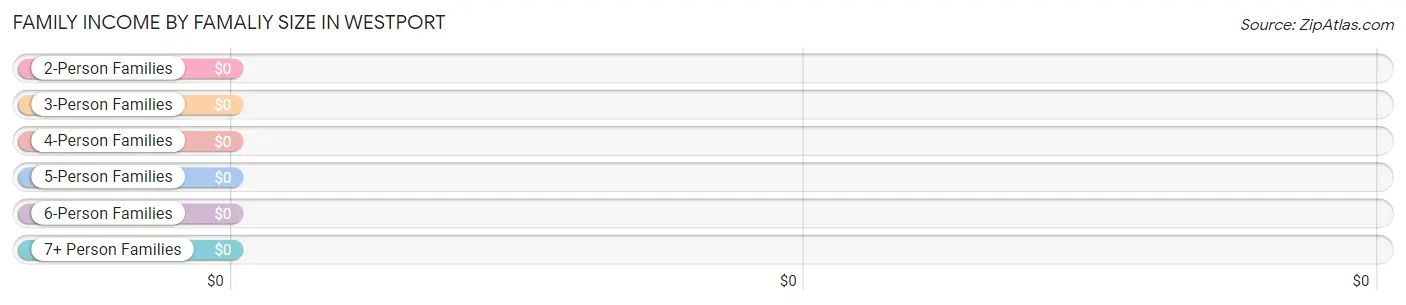
Family Income by Famaliy Size in Westport
| Income Bracket | # Families | Median Income |
| 2-Person Families | 27 (42.9%) | $0 |
| 3-Person Families | 25 (39.7%) | $0 |
| 4-Person Families | 4 (6.4%) | $0 |
| 5-Person Families | 7 (11.1%) | $0 |
| 6-Person Families | 0 (0.0%) | $0 |
| 7+ Person Families | 0 (0.0%) | $0 |
| Total | 63 (100.0%) | $84,141 |
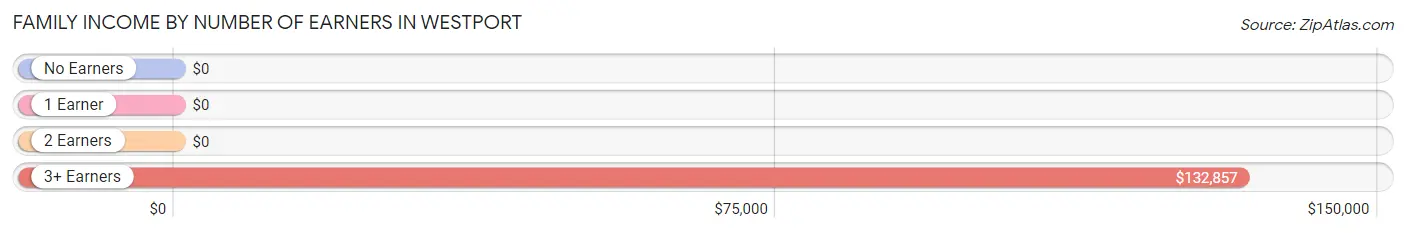
Family Income by Number of Earners in Westport
| Number of Earners | # Families | Median Income |
| No Earners | 0 (0.0%) | $0 |
| 1 Earner | 0 (0.0%) | $0 |
| 2 Earners | 43 (68.2%) | $0 |
| 3+ Earners | 20 (31.8%) | $132,857 |
| Total | 63 (100.0%) | $84,141 |
Household Income in Westport
Household Income Brackets in Westport
With 27 households falling in the category, the $35,000 to $49,999 income range is the most frequent in Westport, accounting for 24.3% of all households.
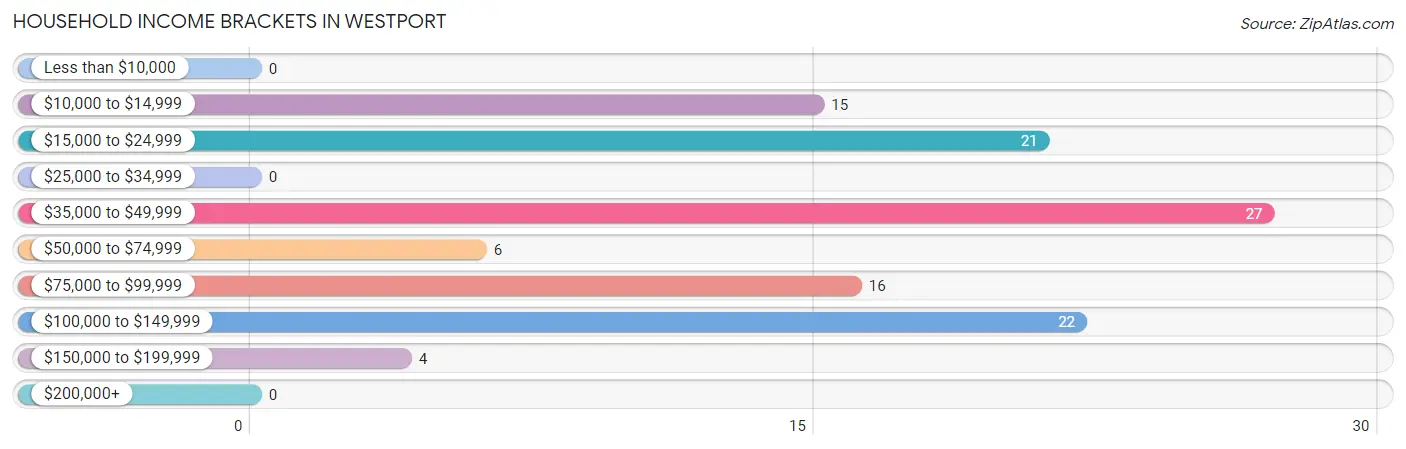
| Income Bracket | # Households | % Households |
| Less than $10,000 | 0 | 0.0% |
| $10,000 to $14,999 | 15 | 13.5% |
| $15,000 to $24,999 | 21 | 18.9% |
| $25,000 to $34,999 | 0 | 0.0% |
| $35,000 to $49,999 | 27 | 24.3% |
| $50,000 to $74,999 | 6 | 5.4% |
| $75,000 to $99,999 | 16 | 14.4% |
| $100,000 to $149,999 | 22 | 19.8% |
| $150,000 to $199,999 | 4 | 3.6% |
| $200,000+ | 0 | 0.0% |
Household Income by Householder Age in Westport
The median household income in Westport is $48,750, with the highest median household income of $48,833 found in the 45 to 64 years age bracket for the primary householder. A total of 46 households (41.4%) fall into this category.
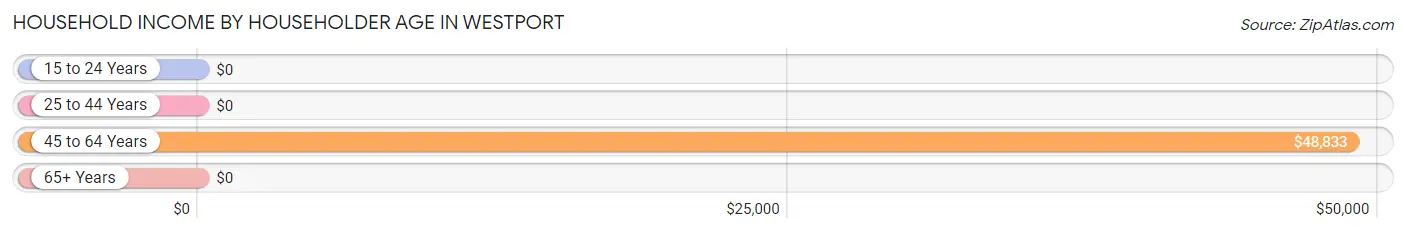
| Income Bracket | # Households | Median Income |
| 15 to 24 Years | 0 (0.0%) | $0 |
| 25 to 44 Years | 51 (46.0%) | $0 |
| 45 to 64 Years | 46 (41.4%) | $48,833 |
| 65+ Years | 14 (12.6%) | $0 |
| Total | 111 (100.0%) | $48,750 |
Poverty in Westport
Income Below Poverty by Sex and Age in Westport
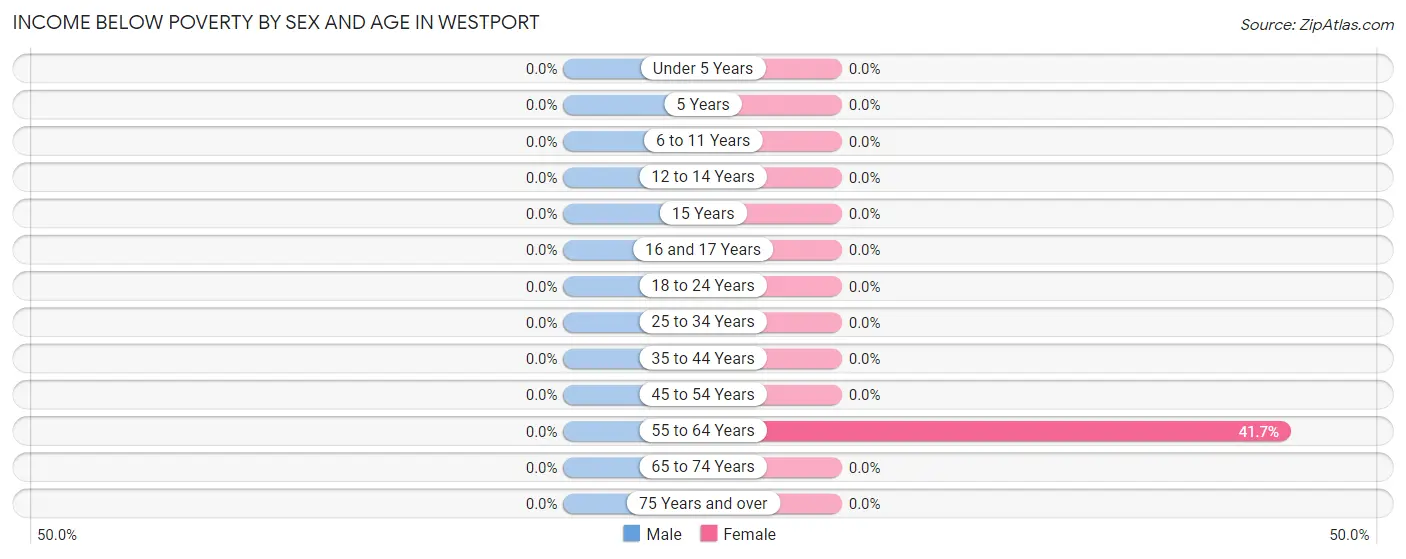
| Age Bracket | Male | Female |
| Under 5 Years | 0 (0.0%) | 0 (0.0%) |
| 5 Years | 0 (0.0%) | 0 (0.0%) |
| 6 to 11 Years | 0 (0.0%) | 0 (0.0%) |
| 12 to 14 Years | 0 (0.0%) | 0 (0.0%) |
| 15 Years | 0 (0.0%) | 0 (0.0%) |
| 16 and 17 Years | 0 (0.0%) | 0 (0.0%) |
| 18 to 24 Years | 0 (0.0%) | 0 (0.0%) |
| 25 to 34 Years | 0 (0.0%) | 0 (0.0%) |
| 35 to 44 Years | 0 (0.0%) | 0 (0.0%) |
| 45 to 54 Years | 0 (0.0%) | 0 (0.0%) |
| 55 to 64 Years | 0 (0.0%) | 15 (41.7%) |
| 65 to 74 Years | 0 (0.0%) | 0 (0.0%) |
| 75 Years and over | 0 (0.0%) | 0 (0.0%) |
| Total | 0 (0.0%) | 15 (11.6%) |
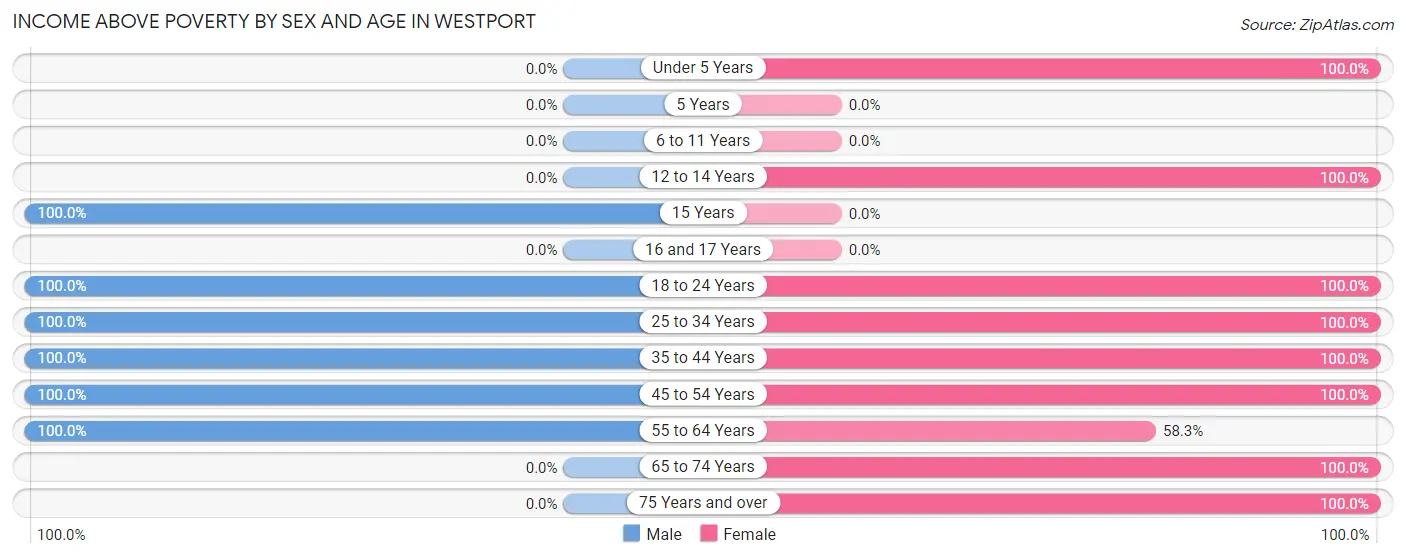
Income Above Poverty by Sex and Age in Westport
According to the poverty statistics in Westport, males aged 15 years and females aged under 5 years are the age groups that are most secure financially, with 100.0% of males and 100.0% of females in these age groups living above the poverty line.
| Age Bracket | Male | Female |
| Under 5 Years | 0 (0.0%) | 10 (100.0%) |
| 5 Years | 0 (0.0%) | 0 (0.0%) |
| 6 to 11 Years | 0 (0.0%) | 0 (0.0%) |
| 12 to 14 Years | 0 (0.0%) | 3 (100.0%) |
| 15 Years | 8 (100.0%) | 0 (0.0%) |
| 16 and 17 Years | 0 (0.0%) | 0 (0.0%) |
| 18 to 24 Years | 12 (100.0%) | 11 (100.0%) |
| 25 to 34 Years | 34 (100.0%) | 37 (100.0%) |
| 35 to 44 Years | 4 (100.0%) | 12 (100.0%) |
| 45 to 54 Years | 11 (100.0%) | 6 (100.0%) |
| 55 to 64 Years | 8 (100.0%) | 21 (58.3%) |
| 65 to 74 Years | 0 (0.0%) | 7 (100.0%) |
| 75 Years and over | 0 (0.0%) | 7 (100.0%) |
| Total | 77 (100.0%) | 114 (88.4%) |
Income Below Poverty Among Married-Couple Families in Westport
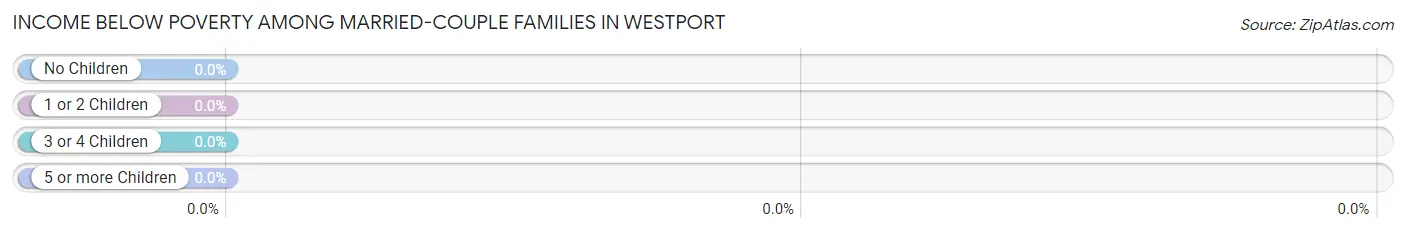
| Children | Above Poverty | Below Poverty |
| No Children | 30 (100.0%) | 0 (0.0%) |
| 1 or 2 Children | 20 (100.0%) | 0 (0.0%) |
| 3 or 4 Children | 0 (0.0%) | 0 (0.0%) |
| 5 or more Children | 0 (0.0%) | 0 (0.0%) |
| Total | 50 (100.0%) | 0 (0.0%) |
Income Below Poverty Among Single-Parent Households in Westport
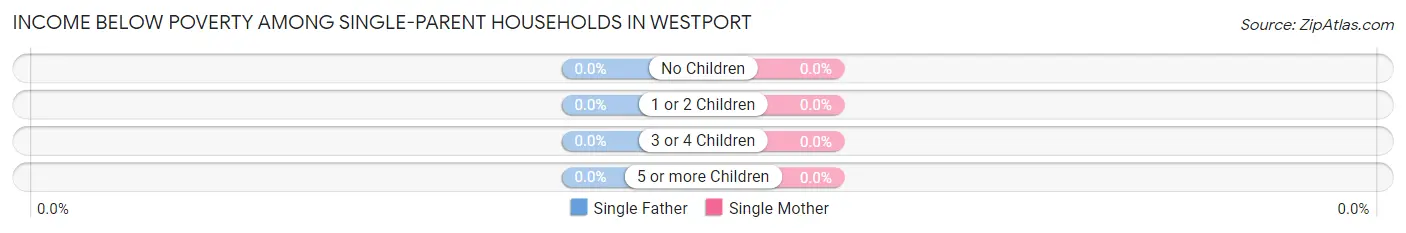
| Children | Single Father | Single Mother |
| No Children | 0 (0.0%) | 0 (0.0%) |
| 1 or 2 Children | 0 (0.0%) | 0 (0.0%) |
| 3 or 4 Children | 0 (0.0%) | 0 (0.0%) |
| 5 or more Children | 0 (0.0%) | 0 (0.0%) |
| Total | 0 (0.0%) | 0 (0.0%) |
Income Below Poverty Among Married-Couple vs Single-Parent Households in Westport
| Children | Married-Couple Families | Single-Parent Households |
| No Children | 0 (0.0%) | 0 (0.0%) |
| 1 or 2 Children | 0 (0.0%) | 0 (0.0%) |
| 3 or 4 Children | 0 (0.0%) | 0 (0.0%) |
| 5 or more Children | 0 (0.0%) | 0 (0.0%) |
| Total | 0 (0.0%) | 0 (0.0%) |
Race in Westport
The most populous races in Westport are White / Caucasian (181 | 87.9%), Two or more Races (25 | 12.1%), and Hispanic or Latino (21 | 10.2%).
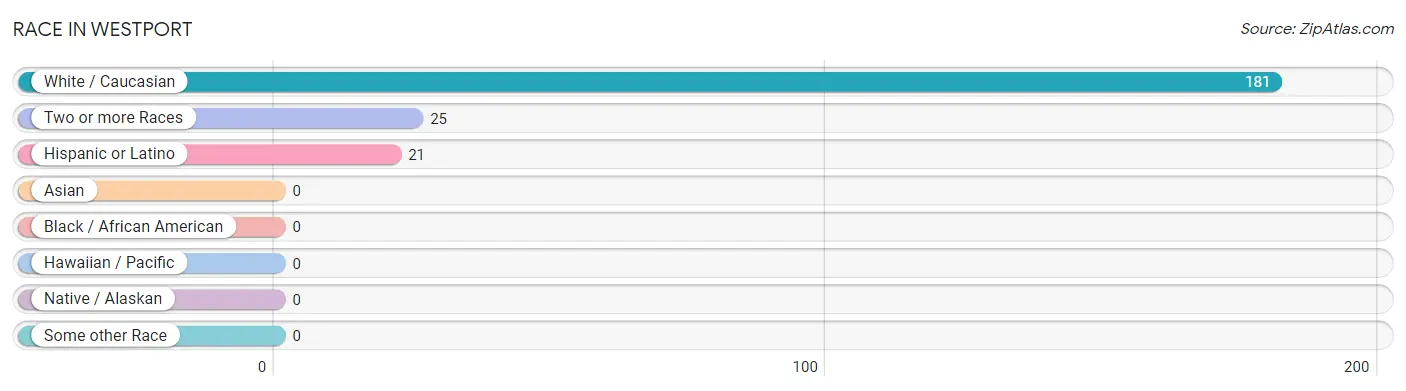
| Race | # Population | % Population |
| Asian | 0 | 0.0% |
| Black / African American | 0 | 0.0% |
| Hawaiian / Pacific | 0 | 0.0% |
| Hispanic or Latino | 21 | 10.2% |
| Native / Alaskan | 0 | 0.0% |
| White / Caucasian | 181 | 87.9% |
| Two or more Races | 25 | 12.1% |
| Some other Race | 0 | 0.0% |
| Total | 206 | 100.0% |
Ancestry in Westport
The most populous ancestries reported in Westport are American (46 | 22.3%), Mexican (21 | 10.2%), German (20 | 9.7%), Italian (15 | 7.3%), and Irish (14 | 6.8%), together accounting for 56.3% of all Westport residents.
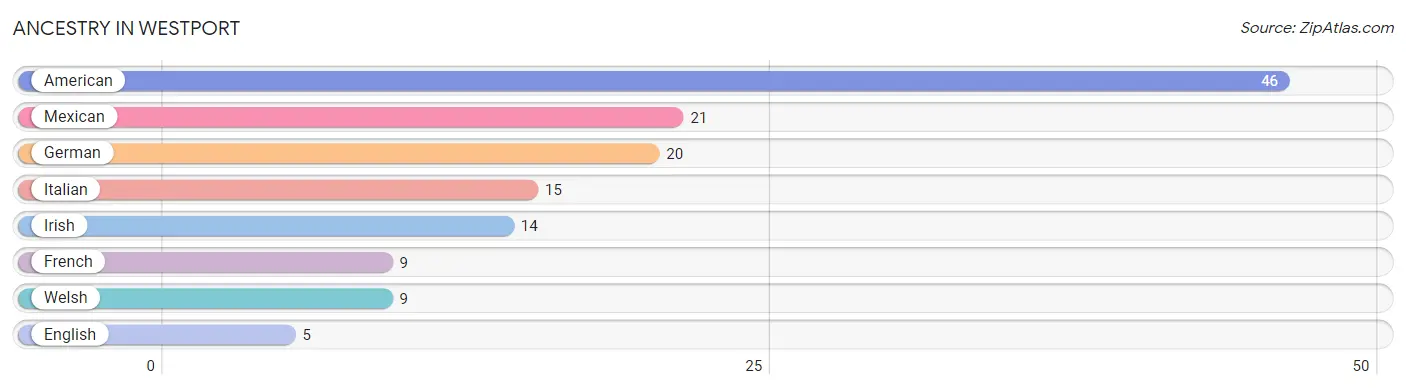
| Ancestry | # Population | % Population |
| American | 46 | 22.3% |
| English | 5 | 2.4% |
| French | 9 | 4.4% |
| German | 20 | 9.7% |
| Irish | 14 | 6.8% |
| Italian | 15 | 7.3% |
| Mexican | 21 | 10.2% |
| Welsh | 9 | 4.4% | View All 8 Rows |
Immigrants in Westport

| Immigration Origin | # Population | % Population | View All 0 Rows |
Sex and Age in Westport
Sex and Age in Westport
The most populous age groups in Westport are 25 to 29 Years (34 | 44.2%) for men and 30 to 34 Years (21 | 16.3%) for women.
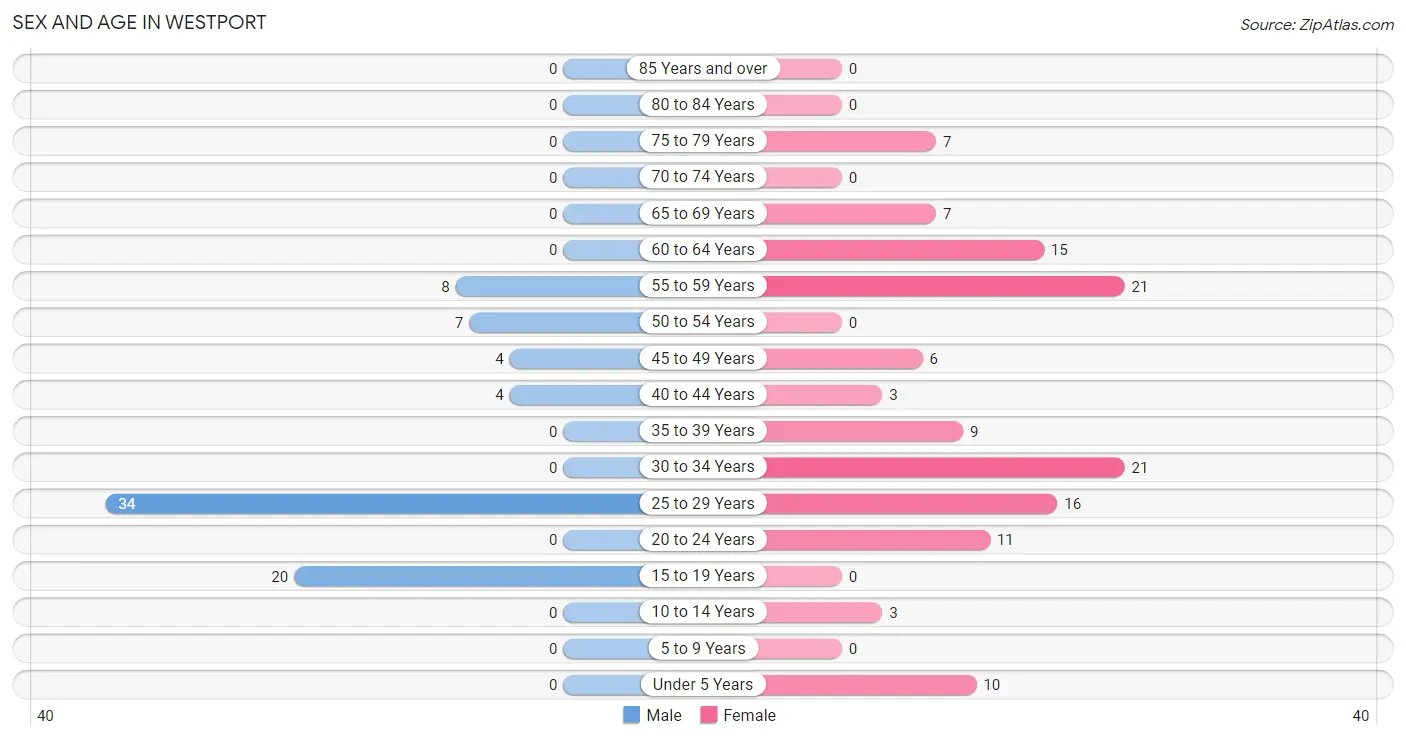
| Age Bracket | Male | Female |
| Under 5 Years | 0 (0.0%) | 10 (7.7%) |
| 5 to 9 Years | 0 (0.0%) | 0 (0.0%) |
| 10 to 14 Years | 0 (0.0%) | 3 (2.3%) |
| 15 to 19 Years | 20 (26.0%) | 0 (0.0%) |
| 20 to 24 Years | 0 (0.0%) | 11 (8.5%) |
| 25 to 29 Years | 34 (44.2%) | 16 (12.4%) |
| 30 to 34 Years | 0 (0.0%) | 21 (16.3%) |
| 35 to 39 Years | 0 (0.0%) | 9 (7.0%) |
| 40 to 44 Years | 4 (5.2%) | 3 (2.3%) |
| 45 to 49 Years | 4 (5.2%) | 6 (4.6%) |
| 50 to 54 Years | 7 (9.1%) | 0 (0.0%) |
| 55 to 59 Years | 8 (10.4%) | 21 (16.3%) |
| 60 to 64 Years | 0 (0.0%) | 15 (11.6%) |
| 65 to 69 Years | 0 (0.0%) | 7 (5.4%) |
| 70 to 74 Years | 0 (0.0%) | 0 (0.0%) |
| 75 to 79 Years | 0 (0.0%) | 7 (5.4%) |
| 80 to 84 Years | 0 (0.0%) | 0 (0.0%) |
| 85 Years and over | 0 (0.0%) | 0 (0.0%) |
| Total | 77 (100.0%) | 129 (100.0%) |
Families and Households in Westport
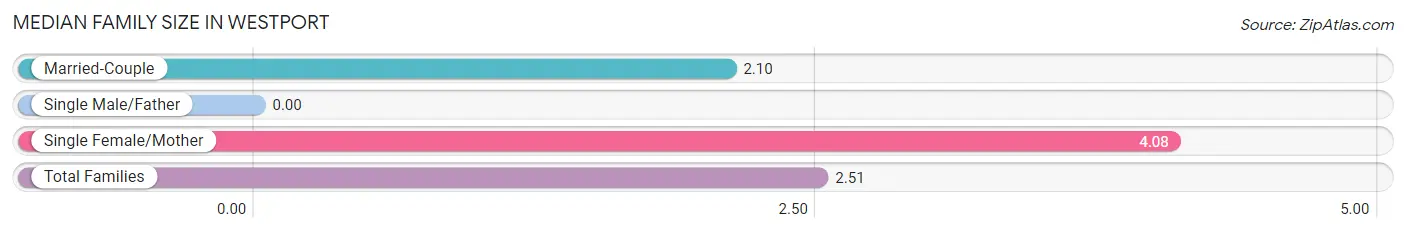
Median Family Size in Westport
| Family Type | # Families | Family Size |
| Married-Couple | 50 (79.4%) | 2.10 |
| Single Male/Father | 0 (0.0%) | - |
| Single Female/Mother | 13 (20.6%) | 4.08 |
| Total Families | 63 (100.0%) | 2.51 |
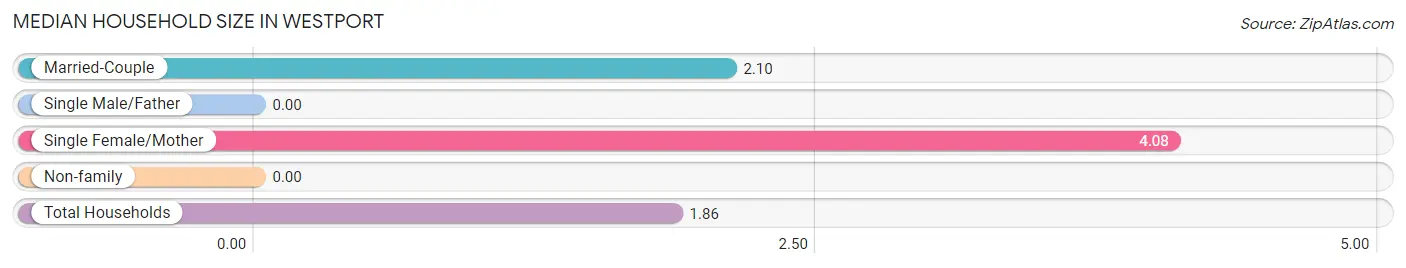
Median Household Size in Westport
| Household Type | # Households | Household Size |
| Married-Couple | 50 (45.1%) | 2.10 |
| Single Male/Father | 0 (0.0%) | - |
| Single Female/Mother | 13 (11.7%) | 4.08 |
| Non-family | 48 (43.2%) | - |
| Total Households | 111 (100.0%) | 1.86 |
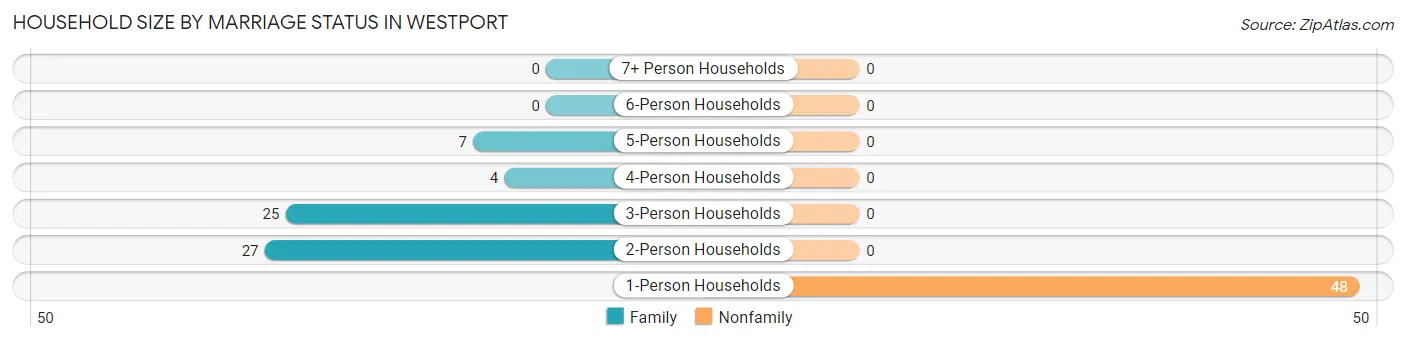
Household Size by Marriage Status in Westport
Out of a total of 111 households in Westport, 63 (56.8%) are family households, while 48 (43.2%) are nonfamily households. The most numerous type of family households are 2-person households, comprising 27, and the most common type of nonfamily households are 1-person households, comprising 48.
| Household Size | Family Households | Nonfamily Households |
| 1-Person Households | - | 48 (43.2%) |
| 2-Person Households | 27 (24.3%) | 0 (0.0%) |
| 3-Person Households | 25 (22.5%) | 0 (0.0%) |
| 4-Person Households | 4 (3.6%) | 0 (0.0%) |
| 5-Person Households | 7 (6.3%) | 0 (0.0%) |
| 6-Person Households | 0 (0.0%) | 0 (0.0%) |
| 7+ Person Households | 0 (0.0%) | 0 (0.0%) |
| Total | 63 (56.8%) | 48 (43.2%) |
Female Fertility in Westport
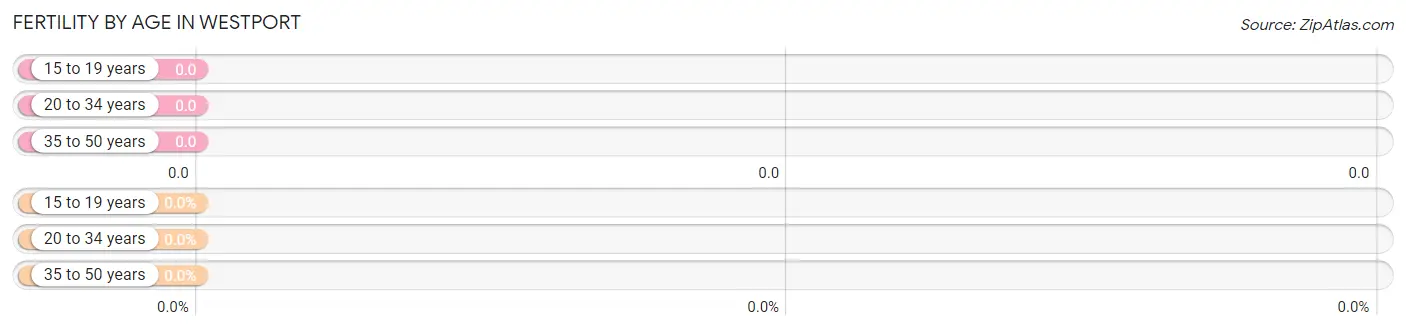
Fertility by Age in Westport
| Age Bracket | Women with Births | Births / 1,000 Women |
| 15 to 19 years | 0 (0.0%) | 0.0 |
| 20 to 34 years | 0 (0.0%) | 0.0 |
| 35 to 50 years | 0 (0.0%) | 0.0 |
| Total | 0 (0.0%) | 0.0 |
Fertility by Age by Marriage Status in Westport
| Age Bracket | Married | Unmarried |
| 15 to 19 years | 0 (0.0%) | 0 (0.0%) |
| 20 to 34 years | 0 (0.0%) | 0 (0.0%) |
| 35 to 50 years | 0 (0.0%) | 0 (0.0%) |
| Total | 0 (0.0%) | 0 (0.0%) |
Fertility by Education in Westport
| Educational Attainment | Women with Births | Births / 1,000 Women |
| Less than High School | 0 (0.0%) | 0.0 |
| High School Diploma | 0 (0.0%) | 0.0 |
| College or Associate's Degree | 0 (0.0%) | 0.0 |
| Bachelor's Degree | 0 (0.0%) | 0.0 |
| Graduate Degree | 0 (0.0%) | 0.0 |
| Total | 0 (0.0%) | 0.0 |
Fertility by Education by Marriage Status in Westport
| Educational Attainment | Married | Unmarried |
| Less than High School | 0 (0.0%) | 0 (0.0%) |
| High School Diploma | 0 (0.0%) | 0 (0.0%) |
| College or Associate's Degree | 0 (0.0%) | 0 (0.0%) |
| Bachelor's Degree | 0 (0.0%) | 0 (0.0%) |
| Graduate Degree | 0 (0.0%) | 0 (0.0%) |
| Total | 0 (0.0%) | 0 (0.0%) |
Employment Characteristics in Westport
Employment by Class of Employer in Westport
Among the 120 employed individuals in Westport, private company employees (92 | 76.7%), and self-employed (not incorporated) (28 | 23.3%) make up the most common classes of employment.
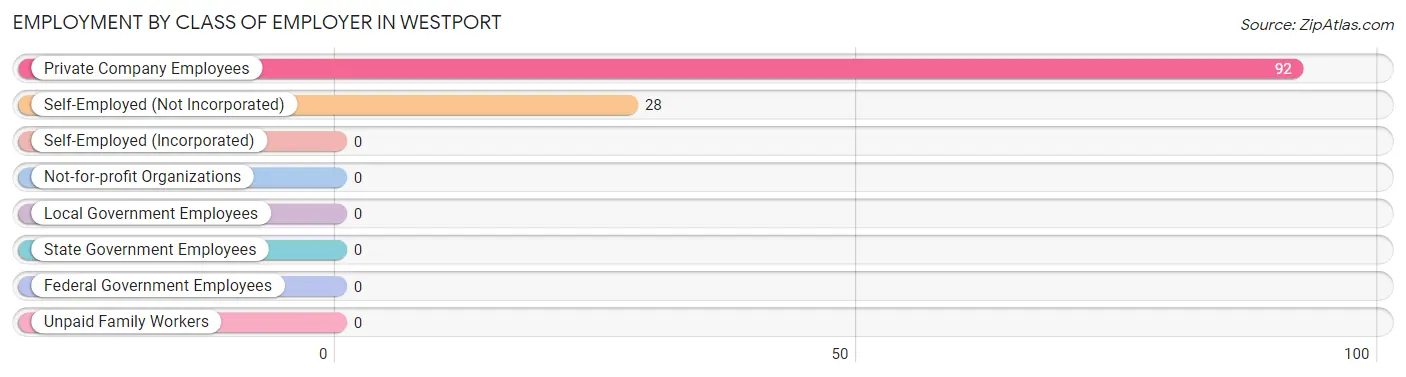
| Employer Class | # Employees | % Employees |
| Private Company Employees | 92 | 76.7% |
| Self-Employed (Incorporated) | 0 | 0.0% |
| Self-Employed (Not Incorporated) | 28 | 23.3% |
| Not-for-profit Organizations | 0 | 0.0% |
| Local Government Employees | 0 | 0.0% |
| State Government Employees | 0 | 0.0% |
| Federal Government Employees | 0 | 0.0% |
| Unpaid Family Workers | 0 | 0.0% |
| Total | 120 | 100.0% |
Employment Status by Age in Westport
According to the labor force statistics for Westport, out of the total population over 16 years of age (185), 80.0% or 148 individuals are in the labor force, with 8.8% or 13 of them unemployed. The age group with the highest labor force participation rate is 20 to 24 years, with 100.0% or 11 individuals in the labor force. Within the labor force, the 35 to 44 years age range has the highest percentage of unemployed individuals, with 81.3% or 13 of them being unemployed.
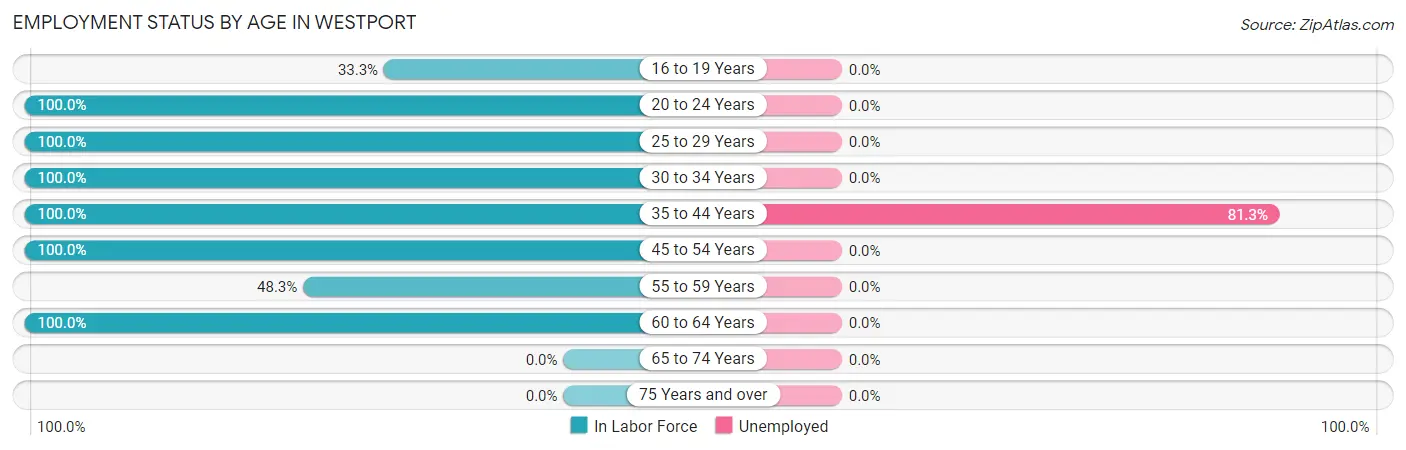
| Age Bracket | In Labor Force | Unemployed |
| 16 to 19 Years | 4 (33.3%) | 0 (0.0%) |
| 20 to 24 Years | 11 (100.0%) | 0 (0.0%) |
| 25 to 29 Years | 50 (100.0%) | 0 (0.0%) |
| 30 to 34 Years | 21 (100.0%) | 0 (0.0%) |
| 35 to 44 Years | 16 (100.0%) | 13 (81.3%) |
| 45 to 54 Years | 17 (100.0%) | 0 (0.0%) |
| 55 to 59 Years | 14 (48.3%) | 0 (0.0%) |
| 60 to 64 Years | 15 (100.0%) | 0 (0.0%) |
| 65 to 74 Years | 0 (0.0%) | 0 (0.0%) |
| 75 Years and over | 0 (0.0%) | 0 (0.0%) |
| Total | 148 (80.0%) | 13 (8.8%) |
Employment Status by Educational Attainment in Westport
According to labor force statistics for Westport, 89.9% of individuals (133) out of the total population between 25 and 64 years of age (148) are in the labor force, with 9.8% or 13 of them being unemployed. The group with the highest labor force participation rate are those with the educational attainment of less than high school, with 100.0% or 7 individuals in the labor force. Within the labor force, individuals with college / associate degree education have the highest percentage of unemployment, with 28.6% or 4 of them being unemployed.
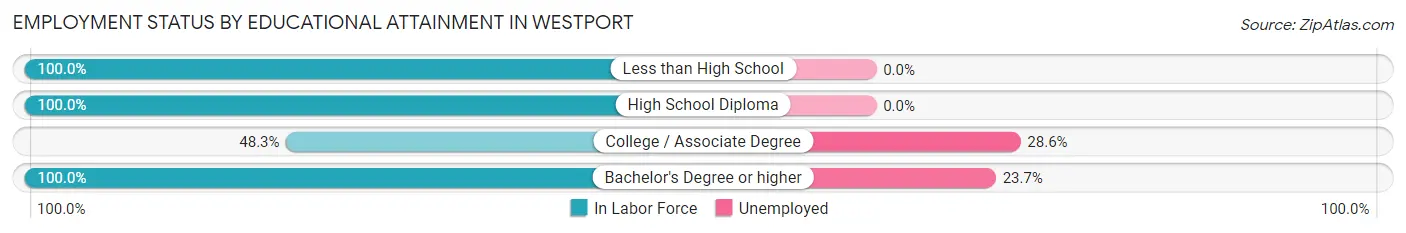
| Educational Attainment | In Labor Force | Unemployed |
| Less than High School | 7 (100.0%) | 0 (0.0%) |
| High School Diploma | 74 (100.0%) | 0 (0.0%) |
| College / Associate Degree | 14 (48.3%) | 8 (28.6%) |
| Bachelor's Degree or higher | 38 (100.0%) | 9 (23.7%) |
| Total | 133 (89.9%) | 15 (9.8%) |
Employment Occupations by Sex in Westport
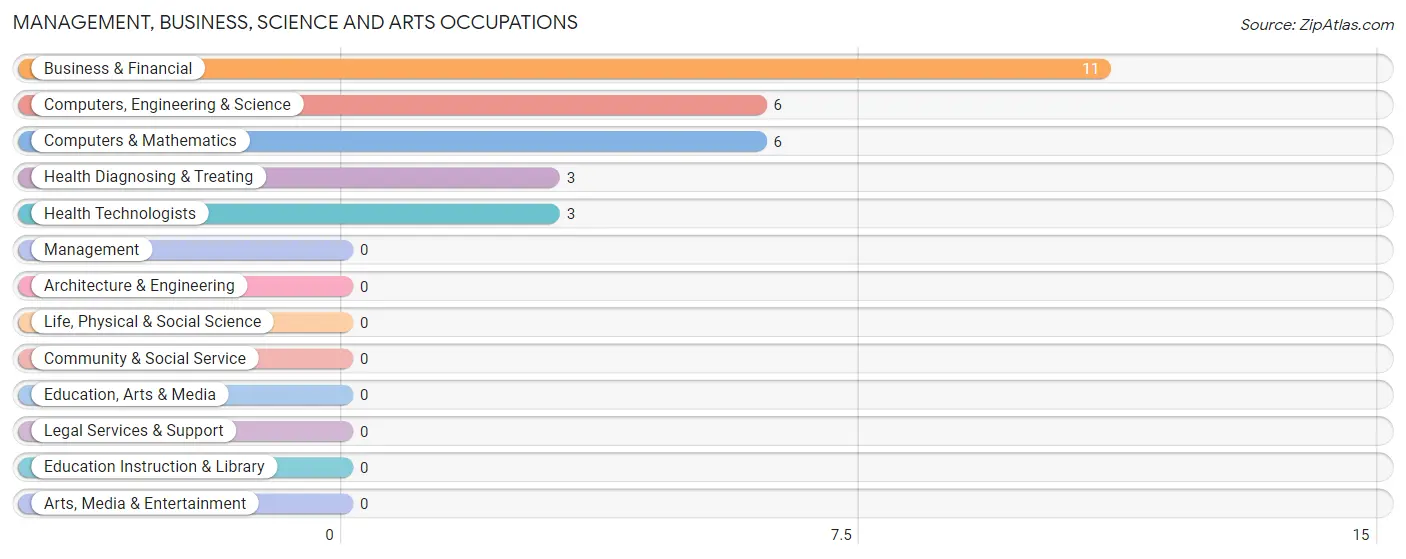
Management, Business, Science and Arts Occupations
The most common Management, Business, Science and Arts occupations in Westport are Business & Financial (11 | 8.2%), Computers, Engineering & Science (6 | 4.4%), Computers & Mathematics (6 | 4.4%), Health Diagnosing & Treating (3 | 2.2%), and Health Technologists (3 | 2.2%).
Management, Business, Science and Arts Occupations by Sex
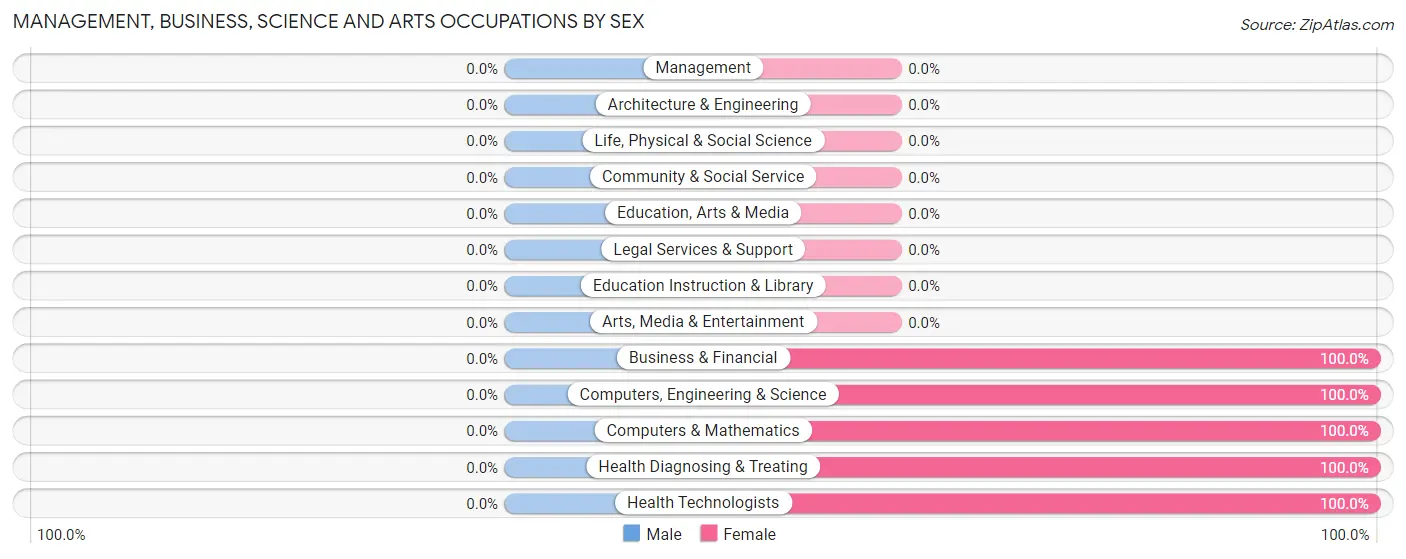
| Occupation | Male | Female |
| Management | 0 (0.0%) | 0 (0.0%) |
| Business & Financial | 0 (0.0%) | 11 (100.0%) |
| Computers, Engineering & Science | 0 (0.0%) | 6 (100.0%) |
| Computers & Mathematics | 0 (0.0%) | 6 (100.0%) |
| Architecture & Engineering | 0 (0.0%) | 0 (0.0%) |
| Life, Physical & Social Science | 0 (0.0%) | 0 (0.0%) |
| Community & Social Service | 0 (0.0%) | 0 (0.0%) |
| Education, Arts & Media | 0 (0.0%) | 0 (0.0%) |
| Legal Services & Support | 0 (0.0%) | 0 (0.0%) |
| Education Instruction & Library | 0 (0.0%) | 0 (0.0%) |
| Arts, Media & Entertainment | 0 (0.0%) | 0 (0.0%) |
| Health Diagnosing & Treating | 0 (0.0%) | 3 (100.0%) |
| Health Technologists | 0 (0.0%) | 3 (100.0%) |
| Total (Category) | 0 (0.0%) | 20 (100.0%) |
| Total (Overall) | 57 (42.2%) | 78 (57.8%) |
Services Occupations
The most common Services occupations in Westport are Healthcare Support (21 | 15.6%), and Personal Care & Service (15 | 11.1%).
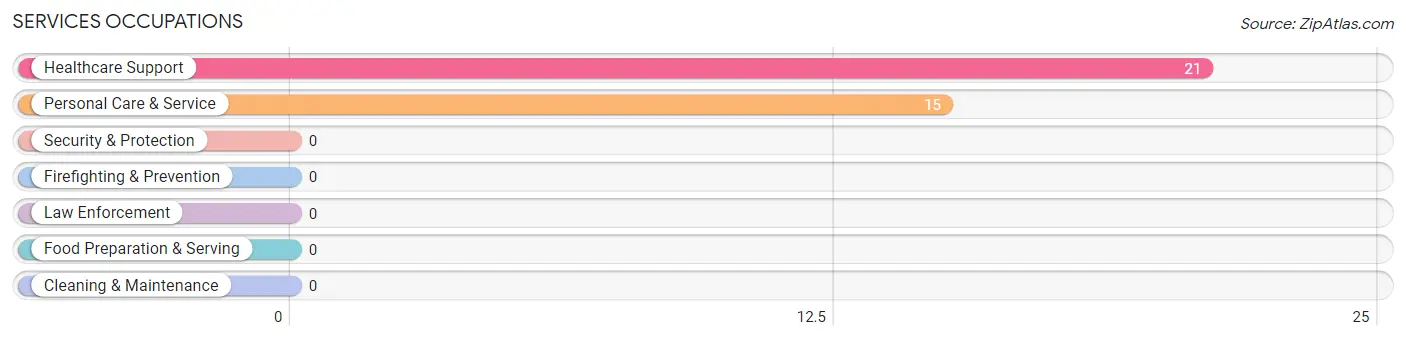
Services Occupations by Sex
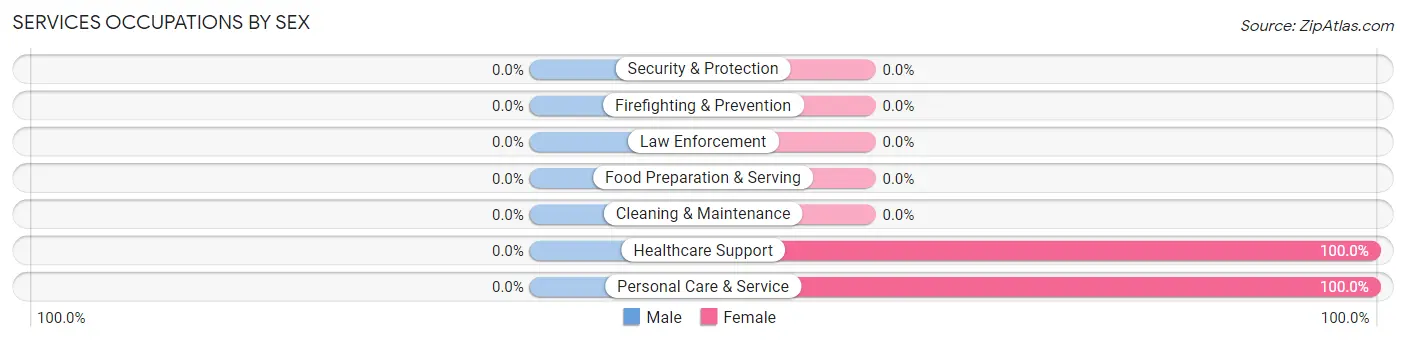
| Occupation | Male | Female |
| Healthcare Support | 0 (0.0%) | 21 (100.0%) |
| Security & Protection | 0 (0.0%) | 0 (0.0%) |
| Firefighting & Prevention | 0 (0.0%) | 0 (0.0%) |
| Law Enforcement | 0 (0.0%) | 0 (0.0%) |
| Food Preparation & Serving | 0 (0.0%) | 0 (0.0%) |
| Cleaning & Maintenance | 0 (0.0%) | 0 (0.0%) |
| Personal Care & Service | 0 (0.0%) | 15 (100.0%) |
| Total (Category) | 0 (0.0%) | 36 (100.0%) |
| Total (Overall) | 57 (42.2%) | 78 (57.8%) |
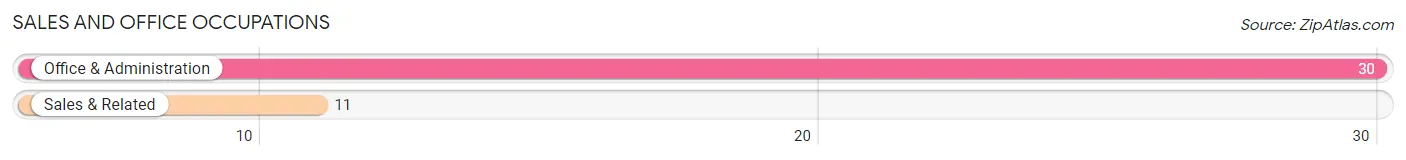
Sales and Office Occupations
The most common Sales and Office occupations in Westport are Office & Administration (30 | 22.2%), and Sales & Related (11 | 8.2%).
Sales and Office Occupations by Sex

| Occupation | Male | Female |
| Sales & Related | 11 (100.0%) | 0 (0.0%) |
| Office & Administration | 8 (26.7%) | 22 (73.3%) |
| Total (Category) | 19 (46.3%) | 22 (53.7%) |
| Total (Overall) | 57 (42.2%) | 78 (57.8%) |
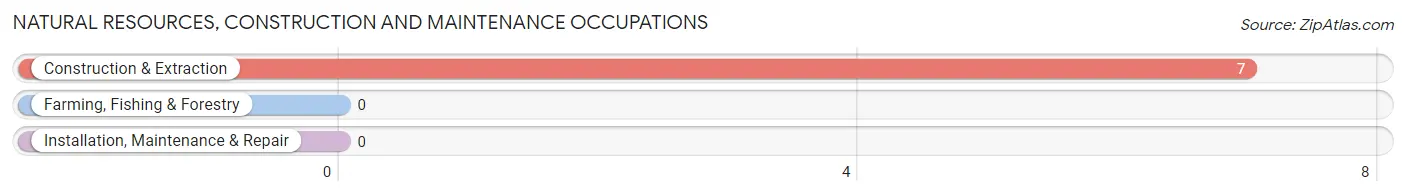
Natural Resources, Construction and Maintenance Occupations
The most common Natural Resources, Construction and Maintenance occupations in Westport are , and Construction & Extraction (7 | 5.2%).
Natural Resources, Construction and Maintenance Occupations by Sex

| Occupation | Male | Female |
| Farming, Fishing & Forestry | 0 (0.0%) | 0 (0.0%) |
| Construction & Extraction | 7 (100.0%) | 0 (0.0%) |
| Installation, Maintenance & Repair | 0 (0.0%) | 0 (0.0%) |
| Total (Category) | 7 (100.0%) | 0 (0.0%) |
| Total (Overall) | 57 (42.2%) | 78 (57.8%) |
Production, Transportation and Moving Occupations
The most common Production, Transportation and Moving occupations in Westport are Material Moving (27 | 20.0%), and Production (4 | 3.0%).
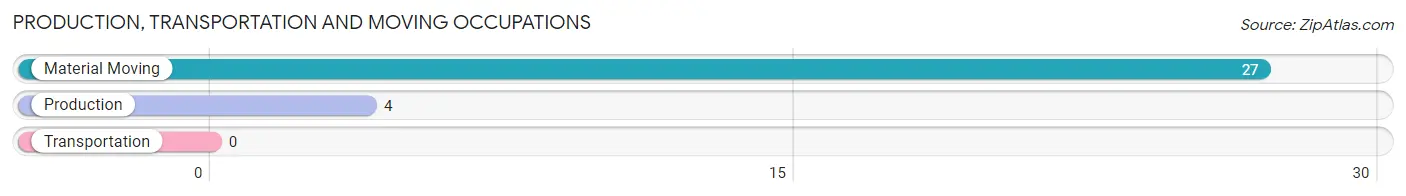
Production, Transportation and Moving Occupations by Sex
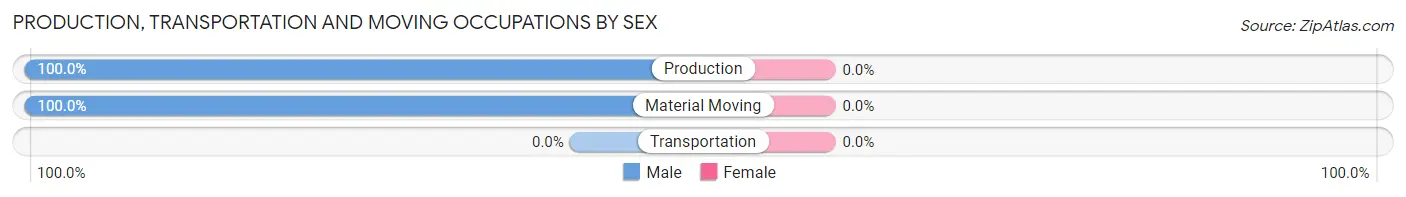
| Occupation | Male | Female |
| Production | 4 (100.0%) | 0 (0.0%) |
| Transportation | 0 (0.0%) | 0 (0.0%) |
| Material Moving | 27 (100.0%) | 0 (0.0%) |
| Total (Category) | 31 (100.0%) | 0 (0.0%) |
| Total (Overall) | 57 (42.2%) | 78 (57.8%) |
Employment Industries by Sex in Westport
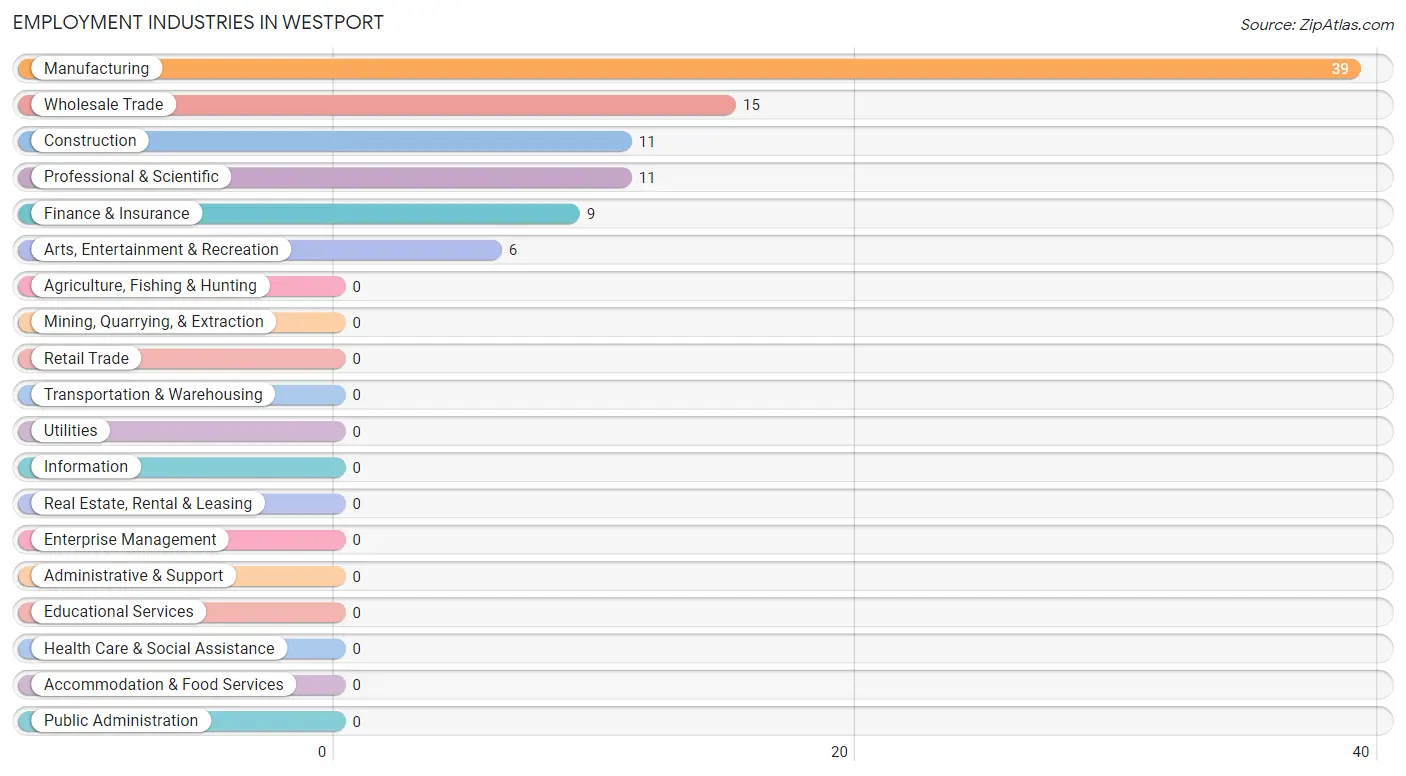
Employment Industries in Westport
The major employment industries in Westport include Manufacturing (39 | 28.9%), Wholesale Trade (15 | 11.1%), Construction (11 | 8.2%), Professional & Scientific (11 | 8.2%), and Finance & Insurance (9 | 6.7%).
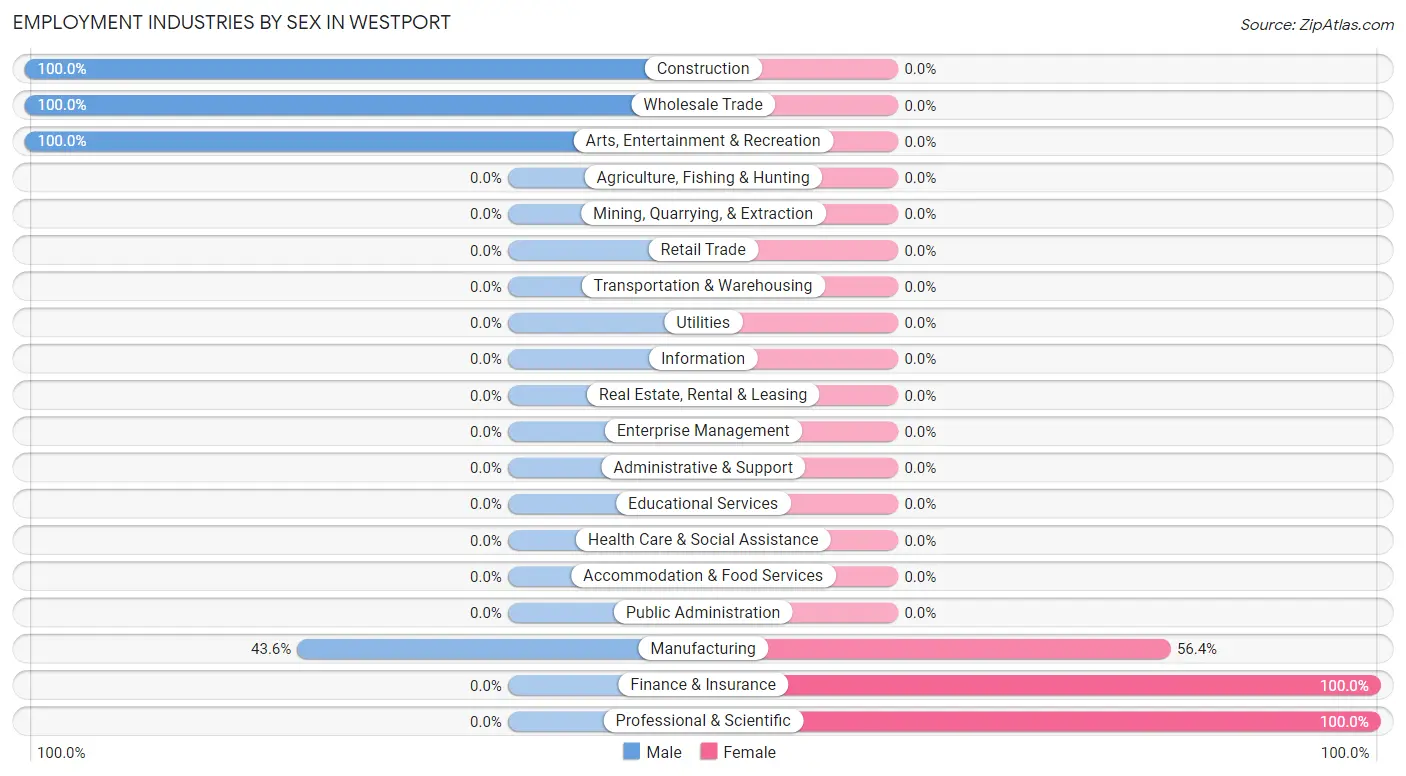
Employment Industries by Sex in Westport
The Westport industries that see more men than women are Construction (100.0%), Wholesale Trade (100.0%), and Arts, Entertainment & Recreation (100.0%), whereas the industries that tend to have a higher number of women are Finance & Insurance (100.0%), Professional & Scientific (100.0%), and Manufacturing (56.4%).
| Industry | Male | Female |
| Agriculture, Fishing & Hunting | 0 (0.0%) | 0 (0.0%) |
| Mining, Quarrying, & Extraction | 0 (0.0%) | 0 (0.0%) |
| Construction | 11 (100.0%) | 0 (0.0%) |
| Manufacturing | 17 (43.6%) | 22 (56.4%) |
| Wholesale Trade | 15 (100.0%) | 0 (0.0%) |
| Retail Trade | 0 (0.0%) | 0 (0.0%) |
| Transportation & Warehousing | 0 (0.0%) | 0 (0.0%) |
| Utilities | 0 (0.0%) | 0 (0.0%) |
| Information | 0 (0.0%) | 0 (0.0%) |
| Finance & Insurance | 0 (0.0%) | 9 (100.0%) |
| Real Estate, Rental & Leasing | 0 (0.0%) | 0 (0.0%) |
| Professional & Scientific | 0 (0.0%) | 11 (100.0%) |
| Enterprise Management | 0 (0.0%) | 0 (0.0%) |
| Administrative & Support | 0 (0.0%) | 0 (0.0%) |
| Educational Services | 0 (0.0%) | 0 (0.0%) |
| Health Care & Social Assistance | 0 (0.0%) | 0 (0.0%) |
| Arts, Entertainment & Recreation | 6 (100.0%) | 0 (0.0%) |
| Accommodation & Food Services | 0 (0.0%) | 0 (0.0%) |
| Public Administration | 0 (0.0%) | 0 (0.0%) |
| Total | 57 (42.2%) | 78 (57.8%) |
Education in Westport
School Enrollment in Westport
The most common levels of schooling among the 23 students in Westport are high school (12 | 52.2%), college / undergraduate (8 | 34.8%), and middle school (3 | 13.0%).
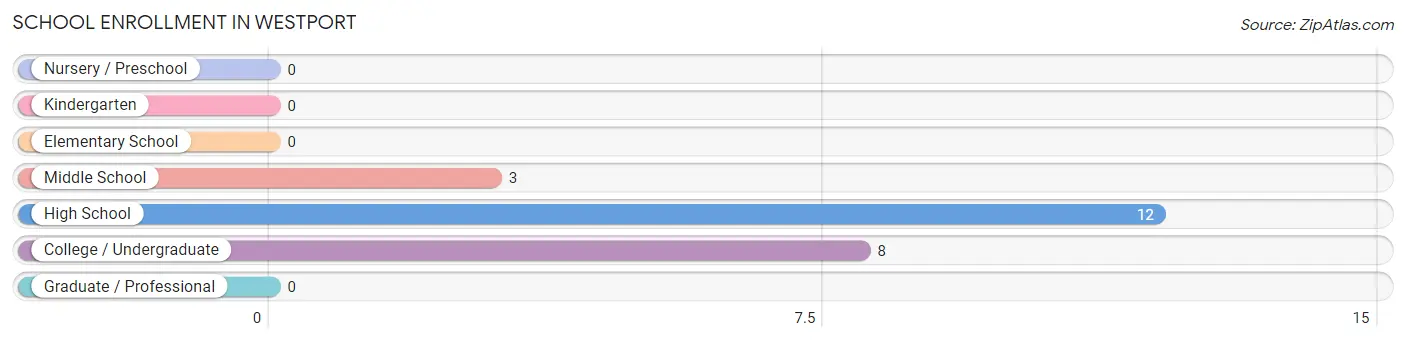
| School Level | # Students | % Students |
| Nursery / Preschool | 0 | 0.0% |
| Kindergarten | 0 | 0.0% |
| Elementary School | 0 | 0.0% |
| Middle School | 3 | 13.0% |
| High School | 12 | 52.2% |
| College / Undergraduate | 8 | 34.8% |
| Graduate / Professional | 0 | 0.0% |
| Total | 23 | 100.0% |
School Enrollment by Age by Funding Source in Westport
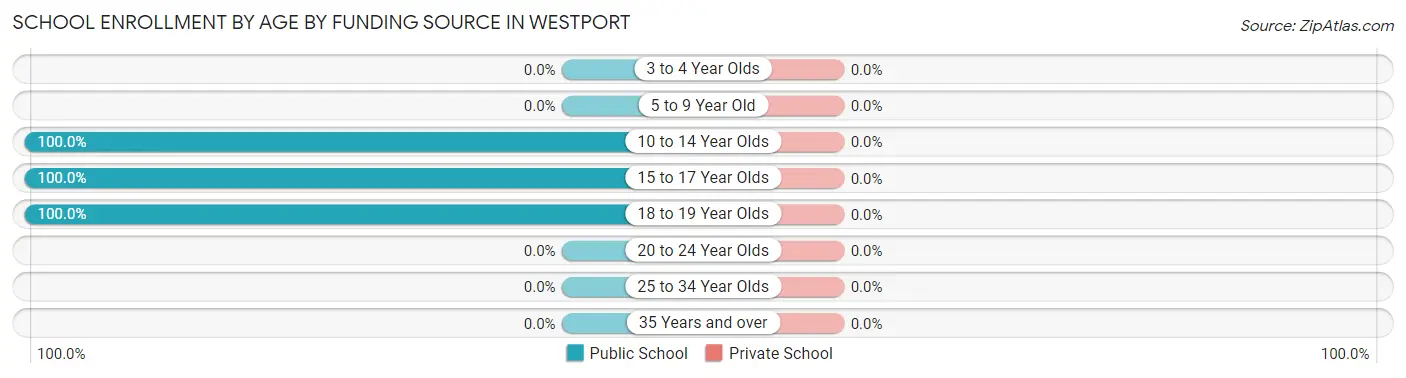
| Age Bracket | Public School | Private School |
| 3 to 4 Year Olds | 0 (0.0%) | 0 (0.0%) |
| 5 to 9 Year Old | 0 (0.0%) | 0 (0.0%) |
| 10 to 14 Year Olds | 3 (100.0%) | 0 (0.0%) |
| 15 to 17 Year Olds | 8 (100.0%) | 0 (0.0%) |
| 18 to 19 Year Olds | 12 (100.0%) | 0 (0.0%) |
| 20 to 24 Year Olds | 0 (0.0%) | 0 (0.0%) |
| 25 to 34 Year Olds | 0 (0.0%) | 0 (0.0%) |
| 35 Years and over | 0 (0.0%) | 0 (0.0%) |
| Total | 23 (100.0%) | 0 (0.0%) |
Educational Attainment by Field of Study in Westport
Business (21 | 44.7%), literature & languages (9 | 19.2%), visual & performing arts (9 | 19.2%), bio, nature & agricultural (5 | 10.6%), and science & technology (3 | 6.4%) are the most common fields of study among 47 individuals in Westport who have obtained a bachelor's degree or higher.
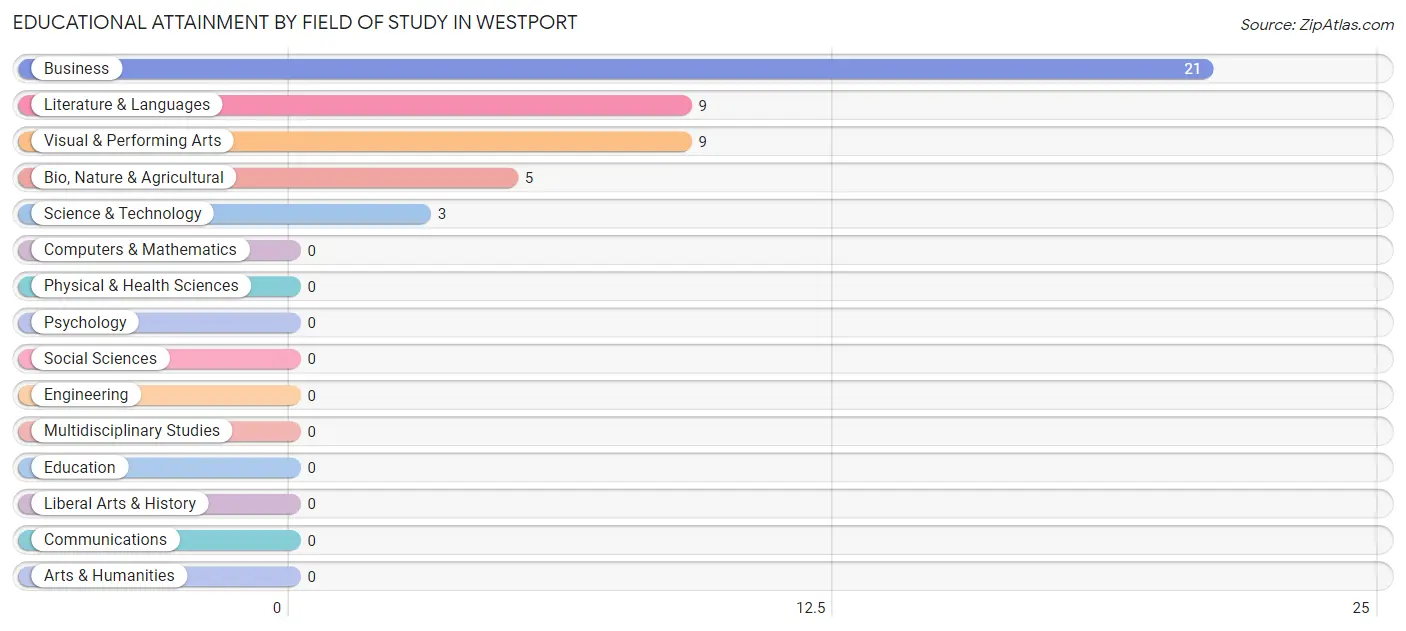
| Field of Study | # Graduates | % Graduates |
| Computers & Mathematics | 0 | 0.0% |
| Bio, Nature & Agricultural | 5 | 10.6% |
| Physical & Health Sciences | 0 | 0.0% |
| Psychology | 0 | 0.0% |
| Social Sciences | 0 | 0.0% |
| Engineering | 0 | 0.0% |
| Multidisciplinary Studies | 0 | 0.0% |
| Science & Technology | 3 | 6.4% |
| Business | 21 | 44.7% |
| Education | 0 | 0.0% |
| Literature & Languages | 9 | 19.2% |
| Liberal Arts & History | 0 | 0.0% |
| Visual & Performing Arts | 9 | 19.2% |
| Communications | 0 | 0.0% |
| Arts & Humanities | 0 | 0.0% |
| Total | 47 | 100.0% |
Transportation & Commute in Westport
Vehicle Availability by Sex in Westport
The most prevalent vehicle ownership categories in Westport are males with 3 vehicles (26, accounting for 45.6%) and females with 3 vehicles (33, making up 41.3%).
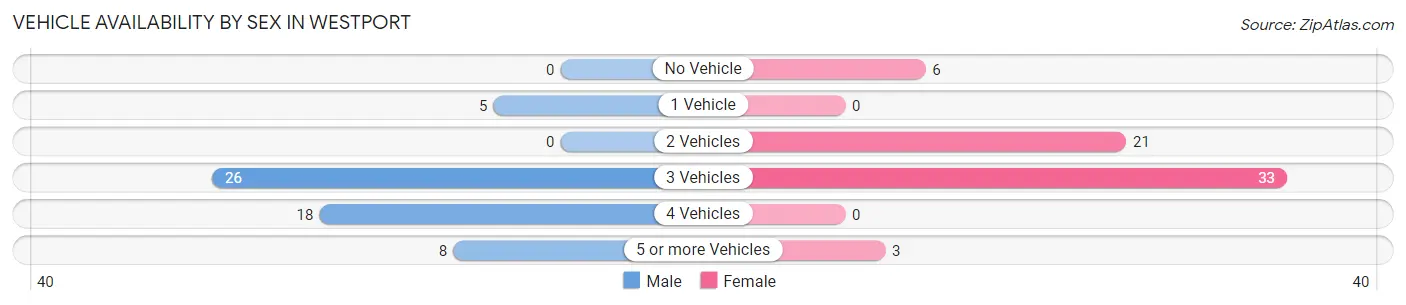
| Vehicles Available | Male | Female |
| No Vehicle | 0 (0.0%) | 6 (9.5%) |
| 1 Vehicle | 5 (8.8%) | 0 (0.0%) |
| 2 Vehicles | 0 (0.0%) | 21 (33.3%) |
| 3 Vehicles | 26 (45.6%) | 33 (52.4%) |
| 4 Vehicles | 18 (31.6%) | 0 (0.0%) |
| 5 or more Vehicles | 8 (14.0%) | 3 (4.8%) |
| Total | 57 (100.0%) | 63 (100.0%) |
Commute Time in Westport
The most frequently occuring commute durations in Westport are 20 to 24 minutes (56 commuters, 50.4%), 40 to 44 minutes (24 commuters, 21.6%), and 10 to 14 minutes (10 commuters, 9.0%).
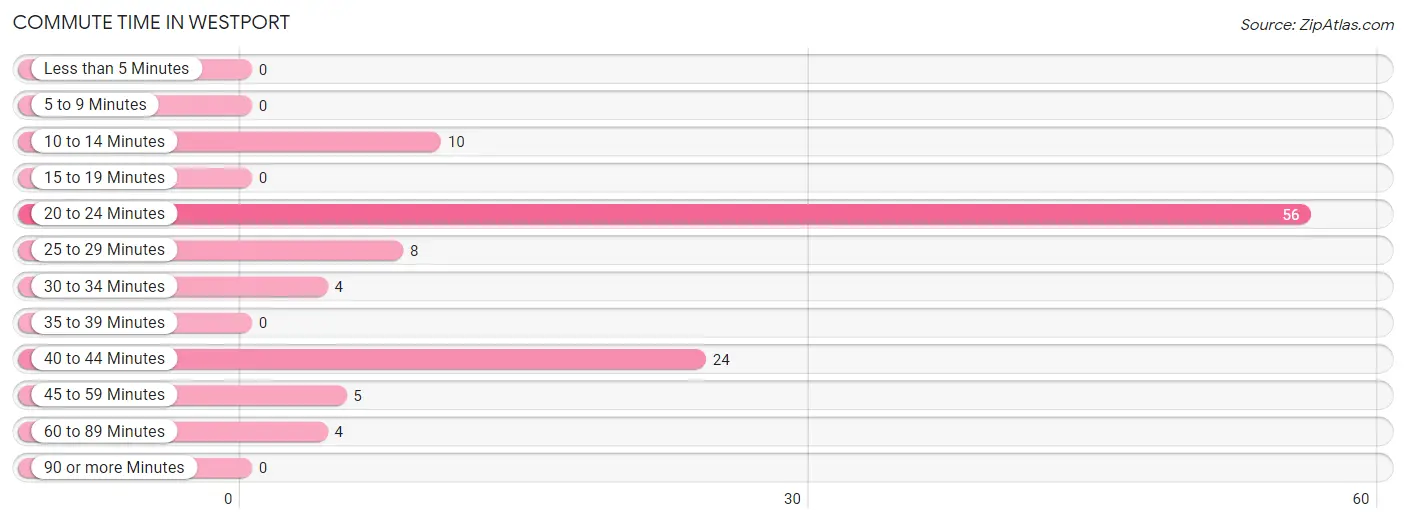
| Commute Time | # Commuters | % Commuters |
| Less than 5 Minutes | 0 | 0.0% |
| 5 to 9 Minutes | 0 | 0.0% |
| 10 to 14 Minutes | 10 | 9.0% |
| 15 to 19 Minutes | 0 | 0.0% |
| 20 to 24 Minutes | 56 | 50.4% |
| 25 to 29 Minutes | 8 | 7.2% |
| 30 to 34 Minutes | 4 | 3.6% |
| 35 to 39 Minutes | 0 | 0.0% |
| 40 to 44 Minutes | 24 | 21.6% |
| 45 to 59 Minutes | 5 | 4.5% |
| 60 to 89 Minutes | 4 | 3.6% |
| 90 or more Minutes | 0 | 0.0% |
Commute Time by Sex in Westport
The most common commute times in Westport are 20 to 24 minutes (19 commuters, 33.3%) for males and 20 to 24 minutes (37 commuters, 68.5%) for females.
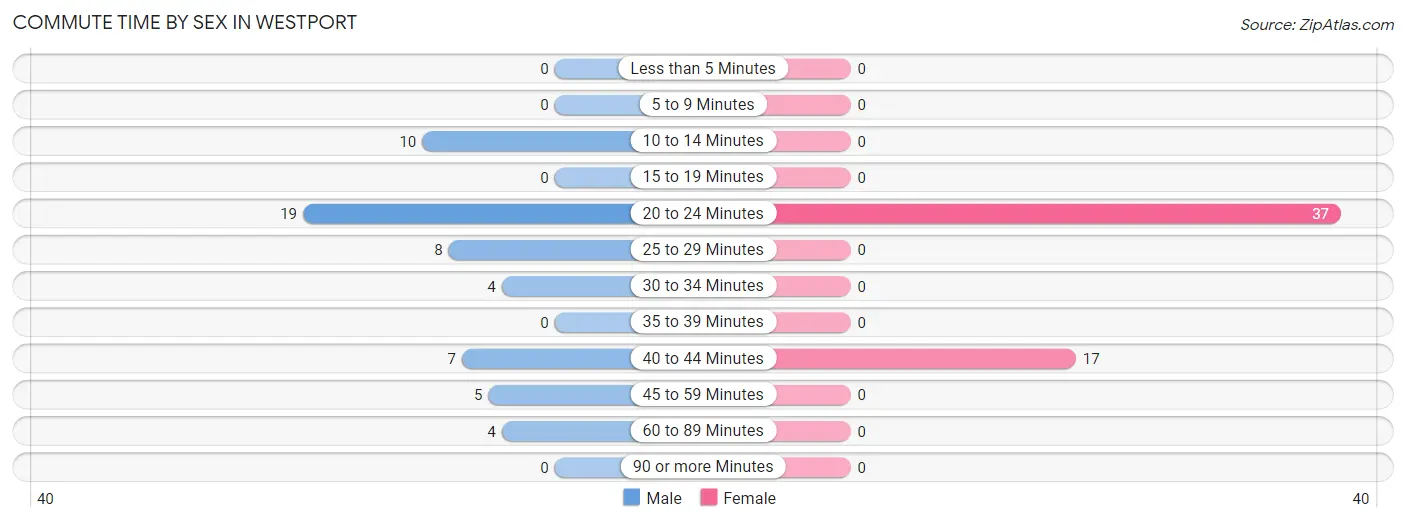
| Commute Time | Male | Female |
| Less than 5 Minutes | 0 (0.0%) | 0 (0.0%) |
| 5 to 9 Minutes | 0 (0.0%) | 0 (0.0%) |
| 10 to 14 Minutes | 10 (17.5%) | 0 (0.0%) |
| 15 to 19 Minutes | 0 (0.0%) | 0 (0.0%) |
| 20 to 24 Minutes | 19 (33.3%) | 37 (68.5%) |
| 25 to 29 Minutes | 8 (14.0%) | 0 (0.0%) |
| 30 to 34 Minutes | 4 (7.0%) | 0 (0.0%) |
| 35 to 39 Minutes | 0 (0.0%) | 0 (0.0%) |
| 40 to 44 Minutes | 7 (12.3%) | 17 (31.5%) |
| 45 to 59 Minutes | 5 (8.8%) | 0 (0.0%) |
| 60 to 89 Minutes | 4 (7.0%) | 0 (0.0%) |
| 90 or more Minutes | 0 (0.0%) | 0 (0.0%) |
Time of Departure to Work by Sex in Westport
The most frequent times of departure to work in Westport are 4:00 PM to 11:59 PM (31, 54.4%) for males and 9:00 AM to 9:59 AM (21, 38.9%) for females.
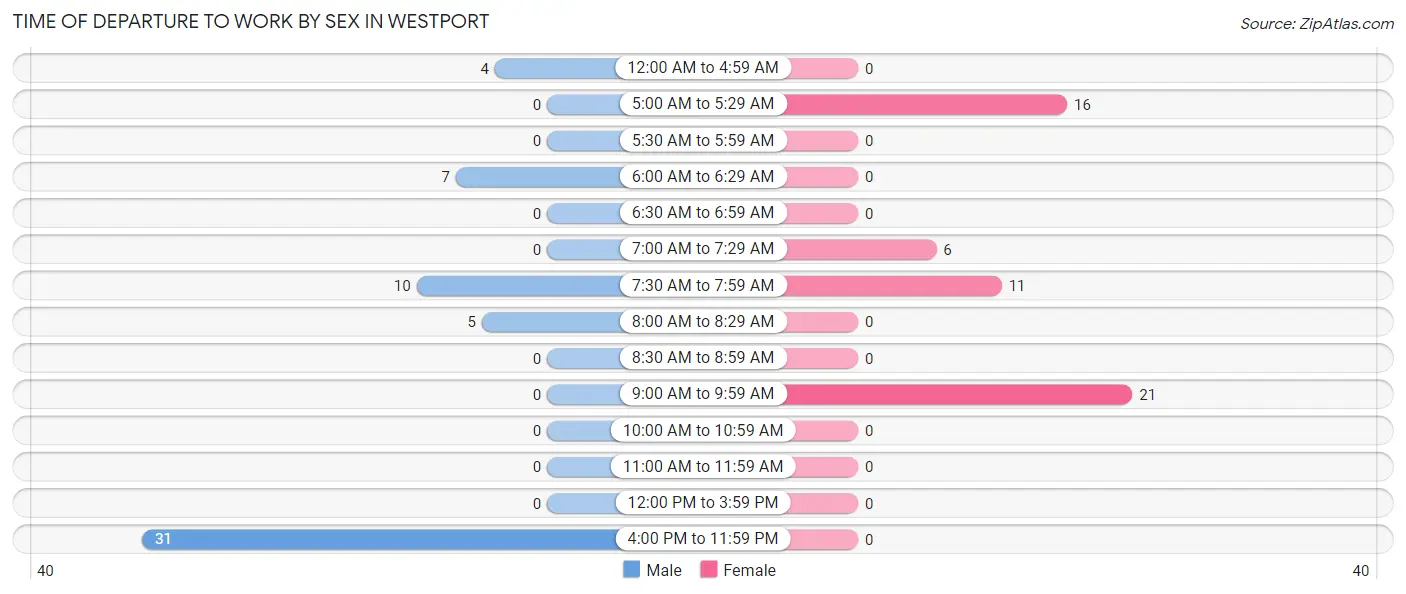
| Time of Departure | Male | Female |
| 12:00 AM to 4:59 AM | 4 (7.0%) | 0 (0.0%) |
| 5:00 AM to 5:29 AM | 0 (0.0%) | 16 (29.6%) |
| 5:30 AM to 5:59 AM | 0 (0.0%) | 0 (0.0%) |
| 6:00 AM to 6:29 AM | 7 (12.3%) | 0 (0.0%) |
| 6:30 AM to 6:59 AM | 0 (0.0%) | 0 (0.0%) |
| 7:00 AM to 7:29 AM | 0 (0.0%) | 6 (11.1%) |
| 7:30 AM to 7:59 AM | 10 (17.5%) | 11 (20.4%) |
| 8:00 AM to 8:29 AM | 5 (8.8%) | 0 (0.0%) |
| 8:30 AM to 8:59 AM | 0 (0.0%) | 0 (0.0%) |
| 9:00 AM to 9:59 AM | 0 (0.0%) | 21 (38.9%) |
| 10:00 AM to 10:59 AM | 0 (0.0%) | 0 (0.0%) |
| 11:00 AM to 11:59 AM | 0 (0.0%) | 0 (0.0%) |
| 12:00 PM to 3:59 PM | 0 (0.0%) | 0 (0.0%) |
| 4:00 PM to 11:59 PM | 31 (54.4%) | 0 (0.0%) |
| Total | 57 (100.0%) | 54 (100.0%) |
Housing Occupancy in Westport
Occupancy by Ownership in Westport
Of the total 111 dwellings in Westport, owner-occupied units account for 74 (66.7%), while renter-occupied units make up 37 (33.3%).
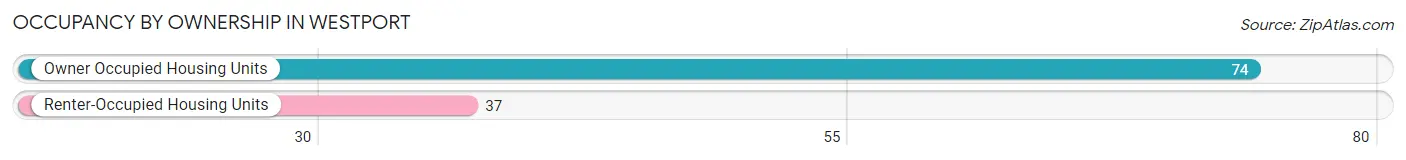
| Occupancy | # Housing Units | % Housing Units |
| Owner Occupied Housing Units | 74 | 66.7% |
| Renter-Occupied Housing Units | 37 | 33.3% |
| Total Occupied Housing Units | 111 | 100.0% |
Occupancy by Household Size in Westport
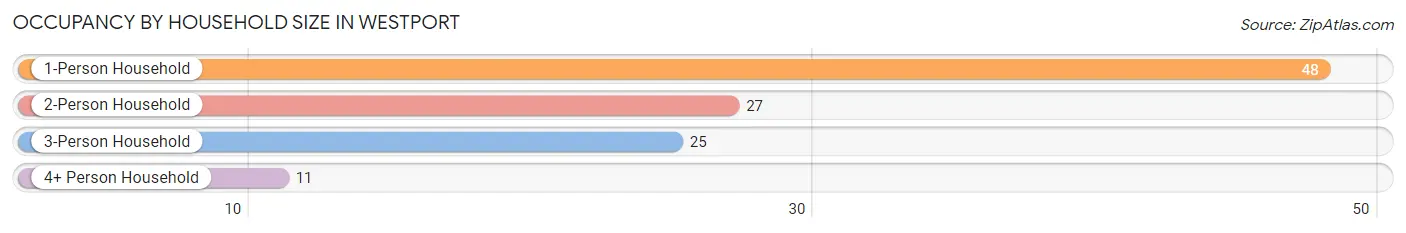
| Household Size | # Housing Units | % Housing Units |
| 1-Person Household | 48 | 43.2% |
| 2-Person Household | 27 | 24.3% |
| 3-Person Household | 25 | 22.5% |
| 4+ Person Household | 11 | 9.9% |
| Total Housing Units | 111 | 100.0% |
Occupancy by Ownership by Household Size in Westport
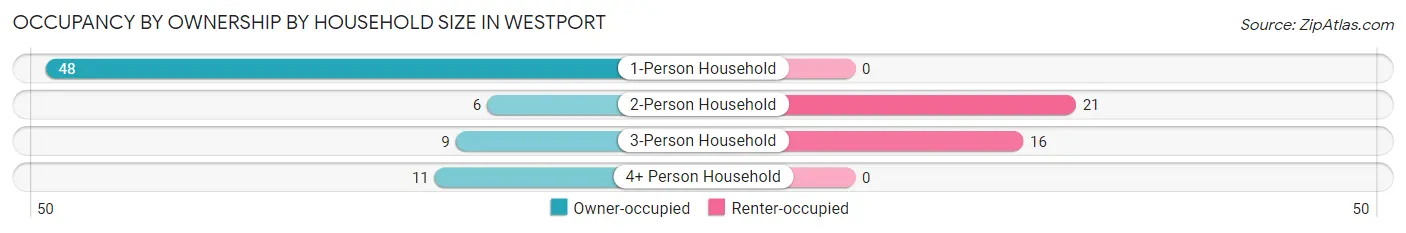
| Household Size | Owner-occupied | Renter-occupied |
| 1-Person Household | 48 (100.0%) | 0 (0.0%) |
| 2-Person Household | 6 (22.2%) | 21 (77.8%) |
| 3-Person Household | 9 (36.0%) | 16 (64.0%) |
| 4+ Person Household | 11 (100.0%) | 0 (0.0%) |
| Total Housing Units | 74 (66.7%) | 37 (33.3%) |
Occupancy by Educational Attainment in Westport
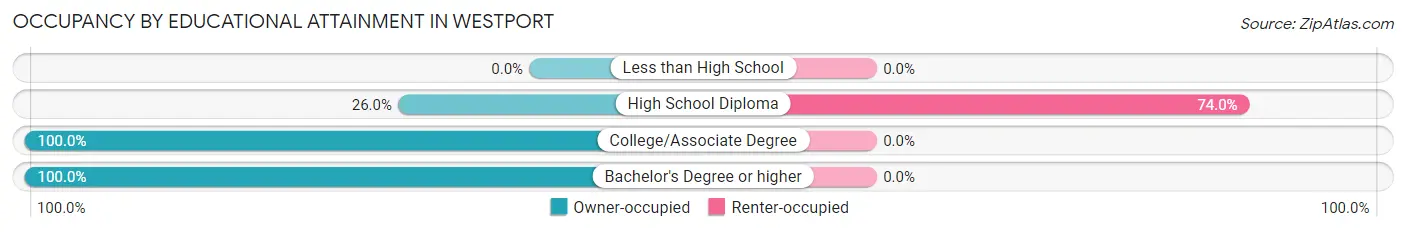
| Household Size | Owner-occupied | Renter-occupied |
| Less than High School | 0 (0.0%) | 0 (0.0%) |
| High School Diploma | 13 (26.0%) | 37 (74.0%) |
| College/Associate Degree | 26 (100.0%) | 0 (0.0%) |
| Bachelor's Degree or higher | 35 (100.0%) | 0 (0.0%) |
Occupancy by Age of Householder in Westport
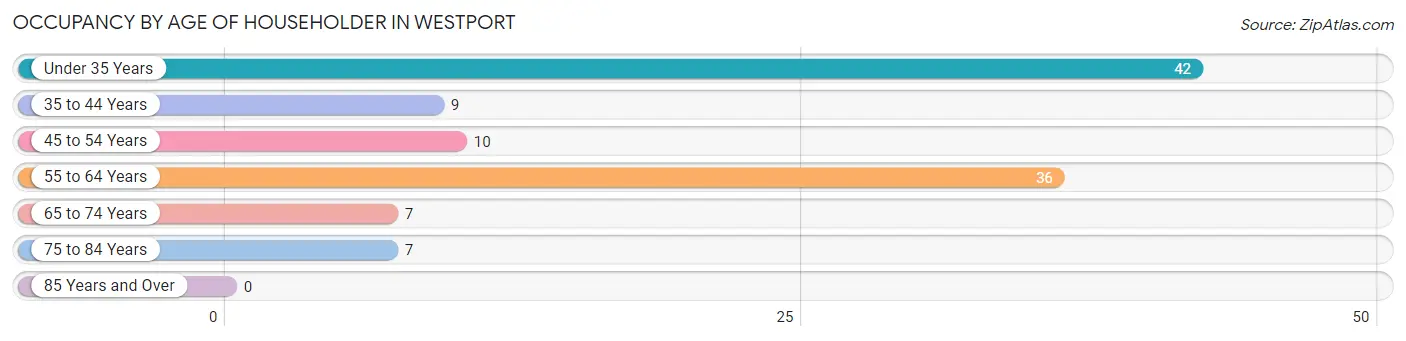
| Age Bracket | # Households | % Households |
| Under 35 Years | 42 | 37.8% |
| 35 to 44 Years | 9 | 8.1% |
| 45 to 54 Years | 10 | 9.0% |
| 55 to 64 Years | 36 | 32.4% |
| 65 to 74 Years | 7 | 6.3% |
| 75 to 84 Years | 7 | 6.3% |
| 85 Years and Over | 0 | 0.0% |
| Total | 111 | 100.0% |
Housing Finances in Westport
Median Income by Occupancy in Westport
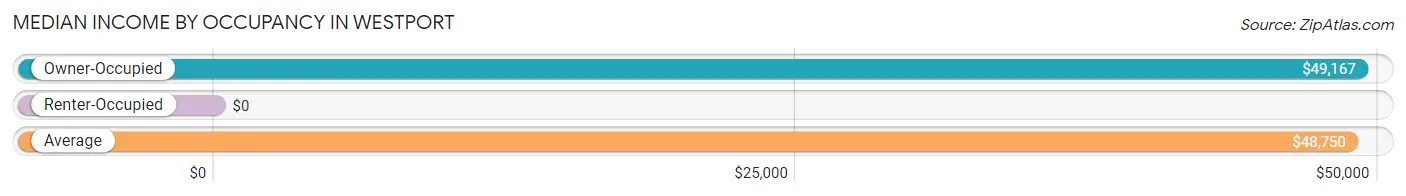
| Occupancy Type | # Households | Median Income |
| Owner-Occupied | 74 (66.7%) | $49,167 |
| Renter-Occupied | 37 (33.3%) | $0 |
| Average | 111 (100.0%) | $48,750 |
Occupancy by Householder Income Bracket in Westport
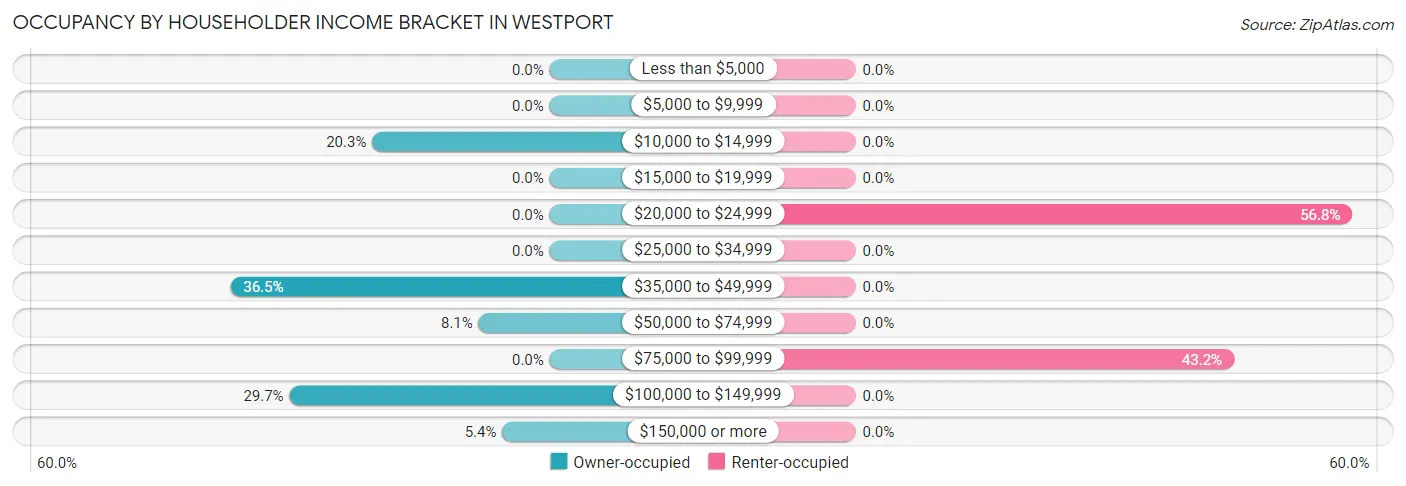
| Income Bracket | Owner-occupied | Renter-occupied |
| Less than $5,000 | 0 (0.0%) | 0 (0.0%) |
| $5,000 to $9,999 | 0 (0.0%) | 0 (0.0%) |
| $10,000 to $14,999 | 15 (20.3%) | 0 (0.0%) |
| $15,000 to $19,999 | 0 (0.0%) | 0 (0.0%) |
| $20,000 to $24,999 | 0 (0.0%) | 21 (56.8%) |
| $25,000 to $34,999 | 0 (0.0%) | 0 (0.0%) |
| $35,000 to $49,999 | 27 (36.5%) | 0 (0.0%) |
| $50,000 to $74,999 | 6 (8.1%) | 0 (0.0%) |
| $75,000 to $99,999 | 0 (0.0%) | 16 (43.2%) |
| $100,000 to $149,999 | 22 (29.7%) | 0 (0.0%) |
| $150,000 or more | 4 (5.4%) | 0 (0.0%) |
| Total | 74 (100.0%) | 37 (100.0%) |
Monthly Housing Cost Tiers in Westport
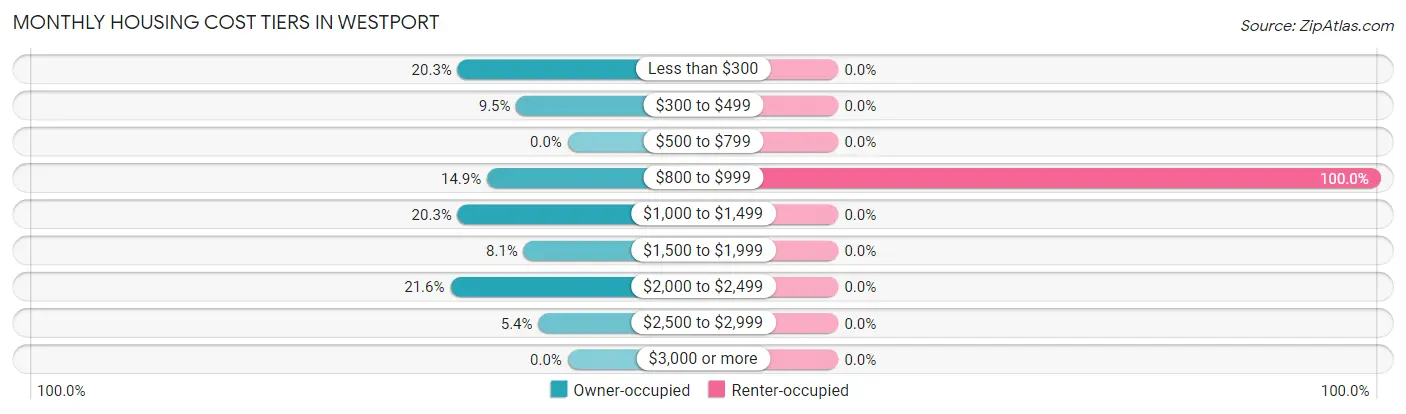
| Monthly Cost | Owner-occupied | Renter-occupied |
| Less than $300 | 15 (20.3%) | 0 (0.0%) |
| $300 to $499 | 7 (9.5%) | 0 (0.0%) |
| $500 to $799 | 0 (0.0%) | 0 (0.0%) |
| $800 to $999 | 11 (14.9%) | 37 (100.0%) |
| $1,000 to $1,499 | 15 (20.3%) | 0 (0.0%) |
| $1,500 to $1,999 | 6 (8.1%) | 0 (0.0%) |
| $2,000 to $2,499 | 16 (21.6%) | 0 (0.0%) |
| $2,500 to $2,999 | 4 (5.4%) | 0 (0.0%) |
| $3,000 or more | 0 (0.0%) | 0 (0.0%) |
| Total | 74 (100.0%) | 37 (100.0%) |
Physical Housing Characteristics in Westport
Housing Structures in Westport
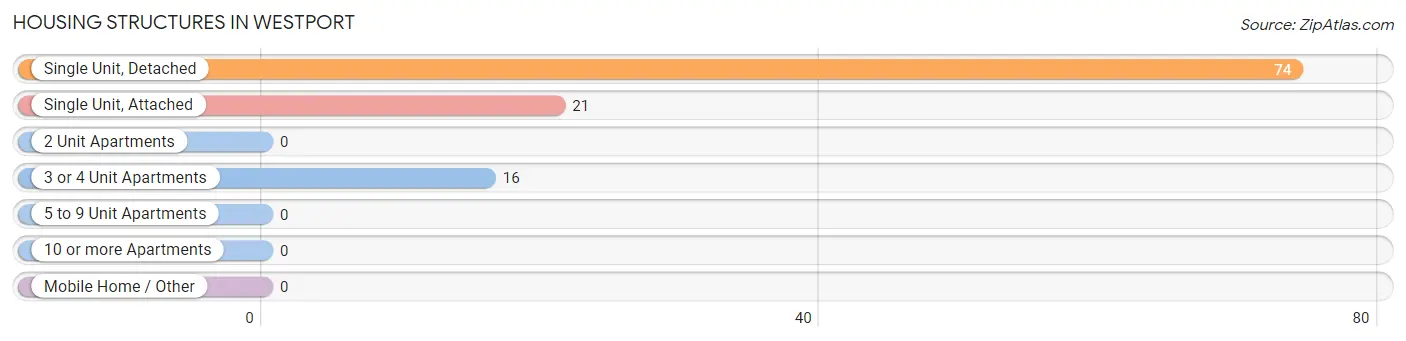
| Structure Type | # Housing Units | % Housing Units |
| Single Unit, Detached | 74 | 66.7% |
| Single Unit, Attached | 21 | 18.9% |
| 2 Unit Apartments | 0 | 0.0% |
| 3 or 4 Unit Apartments | 16 | 14.4% |
| 5 to 9 Unit Apartments | 0 | 0.0% |
| 10 or more Apartments | 0 | 0.0% |
| Mobile Home / Other | 0 | 0.0% |
| Total | 111 | 100.0% |
Housing Structures by Occupancy in Westport
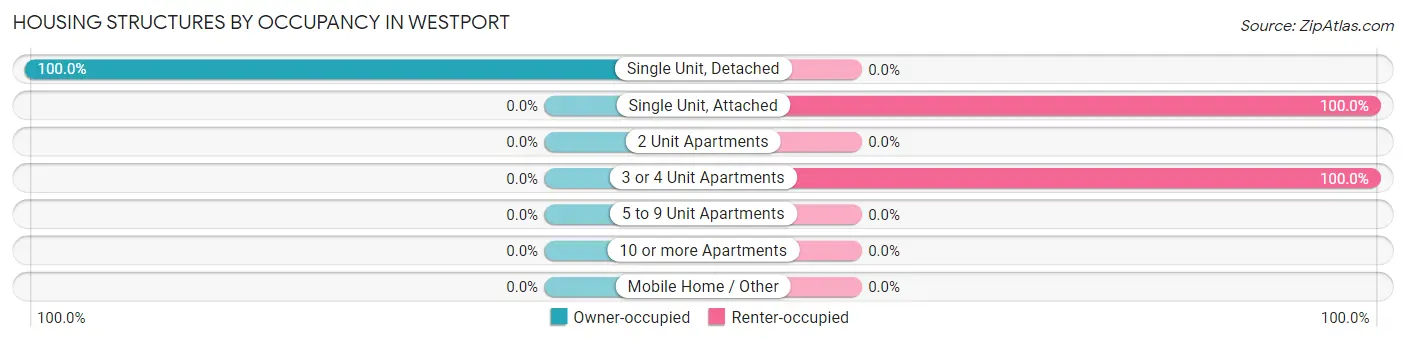
| Structure Type | Owner-occupied | Renter-occupied |
| Single Unit, Detached | 74 (100.0%) | 0 (0.0%) |
| Single Unit, Attached | 0 (0.0%) | 21 (100.0%) |
| 2 Unit Apartments | 0 (0.0%) | 0 (0.0%) |
| 3 or 4 Unit Apartments | 0 (0.0%) | 16 (100.0%) |
| 5 to 9 Unit Apartments | 0 (0.0%) | 0 (0.0%) |
| 10 or more Apartments | 0 (0.0%) | 0 (0.0%) |
| Mobile Home / Other | 0 (0.0%) | 0 (0.0%) |
| Total | 74 (66.7%) | 37 (33.3%) |
Housing Structures by Number of Rooms in Westport
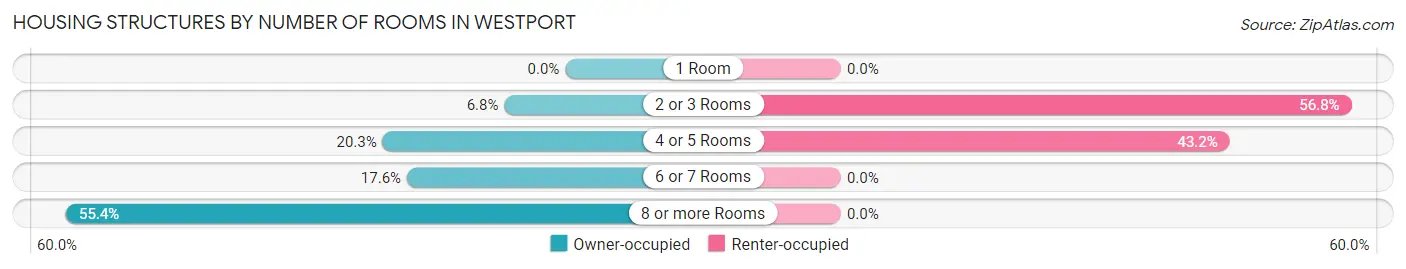
| Number of Rooms | Owner-occupied | Renter-occupied |
| 1 Room | 0 (0.0%) | 0 (0.0%) |
| 2 or 3 Rooms | 5 (6.8%) | 21 (56.8%) |
| 4 or 5 Rooms | 15 (20.3%) | 16 (43.2%) |
| 6 or 7 Rooms | 13 (17.6%) | 0 (0.0%) |
| 8 or more Rooms | 41 (55.4%) | 0 (0.0%) |
| Total | 74 (100.0%) | 37 (100.0%) |
Housing Structure by Heating Type in Westport
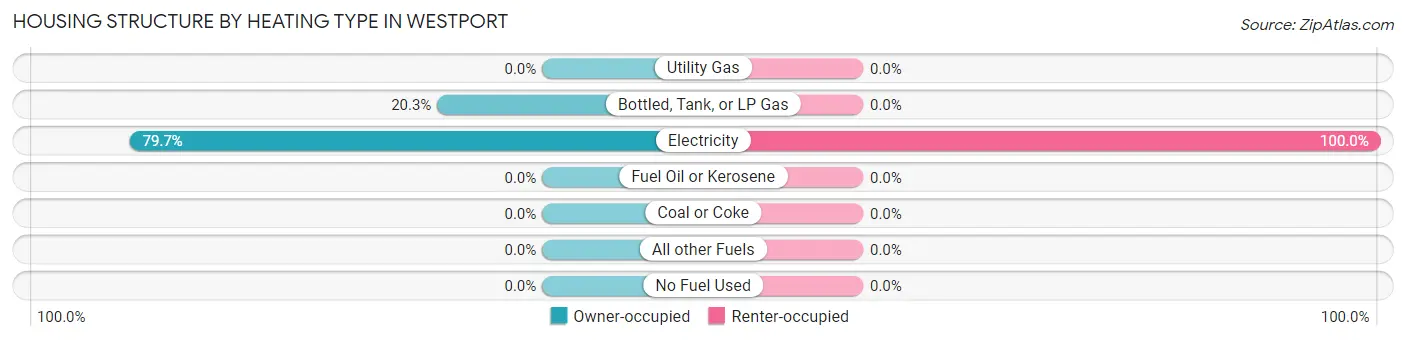
| Heating Type | Owner-occupied | Renter-occupied |
| Utility Gas | 0 (0.0%) | 0 (0.0%) |
| Bottled, Tank, or LP Gas | 15 (20.3%) | 0 (0.0%) |
| Electricity | 59 (79.7%) | 37 (100.0%) |
| Fuel Oil or Kerosene | 0 (0.0%) | 0 (0.0%) |
| Coal or Coke | 0 (0.0%) | 0 (0.0%) |
| All other Fuels | 0 (0.0%) | 0 (0.0%) |
| No Fuel Used | 0 (0.0%) | 0 (0.0%) |
| Total | 74 (100.0%) | 37 (100.0%) |
Household Vehicle Usage in Westport
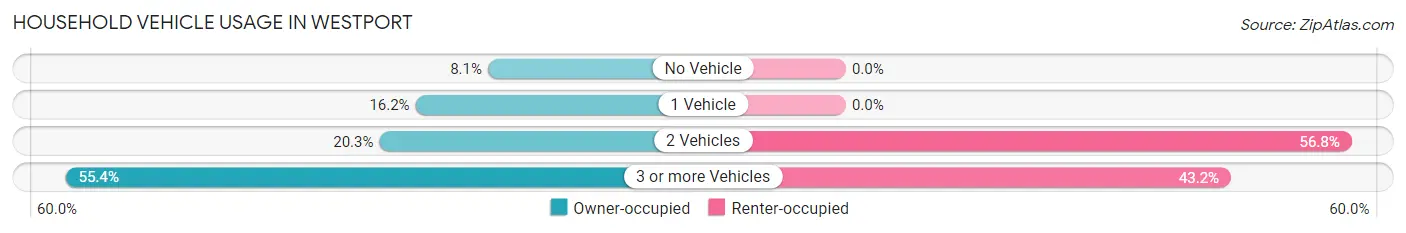
| Vehicles per Household | Owner-occupied | Renter-occupied |
| No Vehicle | 6 (8.1%) | 0 (0.0%) |
| 1 Vehicle | 12 (16.2%) | 0 (0.0%) |
| 2 Vehicles | 15 (20.3%) | 21 (56.8%) |
| 3 or more Vehicles | 41 (55.4%) | 16 (43.2%) |
| Total | 74 (100.0%) | 37 (100.0%) |
Real Estate & Mortgages in Westport
Real Estate and Mortgage Overview in Westport
| Characteristic | Without Mortgage | With Mortgage |
| Housing Units | 28 | 46 |
| Median Property Value | $123,300 | $320,800 |
| Median Household Income | - | - |
| Monthly Housing Costs | - | - |
| Real Estate Taxes | - | - |
Property Value by Mortgage Status in Westport
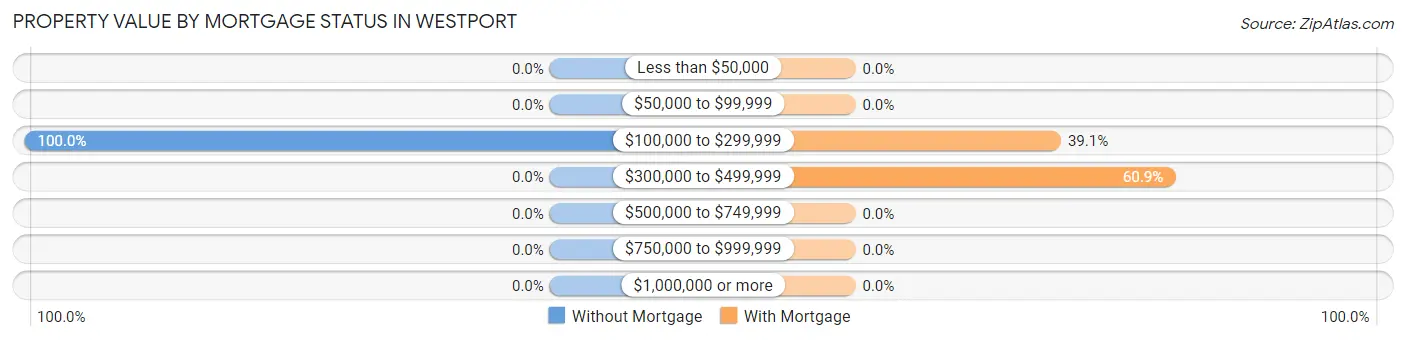
| Property Value | Without Mortgage | With Mortgage |
| Less than $50,000 | 0 (0.0%) | 0 (0.0%) |
| $50,000 to $99,999 | 0 (0.0%) | 0 (0.0%) |
| $100,000 to $299,999 | 28 (100.0%) | 18 (39.1%) |
| $300,000 to $499,999 | 0 (0.0%) | 28 (60.9%) |
| $500,000 to $749,999 | 0 (0.0%) | 0 (0.0%) |
| $750,000 to $999,999 | 0 (0.0%) | 0 (0.0%) |
| $1,000,000 or more | 0 (0.0%) | 0 (0.0%) |
| Total | 28 (100.0%) | 46 (100.0%) |
Household Income by Mortgage Status in Westport
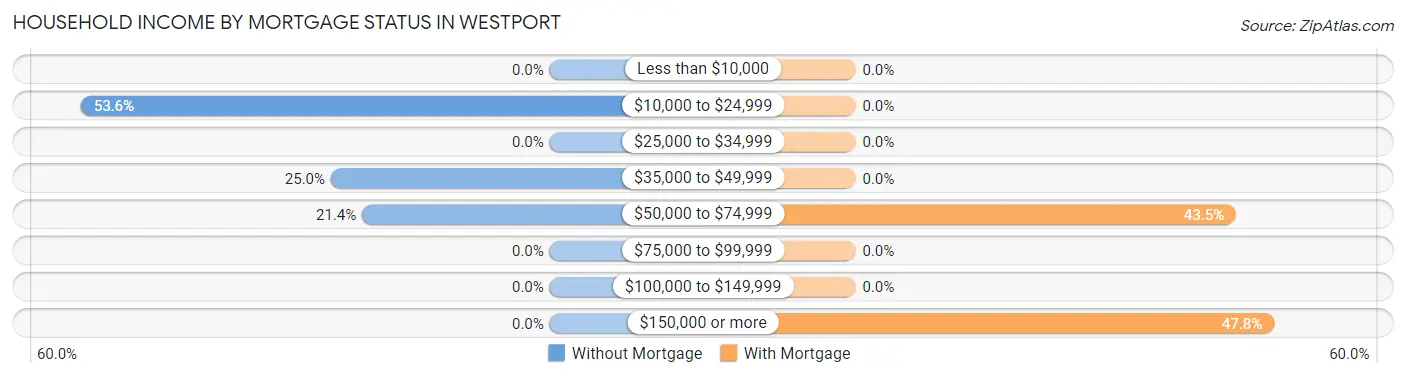
| Household Income | Without Mortgage | With Mortgage |
| Less than $10,000 | 0 (0.0%) | 0 (0.0%) |
| $10,000 to $24,999 | 15 (53.6%) | 0 (0.0%) |
| $25,000 to $34,999 | 0 (0.0%) | 0 (0.0%) |
| $35,000 to $49,999 | 7 (25.0%) | 0 (0.0%) |
| $50,000 to $74,999 | 6 (21.4%) | 20 (43.5%) |
| $75,000 to $99,999 | 0 (0.0%) | 0 (0.0%) |
| $100,000 to $149,999 | 0 (0.0%) | 0 (0.0%) |
| $150,000 or more | 0 (0.0%) | 22 (47.8%) |
| Total | 28 (100.0%) | 46 (100.0%) |
Property Value to Household Income Ratio in Westport
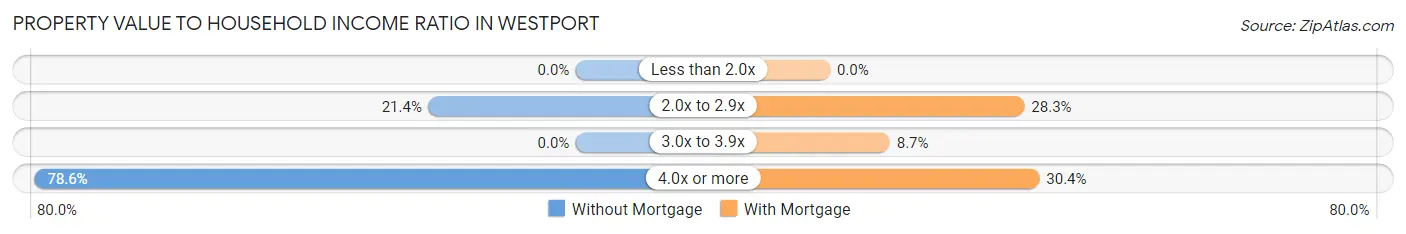
| Value-to-Income Ratio | Without Mortgage | With Mortgage |
| Less than 2.0x | 0 (0.0%) | 0 (0.0%) |
| 2.0x to 2.9x | 6 (21.4%) | 13 (28.3%) |
| 3.0x to 3.9x | 0 (0.0%) | 4 (8.7%) |
| 4.0x or more | 22 (78.6%) | 14 (30.4%) |
| Total | 28 (100.0%) | 46 (100.0%) |
Real Estate Taxes by Mortgage Status in Westport
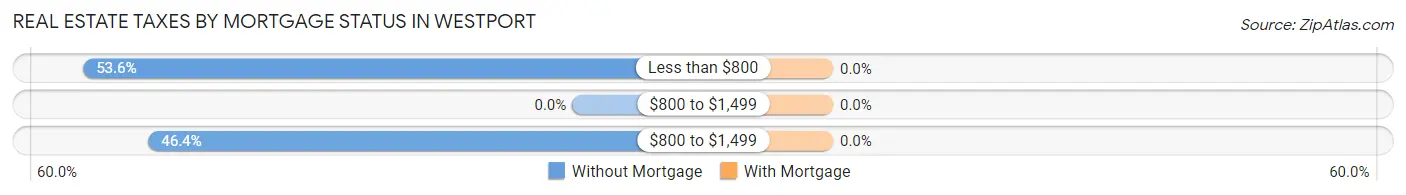
| Property Taxes | Without Mortgage | With Mortgage |
| Less than $800 | 15 (53.6%) | 0 (0.0%) |
| $800 to $1,499 | 0 (0.0%) | 0 (0.0%) |
| $800 to $1,499 | 13 (46.4%) | 0 (0.0%) |
| Total | 28 (100.0%) | 46 (100.0%) |
Health & Disability in Westport
Health Insurance Coverage by Age in Westport
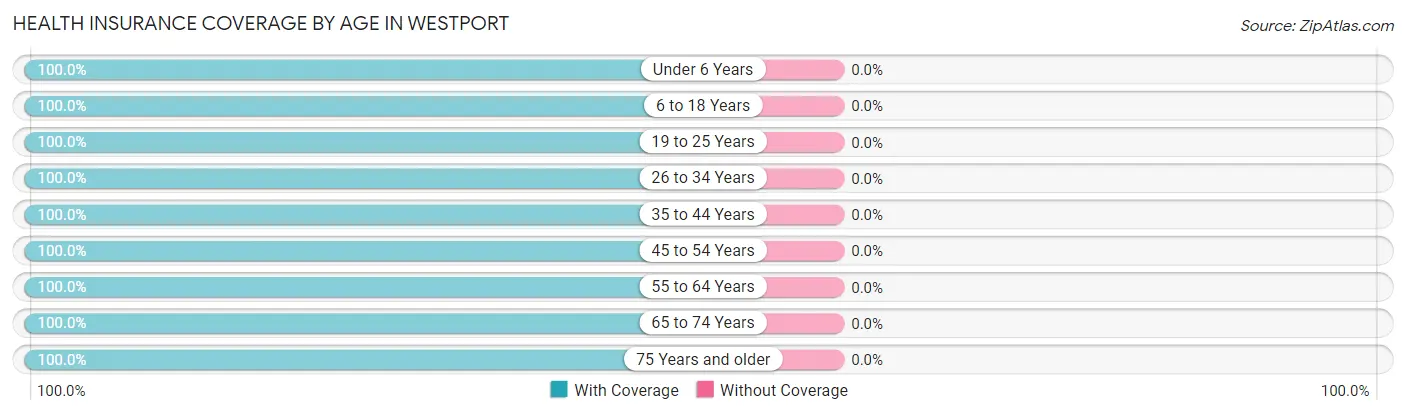
| Age Bracket | With Coverage | Without Coverage |
| Under 6 Years | 10 (100.0%) | 0 (0.0%) |
| 6 to 18 Years | 15 (100.0%) | 0 (0.0%) |
| 19 to 25 Years | 19 (100.0%) | 0 (0.0%) |
| 26 to 34 Years | 71 (100.0%) | 0 (0.0%) |
| 35 to 44 Years | 16 (100.0%) | 0 (0.0%) |
| 45 to 54 Years | 17 (100.0%) | 0 (0.0%) |
| 55 to 64 Years | 44 (100.0%) | 0 (0.0%) |
| 65 to 74 Years | 7 (100.0%) | 0 (0.0%) |
| 75 Years and older | 7 (100.0%) | 0 (0.0%) |
| Total | 206 (100.0%) | 0 (0.0%) |
Health Insurance Coverage by Citizenship Status in Westport
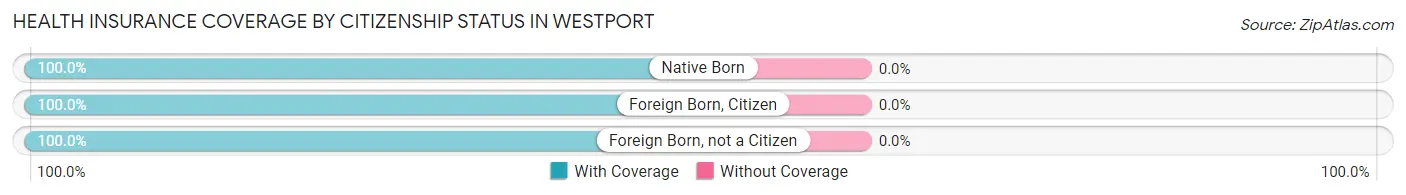
| Citizenship Status | With Coverage | Without Coverage |
| Native Born | 10 (100.0%) | 0 (0.0%) |
| Foreign Born, Citizen | 15 (100.0%) | 0 (0.0%) |
| Foreign Born, not a Citizen | 19 (100.0%) | 0 (0.0%) |
Health Insurance Coverage by Household Income in Westport
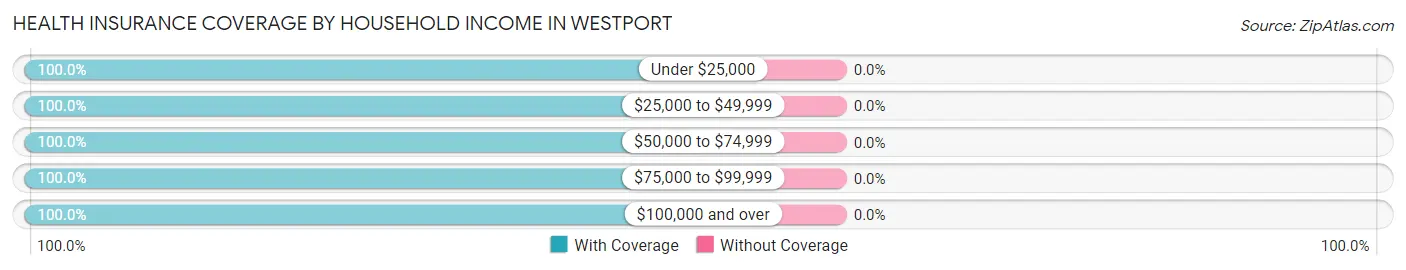
| Household Income | With Coverage | Without Coverage |
| Under $25,000 | 40 (100.0%) | 0 (0.0%) |
| $25,000 to $49,999 | 27 (100.0%) | 0 (0.0%) |
| $50,000 to $74,999 | 6 (100.0%) | 0 (0.0%) |
| $75,000 to $99,999 | 39 (100.0%) | 0 (0.0%) |
| $100,000 and over | 94 (100.0%) | 0 (0.0%) |
Public vs Private Health Insurance Coverage by Age in Westport
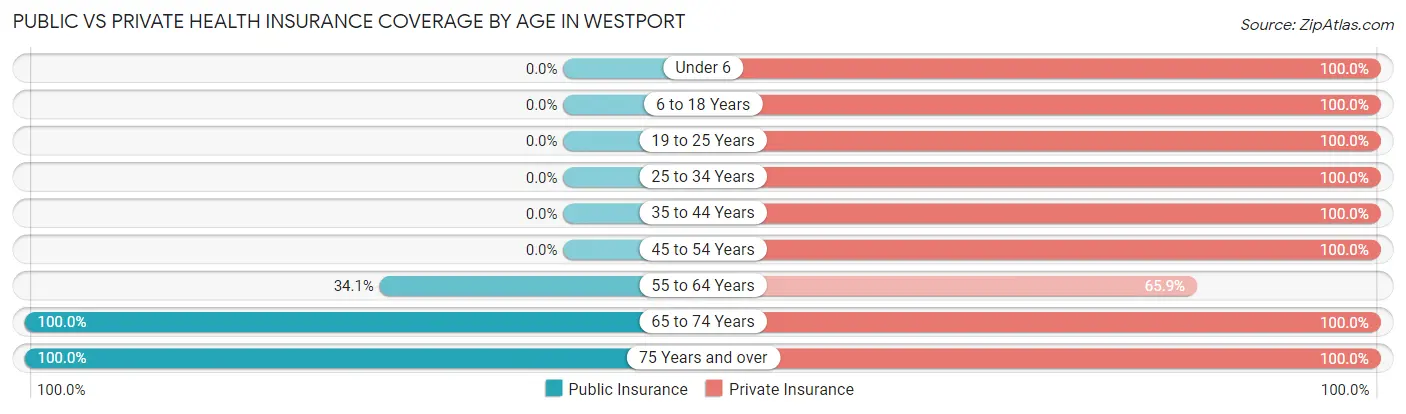
| Age Bracket | Public Insurance | Private Insurance |
| Under 6 | 0 (0.0%) | 10 (100.0%) |
| 6 to 18 Years | 0 (0.0%) | 15 (100.0%) |
| 19 to 25 Years | 0 (0.0%) | 19 (100.0%) |
| 25 to 34 Years | 0 (0.0%) | 71 (100.0%) |
| 35 to 44 Years | 0 (0.0%) | 16 (100.0%) |
| 45 to 54 Years | 0 (0.0%) | 17 (100.0%) |
| 55 to 64 Years | 15 (34.1%) | 29 (65.9%) |
| 65 to 74 Years | 7 (100.0%) | 7 (100.0%) |
| 75 Years and over | 7 (100.0%) | 7 (100.0%) |
| Total | 29 (14.1%) | 191 (92.7%) |
Disability Status by Sex by Age in Westport
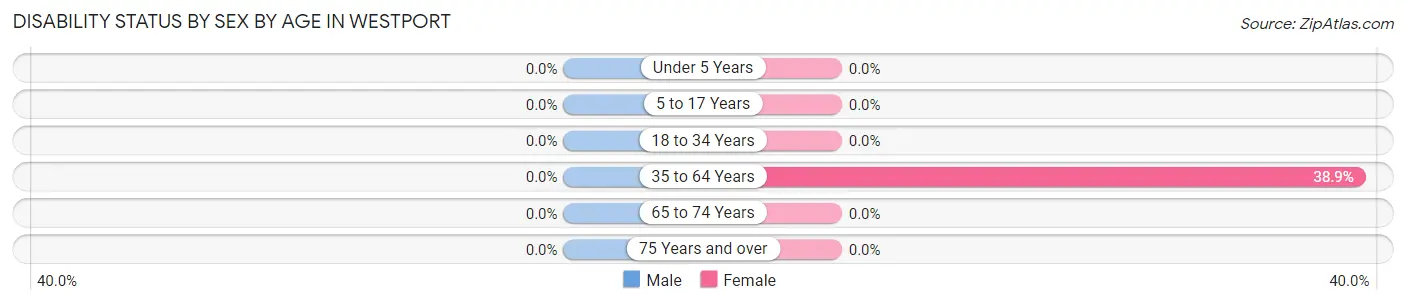
| Age Bracket | Male | Female |
| Under 5 Years | 0 (0.0%) | 0 (0.0%) |
| 5 to 17 Years | 0 (0.0%) | 0 (0.0%) |
| 18 to 34 Years | 0 (0.0%) | 0 (0.0%) |
| 35 to 64 Years | 0 (0.0%) | 21 (38.9%) |
| 65 to 74 Years | 0 (0.0%) | 0 (0.0%) |
| 75 Years and over | 0 (0.0%) | 0 (0.0%) |
Disability Class by Sex by Age in Westport
Disability Class: Hearing Difficulty
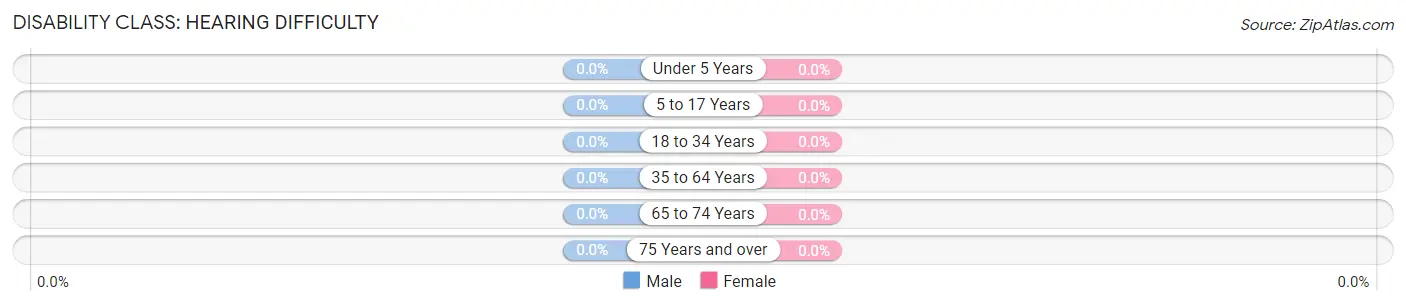
| Age Bracket | Male | Female |
| Under 5 Years | 0 (0.0%) | 0 (0.0%) |
| 5 to 17 Years | 0 (0.0%) | 0 (0.0%) |
| 18 to 34 Years | 0 (0.0%) | 0 (0.0%) |
| 35 to 64 Years | 0 (0.0%) | 0 (0.0%) |
| 65 to 74 Years | 0 (0.0%) | 0 (0.0%) |
| 75 Years and over | 0 (0.0%) | 0 (0.0%) |
Disability Class: Vision Difficulty
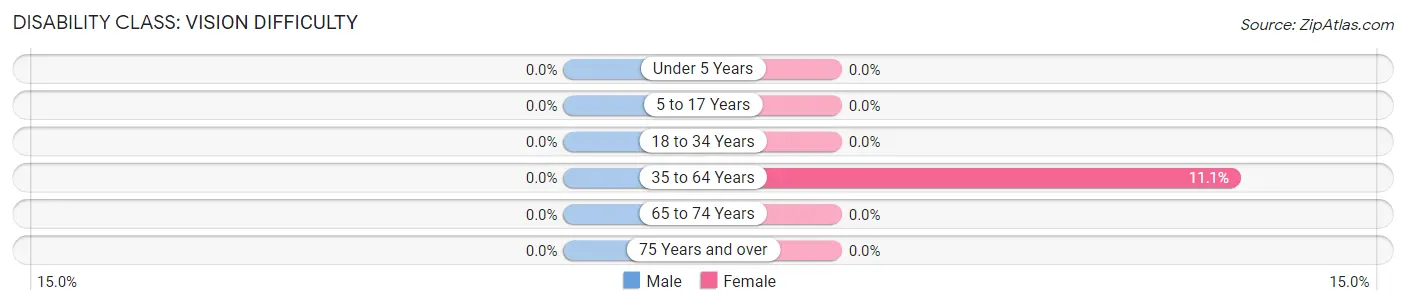
| Age Bracket | Male | Female |
| Under 5 Years | 0 (0.0%) | 0 (0.0%) |
| 5 to 17 Years | 0 (0.0%) | 0 (0.0%) |
| 18 to 34 Years | 0 (0.0%) | 0 (0.0%) |
| 35 to 64 Years | 0 (0.0%) | 6 (11.1%) |
| 65 to 74 Years | 0 (0.0%) | 0 (0.0%) |
| 75 Years and over | 0 (0.0%) | 0 (0.0%) |
Disability Class: Cognitive Difficulty
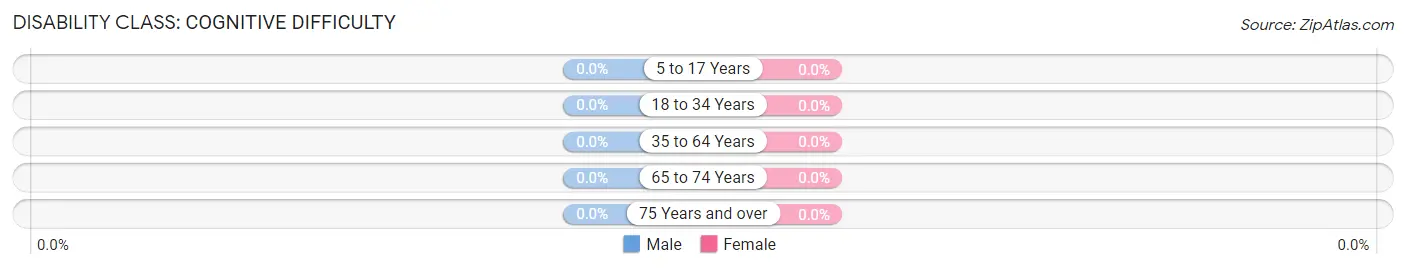
| Age Bracket | Male | Female |
| 5 to 17 Years | 0 (0.0%) | 0 (0.0%) |
| 18 to 34 Years | 0 (0.0%) | 0 (0.0%) |
| 35 to 64 Years | 0 (0.0%) | 0 (0.0%) |
| 65 to 74 Years | 0 (0.0%) | 0 (0.0%) |
| 75 Years and over | 0 (0.0%) | 0 (0.0%) |
Disability Class: Ambulatory Difficulty
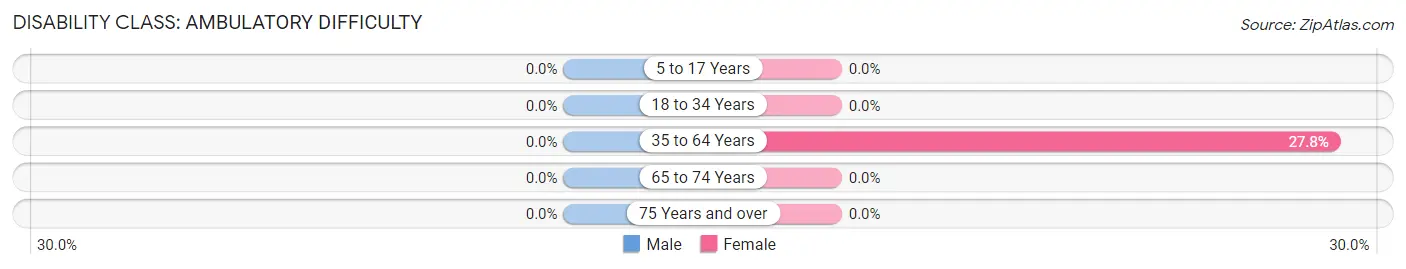
| Age Bracket | Male | Female |
| 5 to 17 Years | 0 (0.0%) | 0 (0.0%) |
| 18 to 34 Years | 0 (0.0%) | 0 (0.0%) |
| 35 to 64 Years | 0 (0.0%) | 15 (27.8%) |
| 65 to 74 Years | 0 (0.0%) | 0 (0.0%) |
| 75 Years and over | 0 (0.0%) | 0 (0.0%) |
Disability Class: Self-Care Difficulty

| Age Bracket | Male | Female |
| 5 to 17 Years | 0 (0.0%) | 0 (0.0%) |
| 18 to 34 Years | 0 (0.0%) | 0 (0.0%) |
| 35 to 64 Years | 0 (0.0%) | 15 (27.8%) |
| 65 to 74 Years | 0 (0.0%) | 0 (0.0%) |
| 75 Years and over | 0 (0.0%) | 0 (0.0%) |
Technology Access in Westport
Computing Device Access in Westport
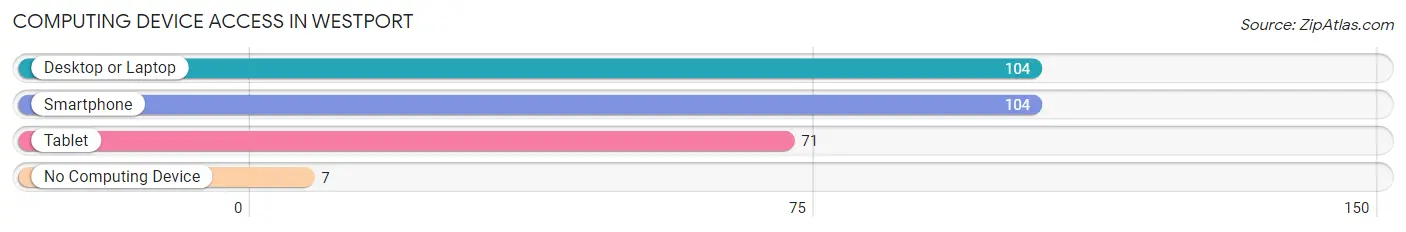
| Device Type | # Households | % Households |
| Desktop or Laptop | 104 | 93.7% |
| Smartphone | 104 | 93.7% |
| Tablet | 71 | 64.0% |
| No Computing Device | 7 | 6.3% |
| Total | 111 | 100.0% |
Internet Access in Westport
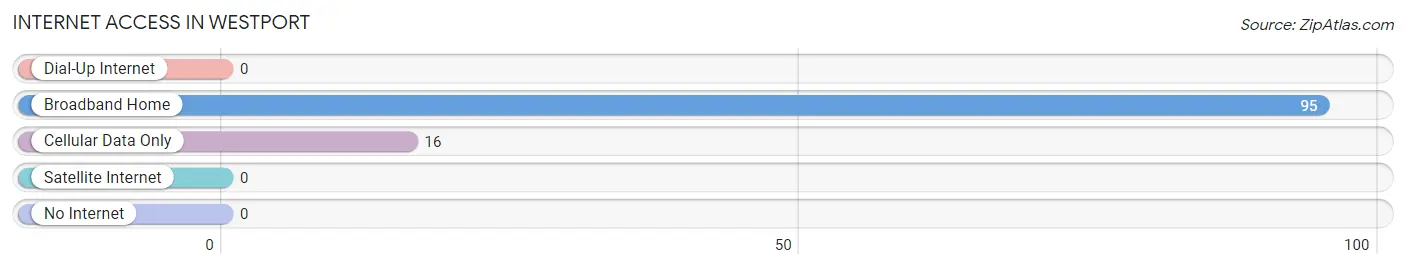
| Internet Type | # Households | % Households |
| Dial-Up Internet | 0 | 0.0% |
| Broadband Home | 95 | 85.6% |
| Cellular Data Only | 16 | 14.4% |
| Satellite Internet | 0 | 0.0% |
| No Internet | 0 | 0.0% |
| Total | 111 | 100.0% |
Westport Summary
Westport, Kentucky is a small town located in Oldham County, Kentucky. It is situated on the banks of the Ohio River, just south of Louisville. The town was founded in 1818 and has a population of approximately 1,000 people.
History
Westport was founded in 1818 by a group of settlers from Pennsylvania. The town was named after Westport, Pennsylvania, which was the hometown of the settlers. The town was originally a farming community, but it soon became a trading post for the Ohio River. The town was also a stop on the Underground Railroad, and many slaves were able to escape to freedom through Westport.
In the late 1800s, Westport became a popular tourist destination. The town was known for its beautiful scenery and its many attractions, such as the Westport Hotel, which was built in 1883. The hotel was a popular destination for travelers and tourists, and it was also a popular spot for weddings and other special events.
In the early 1900s, Westport began to decline in popularity as a tourist destination. The town was bypassed by the railroad, and the hotel was eventually closed. However, the town still remained a popular destination for fishing and boating.
Geography
Westport is located in Oldham County, Kentucky, on the banks of the Ohio River. The town is situated on the western edge of the county, just south of Louisville. The town is surrounded by rolling hills and farmland, and it is located near the Ohio River.
The climate in Westport is humid subtropical, with hot summers and mild winters. The average temperature in the summer is around 80 degrees Fahrenheit, and the average temperature in the winter is around 40 degrees Fahrenheit.
Economy
The economy of Westport is largely based on agriculture and tourism. The town is home to several farms, and the surrounding area is known for its production of corn, soybeans, and tobacco. The town is also home to several wineries, and it is a popular destination for wine tasting.
Westport is also a popular destination for tourists. The town is home to several historic sites, such as the Westport Hotel, which was built in 1883. The town is also home to several parks and recreational areas, such as the Westport Riverfront Park.
Demographics
As of the 2010 census, the population of Westport was 1,000 people. The racial makeup of the town was 97.2% White, 0.7% African American, 0.2% Native American, 0.2% Asian, 0.2% from other races, and 1.7% from two or more races. The median household income in Westport was $45,000, and the median family income was $50,000.
Conclusion
Westport, Kentucky is a small town located in Oldham County, Kentucky. It is situated on the banks of the Ohio River, just south of Louisville. The town was founded in 1818 and has a population of approximately 1,000 people. The economy of Westport is largely based on agriculture and tourism, and the town is home to several farms, wineries, and historic sites. The racial makeup of the town is 97.2% White, 0.7% African American, 0.2% Native American, 0.2% Asian, 0.2% from other races, and 1.7% from two or more races. The median household income in Westport was $45,000, and the median family income was $50,000.
Common Questions
What is Per Capita Income in Westport?
Per Capita income in Westport is $33,973.
What is the Median Family Income in Westport?
Median Family Income in Westport is $84,141.
What is the Median Household income in Westport?
Median Household Income in Westport is $48,750.
What is Inequality or Gini Index in Westport?
Inequality or Gini Index in Westport is 0.39.
What is the Total Population of Westport?
Total Population of Westport is 206.
What is the Total Male Population of Westport?
Total Male Population of Westport is 77.
What is the Total Female Population of Westport?
Total Female Population of Westport is 129.
What is the Ratio of Males per 100 Females in Westport?
There are 59.69 Males per 100 Females in Westport.
What is the Ratio of Females per 100 Males in Westport?
There are 167.53 Females per 100 Males in Westport.
What is the Median Population Age in Westport?
Median Population Age in Westport is 32.4 Years.
What is the Average Family Size in Westport
Average Family Size in Westport is 2.5 People.
What is the Average Household Size in Westport
Average Household Size in Westport is 1.9 People.
How Large is the Labor Force in Westport?
There are 148 People in the Labor Forcein in Westport.
What is the Percentage of People in the Labor Force in Westport?
80.0% of People are in the Labor Force in Westport.
What is the Unemployment Rate in Westport?
Unemployment Rate in Westport is 8.8%.