Zip Codes with the Highest Percentage of Population Employed in Office & Administration in Owensboro, KY
RELATED REPORTS & OPTIONS
Office & Administration
Owensboro
Compare Zip Codes
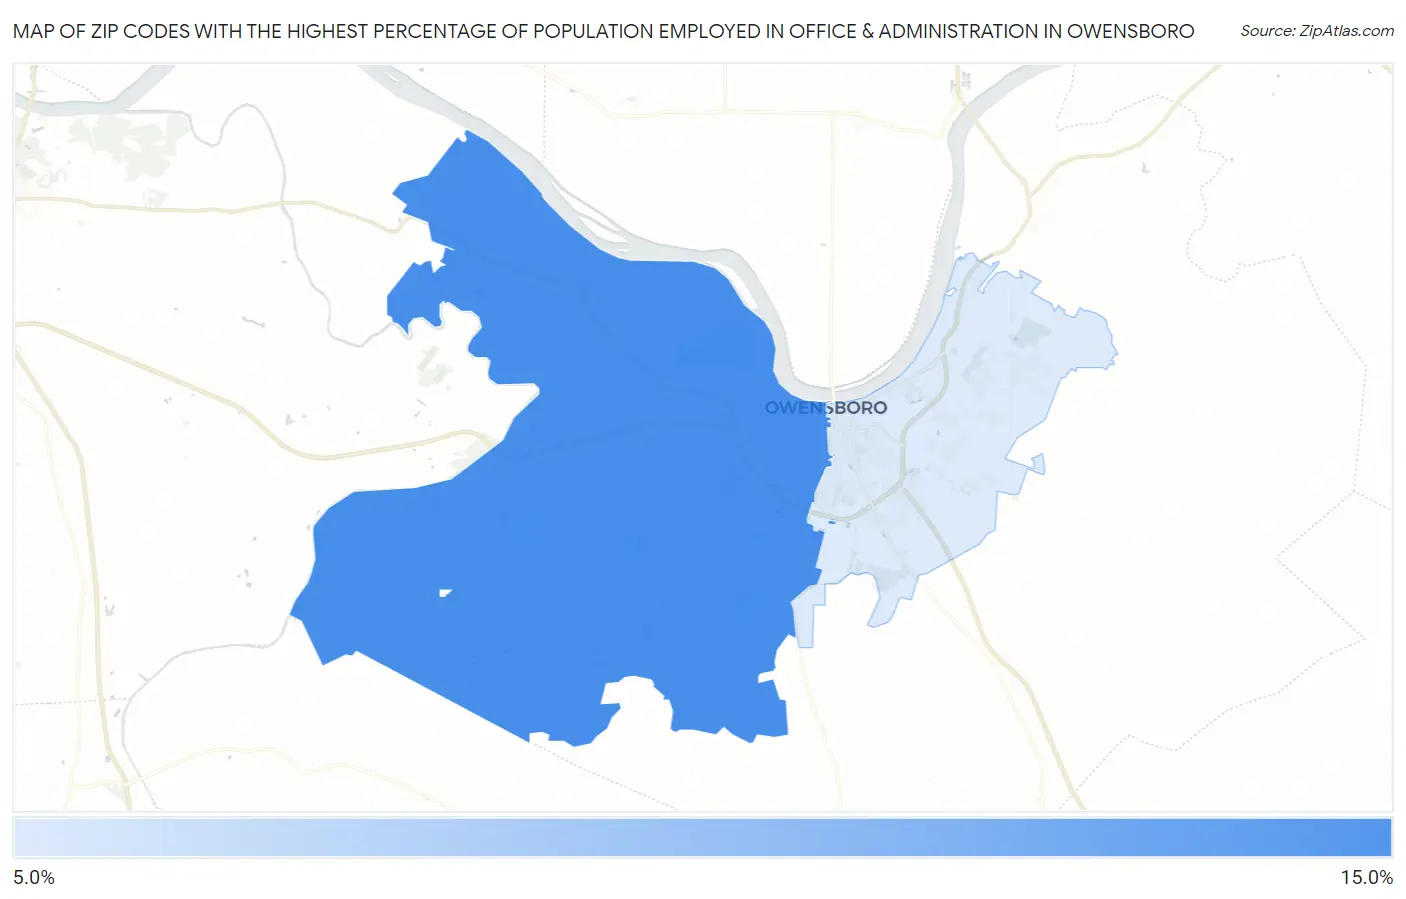
Map of Zip Codes with the Highest Percentage of Population Employed in Office & Administration in Owensboro
12.7%
12.7%
Zip Codes with the Highest Percentage of Population Employed in Office & Administration in Owensboro, KY
| Zip Code | % Employed | vs State | vs National | |
| 1. | 42301 | 12.7% | 11.4%(+1.35)#228 | 10.9%(+1.87)#8,707 |
| 2. | 42303 | 12.7% | 11.4%(+1.31)#230 | 10.9%(+1.83)#8,821 |
1
Common Questions
What are the Top Zip Codes with the Highest Percentage of Population Employed in Office & Administration in Owensboro, KY?
Top Zip Codes with the Highest Percentage of Population Employed in Office & Administration in Owensboro, KY are:
What zip code has the Highest Percentage of Population Employed in Office & Administration in Owensboro, KY?
42301 has the Highest Percentage of Population Employed in Office & Administration in Owensboro, KY with 12.7%.
What is the Percentage of Population Employed in Office & Administration in Owensboro, KY?
Percentage of Population Employed in Office & Administration in Owensboro is 12.2%.
What is the Percentage of Population Employed in Office & Administration in Kentucky?
Percentage of Population Employed in Office & Administration in Kentucky is 11.4%.
What is the Percentage of Population Employed in Office & Administration in the United States?
Percentage of Population Employed in Office & Administration in the United States is 10.9%.