Williamstown, KY Map & Demographics
Williamstown Map
Williamstown Overview
$24,793
PER CAPITA INCOME
$85,484
AVG FAMILY INCOME
$60,726
AVG HOUSEHOLD INCOME
1.2%
WAGE / INCOME GAP [ % ]
98.8¢/ $1
WAGE / INCOME GAP [ $ ]
0.39
INEQUALITY / GINI INDEX
3,909
TOTAL POPULATION
1,845
MALE POPULATION
2,064
FEMALE POPULATION
89.39
MALES / 100 FEMALES
111.87
FEMALES / 100 MALES
33.9
MEDIAN AGE
3.3
AVG FAMILY SIZE
2.6
AVG HOUSEHOLD SIZE
1,762
LABOR FORCE [ PEOPLE ]
60.1%
PERCENT IN LABOR FORCE
1.2%
UNEMPLOYMENT RATE
Williamstown Zip Codes
Williamstown Area Codes
Income in Williamstown
Income Overview in Williamstown
Per Capita Income in Williamstown is $24,793, while median incomes of families and households are $85,484 and $60,726 respectively.
| Characteristic | Number | Measure |
| Per Capita Income | 3,909 | $24,793 |
| Median Family Income | 914 | $85,484 |
| Mean Family Income | 914 | $84,918 |
| Median Household Income | 1,378 | $60,726 |
| Mean Household Income | 1,378 | $70,042 |
| Income Deficit | 914 | $0 |
| Wage / Income Gap (%) | 3,909 | 1.21% |
| Wage / Income Gap ($) | 3,909 | 98.79¢ per $1 |
| Gini / Inequality Index | 3,909 | 0.39 |
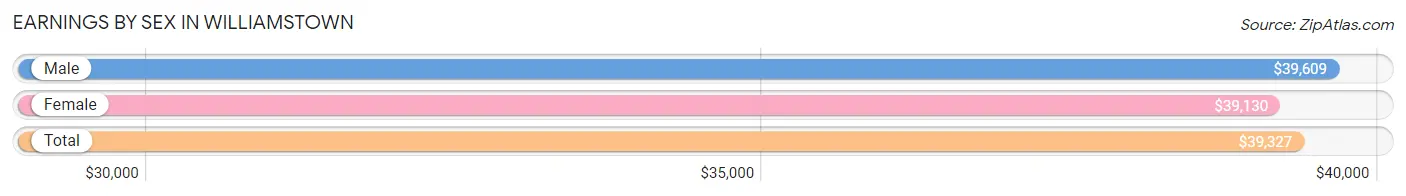
Earnings by Sex in Williamstown
Average Earnings in Williamstown are $39,327, $39,609 for men and $39,130 for women, a difference of 1.2%.
| Sex | Number | Average Earnings |
| Male | 1,030 (53.3%) | $39,609 |
| Female | 902 (46.7%) | $39,130 |
| Total | 1,932 (100.0%) | $39,327 |
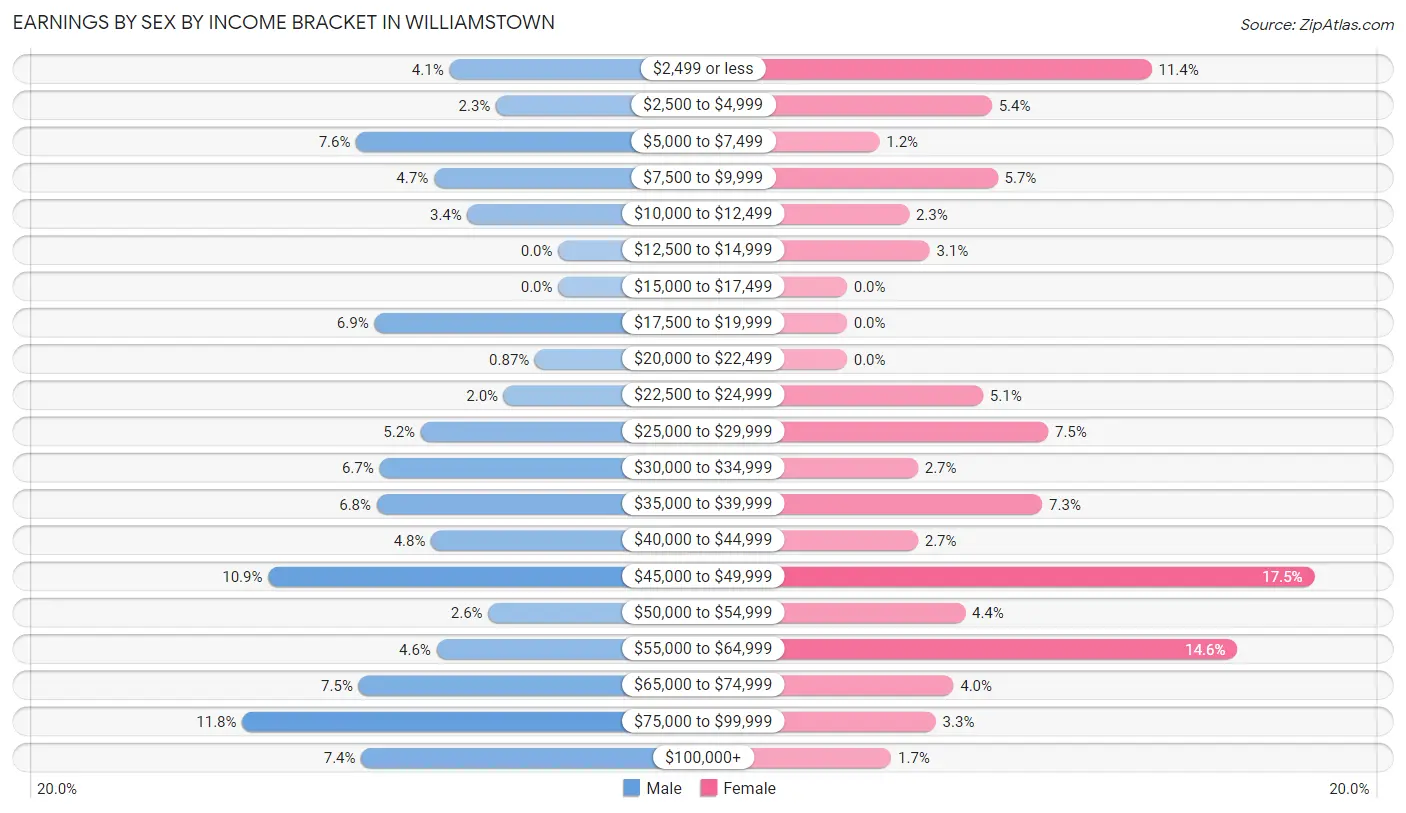
Earnings by Sex by Income Bracket in Williamstown
The most common earnings brackets in Williamstown are $75,000 to $99,999 for men (122 | 11.8%) and $45,000 to $49,999 for women (158 | 17.5%).
| Income | Male | Female |
| $2,499 or less | 42 (4.1%) | 103 (11.4%) |
| $2,500 to $4,999 | 24 (2.3%) | 49 (5.4%) |
| $5,000 to $7,499 | 78 (7.6%) | 11 (1.2%) |
| $7,500 to $9,999 | 48 (4.7%) | 51 (5.7%) |
| $10,000 to $12,499 | 35 (3.4%) | 21 (2.3%) |
| $12,500 to $14,999 | 0 (0.0%) | 28 (3.1%) |
| $15,000 to $17,499 | 0 (0.0%) | 0 (0.0%) |
| $17,500 to $19,999 | 71 (6.9%) | 0 (0.0%) |
| $20,000 to $22,499 | 9 (0.9%) | 0 (0.0%) |
| $22,500 to $24,999 | 21 (2.0%) | 46 (5.1%) |
| $25,000 to $29,999 | 53 (5.1%) | 68 (7.5%) |
| $30,000 to $34,999 | 69 (6.7%) | 24 (2.7%) |
| $35,000 to $39,999 | 70 (6.8%) | 66 (7.3%) |
| $40,000 to $44,999 | 49 (4.8%) | 24 (2.7%) |
| $45,000 to $49,999 | 112 (10.9%) | 158 (17.5%) |
| $50,000 to $54,999 | 27 (2.6%) | 40 (4.4%) |
| $55,000 to $64,999 | 47 (4.6%) | 132 (14.6%) |
| $65,000 to $74,999 | 77 (7.5%) | 36 (4.0%) |
| $75,000 to $99,999 | 122 (11.8%) | 30 (3.3%) |
| $100,000+ | 76 (7.4%) | 15 (1.7%) |
| Total | 1,030 (100.0%) | 902 (100.0%) |
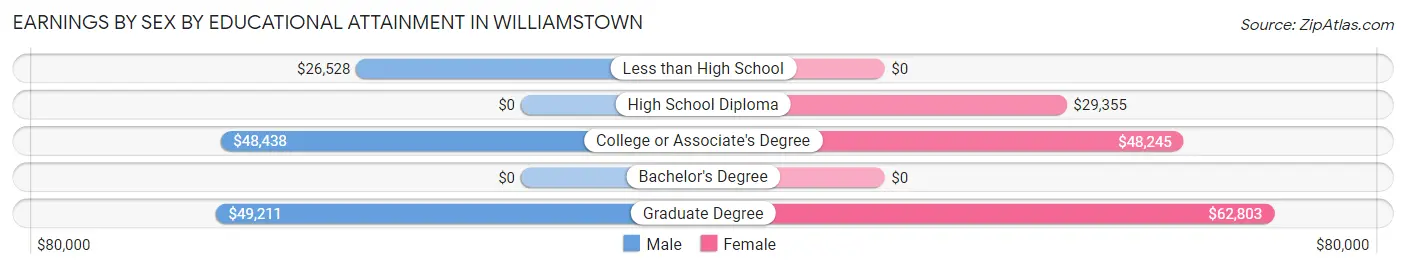
Earnings by Sex by Educational Attainment in Williamstown
Average earnings in Williamstown are $44,883 for men and $45,935 for women, a difference of 2.3%. Men with an educational attainment of graduate degree enjoy the highest average annual earnings of $49,211, while those with less than high school education earn the least with $26,528. Women with an educational attainment of graduate degree earn the most with the average annual earnings of $62,803, while those with high school diploma education have the smallest earnings of $29,355.
| Educational Attainment | Male Income | Female Income |
| Less than High School | $26,528 | $0 |
| High School Diploma | - | - |
| College or Associate's Degree | $48,438 | $48,245 |
| Bachelor's Degree | - | - |
| Graduate Degree | $49,211 | $62,803 |
| Total | $44,883 | $45,935 |
Family Income in Williamstown
Family Income Brackets in Williamstown
According to the Williamstown family income data, there are 246 families falling into the $100,000 to $149,999 income range, which is the most common income bracket and makes up 26.9% of all families.
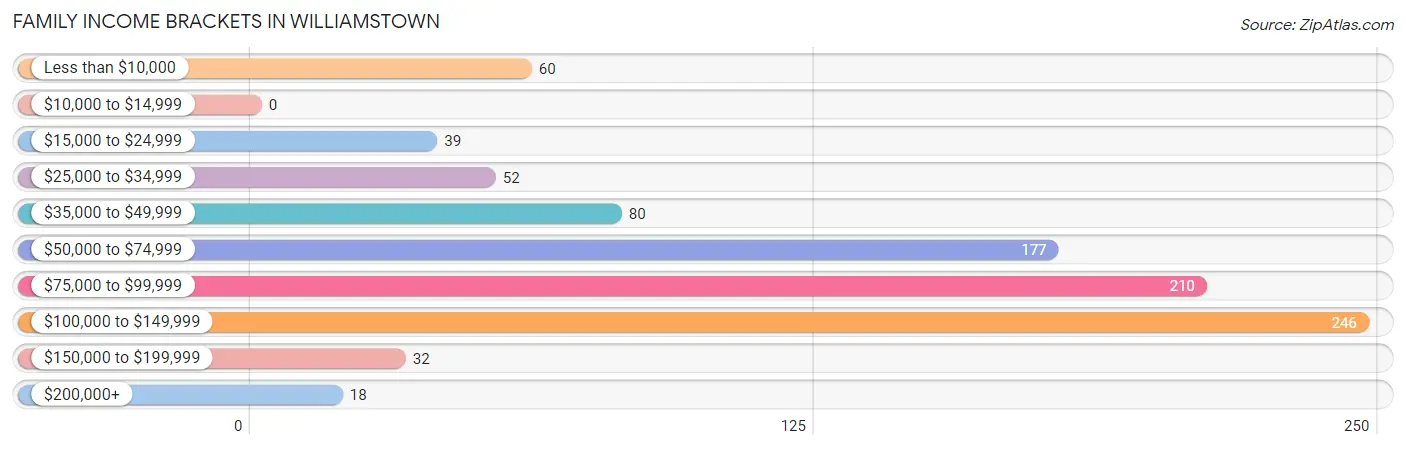
| Income Bracket | # Families | % Families |
| Less than $10,000 | 60 | 6.6% |
| $10,000 to $14,999 | 0 | 0.0% |
| $15,000 to $24,999 | 39 | 4.3% |
| $25,000 to $34,999 | 52 | 5.7% |
| $35,000 to $49,999 | 80 | 8.8% |
| $50,000 to $74,999 | 177 | 19.4% |
| $75,000 to $99,999 | 210 | 23.0% |
| $100,000 to $149,999 | 246 | 26.9% |
| $150,000 to $199,999 | 32 | 3.5% |
| $200,000+ | 18 | 2.0% |
Family Income by Famaliy Size in Williamstown
5-person families (132 | 14.4%) account for the highest median family income in Williamstown with $125,119 per family, while 2-person families (355 | 38.8%) have the highest median income of $40,642 per family member.
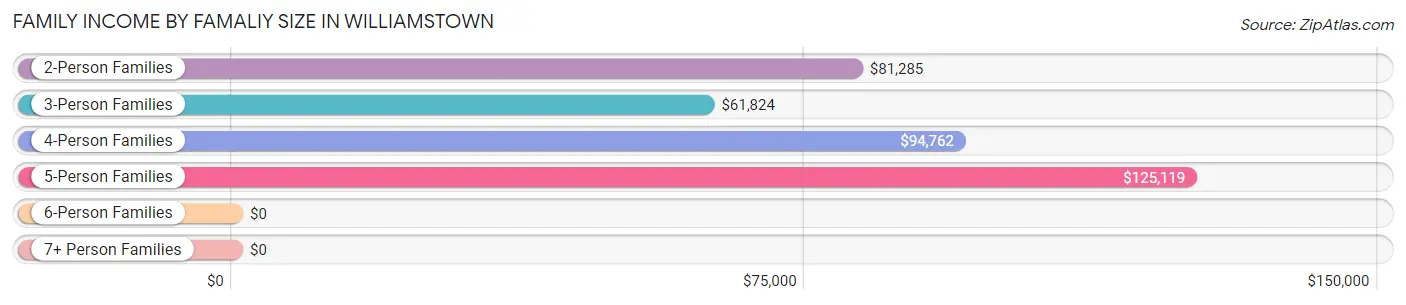
| Income Bracket | # Families | Median Income |
| 2-Person Families | 355 (38.8%) | $81,285 |
| 3-Person Families | 174 (19.0%) | $61,824 |
| 4-Person Families | 210 (23.0%) | $94,762 |
| 5-Person Families | 132 (14.4%) | $125,119 |
| 6-Person Families | 28 (3.1%) | $0 |
| 7+ Person Families | 15 (1.6%) | $0 |
| Total | 914 (100.0%) | $85,484 |
Family Income by Number of Earners in Williamstown
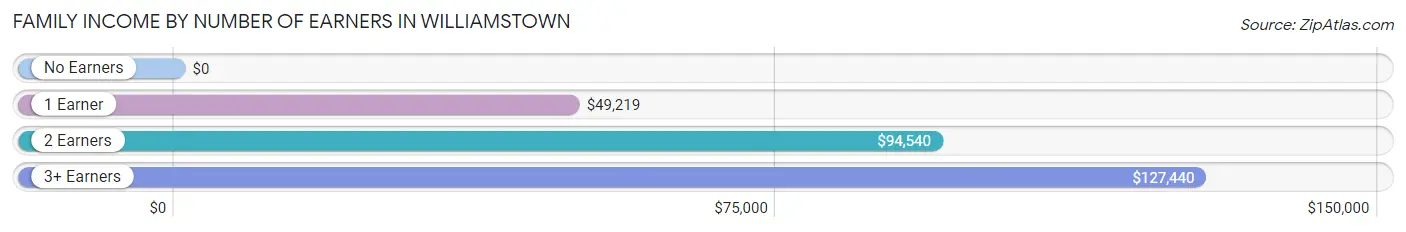
| Number of Earners | # Families | Median Income |
| No Earners | 81 (8.9%) | $0 |
| 1 Earner | 291 (31.8%) | $49,219 |
| 2 Earners | 417 (45.6%) | $94,540 |
| 3+ Earners | 125 (13.7%) | $127,440 |
| Total | 914 (100.0%) | $85,484 |
Household Income in Williamstown
Household Income Brackets in Williamstown
With 267 households falling in the category, the $75,000 to $99,999 income range is the most frequent in Williamstown, accounting for 19.4% of all households. In contrast, only 18 households (1.3%) fall into the $200,000+ income bracket, making it the least populous group.
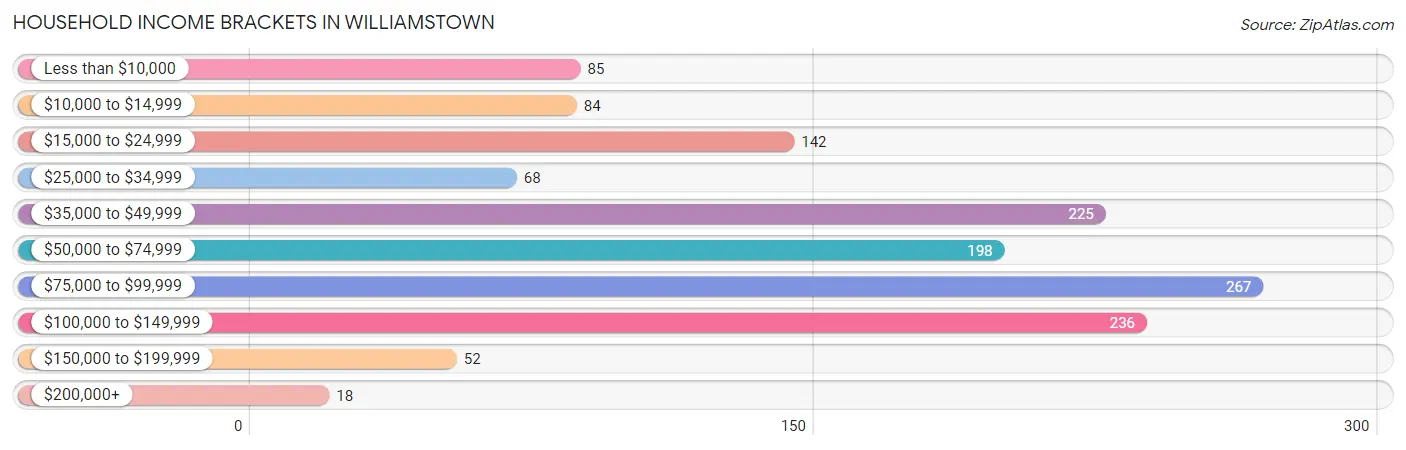
| Income Bracket | # Households | % Households |
| Less than $10,000 | 85 | 6.2% |
| $10,000 to $14,999 | 84 | 6.1% |
| $15,000 to $24,999 | 142 | 10.3% |
| $25,000 to $34,999 | 68 | 4.9% |
| $35,000 to $49,999 | 225 | 16.3% |
| $50,000 to $74,999 | 198 | 14.4% |
| $75,000 to $99,999 | 267 | 19.4% |
| $100,000 to $149,999 | 236 | 17.1% |
| $150,000 to $199,999 | 52 | 3.8% |
| $200,000+ | 18 | 1.3% |
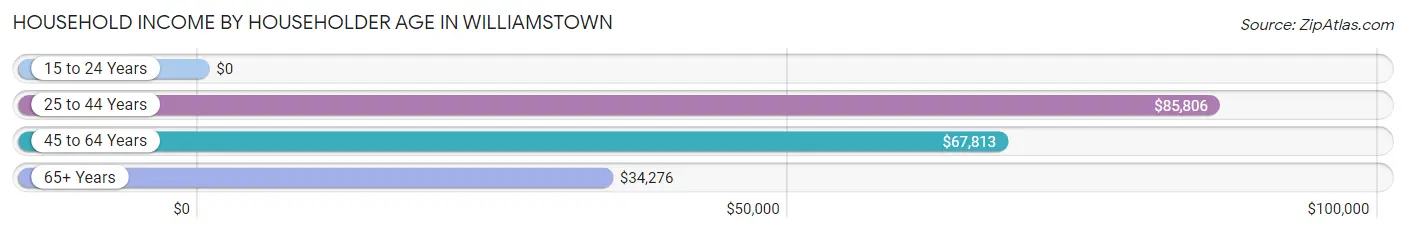
Household Income by Householder Age in Williamstown
The median household income in Williamstown is $60,726, with the highest median household income of $85,806 found in the 25 to 44 years age bracket for the primary householder. A total of 532 households (38.6%) fall into this category. Meanwhile, the 15 to 24 years age bracket for the primary householder has the lowest median household income of $0, with 46 households (3.3%) in this group.
| Income Bracket | # Households | Median Income |
| 15 to 24 Years | 46 (3.3%) | $0 |
| 25 to 44 Years | 532 (38.6%) | $85,806 |
| 45 to 64 Years | 487 (35.3%) | $67,813 |
| 65+ Years | 313 (22.7%) | $34,276 |
| Total | 1,378 (100.0%) | $60,726 |
Poverty in Williamstown
Income Below Poverty by Sex and Age in Williamstown
With 12.1% poverty level for males and 13.9% for females among the residents of Williamstown, 5 year old males and 75 year old and over females are the most vulnerable to poverty, with 25 males (100.0%) and 27 females (39.7%) in their respective age groups living below the poverty level.
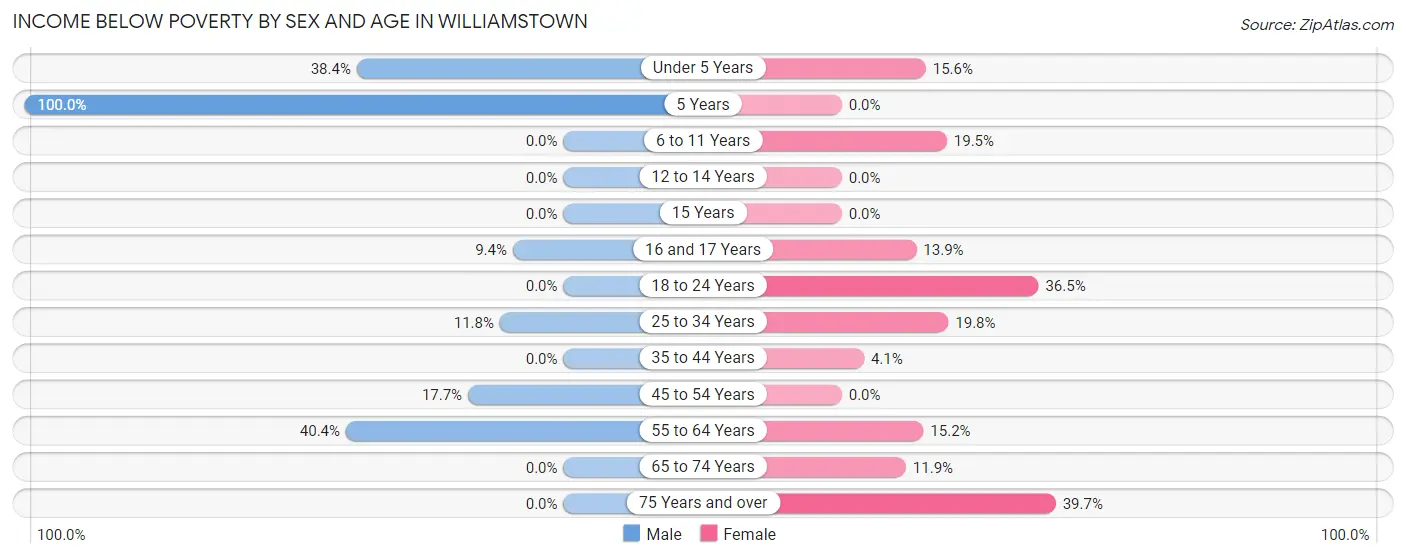
| Age Bracket | Male | Female |
| Under 5 Years | 51 (38.4%) | 46 (15.6%) |
| 5 Years | 25 (100.0%) | 0 (0.0%) |
| 6 to 11 Years | 0 (0.0%) | 31 (19.5%) |
| 12 to 14 Years | 0 (0.0%) | 0 (0.0%) |
| 15 Years | 0 (0.0%) | 0 (0.0%) |
| 16 and 17 Years | 12 (9.4%) | 9 (13.9%) |
| 18 to 24 Years | 0 (0.0%) | 46 (36.5%) |
| 25 to 34 Years | 29 (11.8%) | 53 (19.8%) |
| 35 to 44 Years | 0 (0.0%) | 10 (4.1%) |
| 45 to 54 Years | 34 (17.7%) | 0 (0.0%) |
| 55 to 64 Years | 44 (40.4%) | 40 (15.1%) |
| 65 to 74 Years | 0 (0.0%) | 10 (11.9%) |
| 75 Years and over | 0 (0.0%) | 27 (39.7%) |
| Total | 195 (12.1%) | 272 (13.9%) |
Income Above Poverty by Sex and Age in Williamstown
According to the poverty statistics in Williamstown, males aged 6 to 11 years and females aged 5 years are the age groups that are most secure financially, with 100.0% of males and 100.0% of females in these age groups living above the poverty line.
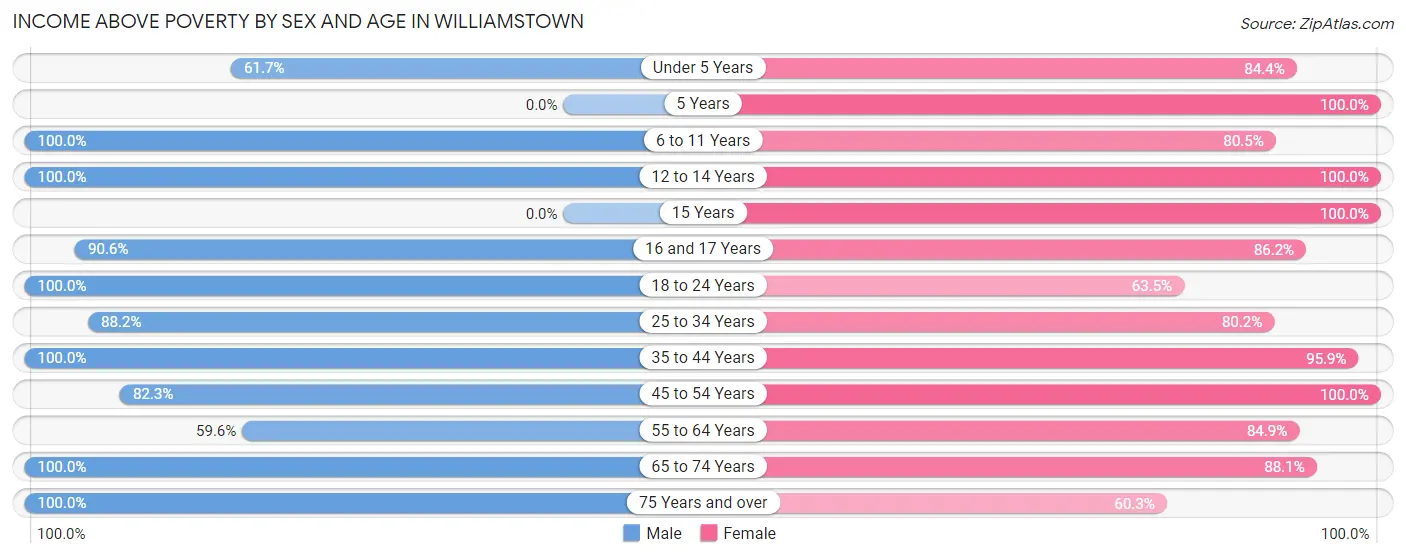
| Age Bracket | Male | Female |
| Under 5 Years | 82 (61.7%) | 249 (84.4%) |
| 5 Years | 0 (0.0%) | 27 (100.0%) |
| 6 to 11 Years | 106 (100.0%) | 128 (80.5%) |
| 12 to 14 Years | 75 (100.0%) | 73 (100.0%) |
| 15 Years | 0 (0.0%) | 61 (100.0%) |
| 16 and 17 Years | 116 (90.6%) | 56 (86.2%) |
| 18 to 24 Years | 73 (100.0%) | 80 (63.5%) |
| 25 to 34 Years | 217 (88.2%) | 215 (80.2%) |
| 35 to 44 Years | 243 (100.0%) | 233 (95.9%) |
| 45 to 54 Years | 158 (82.3%) | 228 (100.0%) |
| 55 to 64 Years | 65 (59.6%) | 224 (84.9%) |
| 65 to 74 Years | 184 (100.0%) | 74 (88.1%) |
| 75 Years and over | 96 (100.0%) | 41 (60.3%) |
| Total | 1,415 (87.9%) | 1,689 (86.1%) |
Income Below Poverty Among Married-Couple Families in Williamstown
The poverty statistics for married-couple families in Williamstown show that 4.0% or 29 of the total 723 families live below the poverty line. Families with 1 or 2 children have the highest poverty rate of 10.6%, comprising of 29 families. On the other hand, families with no children have the lowest poverty rate of 0.0%, which includes 0 families.
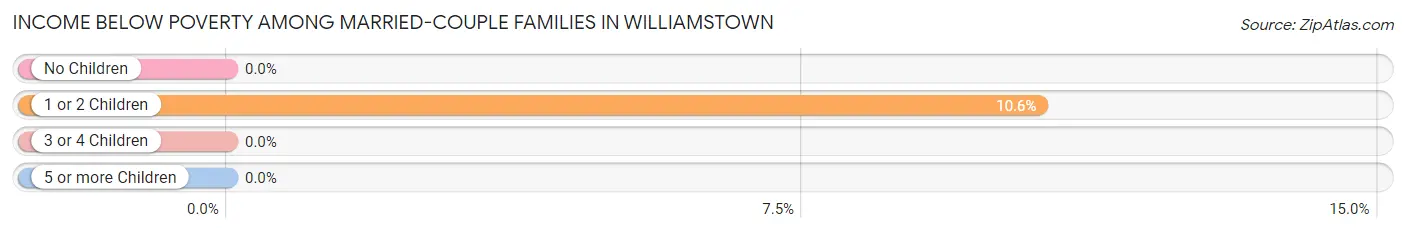
| Children | Above Poverty | Below Poverty |
| No Children | 341 (100.0%) | 0 (0.0%) |
| 1 or 2 Children | 245 (89.4%) | 29 (10.6%) |
| 3 or 4 Children | 93 (100.0%) | 0 (0.0%) |
| 5 or more Children | 15 (100.0%) | 0 (0.0%) |
| Total | 694 (96.0%) | 29 (4.0%) |
Income Below Poverty Among Single-Parent Households in Williamstown
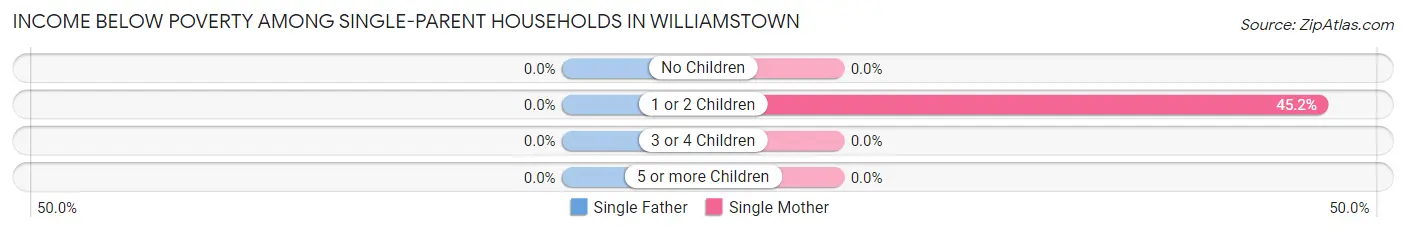
| Children | Single Father | Single Mother |
| No Children | 0 (0.0%) | 0 (0.0%) |
| 1 or 2 Children | 0 (0.0%) | 70 (45.2%) |
| 3 or 4 Children | 0 (0.0%) | 0 (0.0%) |
| 5 or more Children | 0 (0.0%) | 0 (0.0%) |
| Total | 0 (0.0%) | 70 (40.5%) |
Income Below Poverty Among Married-Couple vs Single-Parent Households in Williamstown
The poverty data for Williamstown shows that 29 of the married-couple family households (4.0%) and 70 of the single-parent households (36.6%) are living below the poverty level. Within the married-couple family households, those with 1 or 2 children have the highest poverty rate, with 29 households (10.6%) falling below the poverty line. Among the single-parent households, those with 1 or 2 children have the highest poverty rate, with 70 household (40.5%) living below poverty.
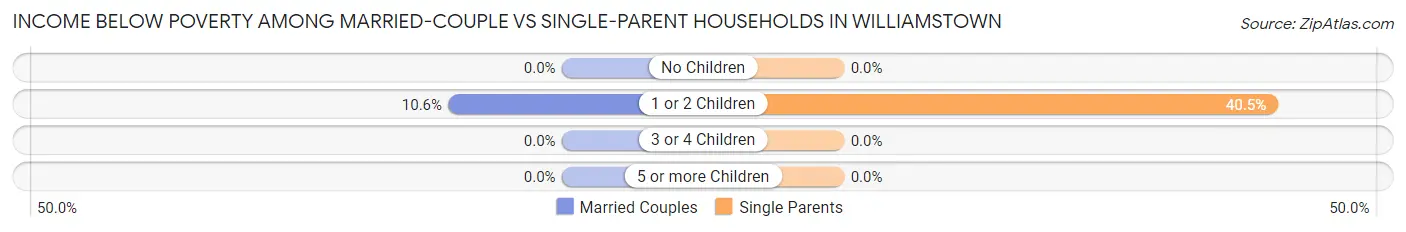
| Children | Married-Couple Families | Single-Parent Households |
| No Children | 0 (0.0%) | 0 (0.0%) |
| 1 or 2 Children | 29 (10.6%) | 70 (40.5%) |
| 3 or 4 Children | 0 (0.0%) | 0 (0.0%) |
| 5 or more Children | 0 (0.0%) | 0 (0.0%) |
| Total | 29 (4.0%) | 70 (36.6%) |
Race in Williamstown
The most populous races in Williamstown are White / Caucasian (3,612 | 92.4%), Two or more Races (293 | 7.5%), and Black / African American (4 | 0.1%).
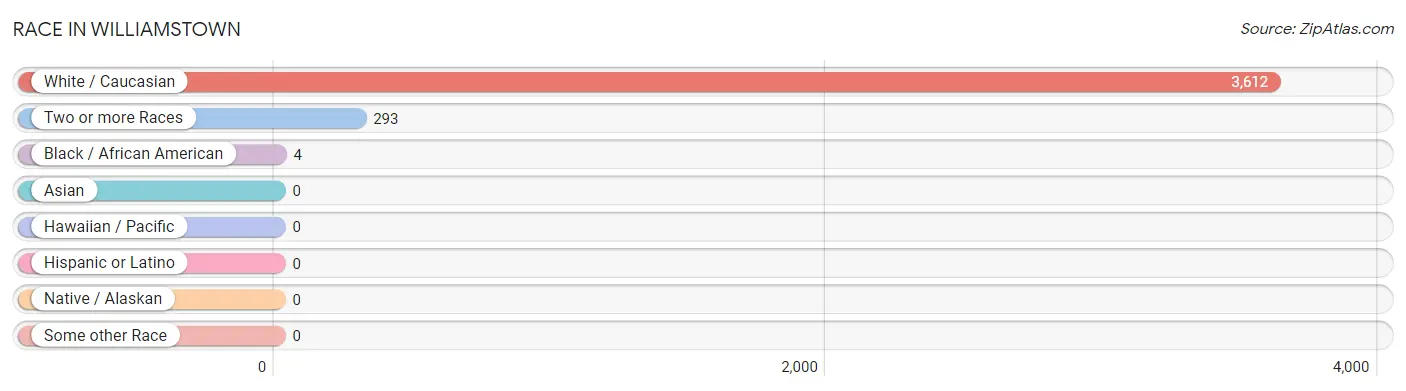
| Race | # Population | % Population |
| Asian | 0 | 0.0% |
| Black / African American | 4 | 0.1% |
| Hawaiian / Pacific | 0 | 0.0% |
| Hispanic or Latino | 0 | 0.0% |
| Native / Alaskan | 0 | 0.0% |
| White / Caucasian | 3,612 | 92.4% |
| Two or more Races | 293 | 7.5% |
| Some other Race | 0 | 0.0% |
| Total | 3,909 | 100.0% |
Ancestry in Williamstown
The most populous ancestries reported in Williamstown are English (780 | 20.0%), German (741 | 19.0%), Irish (595 | 15.2%), American (474 | 12.1%), and Polish (114 | 2.9%), together accounting for 69.2% of all Williamstown residents.
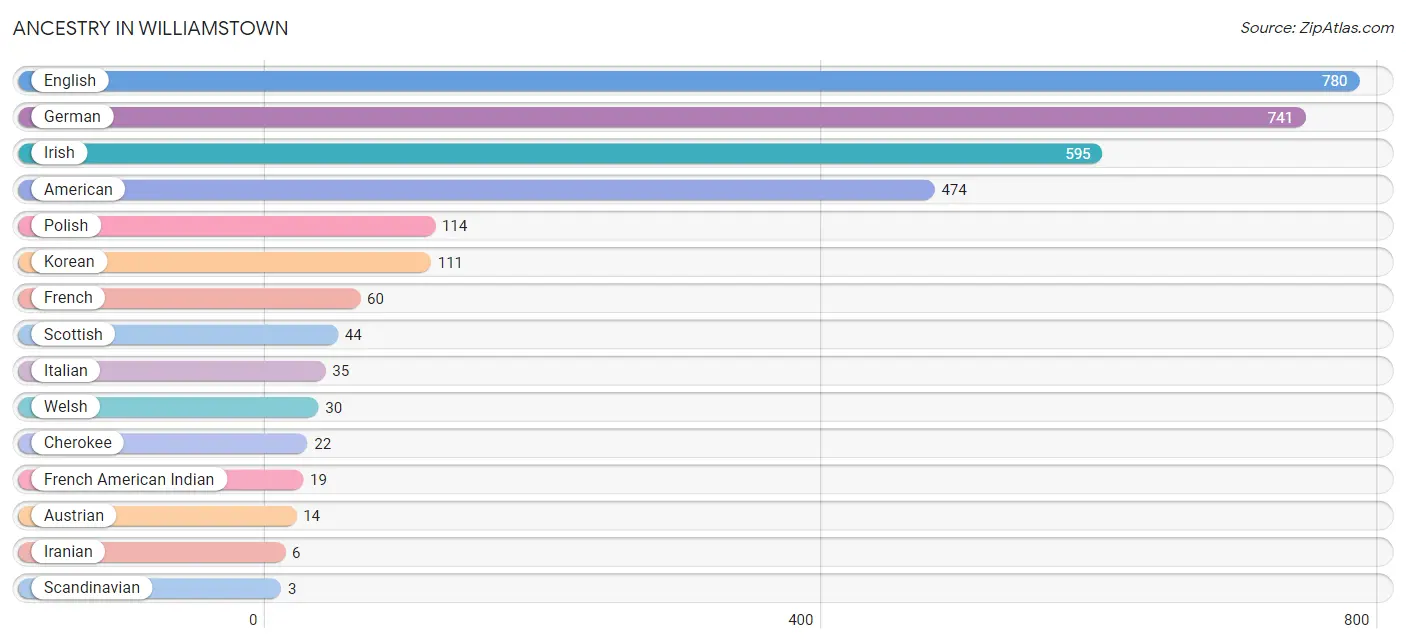
| Ancestry | # Population | % Population |
| American | 474 | 12.1% |
| Austrian | 14 | 0.4% |
| Cherokee | 22 | 0.6% |
| English | 780 | 20.0% |
| French | 60 | 1.5% |
| French American Indian | 19 | 0.5% |
| German | 741 | 19.0% |
| Iranian | 6 | 0.2% |
| Irish | 595 | 15.2% |
| Italian | 35 | 0.9% |
| Korean | 111 | 2.8% |
| Polish | 114 | 2.9% |
| Scandinavian | 3 | 0.1% |
| Scottish | 44 | 1.1% |
| Welsh | 30 | 0.8% | View All 15 Rows |
Immigrants in Williamstown

| Immigration Origin | # Population | % Population | View All 0 Rows |
Sex and Age in Williamstown
Sex and Age in Williamstown
The most populous age groups in Williamstown are 40 to 44 Years (243 | 13.2%) for men and Under 5 Years (295 | 14.3%) for women.
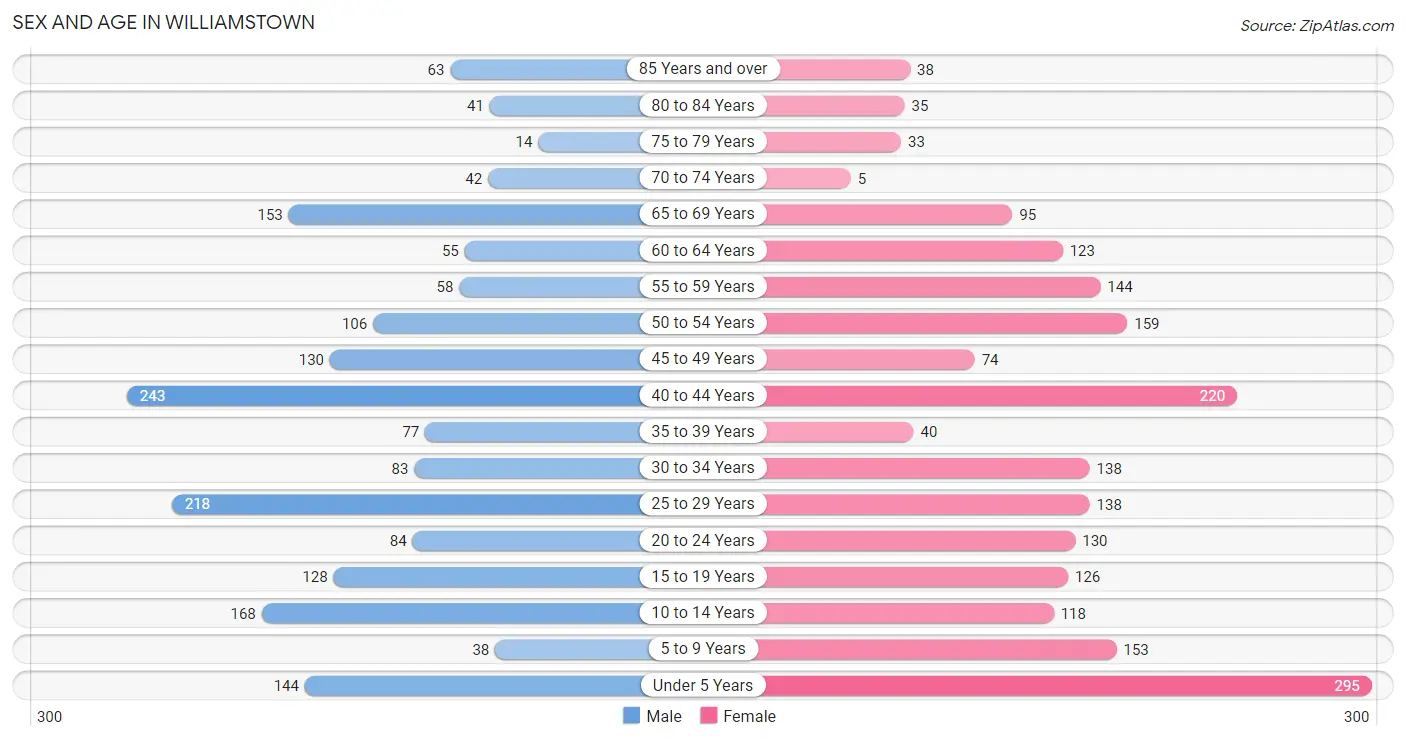
| Age Bracket | Male | Female |
| Under 5 Years | 144 (7.8%) | 295 (14.3%) |
| 5 to 9 Years | 38 (2.1%) | 153 (7.4%) |
| 10 to 14 Years | 168 (9.1%) | 118 (5.7%) |
| 15 to 19 Years | 128 (6.9%) | 126 (6.1%) |
| 20 to 24 Years | 84 (4.5%) | 130 (6.3%) |
| 25 to 29 Years | 218 (11.8%) | 138 (6.7%) |
| 30 to 34 Years | 83 (4.5%) | 138 (6.7%) |
| 35 to 39 Years | 77 (4.2%) | 40 (1.9%) |
| 40 to 44 Years | 243 (13.2%) | 220 (10.7%) |
| 45 to 49 Years | 130 (7.0%) | 74 (3.6%) |
| 50 to 54 Years | 106 (5.8%) | 159 (7.7%) |
| 55 to 59 Years | 58 (3.1%) | 144 (7.0%) |
| 60 to 64 Years | 55 (3.0%) | 123 (6.0%) |
| 65 to 69 Years | 153 (8.3%) | 95 (4.6%) |
| 70 to 74 Years | 42 (2.3%) | 5 (0.2%) |
| 75 to 79 Years | 14 (0.8%) | 33 (1.6%) |
| 80 to 84 Years | 41 (2.2%) | 35 (1.7%) |
| 85 Years and over | 63 (3.4%) | 38 (1.8%) |
| Total | 1,845 (100.0%) | 2,064 (100.0%) |
Families and Households in Williamstown
Median Family Size in Williamstown
The median family size in Williamstown is 3.28 persons per family, with single female/mother families (173 | 18.9%) accounting for the largest median family size of 3.72 persons per family. On the other hand, single male/father families (18 | 2.0%) represent the smallest median family size with 2.22 persons per family.
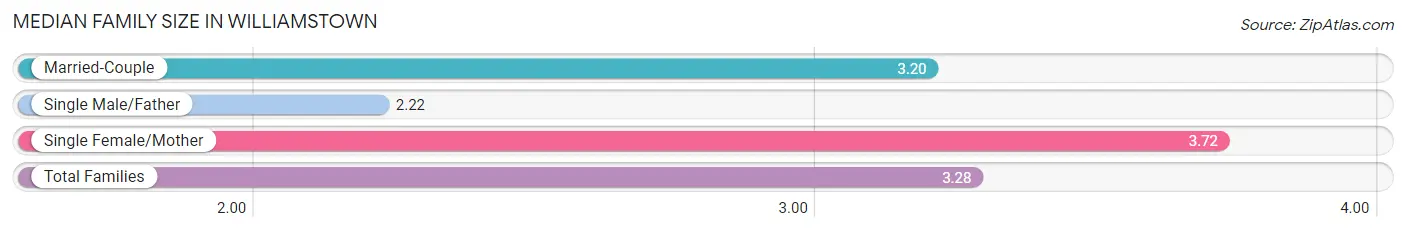
| Family Type | # Families | Family Size |
| Married-Couple | 723 (79.1%) | 3.20 |
| Single Male/Father | 18 (2.0%) | 2.22 |
| Single Female/Mother | 173 (18.9%) | 3.72 |
| Total Families | 914 (100.0%) | 3.28 |
Median Household Size in Williamstown
The median household size in Williamstown is 2.61 persons per household, with single female/mother households (173 | 12.6%) accounting for the largest median household size of 3.84 persons per household. non-family households (464 | 33.7%) represent the smallest median household size with 1.11 persons per household.
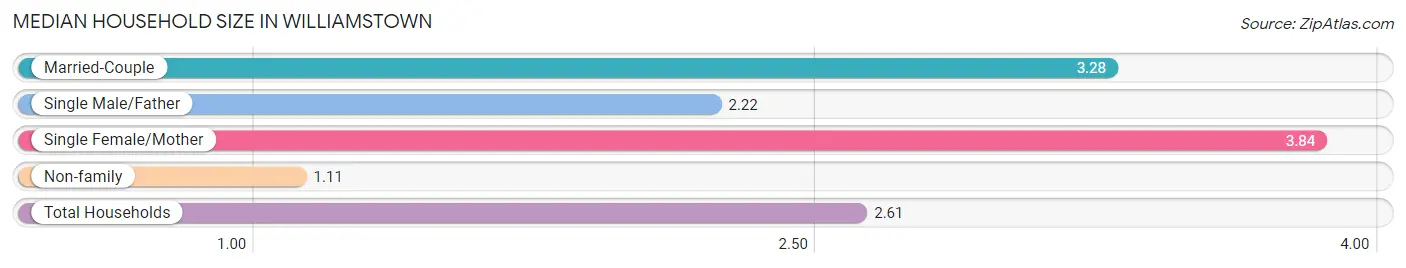
| Household Type | # Households | Household Size |
| Married-Couple | 723 (52.5%) | 3.28 |
| Single Male/Father | 18 (1.3%) | 2.22 |
| Single Female/Mother | 173 (12.6%) | 3.84 |
| Non-family | 464 (33.7%) | 1.11 |
| Total Households | 1,378 (100.0%) | 2.61 |
Household Size by Marriage Status in Williamstown
Out of a total of 1,378 households in Williamstown, 914 (66.3%) are family households, while 464 (33.7%) are nonfamily households. The most numerous type of family households are 2-person households, comprising 343, and the most common type of nonfamily households are 1-person households, comprising 408.
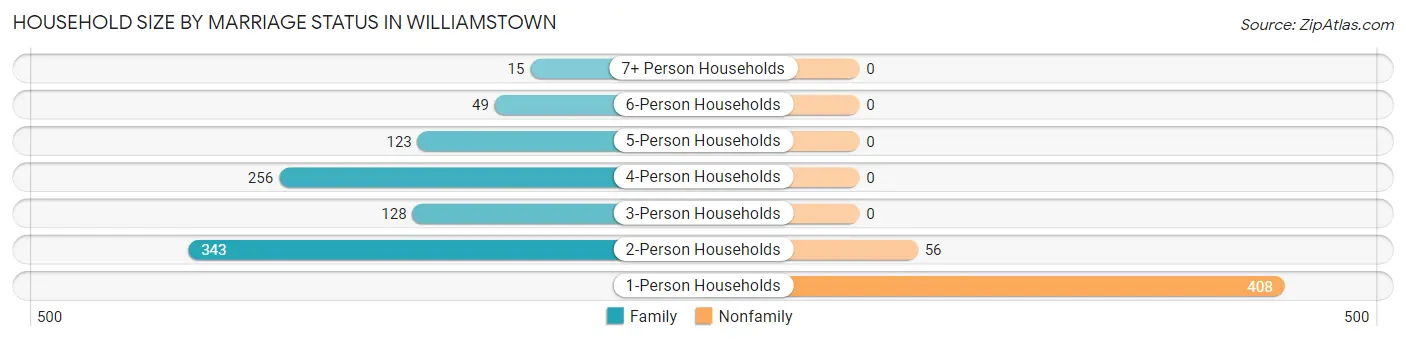
| Household Size | Family Households | Nonfamily Households |
| 1-Person Households | - | 408 (29.6%) |
| 2-Person Households | 343 (24.9%) | 56 (4.1%) |
| 3-Person Households | 128 (9.3%) | 0 (0.0%) |
| 4-Person Households | 256 (18.6%) | 0 (0.0%) |
| 5-Person Households | 123 (8.9%) | 0 (0.0%) |
| 6-Person Households | 49 (3.6%) | 0 (0.0%) |
| 7+ Person Households | 15 (1.1%) | 0 (0.0%) |
| Total | 914 (66.3%) | 464 (33.7%) |
Female Fertility in Williamstown
Fertility by Age in Williamstown
Average fertility rate in Williamstown is 61.0 births per 1,000 women. Women in the age bracket of 20 to 34 years have the highest fertility rate with 145.0 births per 1,000 women. Women in the age bracket of 20 to 34 years acount for 100.0% of all women with births.
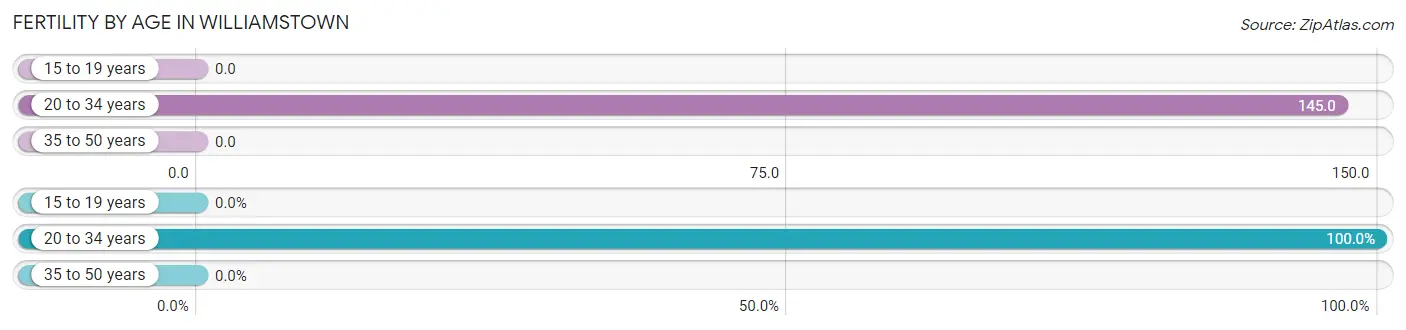
| Age Bracket | Women with Births | Births / 1,000 Women |
| 15 to 19 years | 0 (0.0%) | 0.0 |
| 20 to 34 years | 59 (100.0%) | 145.0 |
| 35 to 50 years | 0 (0.0%) | 0.0 |
| Total | 59 (100.0%) | 61.0 |
Fertility by Age by Marriage Status in Williamstown
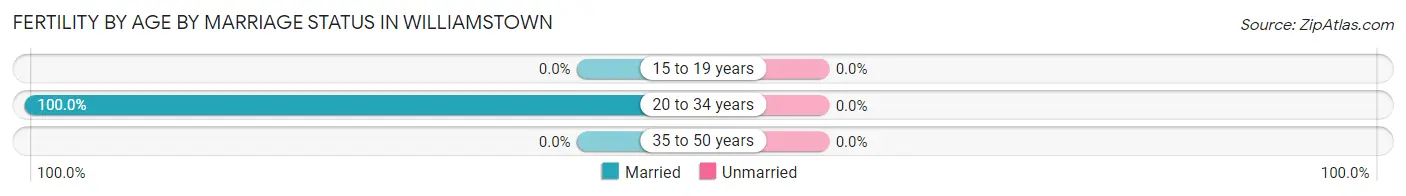
| Age Bracket | Married | Unmarried |
| 15 to 19 years | 0 (0.0%) | 0 (0.0%) |
| 20 to 34 years | 59 (100.0%) | 0 (0.0%) |
| 35 to 50 years | 0 (0.0%) | 0 (0.0%) |
| Total | 59 (100.0%) | 0 (0.0%) |
Fertility by Education in Williamstown
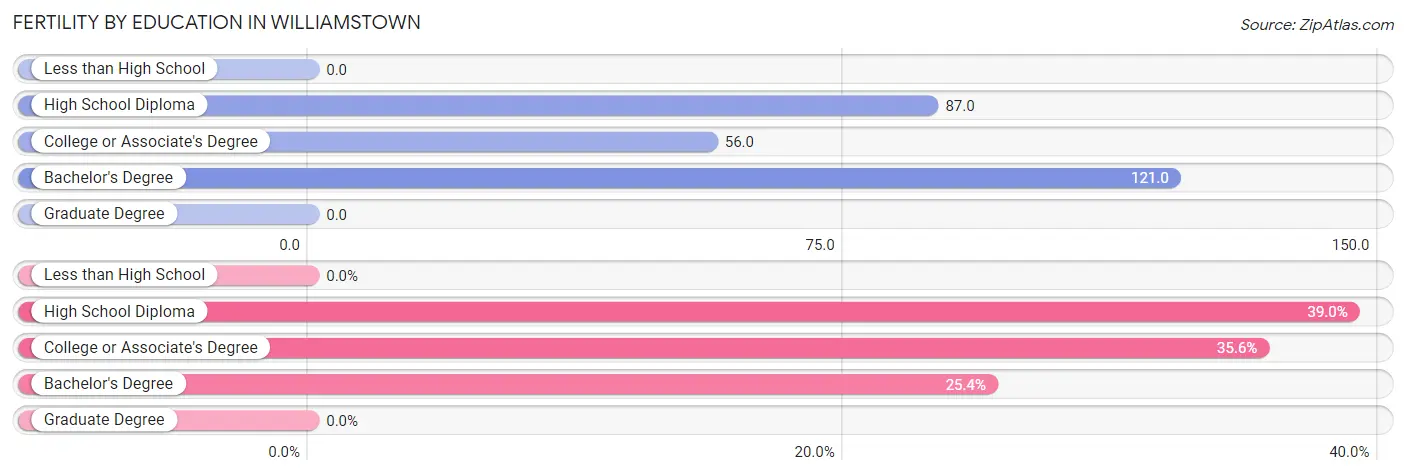
| Educational Attainment | Women with Births | Births / 1,000 Women |
| Less than High School | 0 (0.0%) | 0.0 |
| High School Diploma | 23 (39.0%) | 87.0 |
| College or Associate's Degree | 21 (35.6%) | 56.0 |
| Bachelor's Degree | 15 (25.4%) | 121.0 |
| Graduate Degree | 0 (0.0%) | 0.0 |
| Total | 59 (100.0%) | 61.0 |
Fertility by Education by Marriage Status in Williamstown
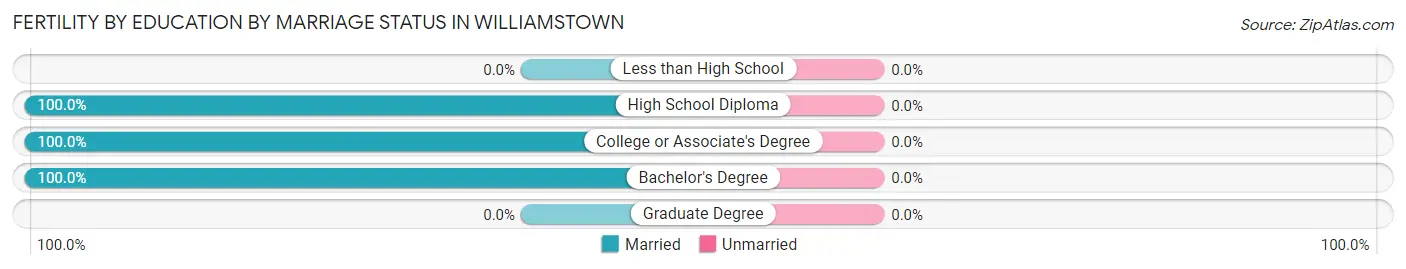
| Educational Attainment | Married | Unmarried |
| Less than High School | 0 (0.0%) | 0 (0.0%) |
| High School Diploma | 23 (100.0%) | 0 (0.0%) |
| College or Associate's Degree | 21 (100.0%) | 0 (0.0%) |
| Bachelor's Degree | 15 (100.0%) | 0 (0.0%) |
| Graduate Degree | 0 (0.0%) | 0 (0.0%) |
| Total | 59 (100.0%) | 0 (0.0%) |
Employment Characteristics in Williamstown
Employment by Class of Employer in Williamstown
Among the 1,705 employed individuals in Williamstown, private company employees (1,045 | 61.3%), local government employees (265 | 15.5%), and state government employees (179 | 10.5%) make up the most common classes of employment.
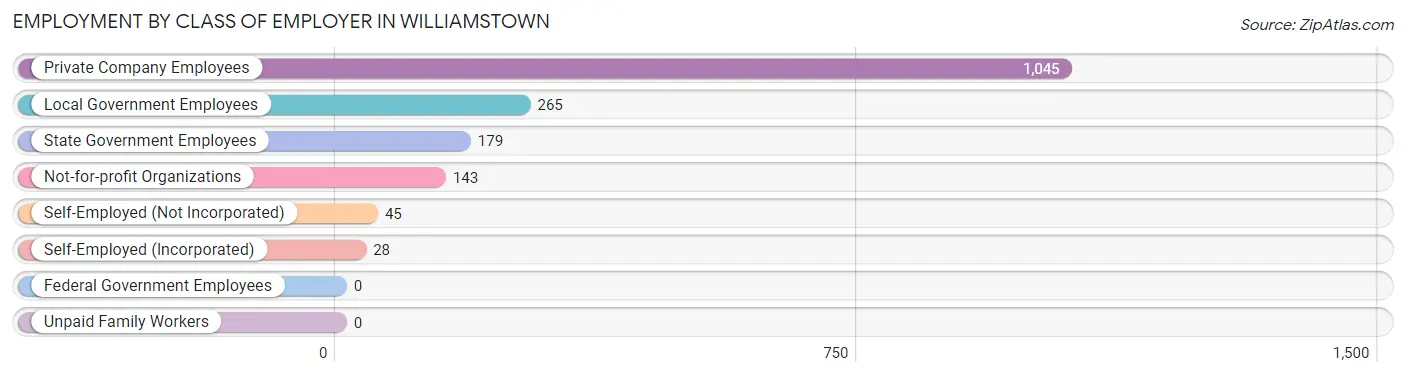
| Employer Class | # Employees | % Employees |
| Private Company Employees | 1,045 | 61.3% |
| Self-Employed (Incorporated) | 28 | 1.6% |
| Self-Employed (Not Incorporated) | 45 | 2.6% |
| Not-for-profit Organizations | 143 | 8.4% |
| Local Government Employees | 265 | 15.5% |
| State Government Employees | 179 | 10.5% |
| Federal Government Employees | 0 | 0.0% |
| Unpaid Family Workers | 0 | 0.0% |
| Total | 1,705 | 100.0% |
Employment Status by Age in Williamstown
According to the labor force statistics for Williamstown, out of the total population over 16 years of age (2,932), 60.1% or 1,762 individuals are in the labor force, with 1.2% or 21 of them unemployed. The age group with the highest labor force participation rate is 25 to 29 years, with 96.1% or 342 individuals in the labor force. Within the labor force, the 35 to 44 years age range has the highest percentage of unemployed individuals, with 4.9% or 22 of them being unemployed.
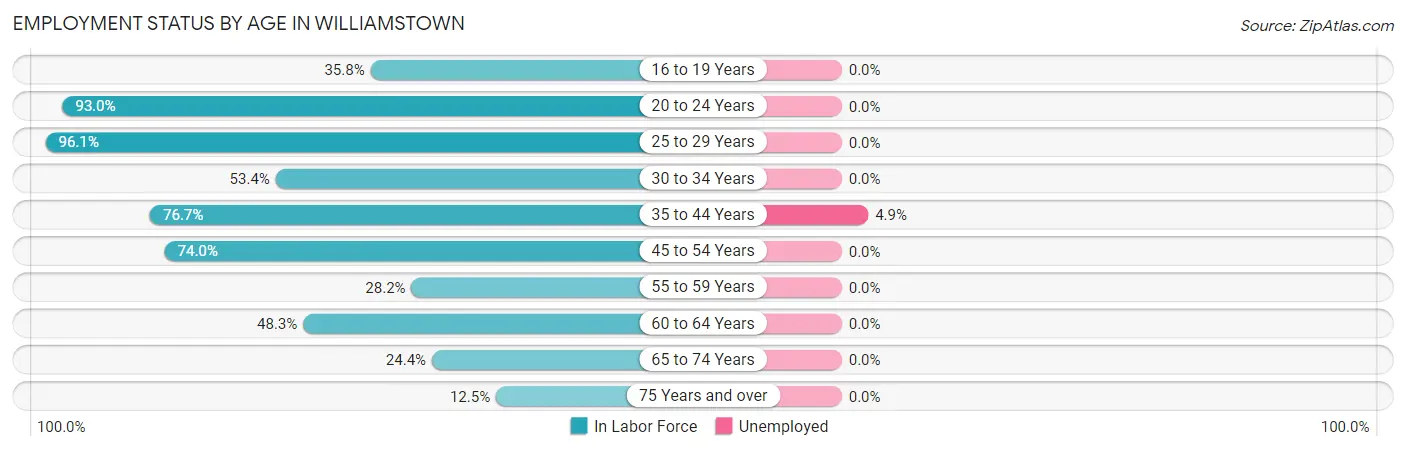
| Age Bracket | In Labor Force | Unemployed |
| 16 to 19 Years | 69 (35.8%) | 0 (0.0%) |
| 20 to 24 Years | 199 (93.0%) | 0 (0.0%) |
| 25 to 29 Years | 342 (96.1%) | 0 (0.0%) |
| 30 to 34 Years | 118 (53.4%) | 0 (0.0%) |
| 35 to 44 Years | 445 (76.7%) | 22 (4.9%) |
| 45 to 54 Years | 347 (74.0%) | 0 (0.0%) |
| 55 to 59 Years | 57 (28.2%) | 0 (0.0%) |
| 60 to 64 Years | 86 (48.3%) | 0 (0.0%) |
| 65 to 74 Years | 72 (24.4%) | 0 (0.0%) |
| 75 Years and over | 28 (12.5%) | 0 (0.0%) |
| Total | 1,762 (60.1%) | 21 (1.2%) |
Employment Status by Educational Attainment in Williamstown
According to labor force statistics for Williamstown, 69.5% of individuals (1,394) out of the total population between 25 and 64 years of age (2,006) are in the labor force, with 1.6% or 22 of them being unemployed. The group with the highest labor force participation rate are those with the educational attainment of college / associate degree, with 87.6% or 501 individuals in the labor force. Within the labor force, individuals with high school diploma education have the highest percentage of unemployment, with 4.5% or 22 of them being unemployed.
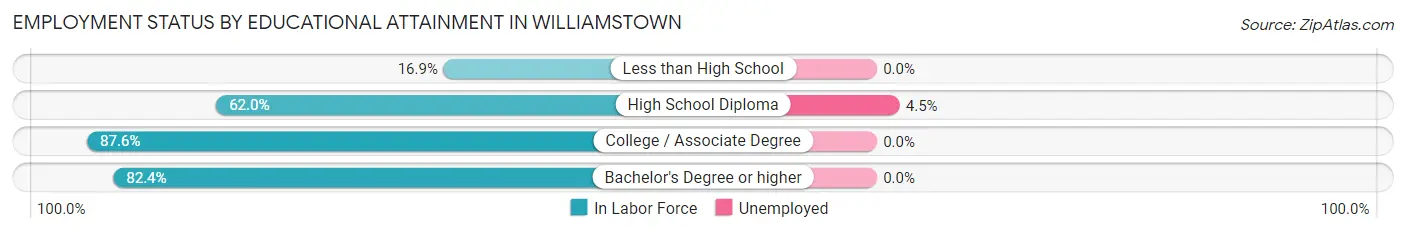
| Educational Attainment | In Labor Force | Unemployed |
| Less than High School | 33 (16.9%) | 0 (0.0%) |
| High School Diploma | 487 (62.0%) | 35 (4.5%) |
| College / Associate Degree | 501 (87.6%) | 0 (0.0%) |
| Bachelor's Degree or higher | 374 (82.4%) | 0 (0.0%) |
| Total | 1,394 (69.5%) | 32 (1.6%) |
Employment Occupations by Sex in Williamstown
Management, Business, Science and Arts Occupations
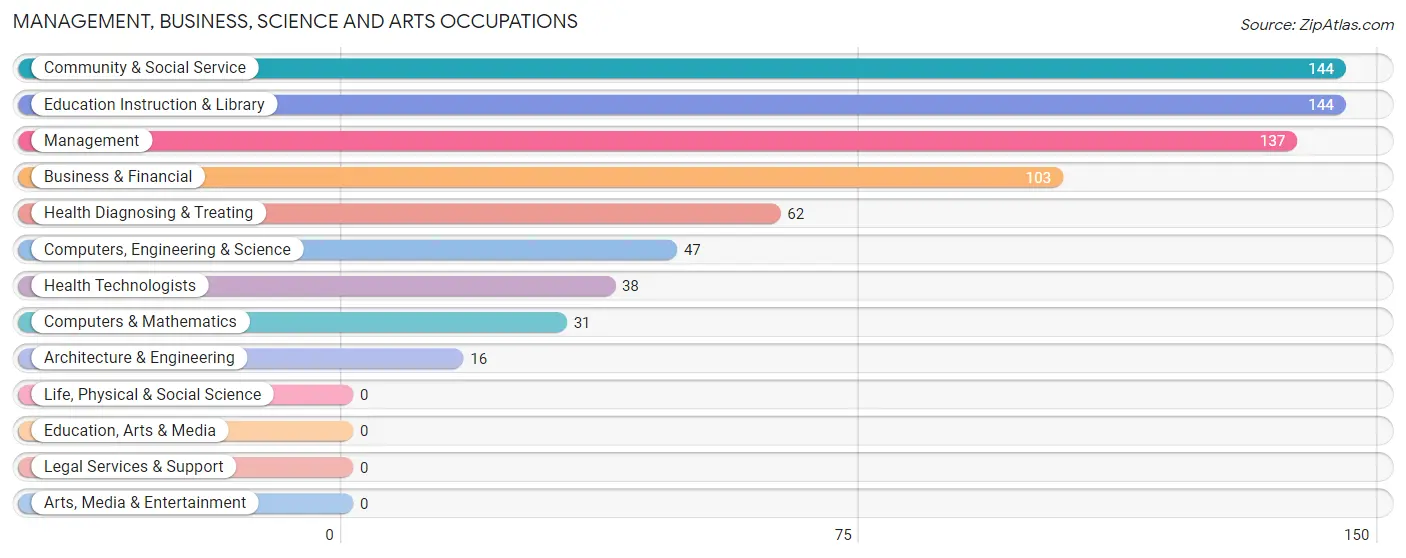
The most common Management, Business, Science and Arts occupations in Williamstown are Community & Social Service (144 | 8.3%), Education Instruction & Library (144 | 8.3%), Management (137 | 7.9%), Business & Financial (103 | 5.9%), and Health Diagnosing & Treating (62 | 3.6%).
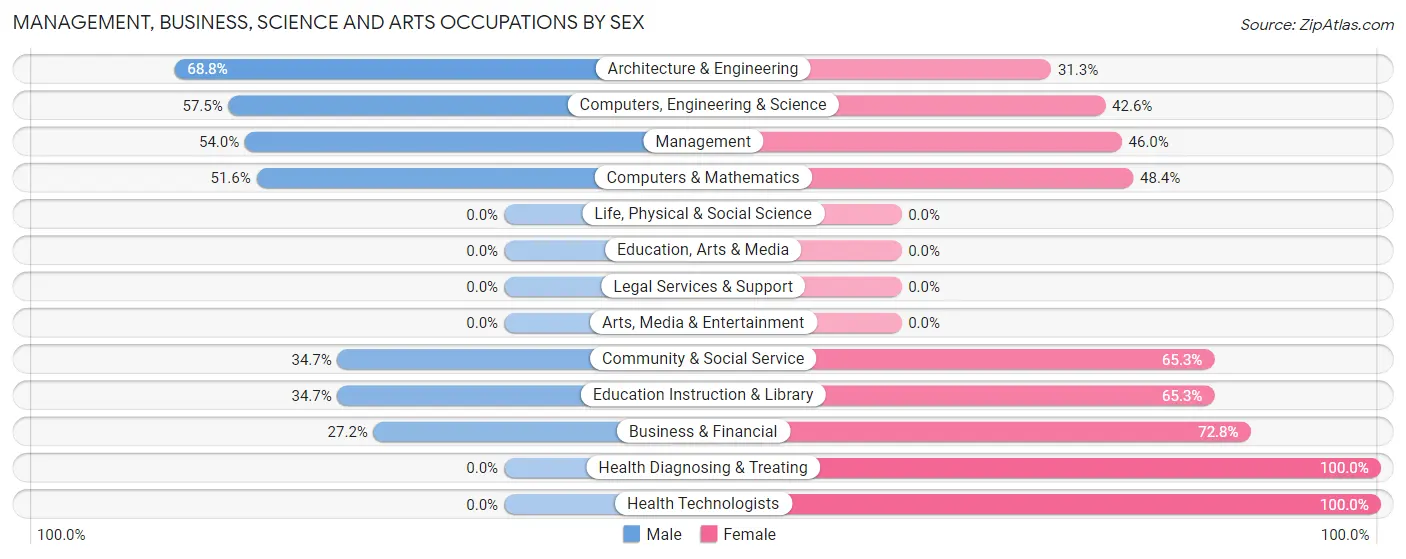
Management, Business, Science and Arts Occupations by Sex
Within the Management, Business, Science and Arts occupations in Williamstown, the most male-oriented occupations are Architecture & Engineering (68.8%), Computers, Engineering & Science (57.5%), and Management (54.0%), while the most female-oriented occupations are Health Diagnosing & Treating (100.0%), Health Technologists (100.0%), and Business & Financial (72.8%).
| Occupation | Male | Female |
| Management | 74 (54.0%) | 63 (46.0%) |
| Business & Financial | 28 (27.2%) | 75 (72.8%) |
| Computers, Engineering & Science | 27 (57.5%) | 20 (42.5%) |
| Computers & Mathematics | 16 (51.6%) | 15 (48.4%) |
| Architecture & Engineering | 11 (68.8%) | 5 (31.2%) |
| Life, Physical & Social Science | 0 (0.0%) | 0 (0.0%) |
| Community & Social Service | 50 (34.7%) | 94 (65.3%) |
| Education, Arts & Media | 0 (0.0%) | 0 (0.0%) |
| Legal Services & Support | 0 (0.0%) | 0 (0.0%) |
| Education Instruction & Library | 50 (34.7%) | 94 (65.3%) |
| Arts, Media & Entertainment | 0 (0.0%) | 0 (0.0%) |
| Health Diagnosing & Treating | 0 (0.0%) | 62 (100.0%) |
| Health Technologists | 0 (0.0%) | 38 (100.0%) |
| Total (Category) | 179 (36.3%) | 314 (63.7%) |
| Total (Overall) | 887 (50.9%) | 854 (49.0%) |
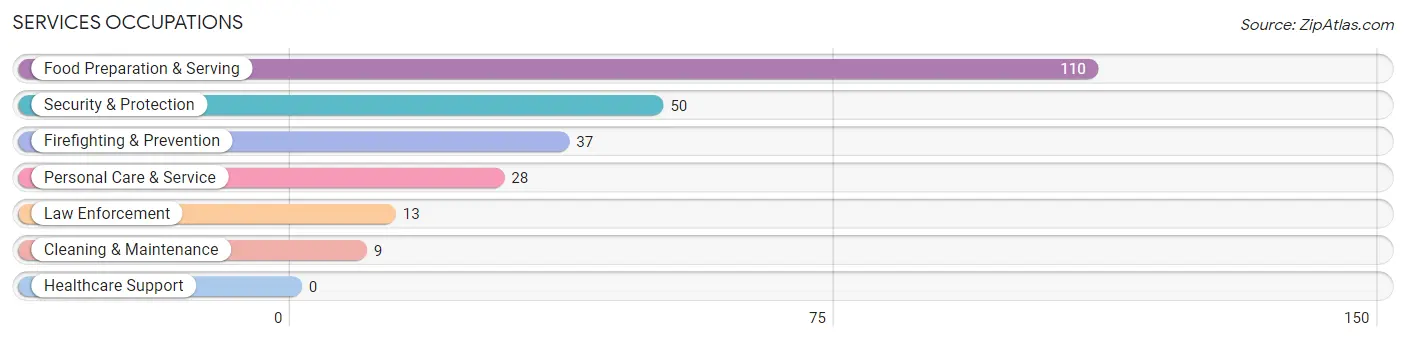
Services Occupations
The most common Services occupations in Williamstown are Food Preparation & Serving (110 | 6.3%), Security & Protection (50 | 2.9%), Firefighting & Prevention (37 | 2.1%), Personal Care & Service (28 | 1.6%), and Law Enforcement (13 | 0.7%).
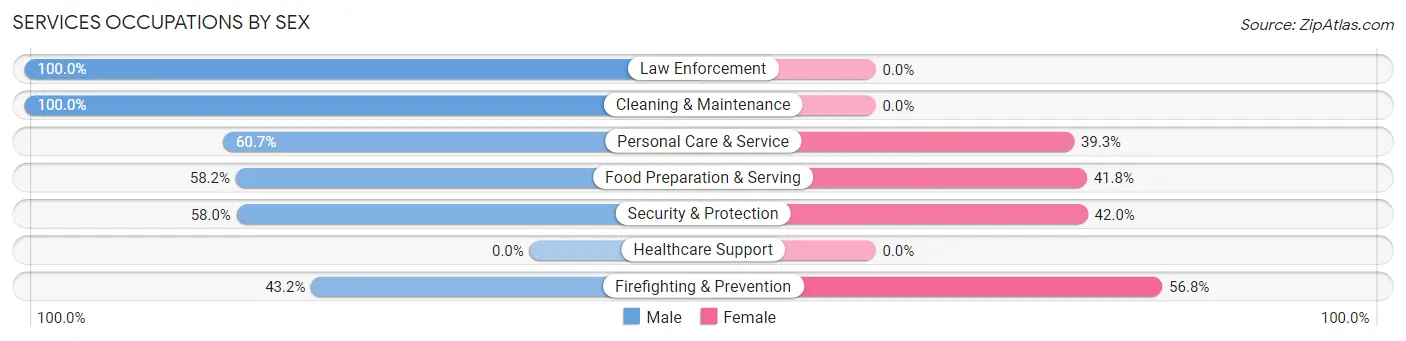
Services Occupations by Sex
Within the Services occupations in Williamstown, the most male-oriented occupations are Law Enforcement (100.0%), Cleaning & Maintenance (100.0%), and Personal Care & Service (60.7%), while the most female-oriented occupations are Firefighting & Prevention (56.8%), Security & Protection (42.0%), and Food Preparation & Serving (41.8%).
| Occupation | Male | Female |
| Healthcare Support | 0 (0.0%) | 0 (0.0%) |
| Security & Protection | 29 (58.0%) | 21 (42.0%) |
| Firefighting & Prevention | 16 (43.2%) | 21 (56.8%) |
| Law Enforcement | 13 (100.0%) | 0 (0.0%) |
| Food Preparation & Serving | 64 (58.2%) | 46 (41.8%) |
| Cleaning & Maintenance | 9 (100.0%) | 0 (0.0%) |
| Personal Care & Service | 17 (60.7%) | 11 (39.3%) |
| Total (Category) | 119 (60.4%) | 78 (39.6%) |
| Total (Overall) | 887 (50.9%) | 854 (49.0%) |
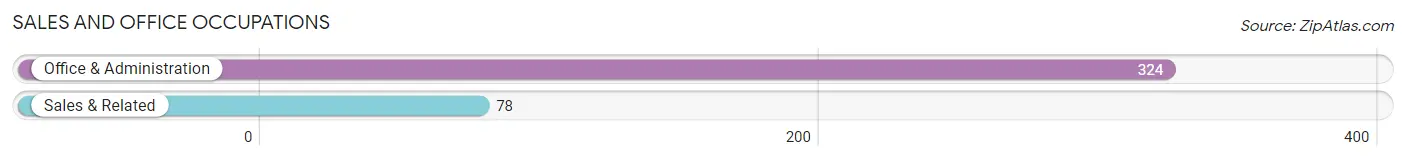
Sales and Office Occupations
The most common Sales and Office occupations in Williamstown are Office & Administration (324 | 18.6%), and Sales & Related (78 | 4.5%).
Sales and Office Occupations by Sex
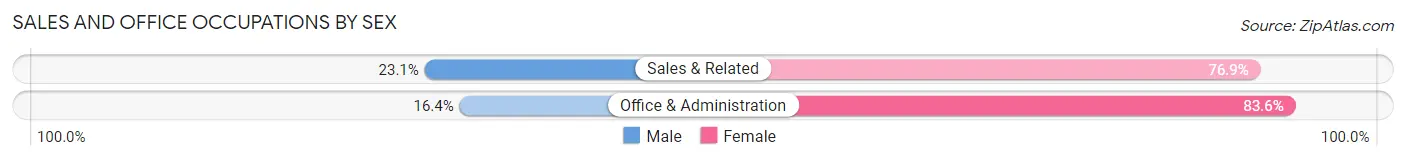
| Occupation | Male | Female |
| Sales & Related | 18 (23.1%) | 60 (76.9%) |
| Office & Administration | 53 (16.4%) | 271 (83.6%) |
| Total (Category) | 71 (17.7%) | 331 (82.3%) |
| Total (Overall) | 887 (50.9%) | 854 (49.0%) |
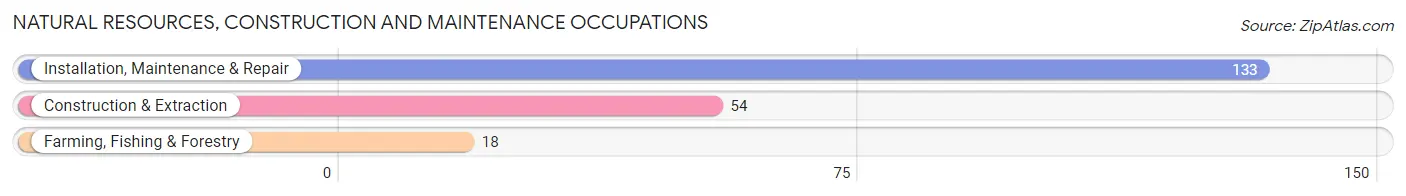
Natural Resources, Construction and Maintenance Occupations
The most common Natural Resources, Construction and Maintenance occupations in Williamstown are Installation, Maintenance & Repair (133 | 7.6%), Construction & Extraction (54 | 3.1%), and Farming, Fishing & Forestry (18 | 1.0%).
Natural Resources, Construction and Maintenance Occupations by Sex
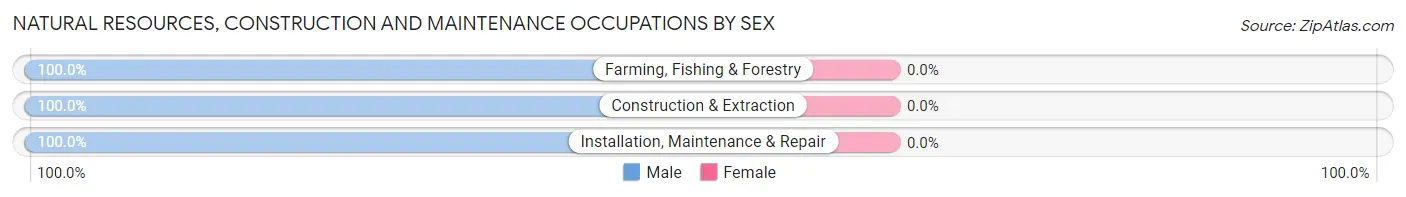
| Occupation | Male | Female |
| Farming, Fishing & Forestry | 18 (100.0%) | 0 (0.0%) |
| Construction & Extraction | 54 (100.0%) | 0 (0.0%) |
| Installation, Maintenance & Repair | 133 (100.0%) | 0 (0.0%) |
| Total (Category) | 205 (100.0%) | 0 (0.0%) |
| Total (Overall) | 887 (50.9%) | 854 (49.0%) |
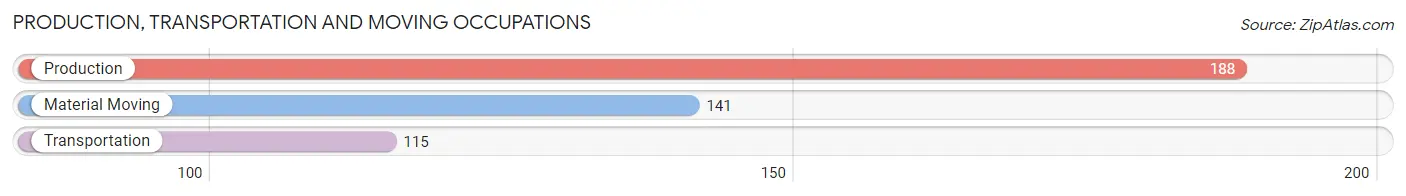
Production, Transportation and Moving Occupations
The most common Production, Transportation and Moving occupations in Williamstown are Production (188 | 10.8%), Material Moving (141 | 8.1%), and Transportation (115 | 6.6%).
Production, Transportation and Moving Occupations by Sex
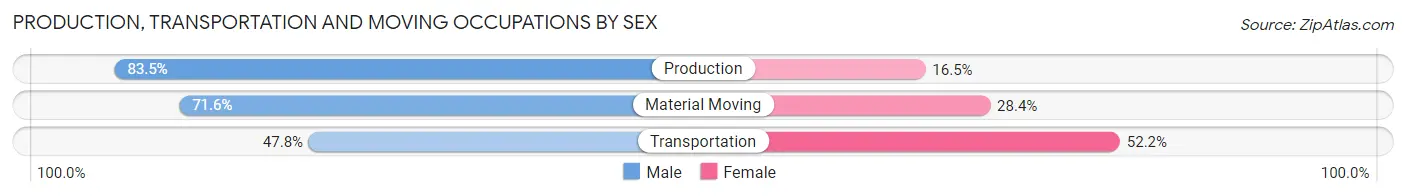
| Occupation | Male | Female |
| Production | 157 (83.5%) | 31 (16.5%) |
| Transportation | 55 (47.8%) | 60 (52.2%) |
| Material Moving | 101 (71.6%) | 40 (28.4%) |
| Total (Category) | 313 (70.5%) | 131 (29.5%) |
| Total (Overall) | 887 (50.9%) | 854 (49.0%) |
Employment Industries by Sex in Williamstown
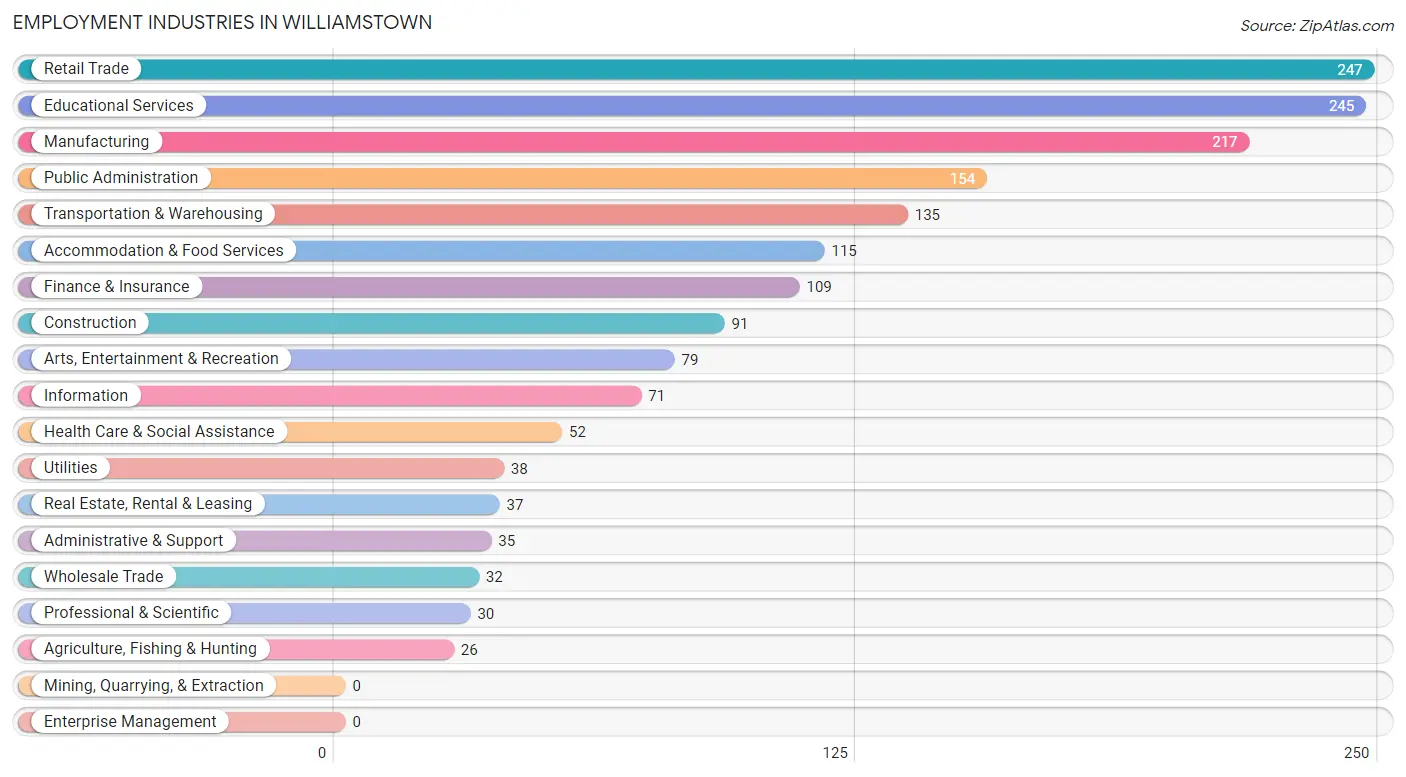
Employment Industries in Williamstown
The major employment industries in Williamstown include Retail Trade (247 | 14.2%), Educational Services (245 | 14.1%), Manufacturing (217 | 12.5%), Public Administration (154 | 8.8%), and Transportation & Warehousing (135 | 7.7%).
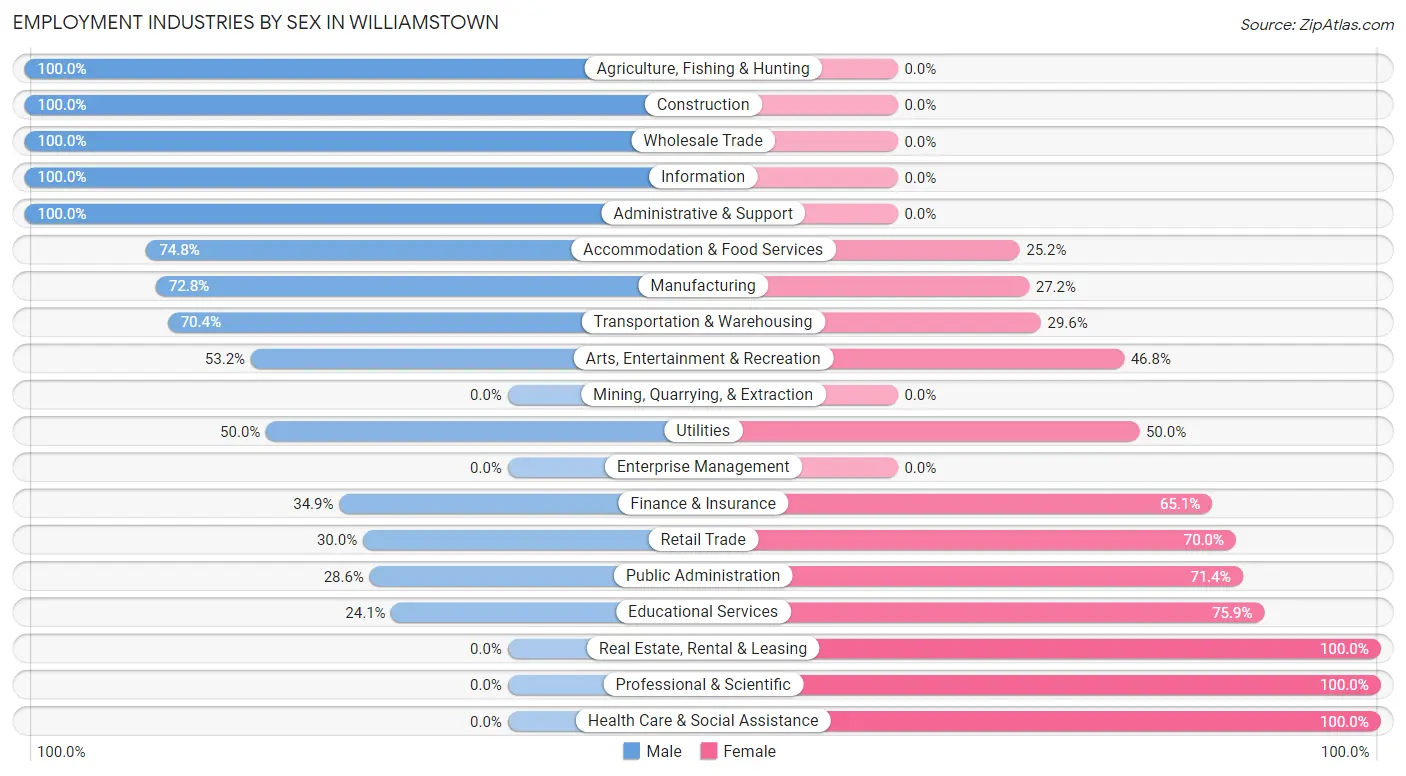
Employment Industries by Sex in Williamstown
The Williamstown industries that see more men than women are Agriculture, Fishing & Hunting (100.0%), Construction (100.0%), and Wholesale Trade (100.0%), whereas the industries that tend to have a higher number of women are Real Estate, Rental & Leasing (100.0%), Professional & Scientific (100.0%), and Health Care & Social Assistance (100.0%).
| Industry | Male | Female |
| Agriculture, Fishing & Hunting | 26 (100.0%) | 0 (0.0%) |
| Mining, Quarrying, & Extraction | 0 (0.0%) | 0 (0.0%) |
| Construction | 91 (100.0%) | 0 (0.0%) |
| Manufacturing | 158 (72.8%) | 59 (27.2%) |
| Wholesale Trade | 32 (100.0%) | 0 (0.0%) |
| Retail Trade | 74 (30.0%) | 173 (70.0%) |
| Transportation & Warehousing | 95 (70.4%) | 40 (29.6%) |
| Utilities | 19 (50.0%) | 19 (50.0%) |
| Information | 71 (100.0%) | 0 (0.0%) |
| Finance & Insurance | 38 (34.9%) | 71 (65.1%) |
| Real Estate, Rental & Leasing | 0 (0.0%) | 37 (100.0%) |
| Professional & Scientific | 0 (0.0%) | 30 (100.0%) |
| Enterprise Management | 0 (0.0%) | 0 (0.0%) |
| Administrative & Support | 35 (100.0%) | 0 (0.0%) |
| Educational Services | 59 (24.1%) | 186 (75.9%) |
| Health Care & Social Assistance | 0 (0.0%) | 52 (100.0%) |
| Arts, Entertainment & Recreation | 42 (53.2%) | 37 (46.8%) |
| Accommodation & Food Services | 86 (74.8%) | 29 (25.2%) |
| Public Administration | 44 (28.6%) | 110 (71.4%) |
| Total | 887 (50.9%) | 854 (49.0%) |
Education in Williamstown
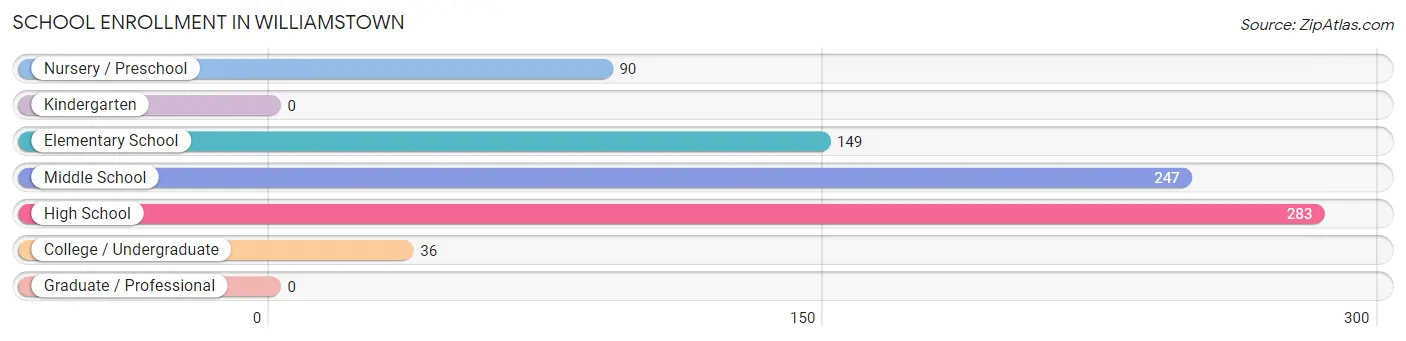
School Enrollment in Williamstown
The most common levels of schooling among the 805 students in Williamstown are high school (283 | 35.2%), middle school (247 | 30.7%), and elementary school (149 | 18.5%).
| School Level | # Students | % Students |
| Nursery / Preschool | 90 | 11.2% |
| Kindergarten | 0 | 0.0% |
| Elementary School | 149 | 18.5% |
| Middle School | 247 | 30.7% |
| High School | 283 | 35.2% |
| College / Undergraduate | 36 | 4.5% |
| Graduate / Professional | 0 | 0.0% |
| Total | 805 | 100.0% |
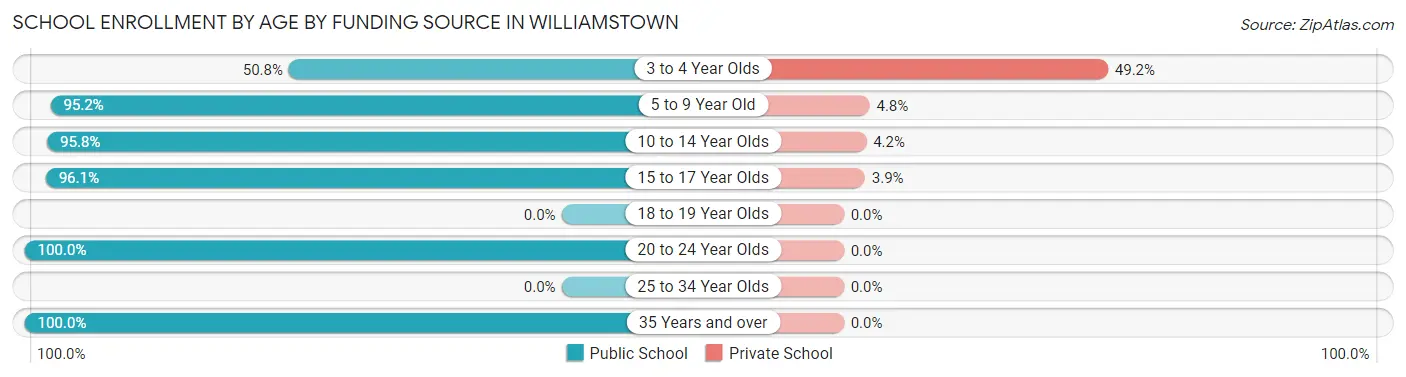
School Enrollment by Age by Funding Source in Williamstown
Out of a total of 805 students who are enrolled in schools in Williamstown, 61 (7.6%) attend a private institution, while the remaining 744 (92.4%) are enrolled in public schools. The age group of 3 to 4 year olds has the highest likelihood of being enrolled in private schools, with 31 (49.2% in the age bracket) enrolled. Conversely, the age group of 20 to 24 year olds has the lowest likelihood of being enrolled in a private school, with 26 (100.0% in the age bracket) attending a public institution.
| Age Bracket | Public School | Private School |
| 3 to 4 Year Olds | 32 (50.8%) | 31 (49.2%) |
| 5 to 9 Year Old | 158 (95.2%) | 8 (4.8%) |
| 10 to 14 Year Olds | 274 (95.8%) | 12 (4.2%) |
| 15 to 17 Year Olds | 244 (96.1%) | 10 (3.9%) |
| 18 to 19 Year Olds | 0 (0.0%) | 0 (0.0%) |
| 20 to 24 Year Olds | 26 (100.0%) | 0 (0.0%) |
| 25 to 34 Year Olds | 0 (0.0%) | 0 (0.0%) |
| 35 Years and over | 10 (100.0%) | 0 (0.0%) |
| Total | 744 (92.4%) | 61 (7.6%) |
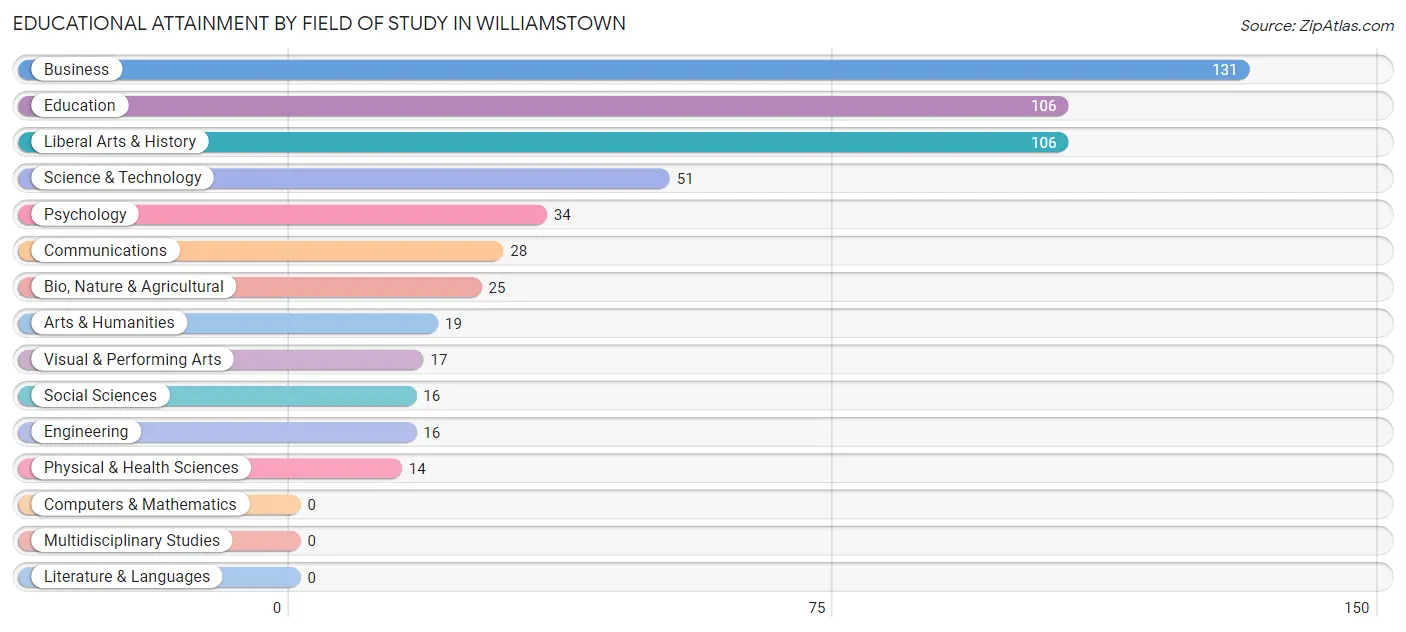
Educational Attainment by Field of Study in Williamstown
Business (131 | 23.3%), education (106 | 18.8%), liberal arts & history (106 | 18.8%), science & technology (51 | 9.1%), and psychology (34 | 6.0%) are the most common fields of study among 563 individuals in Williamstown who have obtained a bachelor's degree or higher.
| Field of Study | # Graduates | % Graduates |
| Computers & Mathematics | 0 | 0.0% |
| Bio, Nature & Agricultural | 25 | 4.4% |
| Physical & Health Sciences | 14 | 2.5% |
| Psychology | 34 | 6.0% |
| Social Sciences | 16 | 2.8% |
| Engineering | 16 | 2.8% |
| Multidisciplinary Studies | 0 | 0.0% |
| Science & Technology | 51 | 9.1% |
| Business | 131 | 23.3% |
| Education | 106 | 18.8% |
| Literature & Languages | 0 | 0.0% |
| Liberal Arts & History | 106 | 18.8% |
| Visual & Performing Arts | 17 | 3.0% |
| Communications | 28 | 5.0% |
| Arts & Humanities | 19 | 3.4% |
| Total | 563 | 100.0% |
Transportation & Commute in Williamstown
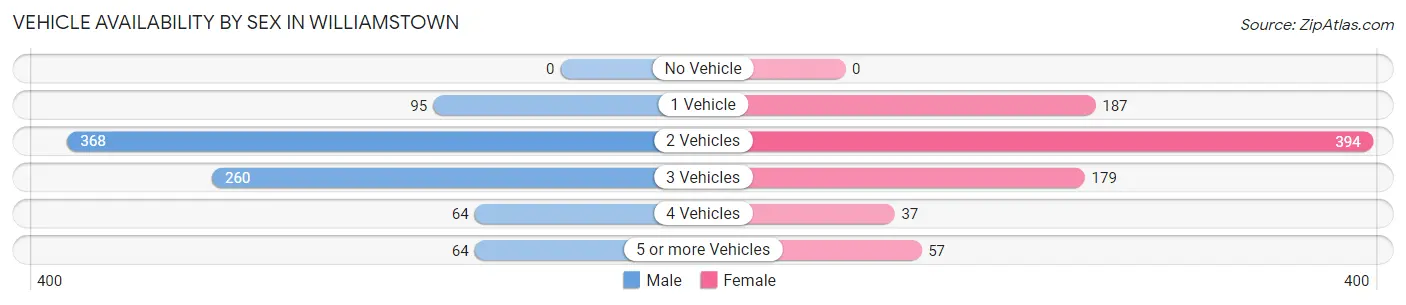
Vehicle Availability by Sex in Williamstown
The most prevalent vehicle ownership categories in Williamstown are males with 2 vehicles (368, accounting for 43.2%) and females with 2 vehicles (394, making up 43.1%).
| Vehicles Available | Male | Female |
| No Vehicle | 0 (0.0%) | 0 (0.0%) |
| 1 Vehicle | 95 (11.2%) | 187 (21.9%) |
| 2 Vehicles | 368 (43.2%) | 394 (46.1%) |
| 3 Vehicles | 260 (30.5%) | 179 (21.0%) |
| 4 Vehicles | 64 (7.5%) | 37 (4.3%) |
| 5 or more Vehicles | 64 (7.5%) | 57 (6.7%) |
| Total | 851 (100.0%) | 854 (100.0%) |
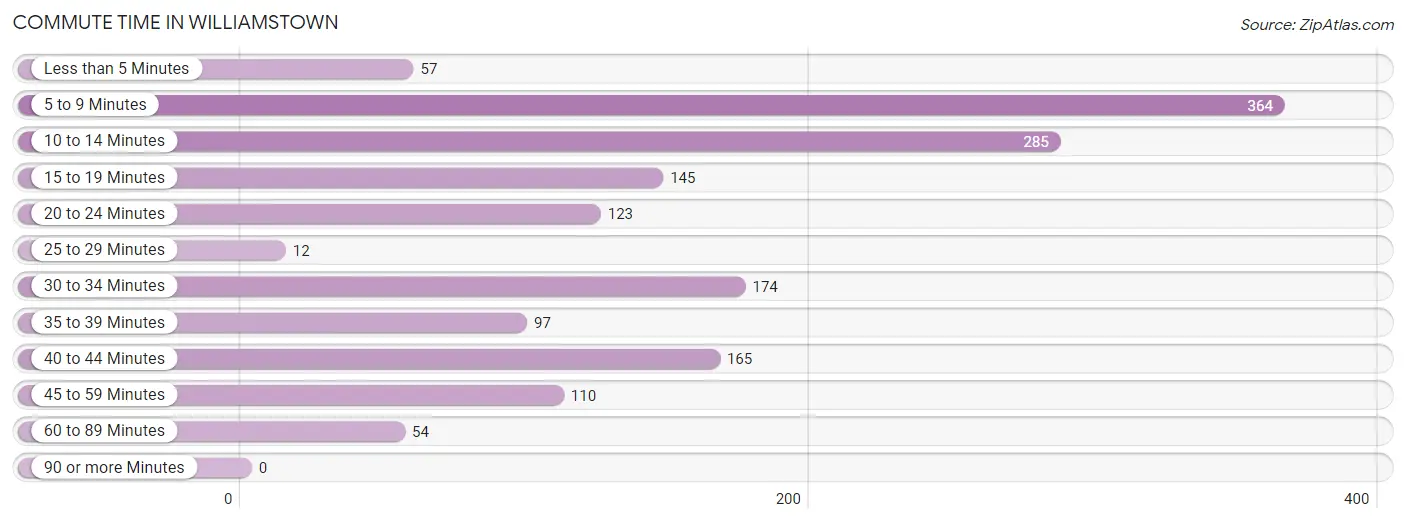
Commute Time in Williamstown
The most frequently occuring commute durations in Williamstown are 5 to 9 minutes (364 commuters, 23.0%), 10 to 14 minutes (285 commuters, 18.0%), and 30 to 34 minutes (174 commuters, 11.0%).
| Commute Time | # Commuters | % Commuters |
| Less than 5 Minutes | 57 | 3.6% |
| 5 to 9 Minutes | 364 | 23.0% |
| 10 to 14 Minutes | 285 | 18.0% |
| 15 to 19 Minutes | 145 | 9.1% |
| 20 to 24 Minutes | 123 | 7.8% |
| 25 to 29 Minutes | 12 | 0.8% |
| 30 to 34 Minutes | 174 | 11.0% |
| 35 to 39 Minutes | 97 | 6.1% |
| 40 to 44 Minutes | 165 | 10.4% |
| 45 to 59 Minutes | 110 | 6.9% |
| 60 to 89 Minutes | 54 | 3.4% |
| 90 or more Minutes | 0 | 0.0% |
Commute Time by Sex in Williamstown
The most common commute times in Williamstown are 40 to 44 minutes (135 commuters, 17.6%) for males and 5 to 9 minutes (255 commuters, 31.1%) for females.
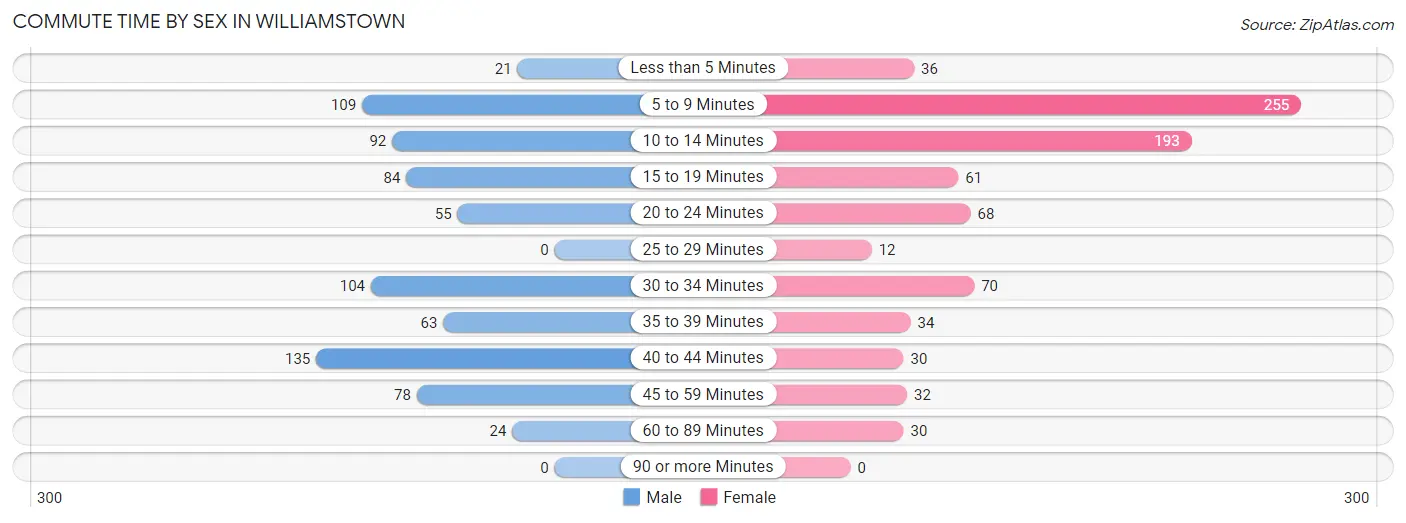
| Commute Time | Male | Female |
| Less than 5 Minutes | 21 (2.8%) | 36 (4.4%) |
| 5 to 9 Minutes | 109 (14.2%) | 255 (31.1%) |
| 10 to 14 Minutes | 92 (12.0%) | 193 (23.5%) |
| 15 to 19 Minutes | 84 (11.0%) | 61 (7.4%) |
| 20 to 24 Minutes | 55 (7.2%) | 68 (8.3%) |
| 25 to 29 Minutes | 0 (0.0%) | 12 (1.5%) |
| 30 to 34 Minutes | 104 (13.6%) | 70 (8.5%) |
| 35 to 39 Minutes | 63 (8.2%) | 34 (4.1%) |
| 40 to 44 Minutes | 135 (17.6%) | 30 (3.6%) |
| 45 to 59 Minutes | 78 (10.2%) | 32 (3.9%) |
| 60 to 89 Minutes | 24 (3.1%) | 30 (3.6%) |
| 90 or more Minutes | 0 (0.0%) | 0 (0.0%) |
Time of Departure to Work by Sex in Williamstown
The most frequent times of departure to work in Williamstown are 7:30 AM to 7:59 AM (236, 30.8%) for males and 7:30 AM to 7:59 AM (230, 28.0%) for females.
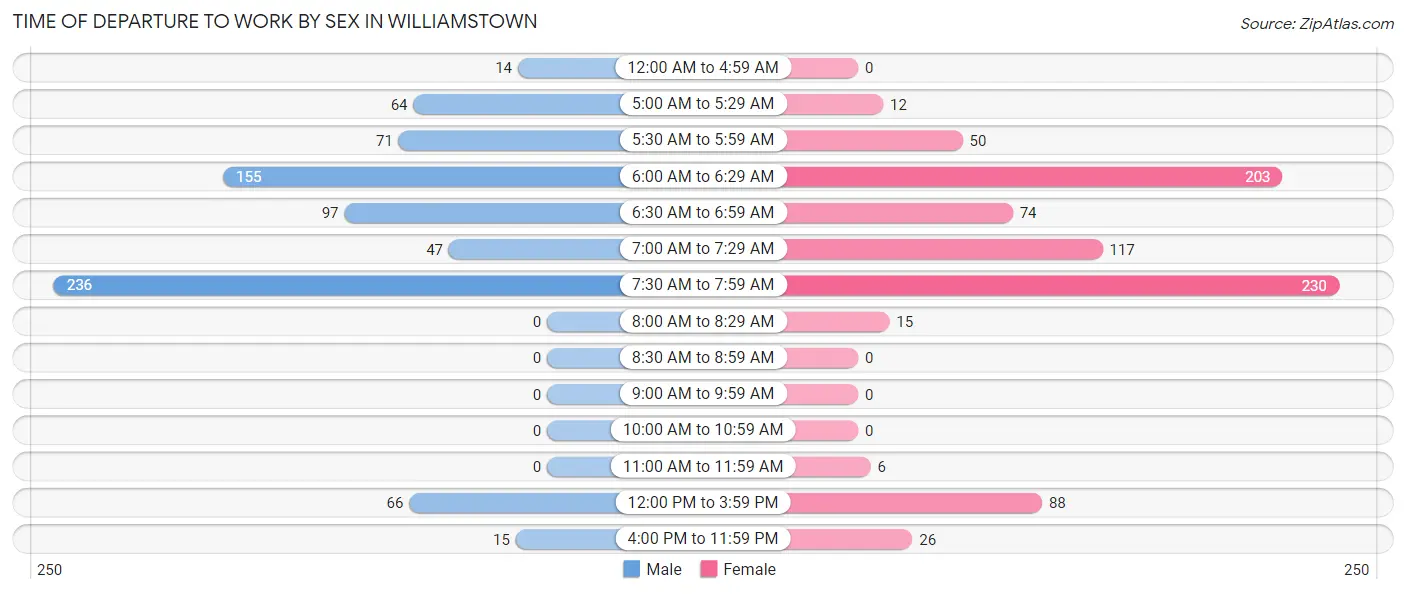
| Time of Departure | Male | Female |
| 12:00 AM to 4:59 AM | 14 (1.8%) | 0 (0.0%) |
| 5:00 AM to 5:29 AM | 64 (8.4%) | 12 (1.5%) |
| 5:30 AM to 5:59 AM | 71 (9.3%) | 50 (6.1%) |
| 6:00 AM to 6:29 AM | 155 (20.3%) | 203 (24.7%) |
| 6:30 AM to 6:59 AM | 97 (12.7%) | 74 (9.0%) |
| 7:00 AM to 7:29 AM | 47 (6.1%) | 117 (14.2%) |
| 7:30 AM to 7:59 AM | 236 (30.8%) | 230 (28.0%) |
| 8:00 AM to 8:29 AM | 0 (0.0%) | 15 (1.8%) |
| 8:30 AM to 8:59 AM | 0 (0.0%) | 0 (0.0%) |
| 9:00 AM to 9:59 AM | 0 (0.0%) | 0 (0.0%) |
| 10:00 AM to 10:59 AM | 0 (0.0%) | 0 (0.0%) |
| 11:00 AM to 11:59 AM | 0 (0.0%) | 6 (0.7%) |
| 12:00 PM to 3:59 PM | 66 (8.6%) | 88 (10.7%) |
| 4:00 PM to 11:59 PM | 15 (2.0%) | 26 (3.2%) |
| Total | 765 (100.0%) | 821 (100.0%) |
Housing Occupancy in Williamstown
Occupancy by Ownership in Williamstown
Of the total 1,378 dwellings in Williamstown, owner-occupied units account for 911 (66.1%), while renter-occupied units make up 467 (33.9%).
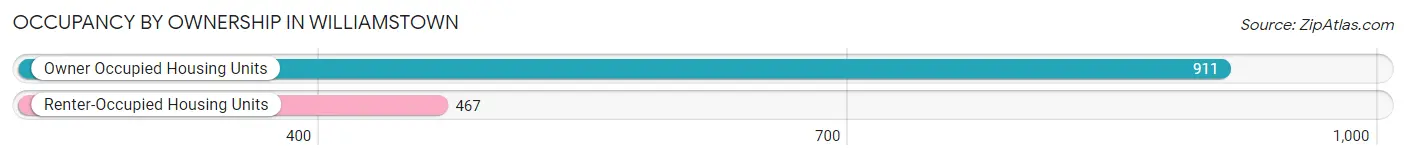
| Occupancy | # Housing Units | % Housing Units |
| Owner Occupied Housing Units | 911 | 66.1% |
| Renter-Occupied Housing Units | 467 | 33.9% |
| Total Occupied Housing Units | 1,378 | 100.0% |
Occupancy by Household Size in Williamstown
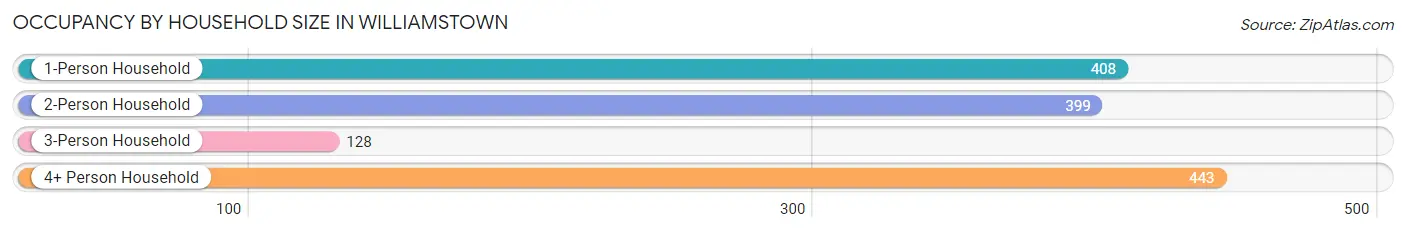
| Household Size | # Housing Units | % Housing Units |
| 1-Person Household | 408 | 29.6% |
| 2-Person Household | 399 | 29.0% |
| 3-Person Household | 128 | 9.3% |
| 4+ Person Household | 443 | 32.2% |
| Total Housing Units | 1,378 | 100.0% |
Occupancy by Ownership by Household Size in Williamstown
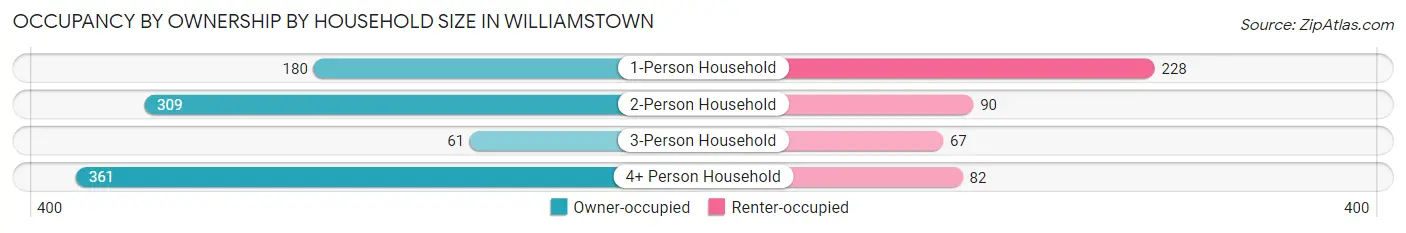
| Household Size | Owner-occupied | Renter-occupied |
| 1-Person Household | 180 (44.1%) | 228 (55.9%) |
| 2-Person Household | 309 (77.4%) | 90 (22.6%) |
| 3-Person Household | 61 (47.7%) | 67 (52.3%) |
| 4+ Person Household | 361 (81.5%) | 82 (18.5%) |
| Total Housing Units | 911 (66.1%) | 467 (33.9%) |
Occupancy by Educational Attainment in Williamstown
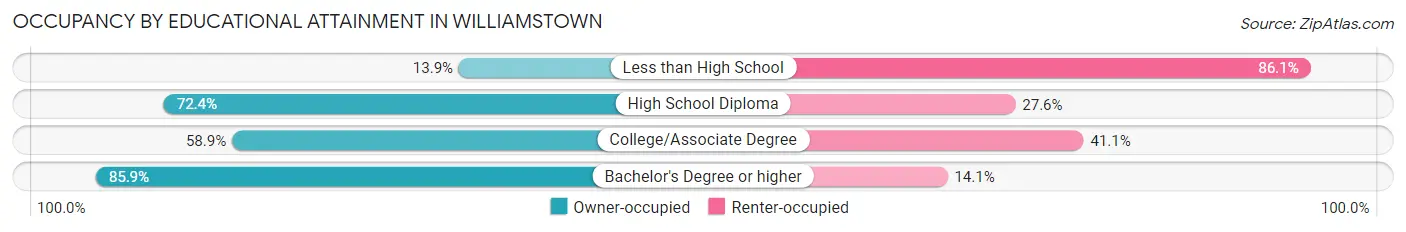
| Household Size | Owner-occupied | Renter-occupied |
| Less than High School | 10 (13.9%) | 62 (86.1%) |
| High School Diploma | 278 (72.4%) | 106 (27.6%) |
| College/Associate Degree | 368 (58.9%) | 257 (41.1%) |
| Bachelor's Degree or higher | 255 (85.9%) | 42 (14.1%) |
Occupancy by Age of Householder in Williamstown
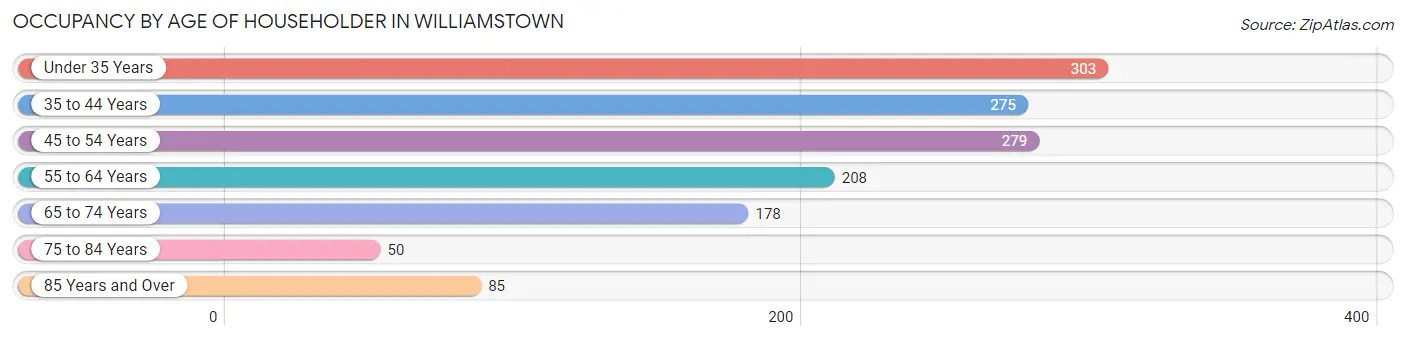
| Age Bracket | # Households | % Households |
| Under 35 Years | 303 | 22.0% |
| 35 to 44 Years | 275 | 20.0% |
| 45 to 54 Years | 279 | 20.3% |
| 55 to 64 Years | 208 | 15.1% |
| 65 to 74 Years | 178 | 12.9% |
| 75 to 84 Years | 50 | 3.6% |
| 85 Years and Over | 85 | 6.2% |
| Total | 1,378 | 100.0% |
Housing Finances in Williamstown
Median Income by Occupancy in Williamstown
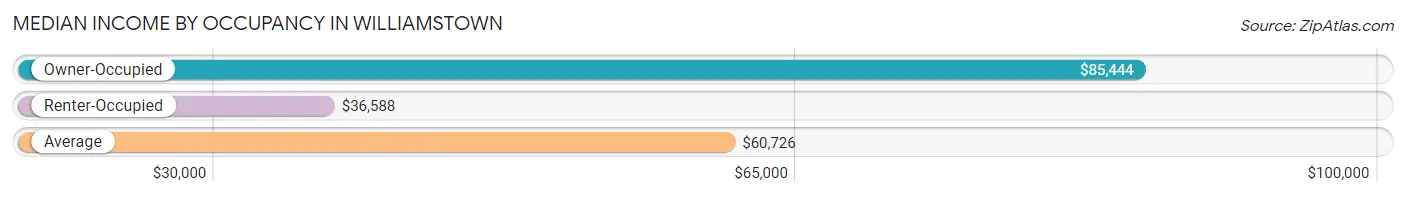
| Occupancy Type | # Households | Median Income |
| Owner-Occupied | 911 (66.1%) | $85,444 |
| Renter-Occupied | 467 (33.9%) | $36,588 |
| Average | 1,378 (100.0%) | $60,726 |
Occupancy by Householder Income Bracket in Williamstown
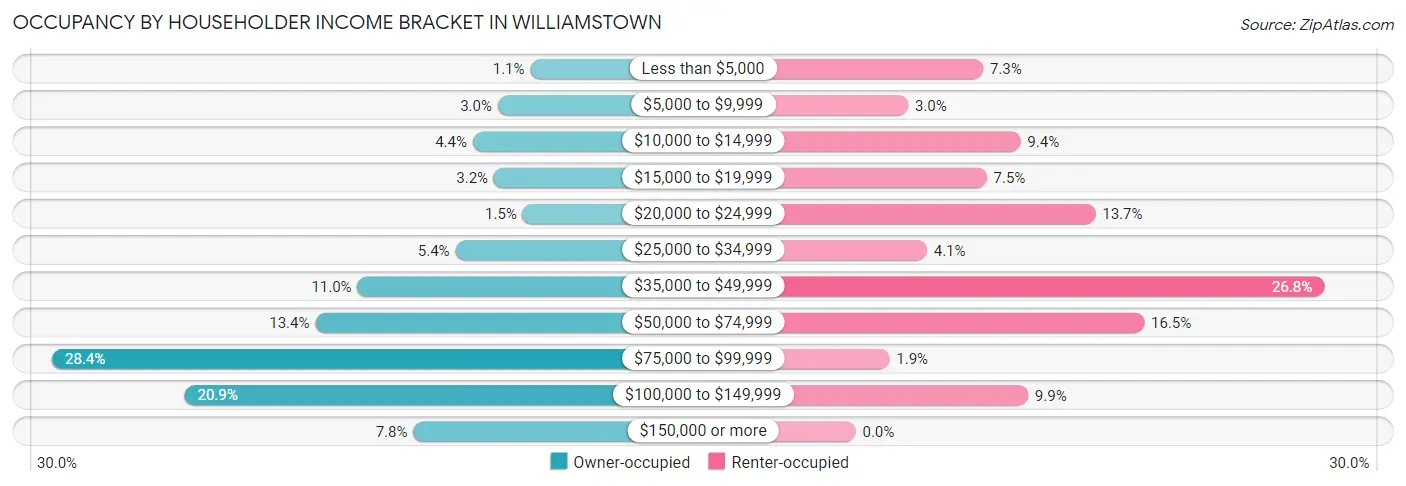
| Income Bracket | Owner-occupied | Renter-occupied |
| Less than $5,000 | 10 (1.1%) | 34 (7.3%) |
| $5,000 to $9,999 | 27 (3.0%) | 14 (3.0%) |
| $10,000 to $14,999 | 40 (4.4%) | 44 (9.4%) |
| $15,000 to $19,999 | 29 (3.2%) | 35 (7.5%) |
| $20,000 to $24,999 | 14 (1.5%) | 64 (13.7%) |
| $25,000 to $34,999 | 49 (5.4%) | 19 (4.1%) |
| $35,000 to $49,999 | 100 (11.0%) | 125 (26.8%) |
| $50,000 to $74,999 | 122 (13.4%) | 77 (16.5%) |
| $75,000 to $99,999 | 259 (28.4%) | 9 (1.9%) |
| $100,000 to $149,999 | 190 (20.9%) | 46 (9.9%) |
| $150,000 or more | 71 (7.8%) | 0 (0.0%) |
| Total | 911 (100.0%) | 467 (100.0%) |
Monthly Housing Cost Tiers in Williamstown
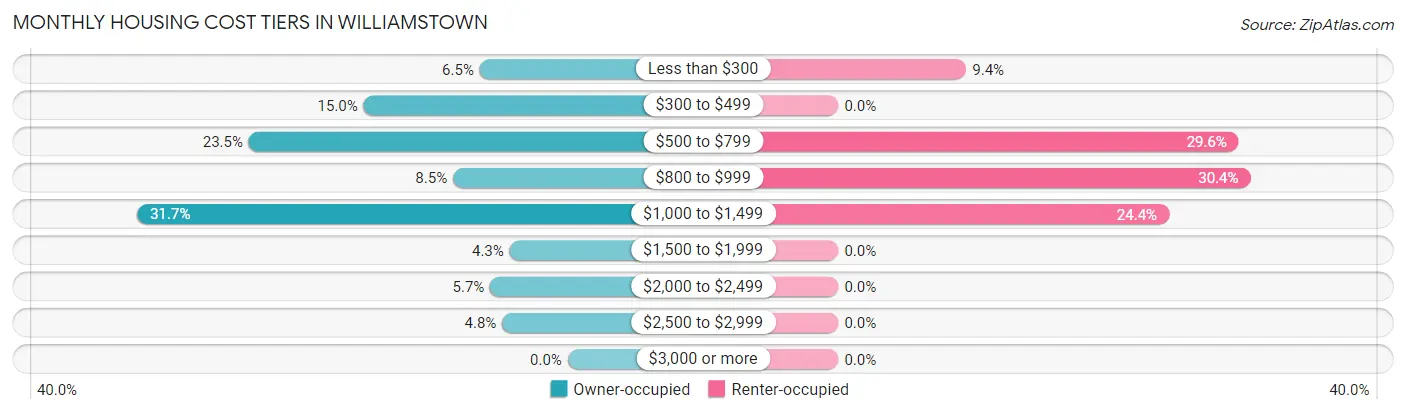
| Monthly Cost | Owner-occupied | Renter-occupied |
| Less than $300 | 59 (6.5%) | 44 (9.4%) |
| $300 to $499 | 137 (15.0%) | 0 (0.0%) |
| $500 to $799 | 214 (23.5%) | 138 (29.5%) |
| $800 to $999 | 77 (8.5%) | 142 (30.4%) |
| $1,000 to $1,499 | 289 (31.7%) | 114 (24.4%) |
| $1,500 to $1,999 | 39 (4.3%) | 0 (0.0%) |
| $2,000 to $2,499 | 52 (5.7%) | 0 (0.0%) |
| $2,500 to $2,999 | 44 (4.8%) | 0 (0.0%) |
| $3,000 or more | 0 (0.0%) | 0 (0.0%) |
| Total | 911 (100.0%) | 467 (100.0%) |
Physical Housing Characteristics in Williamstown
Housing Structures in Williamstown
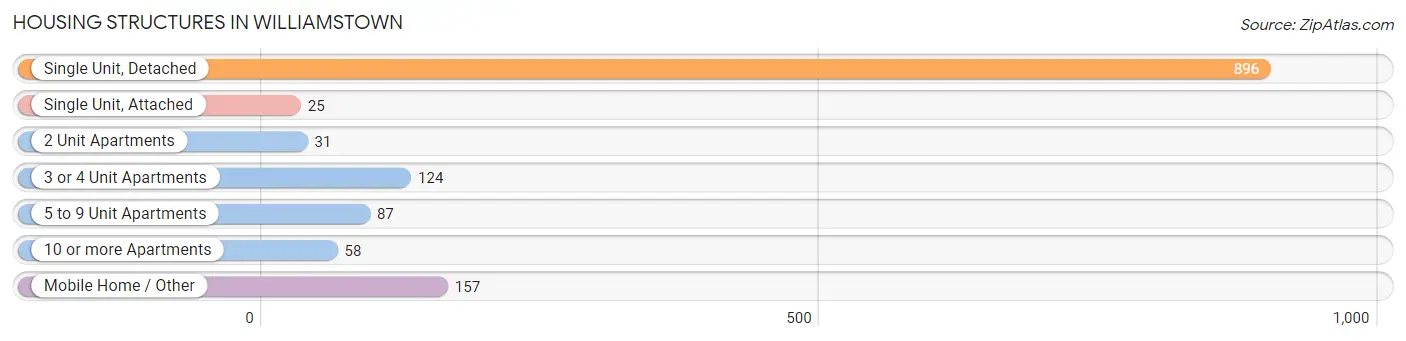
| Structure Type | # Housing Units | % Housing Units |
| Single Unit, Detached | 896 | 65.0% |
| Single Unit, Attached | 25 | 1.8% |
| 2 Unit Apartments | 31 | 2.2% |
| 3 or 4 Unit Apartments | 124 | 9.0% |
| 5 to 9 Unit Apartments | 87 | 6.3% |
| 10 or more Apartments | 58 | 4.2% |
| Mobile Home / Other | 157 | 11.4% |
| Total | 1,378 | 100.0% |
Housing Structures by Occupancy in Williamstown
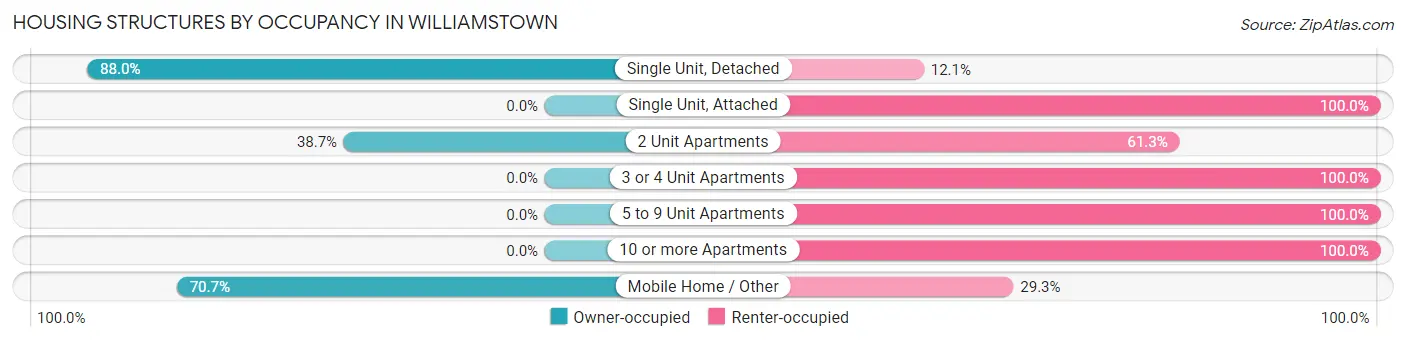
| Structure Type | Owner-occupied | Renter-occupied |
| Single Unit, Detached | 788 (87.9%) | 108 (12.0%) |
| Single Unit, Attached | 0 (0.0%) | 25 (100.0%) |
| 2 Unit Apartments | 12 (38.7%) | 19 (61.3%) |
| 3 or 4 Unit Apartments | 0 (0.0%) | 124 (100.0%) |
| 5 to 9 Unit Apartments | 0 (0.0%) | 87 (100.0%) |
| 10 or more Apartments | 0 (0.0%) | 58 (100.0%) |
| Mobile Home / Other | 111 (70.7%) | 46 (29.3%) |
| Total | 911 (66.1%) | 467 (33.9%) |
Housing Structures by Number of Rooms in Williamstown
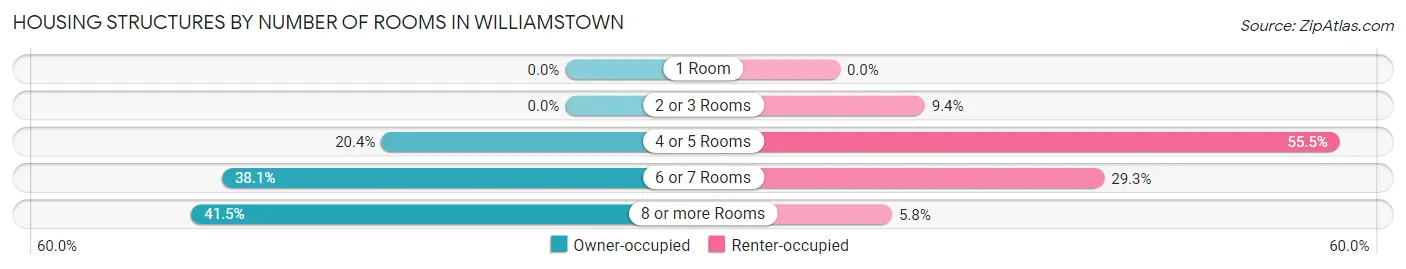
| Number of Rooms | Owner-occupied | Renter-occupied |
| 1 Room | 0 (0.0%) | 0 (0.0%) |
| 2 or 3 Rooms | 0 (0.0%) | 44 (9.4%) |
| 4 or 5 Rooms | 186 (20.4%) | 259 (55.5%) |
| 6 or 7 Rooms | 347 (38.1%) | 137 (29.3%) |
| 8 or more Rooms | 378 (41.5%) | 27 (5.8%) |
| Total | 911 (100.0%) | 467 (100.0%) |
Housing Structure by Heating Type in Williamstown
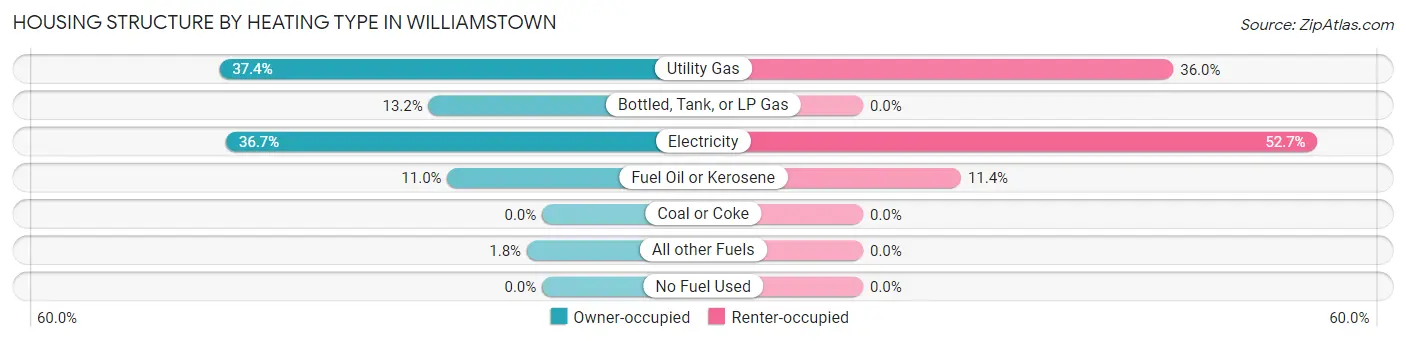
| Heating Type | Owner-occupied | Renter-occupied |
| Utility Gas | 341 (37.4%) | 168 (36.0%) |
| Bottled, Tank, or LP Gas | 120 (13.2%) | 0 (0.0%) |
| Electricity | 334 (36.7%) | 246 (52.7%) |
| Fuel Oil or Kerosene | 100 (11.0%) | 53 (11.4%) |
| Coal or Coke | 0 (0.0%) | 0 (0.0%) |
| All other Fuels | 16 (1.8%) | 0 (0.0%) |
| No Fuel Used | 0 (0.0%) | 0 (0.0%) |
| Total | 911 (100.0%) | 467 (100.0%) |
Household Vehicle Usage in Williamstown
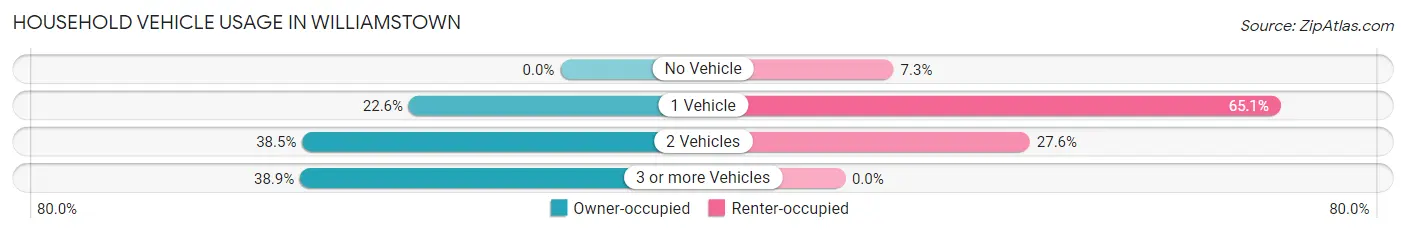
| Vehicles per Household | Owner-occupied | Renter-occupied |
| No Vehicle | 0 (0.0%) | 34 (7.3%) |
| 1 Vehicle | 206 (22.6%) | 304 (65.1%) |
| 2 Vehicles | 351 (38.5%) | 129 (27.6%) |
| 3 or more Vehicles | 354 (38.9%) | 0 (0.0%) |
| Total | 911 (100.0%) | 467 (100.0%) |
Real Estate & Mortgages in Williamstown
Real Estate and Mortgage Overview in Williamstown
| Characteristic | Without Mortgage | With Mortgage |
| Housing Units | 419 | 492 |
| Median Property Value | $155,300 | $155,900 |
| Median Household Income | $45,972 | $61 |
| Monthly Housing Costs | $512 | $0 |
| Real Estate Taxes | $1,454 | $0 |
Property Value by Mortgage Status in Williamstown
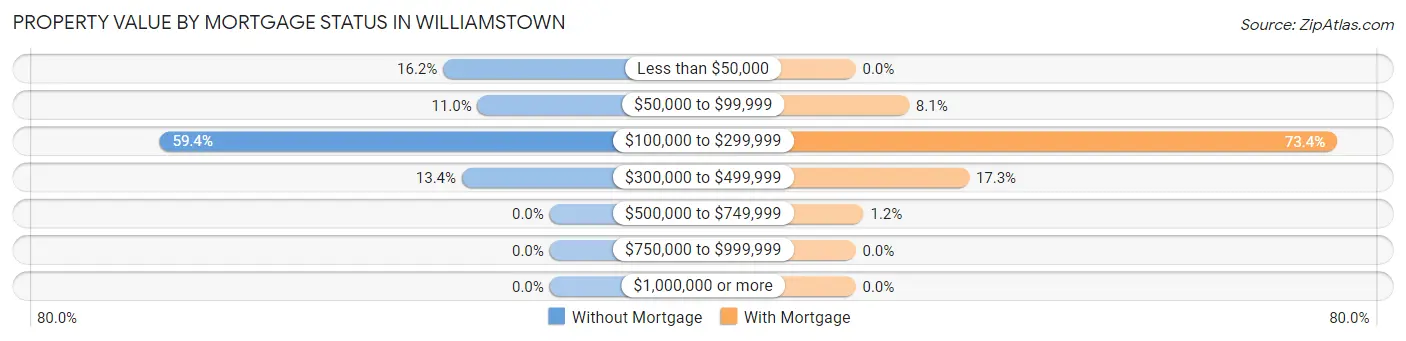
| Property Value | Without Mortgage | With Mortgage |
| Less than $50,000 | 68 (16.2%) | 0 (0.0%) |
| $50,000 to $99,999 | 46 (11.0%) | 40 (8.1%) |
| $100,000 to $299,999 | 249 (59.4%) | 361 (73.4%) |
| $300,000 to $499,999 | 56 (13.4%) | 85 (17.3%) |
| $500,000 to $749,999 | 0 (0.0%) | 6 (1.2%) |
| $750,000 to $999,999 | 0 (0.0%) | 0 (0.0%) |
| $1,000,000 or more | 0 (0.0%) | 0 (0.0%) |
| Total | 419 (100.0%) | 492 (100.0%) |
Household Income by Mortgage Status in Williamstown
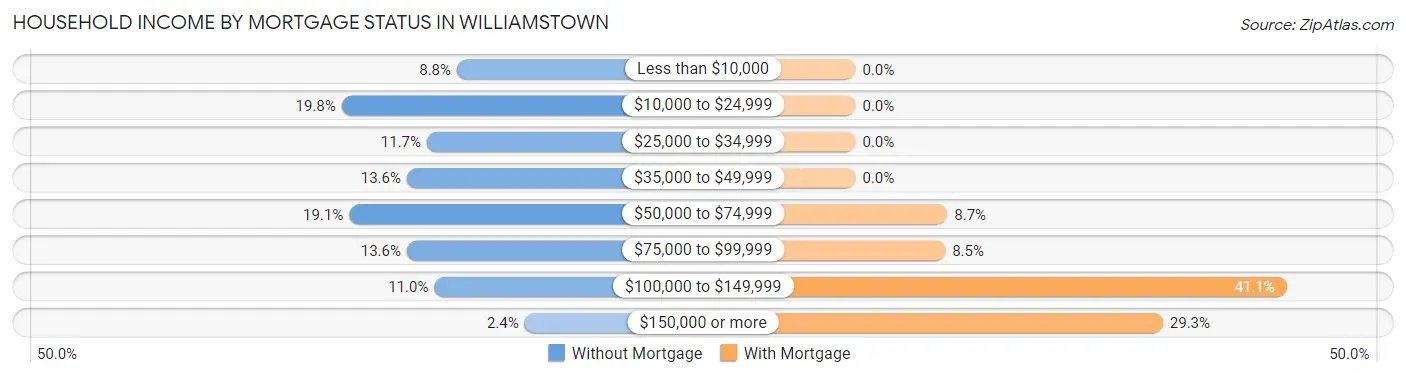
| Household Income | Without Mortgage | With Mortgage |
| Less than $10,000 | 37 (8.8%) | 0 (0.0%) |
| $10,000 to $24,999 | 83 (19.8%) | 0 (0.0%) |
| $25,000 to $34,999 | 49 (11.7%) | 0 (0.0%) |
| $35,000 to $49,999 | 57 (13.6%) | 0 (0.0%) |
| $50,000 to $74,999 | 80 (19.1%) | 43 (8.7%) |
| $75,000 to $99,999 | 57 (13.6%) | 42 (8.5%) |
| $100,000 to $149,999 | 46 (11.0%) | 202 (41.1%) |
| $150,000 or more | 10 (2.4%) | 144 (29.3%) |
| Total | 419 (100.0%) | 492 (100.0%) |
Property Value to Household Income Ratio in Williamstown
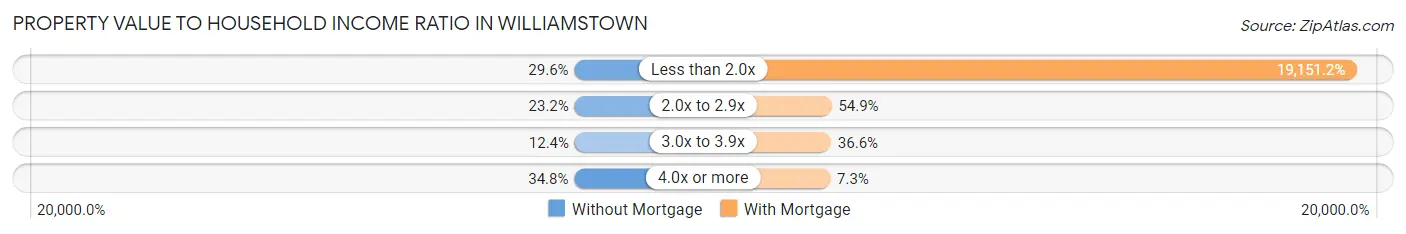
| Value-to-Income Ratio | Without Mortgage | With Mortgage |
| Less than 2.0x | 124 (29.6%) | 94,224 (19,151.2%) |
| 2.0x to 2.9x | 97 (23.2%) | 270 (54.9%) |
| 3.0x to 3.9x | 52 (12.4%) | 180 (36.6%) |
| 4.0x or more | 146 (34.8%) | 36 (7.3%) |
| Total | 419 (100.0%) | 492 (100.0%) |
Real Estate Taxes by Mortgage Status in Williamstown
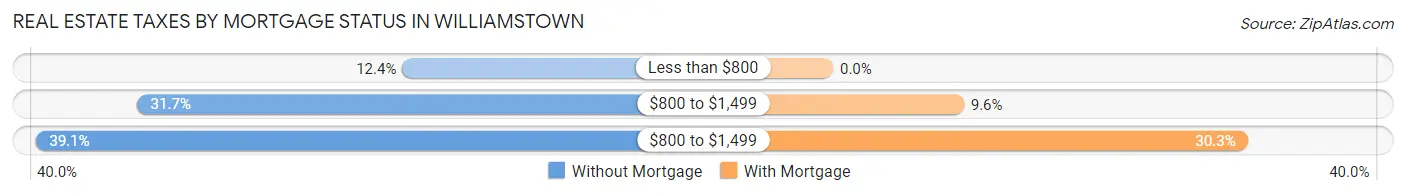
| Property Taxes | Without Mortgage | With Mortgage |
| Less than $800 | 52 (12.4%) | 0 (0.0%) |
| $800 to $1,499 | 133 (31.7%) | 47 (9.6%) |
| $800 to $1,499 | 164 (39.1%) | 149 (30.3%) |
| Total | 419 (100.0%) | 492 (100.0%) |
Health & Disability in Williamstown
Health Insurance Coverage by Age in Williamstown
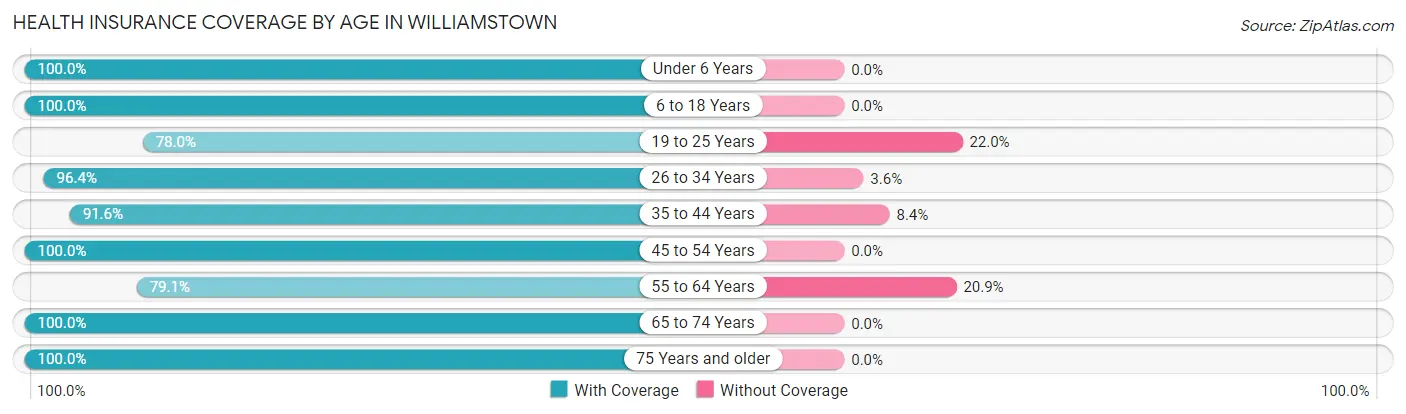
| Age Bracket | With Coverage | Without Coverage |
| Under 6 Years | 491 (100.0%) | 0 (0.0%) |
| 6 to 18 Years | 679 (100.0%) | 0 (0.0%) |
| 19 to 25 Years | 184 (78.0%) | 52 (22.0%) |
| 26 to 34 Years | 460 (96.4%) | 17 (3.6%) |
| 35 to 44 Years | 445 (91.6%) | 41 (8.4%) |
| 45 to 54 Years | 420 (100.0%) | 0 (0.0%) |
| 55 to 64 Years | 295 (79.1%) | 78 (20.9%) |
| 65 to 74 Years | 268 (100.0%) | 0 (0.0%) |
| 75 Years and older | 164 (100.0%) | 0 (0.0%) |
| Total | 3,406 (94.8%) | 188 (5.2%) |
Health Insurance Coverage by Citizenship Status in Williamstown
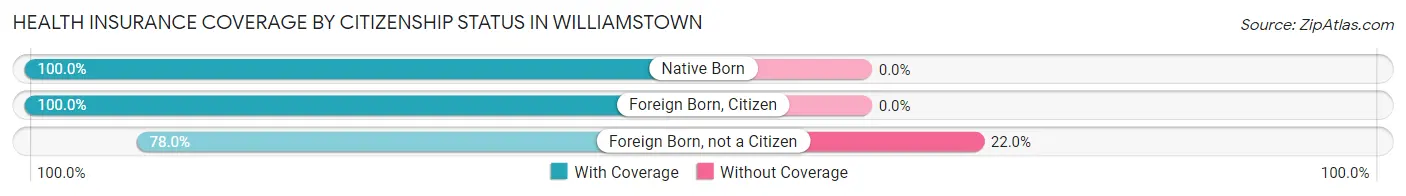
| Citizenship Status | With Coverage | Without Coverage |
| Native Born | 491 (100.0%) | 0 (0.0%) |
| Foreign Born, Citizen | 679 (100.0%) | 0 (0.0%) |
| Foreign Born, not a Citizen | 184 (78.0%) | 52 (22.0%) |
Health Insurance Coverage by Household Income in Williamstown
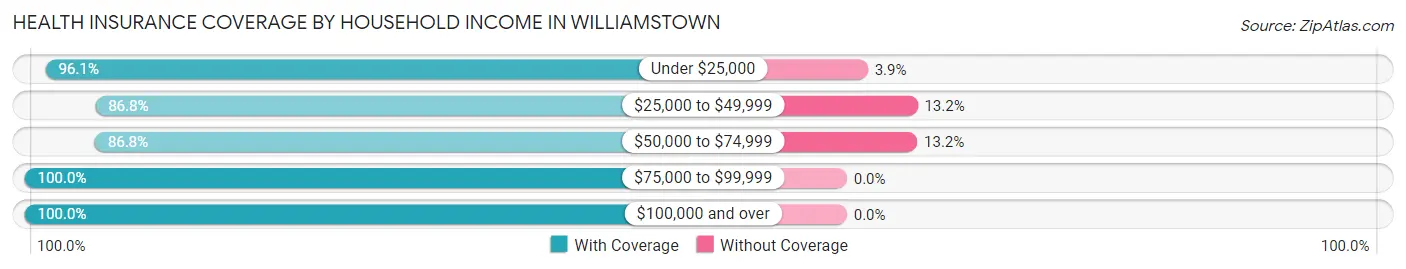
| Household Income | With Coverage | Without Coverage |
| Under $25,000 | 515 (96.1%) | 21 (3.9%) |
| $25,000 to $49,999 | 511 (86.8%) | 78 (13.2%) |
| $50,000 to $74,999 | 587 (86.8%) | 89 (13.2%) |
| $75,000 to $99,999 | 780 (100.0%) | 0 (0.0%) |
| $100,000 and over | 1,013 (100.0%) | 0 (0.0%) |
Public vs Private Health Insurance Coverage by Age in Williamstown
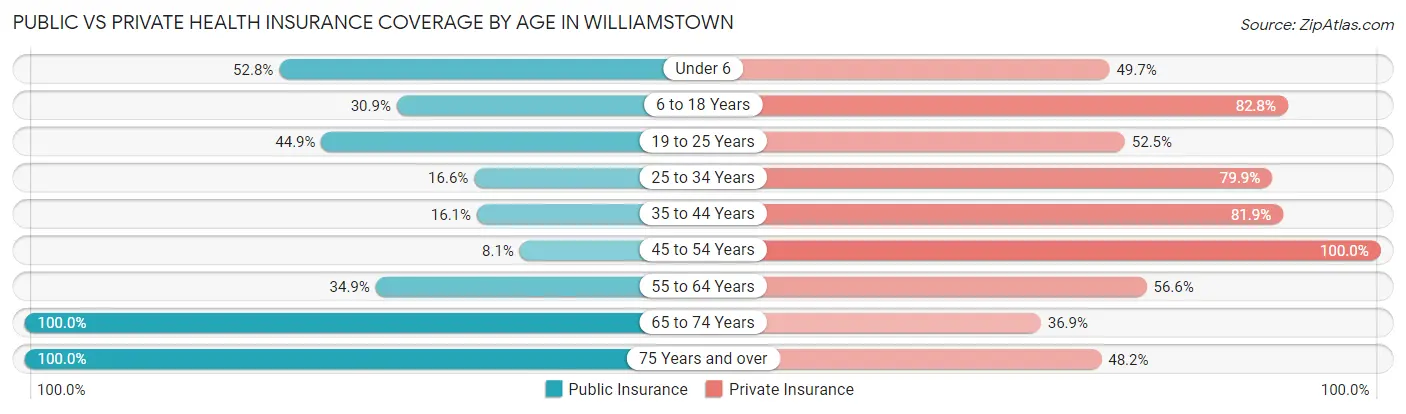
| Age Bracket | Public Insurance | Private Insurance |
| Under 6 | 259 (52.7%) | 244 (49.7%) |
| 6 to 18 Years | 210 (30.9%) | 562 (82.8%) |
| 19 to 25 Years | 106 (44.9%) | 124 (52.5%) |
| 25 to 34 Years | 79 (16.6%) | 381 (79.9%) |
| 35 to 44 Years | 78 (16.1%) | 398 (81.9%) |
| 45 to 54 Years | 34 (8.1%) | 420 (100.0%) |
| 55 to 64 Years | 130 (34.8%) | 211 (56.6%) |
| 65 to 74 Years | 268 (100.0%) | 99 (36.9%) |
| 75 Years and over | 164 (100.0%) | 79 (48.2%) |
| Total | 1,328 (36.9%) | 2,518 (70.1%) |
Disability Status by Sex by Age in Williamstown
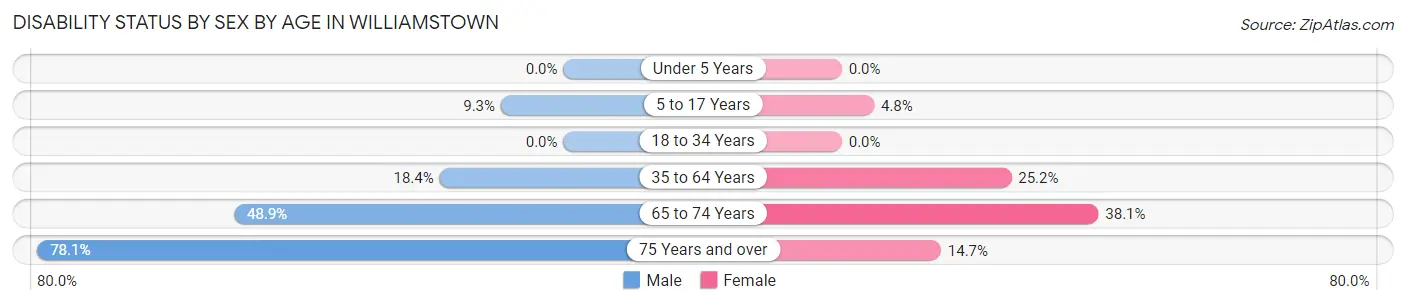
| Age Bracket | Male | Female |
| Under 5 Years | 0 (0.0%) | 0 (0.0%) |
| 5 to 17 Years | 31 (9.3%) | 19 (4.8%) |
| 18 to 34 Years | 0 (0.0%) | 0 (0.0%) |
| 35 to 64 Years | 100 (18.4%) | 185 (25.2%) |
| 65 to 74 Years | 90 (48.9%) | 32 (38.1%) |
| 75 Years and over | 75 (78.1%) | 10 (14.7%) |
Disability Class by Sex by Age in Williamstown
Disability Class: Hearing Difficulty
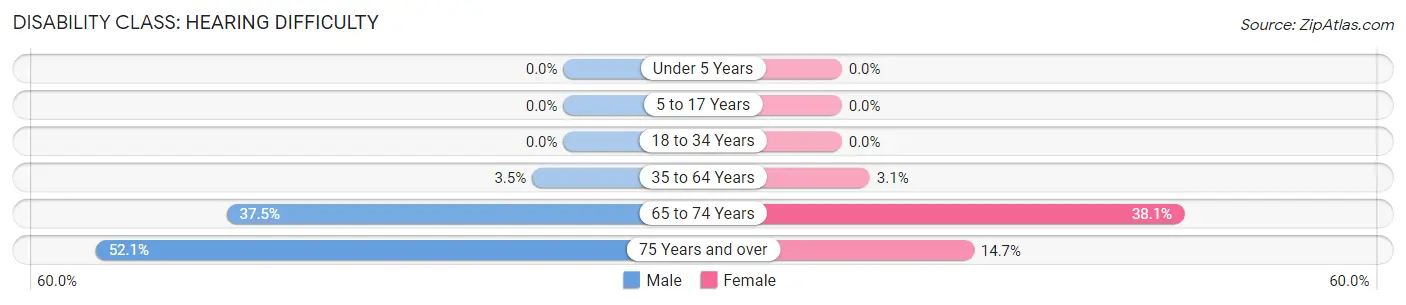
| Age Bracket | Male | Female |
| Under 5 Years | 0 (0.0%) | 0 (0.0%) |
| 5 to 17 Years | 0 (0.0%) | 0 (0.0%) |
| 18 to 34 Years | 0 (0.0%) | 0 (0.0%) |
| 35 to 64 Years | 19 (3.5%) | 23 (3.1%) |
| 65 to 74 Years | 69 (37.5%) | 32 (38.1%) |
| 75 Years and over | 50 (52.1%) | 10 (14.7%) |
Disability Class: Vision Difficulty
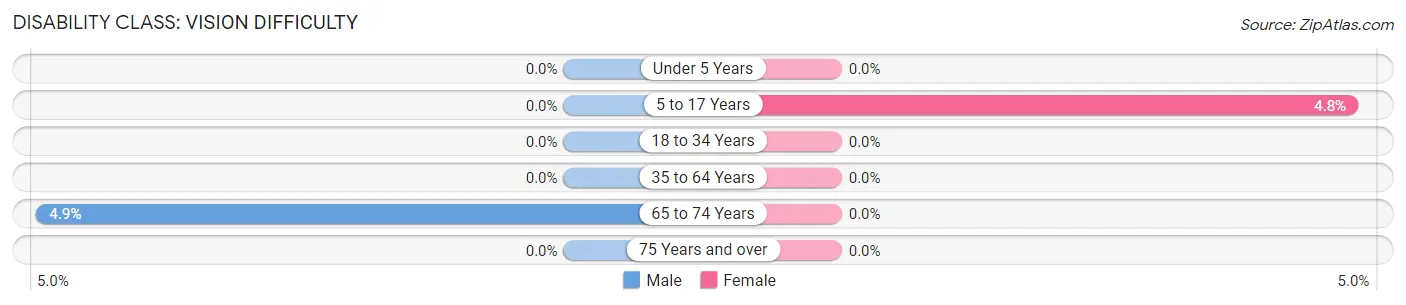
| Age Bracket | Male | Female |
| Under 5 Years | 0 (0.0%) | 0 (0.0%) |
| 5 to 17 Years | 0 (0.0%) | 19 (4.8%) |
| 18 to 34 Years | 0 (0.0%) | 0 (0.0%) |
| 35 to 64 Years | 0 (0.0%) | 0 (0.0%) |
| 65 to 74 Years | 9 (4.9%) | 0 (0.0%) |
| 75 Years and over | 0 (0.0%) | 0 (0.0%) |
Disability Class: Cognitive Difficulty
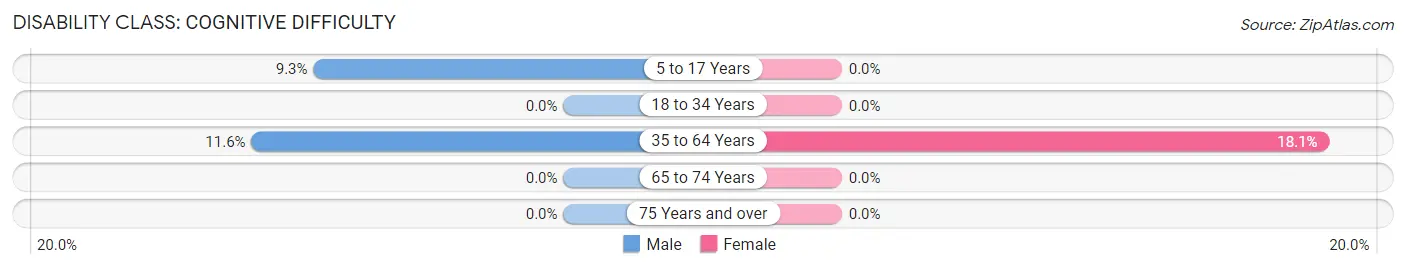
| Age Bracket | Male | Female |
| 5 to 17 Years | 31 (9.3%) | 0 (0.0%) |
| 18 to 34 Years | 0 (0.0%) | 0 (0.0%) |
| 35 to 64 Years | 63 (11.6%) | 133 (18.1%) |
| 65 to 74 Years | 0 (0.0%) | 0 (0.0%) |
| 75 Years and over | 0 (0.0%) | 0 (0.0%) |
Disability Class: Ambulatory Difficulty
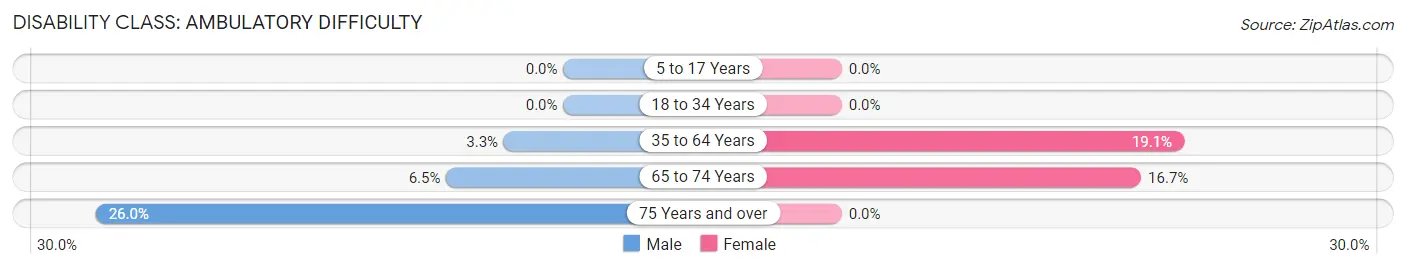
| Age Bracket | Male | Female |
| 5 to 17 Years | 0 (0.0%) | 0 (0.0%) |
| 18 to 34 Years | 0 (0.0%) | 0 (0.0%) |
| 35 to 64 Years | 18 (3.3%) | 140 (19.1%) |
| 65 to 74 Years | 12 (6.5%) | 14 (16.7%) |
| 75 Years and over | 25 (26.0%) | 0 (0.0%) |
Disability Class: Self-Care Difficulty
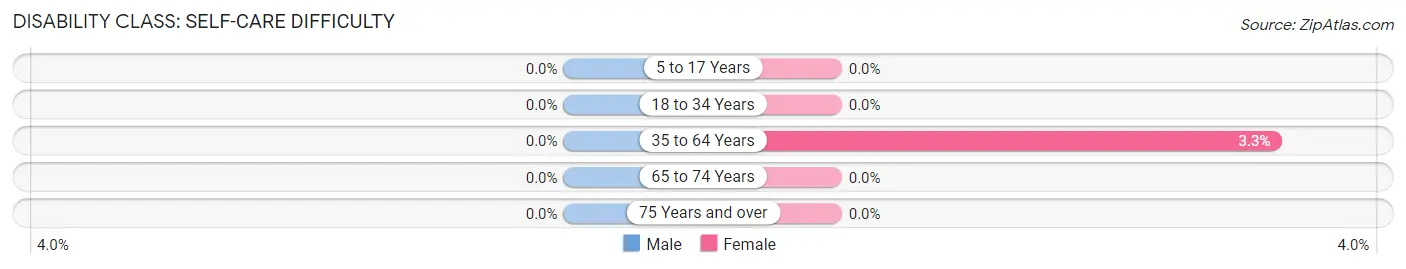
| Age Bracket | Male | Female |
| 5 to 17 Years | 0 (0.0%) | 0 (0.0%) |
| 18 to 34 Years | 0 (0.0%) | 0 (0.0%) |
| 35 to 64 Years | 0 (0.0%) | 24 (3.3%) |
| 65 to 74 Years | 0 (0.0%) | 0 (0.0%) |
| 75 Years and over | 0 (0.0%) | 0 (0.0%) |
Technology Access in Williamstown
Computing Device Access in Williamstown
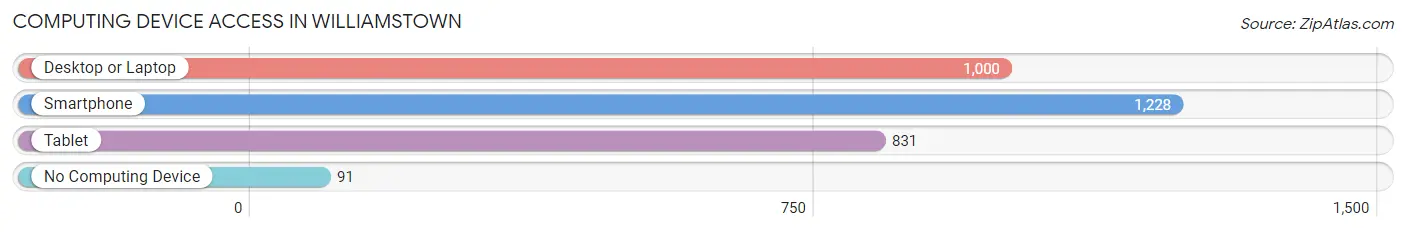
| Device Type | # Households | % Households |
| Desktop or Laptop | 1,000 | 72.6% |
| Smartphone | 1,228 | 89.1% |
| Tablet | 831 | 60.3% |
| No Computing Device | 91 | 6.6% |
| Total | 1,378 | 100.0% |
Internet Access in Williamstown
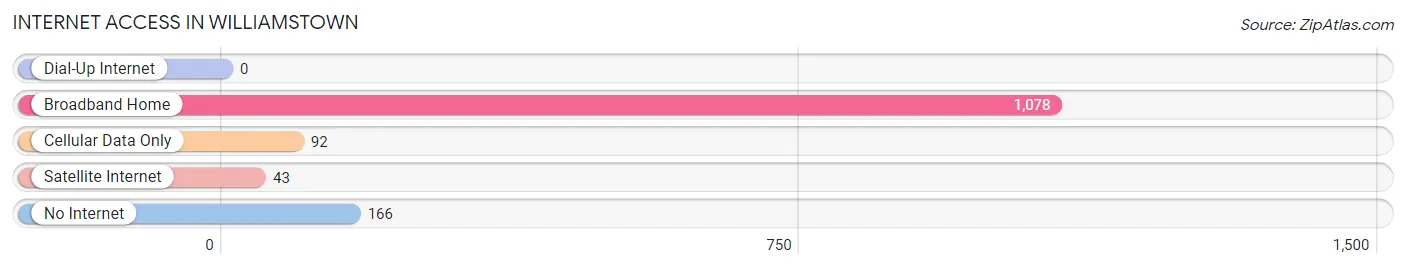
| Internet Type | # Households | % Households |
| Dial-Up Internet | 0 | 0.0% |
| Broadband Home | 1,078 | 78.2% |
| Cellular Data Only | 92 | 6.7% |
| Satellite Internet | 43 | 3.1% |
| No Internet | 166 | 12.0% |
| Total | 1,378 | 100.0% |
Williamstown Summary
Williamstown, Kentucky is a small city located in Grant County, Kentucky. It is situated on the banks of the Ohio River, and is part of the Cincinnati-Northern Kentucky metropolitan area. The city has a population of approximately 4,000 people, and is the county seat of Grant County.
History
Williamstown was founded in 1812 by William Lytle, a Revolutionary War veteran. Lytle named the town after himself, and it was incorporated in 1820. The town was originally a farming community, and the main crops were corn, wheat, and tobacco. In the late 19th century, the town began to grow and develop, and by the early 20th century, it had become a major industrial center. The town was home to several factories, including a paper mill, a furniture factory, and a canning factory.
In the late 20th century, the town began to decline, as many of the factories closed down. However, the town has seen a resurgence in recent years, with the opening of several new businesses and the revitalization of the downtown area.
Geography
Williamstown is located in Grant County, Kentucky, on the banks of the Ohio River. The city is situated at the intersection of Interstate 75 and US Route 25. The city is located approximately 30 miles south of Cincinnati, Ohio, and 40 miles north of Lexington, Kentucky.
The city has a total area of 2.3 square miles, all of which is land. The city is located in a hilly region, and the terrain is mostly flat. The climate is humid subtropical, with hot, humid summers and mild winters.
Economy
Williamstown’s economy is largely based on manufacturing and tourism. The city is home to several factories, including a paper mill, a furniture factory, and a canning factory. The city is also home to several tourist attractions, including the Williamstown Lake State Park, the Grant County Museum, and the Williamstown Historic District.
The city is also home to several retail stores, restaurants, and other businesses. The city is served by the Grant County Airport, which offers flights to several major cities in the region.
Demographics
Williamstown has a population of approximately 4,000 people. The population is predominantly white, with a small African American population. The median household income is $37,000, and the median home value is $90,000. The city has a high rate of poverty, with approximately 25% of the population living below the poverty line.
The city is served by the Grant County School District, which includes two elementary schools, one middle school, and one high school. The city is also home to several churches, including the First Baptist Church, the First Presbyterian Church, and the Church of the Nazarene.
Conclusion
Williamstown, Kentucky is a small city located in Grant County, Kentucky. It is situated on the banks of the Ohio River, and is part of the Cincinnati-Northern Kentucky metropolitan area. The city has a population of approximately 4,000 people, and is the county seat of Grant County. The city’s economy is largely based on manufacturing and tourism, and the city is home to several tourist attractions, retail stores, restaurants, and other businesses. The city is served by the Grant County School District, and is home to several churches.
Common Questions
What is Per Capita Income in Williamstown?
Per Capita income in Williamstown is $24,793.
What is the Median Family Income in Williamstown?
Median Family Income in Williamstown is $85,484.
What is the Median Household income in Williamstown?
Median Household Income in Williamstown is $60,726.
What is Income or Wage Gap in Williamstown?
Income or Wage Gap in Williamstown is 1.2%.
Women in Williamstown earn 98.8 cents for every dollar earned by a man.
What is Inequality or Gini Index in Williamstown?
Inequality or Gini Index in Williamstown is 0.39.
What is the Total Population of Williamstown?
Total Population of Williamstown is 3,909.
What is the Total Male Population of Williamstown?
Total Male Population of Williamstown is 1,845.
What is the Total Female Population of Williamstown?
Total Female Population of Williamstown is 2,064.
What is the Ratio of Males per 100 Females in Williamstown?
There are 89.39 Males per 100 Females in Williamstown.
What is the Ratio of Females per 100 Males in Williamstown?
There are 111.87 Females per 100 Males in Williamstown.
What is the Median Population Age in Williamstown?
Median Population Age in Williamstown is 33.9 Years.
What is the Average Family Size in Williamstown
Average Family Size in Williamstown is 3.3 People.
What is the Average Household Size in Williamstown
Average Household Size in Williamstown is 2.6 People.
How Large is the Labor Force in Williamstown?
There are 1,762 People in the Labor Forcein in Williamstown.
What is the Percentage of People in the Labor Force in Williamstown?
60.1% of People are in the Labor Force in Williamstown.
What is the Unemployment Rate in Williamstown?
Unemployment Rate in Williamstown is 1.2%.