Petersburg, KY Map & Demographics
Petersburg Map
Petersburg Overview
$33,627
PER CAPITA INCOME
$101,667
AVG FAMILY INCOME
$117,917
AVG HOUSEHOLD INCOME
4.4%
WAGE / INCOME GAP [ % ]
95.6¢/ $1
WAGE / INCOME GAP [ $ ]
0.15
INEQUALITY / GINI INDEX
587
TOTAL POPULATION
310
MALE POPULATION
277
FEMALE POPULATION
111.91
MALES / 100 FEMALES
89.35
FEMALES / 100 MALES
30.0
MEDIAN AGE
3.3
AVG FAMILY SIZE
3.5
AVG HOUSEHOLD SIZE
351
LABOR FORCE [ PEOPLE ]
90.9%
PERCENT IN LABOR FORCE
Petersburg Zip Codes
Petersburg Area Codes
Income in Petersburg
Income Overview in Petersburg
Per Capita Income in Petersburg is $33,627, while median incomes of families and households are $101,667 and $117,917 respectively.
| Characteristic | Number | Measure |
| Per Capita Income | 587 | $33,627 |
| Median Family Income | 166 | $101,667 |
| Mean Family Income | 166 | $108,976 |
| Median Household Income | 166 | $117,917 |
| Mean Household Income | 166 | $117,253 |
| Income Deficit | 166 | $0 |
| Wage / Income Gap (%) | 587 | 4.45% |
| Wage / Income Gap ($) | 587 | 95.55¢ per $1 |
| Gini / Inequality Index | 587 | 0.15 |
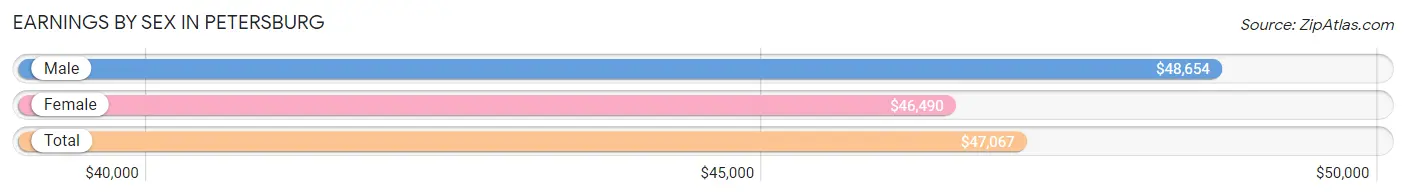
Earnings by Sex in Petersburg
Average Earnings in Petersburg are $47,067, $48,654 for men and $46,490 for women, a difference of 4.4%.
| Sex | Number | Average Earnings |
| Male | 194 (55.3%) | $48,654 |
| Female | 157 (44.7%) | $46,490 |
| Total | 351 (100.0%) | $47,067 |
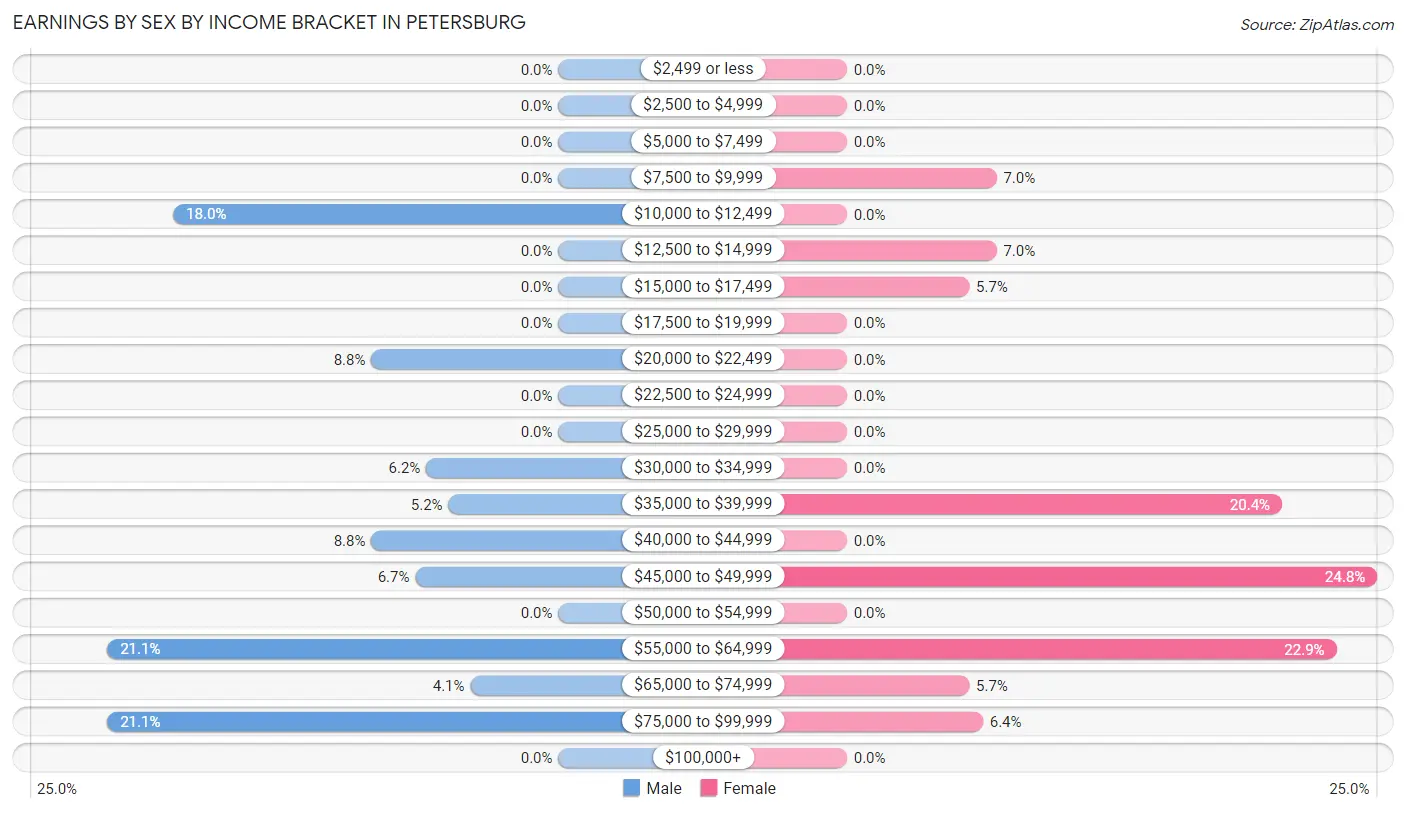
Earnings by Sex by Income Bracket in Petersburg
The most common earnings brackets in Petersburg are $55,000 to $64,999 for men (41 | 21.1%) and $45,000 to $49,999 for women (39 | 24.8%).
| Income | Male | Female |
| $2,499 or less | 0 (0.0%) | 0 (0.0%) |
| $2,500 to $4,999 | 0 (0.0%) | 0 (0.0%) |
| $5,000 to $7,499 | 0 (0.0%) | 0 (0.0%) |
| $7,500 to $9,999 | 0 (0.0%) | 11 (7.0%) |
| $10,000 to $12,499 | 35 (18.0%) | 0 (0.0%) |
| $12,500 to $14,999 | 0 (0.0%) | 11 (7.0%) |
| $15,000 to $17,499 | 0 (0.0%) | 9 (5.7%) |
| $17,500 to $19,999 | 0 (0.0%) | 0 (0.0%) |
| $20,000 to $22,499 | 17 (8.8%) | 0 (0.0%) |
| $22,500 to $24,999 | 0 (0.0%) | 0 (0.0%) |
| $25,000 to $29,999 | 0 (0.0%) | 0 (0.0%) |
| $30,000 to $34,999 | 12 (6.2%) | 0 (0.0%) |
| $35,000 to $39,999 | 10 (5.1%) | 32 (20.4%) |
| $40,000 to $44,999 | 17 (8.8%) | 0 (0.0%) |
| $45,000 to $49,999 | 13 (6.7%) | 39 (24.8%) |
| $50,000 to $54,999 | 0 (0.0%) | 0 (0.0%) |
| $55,000 to $64,999 | 41 (21.1%) | 36 (22.9%) |
| $65,000 to $74,999 | 8 (4.1%) | 9 (5.7%) |
| $75,000 to $99,999 | 41 (21.1%) | 10 (6.4%) |
| $100,000+ | 0 (0.0%) | 0 (0.0%) |
| Total | 194 (100.0%) | 157 (100.0%) |
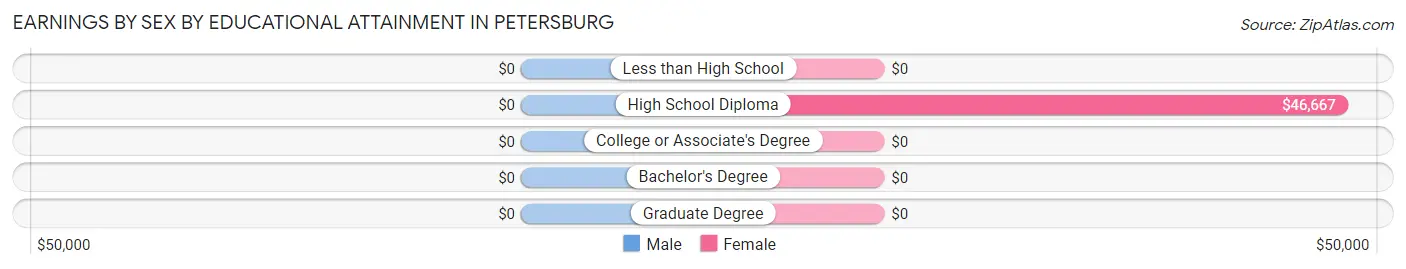
Earnings by Sex by Educational Attainment in Petersburg
| Educational Attainment | Male Income | Female Income |
| Less than High School | - | - |
| High School Diploma | - | - |
| College or Associate's Degree | - | - |
| Bachelor's Degree | - | - |
| Graduate Degree | - | - |
| Total | $56,339 | $47,596 |
Family Income in Petersburg
Family Income Brackets in Petersburg
According to the Petersburg family income data, there are 79 families falling into the $100,000 to $149,999 income range, which is the most common income bracket and makes up 47.6% of all families.
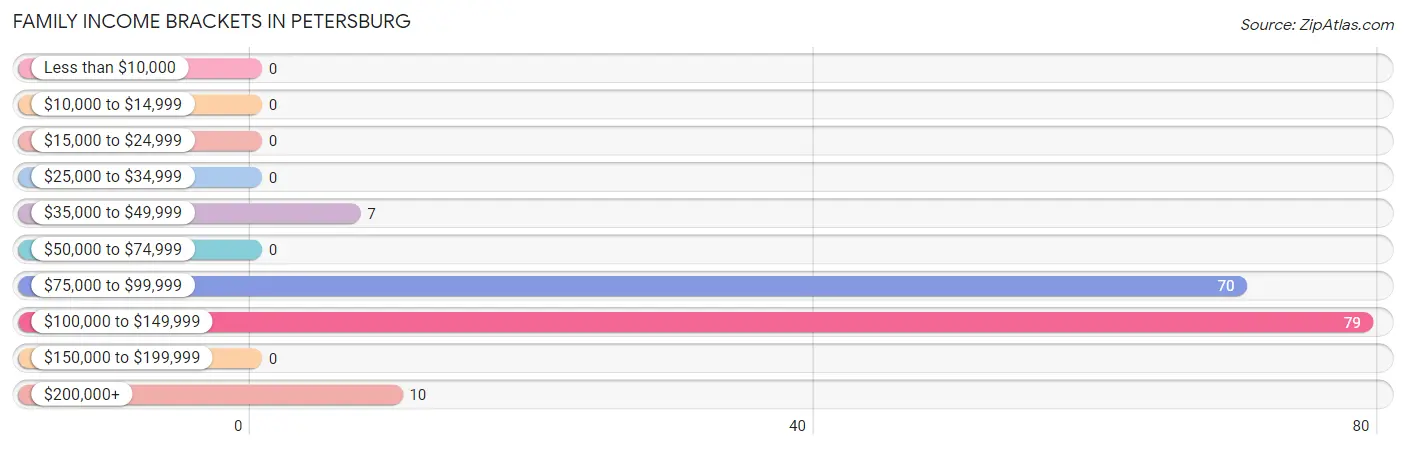
| Income Bracket | # Families | % Families |
| Less than $10,000 | 0 | 0.0% |
| $10,000 to $14,999 | 0 | 0.0% |
| $15,000 to $24,999 | 0 | 0.0% |
| $25,000 to $34,999 | 0 | 0.0% |
| $35,000 to $49,999 | 7 | 4.2% |
| $50,000 to $74,999 | 0 | 0.0% |
| $75,000 to $99,999 | 70 | 42.2% |
| $100,000 to $149,999 | 79 | 47.6% |
| $150,000 to $199,999 | 0 | 0.0% |
| $200,000+ | 10 | 6.0% |
Family Income by Famaliy Size in Petersburg
4-person families (86 | 51.8%) account for the highest median family income in Petersburg with $117,708 per family, while 2-person families (56 | 33.7%) have the highest median income of $44,479 per family member.
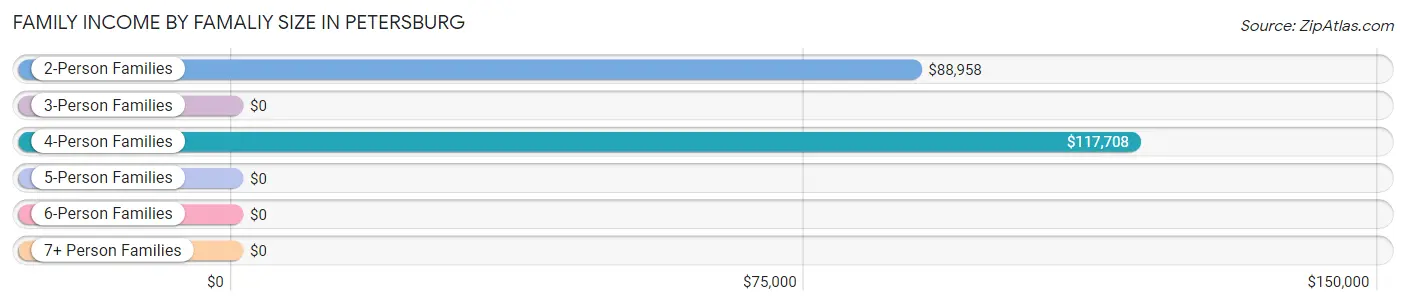
| Income Bracket | # Families | Median Income |
| 2-Person Families | 56 (33.7%) | $88,958 |
| 3-Person Families | 12 (7.2%) | $0 |
| 4-Person Families | 86 (51.8%) | $117,708 |
| 5-Person Families | 12 (7.2%) | $0 |
| 6-Person Families | 0 (0.0%) | $0 |
| 7+ Person Families | 0 (0.0%) | $0 |
| Total | 166 (100.0%) | $101,667 |
Family Income by Number of Earners in Petersburg
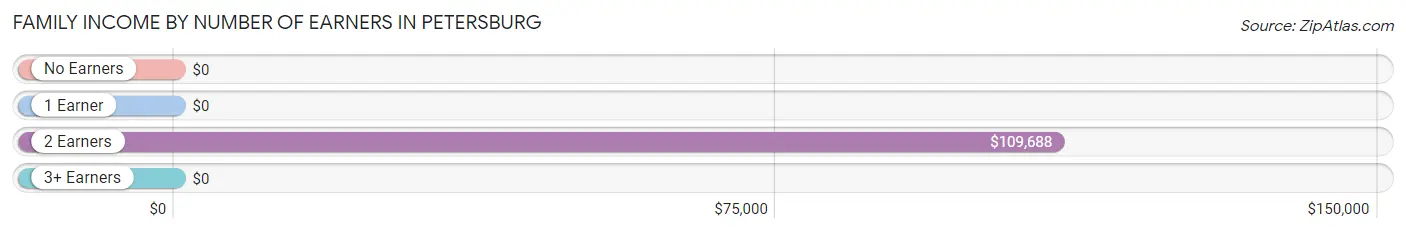
| Number of Earners | # Families | Median Income |
| No Earners | 7 (4.2%) | $0 |
| 1 Earner | 41 (24.7%) | $0 |
| 2 Earners | 99 (59.6%) | $109,688 |
| 3+ Earners | 19 (11.5%) | $0 |
| Total | 166 (100.0%) | $101,667 |
Household Income in Petersburg
Household Income Brackets in Petersburg
With 110 households falling in the category, the $100,000 to $149,999 income range is the most frequent in Petersburg, accounting for 66.3% of all households.
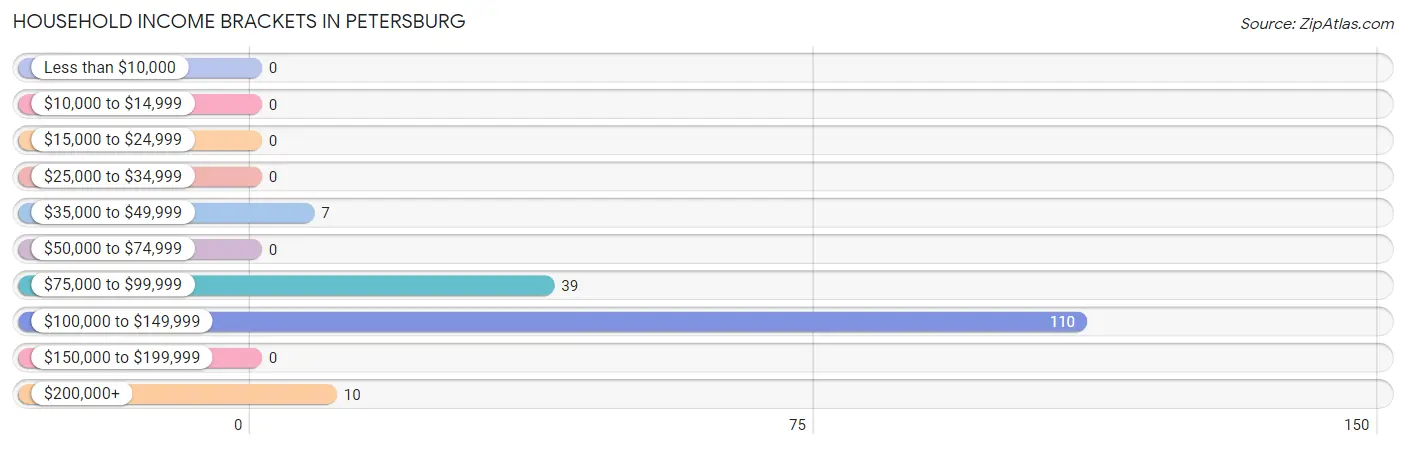
| Income Bracket | # Households | % Households |
| Less than $10,000 | 0 | 0.0% |
| $10,000 to $14,999 | 0 | 0.0% |
| $15,000 to $24,999 | 0 | 0.0% |
| $25,000 to $34,999 | 0 | 0.0% |
| $35,000 to $49,999 | 7 | 4.2% |
| $50,000 to $74,999 | 0 | 0.0% |
| $75,000 to $99,999 | 39 | 23.5% |
| $100,000 to $149,999 | 110 | 66.3% |
| $150,000 to $199,999 | 0 | 0.0% |
| $200,000+ | 10 | 6.0% |
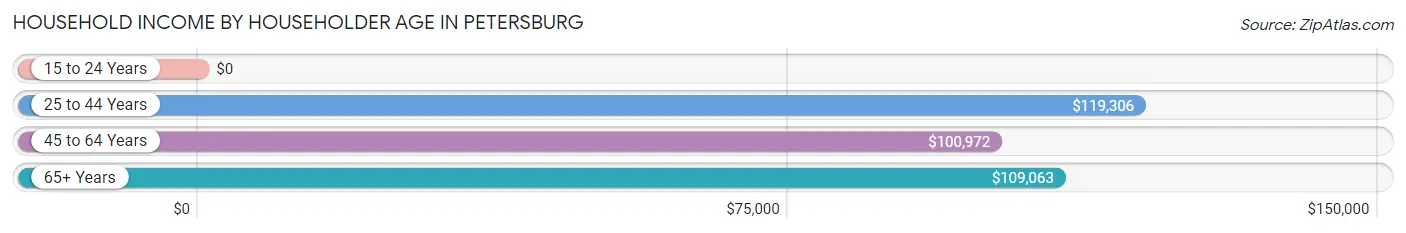
Household Income by Householder Age in Petersburg
The median household income in Petersburg is $117,917, with the highest median household income of $119,306 found in the 25 to 44 years age bracket for the primary householder. A total of 106 households (63.9%) fall into this category.
| Income Bracket | # Households | Median Income |
| 15 to 24 Years | 0 (0.0%) | $0 |
| 25 to 44 Years | 106 (63.9%) | $119,306 |
| 45 to 64 Years | 31 (18.7%) | $100,972 |
| 65+ Years | 29 (17.5%) | $109,063 |
| Total | 166 (100.0%) | $117,917 |
Poverty in Petersburg
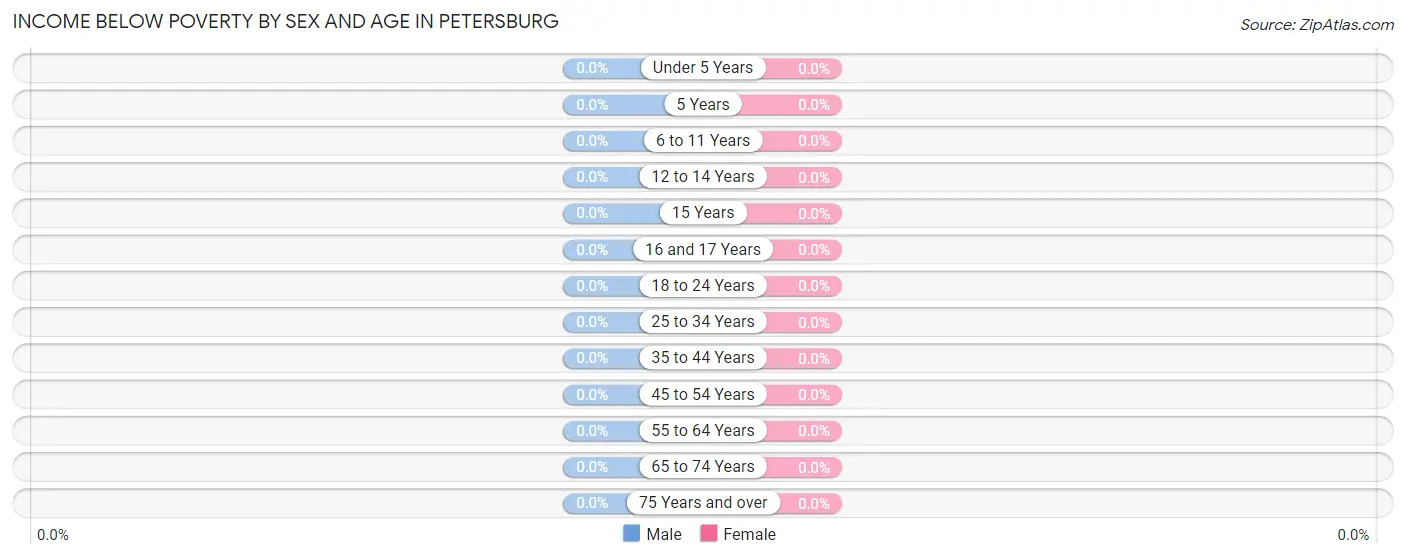
Income Below Poverty by Sex and Age in Petersburg
| Age Bracket | Male | Female |
| Under 5 Years | 0 (0.0%) | 0 (0.0%) |
| 5 Years | 0 (0.0%) | 0 (0.0%) |
| 6 to 11 Years | 0 (0.0%) | 0 (0.0%) |
| 12 to 14 Years | 0 (0.0%) | 0 (0.0%) |
| 15 Years | 0 (0.0%) | 0 (0.0%) |
| 16 and 17 Years | 0 (0.0%) | 0 (0.0%) |
| 18 to 24 Years | 0 (0.0%) | 0 (0.0%) |
| 25 to 34 Years | 0 (0.0%) | 0 (0.0%) |
| 35 to 44 Years | 0 (0.0%) | 0 (0.0%) |
| 45 to 54 Years | 0 (0.0%) | 0 (0.0%) |
| 55 to 64 Years | 0 (0.0%) | 0 (0.0%) |
| 65 to 74 Years | 0 (0.0%) | 0 (0.0%) |
| 75 Years and over | 0 (0.0%) | 0 (0.0%) |
| Total | 0 (0.0%) | 0 (0.0%) |
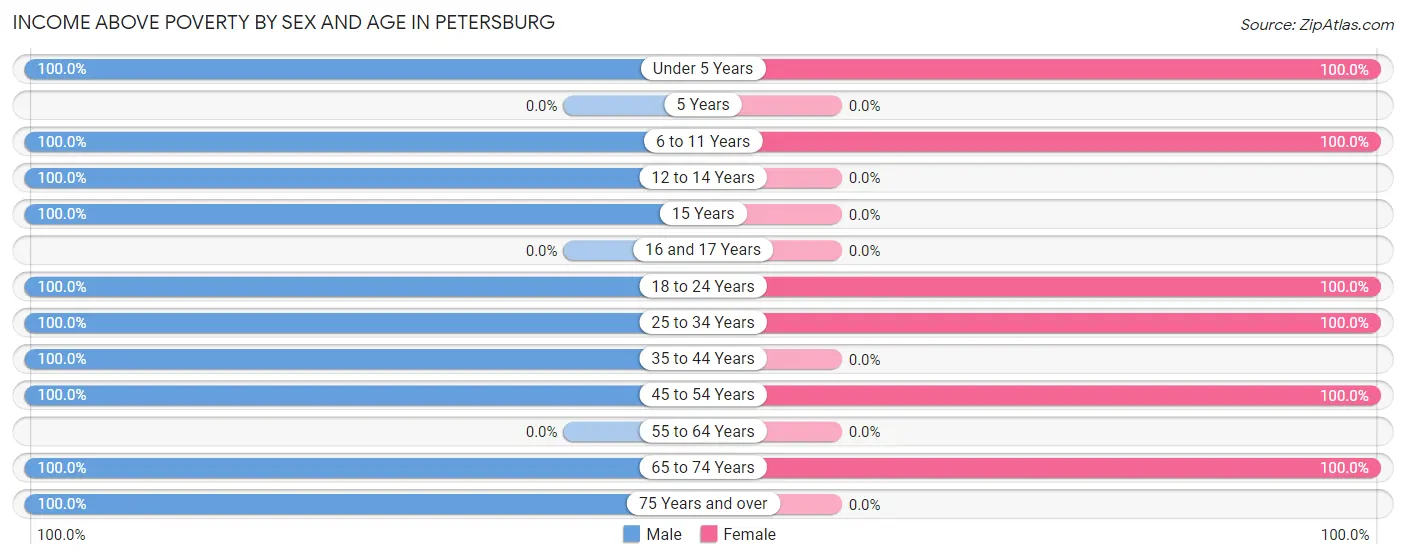
Income Above Poverty by Sex and Age in Petersburg
According to the poverty statistics in Petersburg, males aged under 5 years and females aged under 5 years are the age groups that are most secure financially, with 100.0% of males and 100.0% of females in these age groups living above the poverty line.
| Age Bracket | Male | Female |
| Under 5 Years | 11 (100.0%) | 58 (100.0%) |
| 5 Years | 0 (0.0%) | 0 (0.0%) |
| 6 to 11 Years | 47 (100.0%) | 46 (100.0%) |
| 12 to 14 Years | 9 (100.0%) | 0 (0.0%) |
| 15 Years | 30 (100.0%) | 0 (0.0%) |
| 16 and 17 Years | 0 (0.0%) | 0 (0.0%) |
| 18 to 24 Years | 29 (100.0%) | 22 (100.0%) |
| 25 to 34 Years | 94 (100.0%) | 92 (100.0%) |
| 35 to 44 Years | 43 (100.0%) | 0 (0.0%) |
| 45 to 54 Years | 18 (100.0%) | 30 (100.0%) |
| 55 to 64 Years | 0 (0.0%) | 0 (0.0%) |
| 65 to 74 Years | 22 (100.0%) | 29 (100.0%) |
| 75 Years and over | 7 (100.0%) | 0 (0.0%) |
| Total | 310 (100.0%) | 277 (100.0%) |
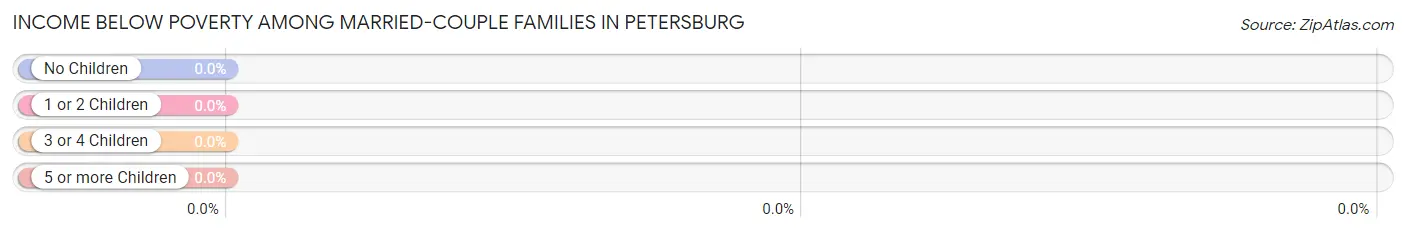
Income Below Poverty Among Married-Couple Families in Petersburg
| Children | Above Poverty | Below Poverty |
| No Children | 52 (100.0%) | 0 (0.0%) |
| 1 or 2 Children | 45 (100.0%) | 0 (0.0%) |
| 3 or 4 Children | 12 (100.0%) | 0 (0.0%) |
| 5 or more Children | 0 (0.0%) | 0 (0.0%) |
| Total | 109 (100.0%) | 0 (0.0%) |
Income Below Poverty Among Single-Parent Households in Petersburg
| Children | Single Father | Single Mother |
| No Children | 0 (0.0%) | 0 (0.0%) |
| 1 or 2 Children | 0 (0.0%) | 0 (0.0%) |
| 3 or 4 Children | 0 (0.0%) | 0 (0.0%) |
| 5 or more Children | 0 (0.0%) | 0 (0.0%) |
| Total | 0 (0.0%) | 0 (0.0%) |
Income Below Poverty Among Married-Couple vs Single-Parent Households in Petersburg
| Children | Married-Couple Families | Single-Parent Households |
| No Children | 0 (0.0%) | 0 (0.0%) |
| 1 or 2 Children | 0 (0.0%) | 0 (0.0%) |
| 3 or 4 Children | 0 (0.0%) | 0 (0.0%) |
| 5 or more Children | 0 (0.0%) | 0 (0.0%) |
| Total | 0 (0.0%) | 0 (0.0%) |
Race in Petersburg
The most populous races in Petersburg are White / Caucasian (573 | 97.6%), and Two or more Races (14 | 2.4%).
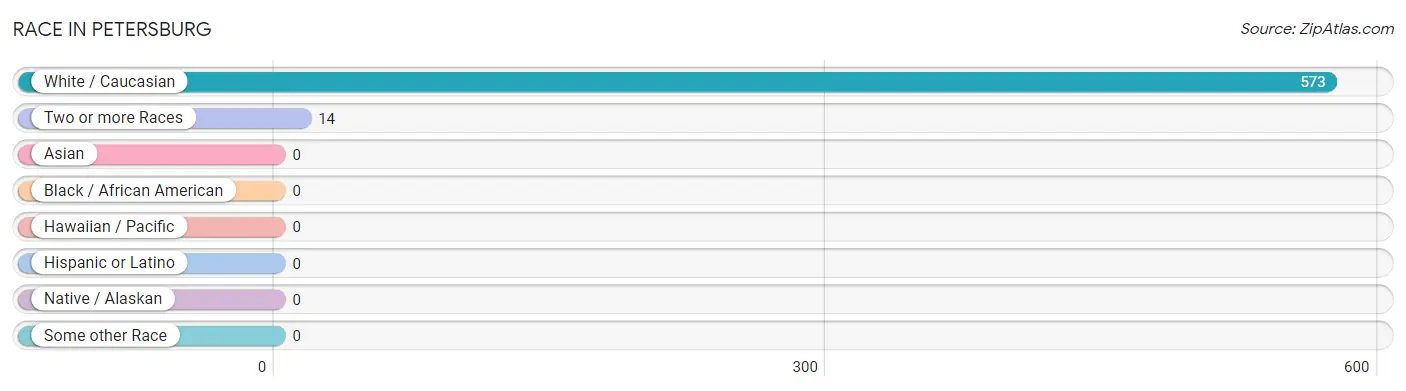
| Race | # Population | % Population |
| Asian | 0 | 0.0% |
| Black / African American | 0 | 0.0% |
| Hawaiian / Pacific | 0 | 0.0% |
| Hispanic or Latino | 0 | 0.0% |
| Native / Alaskan | 0 | 0.0% |
| White / Caucasian | 573 | 97.6% |
| Two or more Races | 14 | 2.4% |
| Some other Race | 0 | 0.0% |
| Total | 587 | 100.0% |
Ancestry in Petersburg
The most populous ancestries reported in Petersburg are English (155 | 26.4%), German (106 | 18.1%), Irish (47 | 8.0%), French (29 | 4.9%), and Scottish (21 | 3.6%), together accounting for 61.0% of all Petersburg residents.
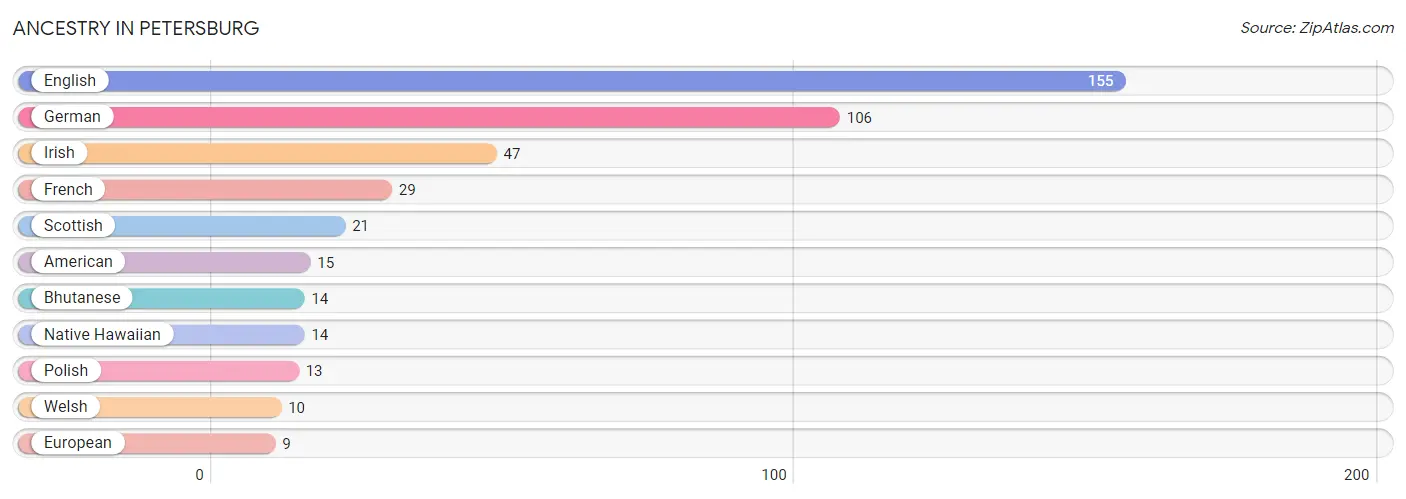
| Ancestry | # Population | % Population |
| American | 15 | 2.6% |
| Bhutanese | 14 | 2.4% |
| English | 155 | 26.4% |
| European | 9 | 1.5% |
| French | 29 | 4.9% |
| German | 106 | 18.1% |
| Irish | 47 | 8.0% |
| Native Hawaiian | 14 | 2.4% |
| Polish | 13 | 2.2% |
| Scottish | 21 | 3.6% |
| Welsh | 10 | 1.7% | View All 11 Rows |
Immigrants in Petersburg

| Immigration Origin | # Population | % Population | View All 0 Rows |
Sex and Age in Petersburg
Sex and Age in Petersburg
The most populous age groups in Petersburg are 30 to 34 Years (66 | 21.3%) for men and 30 to 34 Years (78 | 28.2%) for women.
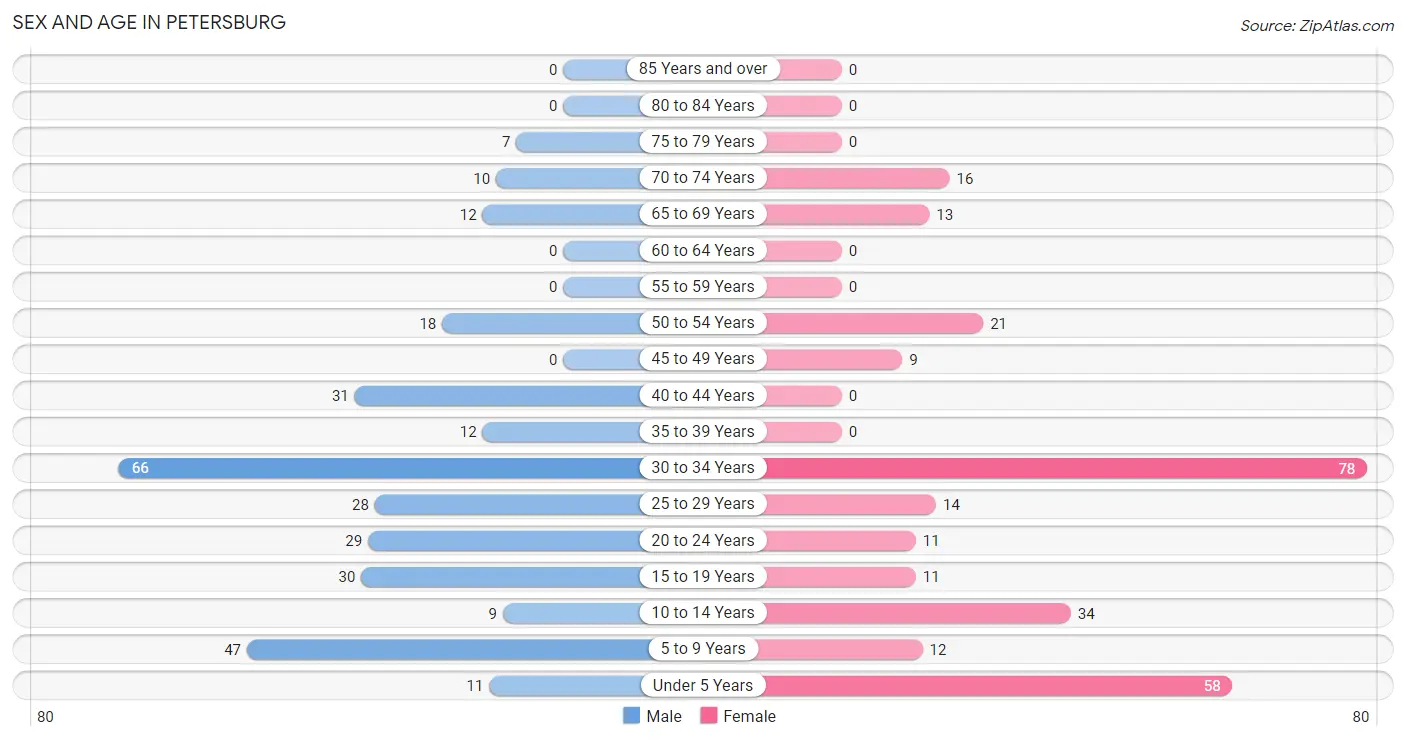
| Age Bracket | Male | Female |
| Under 5 Years | 11 (3.5%) | 58 (20.9%) |
| 5 to 9 Years | 47 (15.2%) | 12 (4.3%) |
| 10 to 14 Years | 9 (2.9%) | 34 (12.3%) |
| 15 to 19 Years | 30 (9.7%) | 11 (4.0%) |
| 20 to 24 Years | 29 (9.3%) | 11 (4.0%) |
| 25 to 29 Years | 28 (9.0%) | 14 (5.1%) |
| 30 to 34 Years | 66 (21.3%) | 78 (28.2%) |
| 35 to 39 Years | 12 (3.9%) | 0 (0.0%) |
| 40 to 44 Years | 31 (10.0%) | 0 (0.0%) |
| 45 to 49 Years | 0 (0.0%) | 9 (3.3%) |
| 50 to 54 Years | 18 (5.8%) | 21 (7.6%) |
| 55 to 59 Years | 0 (0.0%) | 0 (0.0%) |
| 60 to 64 Years | 0 (0.0%) | 0 (0.0%) |
| 65 to 69 Years | 12 (3.9%) | 13 (4.7%) |
| 70 to 74 Years | 10 (3.2%) | 16 (5.8%) |
| 75 to 79 Years | 7 (2.3%) | 0 (0.0%) |
| 80 to 84 Years | 0 (0.0%) | 0 (0.0%) |
| 85 Years and over | 0 (0.0%) | 0 (0.0%) |
| Total | 310 (100.0%) | 277 (100.0%) |
Families and Households in Petersburg
Median Family Size in Petersburg
The median family size in Petersburg is 3.34 persons per family, with single male/father families (45 | 27.1%) accounting for the largest median family size of 3.42 persons per family. On the other hand, single female/mother families (12 | 7.2%) represent the smallest median family size with 2.42 persons per family.
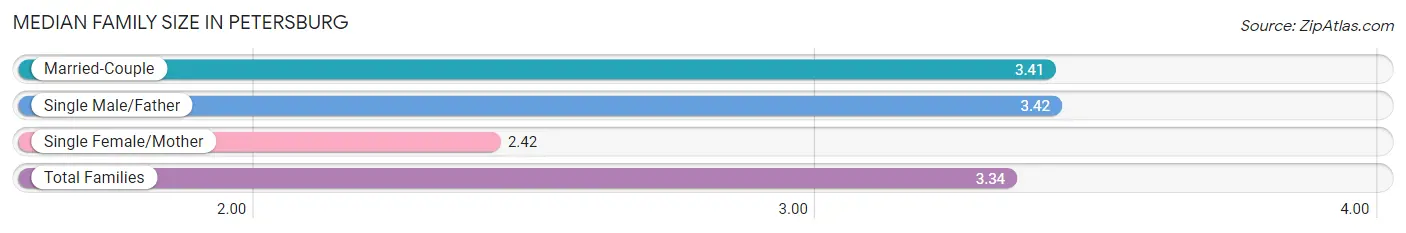
| Family Type | # Families | Family Size |
| Married-Couple | 109 (65.7%) | 3.41 |
| Single Male/Father | 45 (27.1%) | 3.42 |
| Single Female/Mother | 12 (7.2%) | 2.42 |
| Total Families | 166 (100.0%) | 3.34 |
Median Household Size in Petersburg
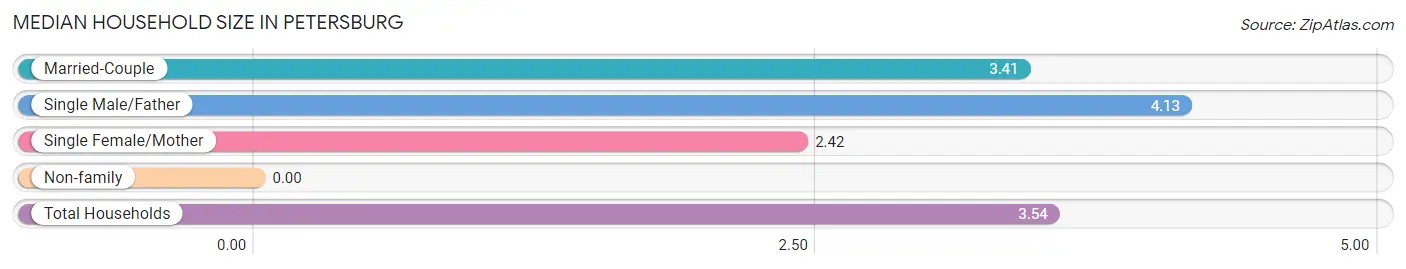
| Household Type | # Households | Household Size |
| Married-Couple | 109 (65.7%) | 3.41 |
| Single Male/Father | 45 (27.1%) | 4.13 |
| Single Female/Mother | 12 (7.2%) | 2.42 |
| Non-family | 0 (0.0%) | - |
| Total Households | 166 (100.0%) | 3.54 |
Household Size by Marriage Status in Petersburg
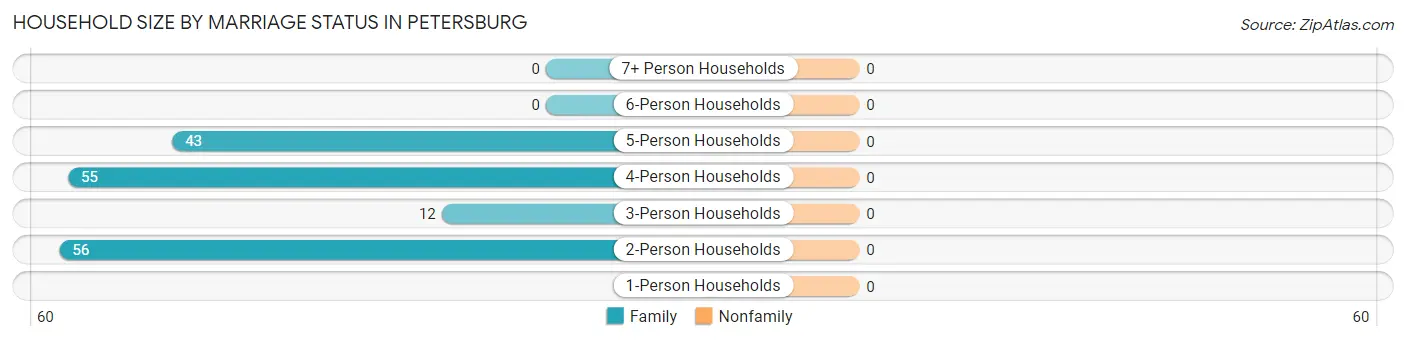
| Household Size | Family Households | Nonfamily Households |
| 1-Person Households | - | 0 (0.0%) |
| 2-Person Households | 56 (33.7%) | 0 (0.0%) |
| 3-Person Households | 12 (7.2%) | 0 (0.0%) |
| 4-Person Households | 55 (33.1%) | 0 (0.0%) |
| 5-Person Households | 43 (25.9%) | 0 (0.0%) |
| 6-Person Households | 0 (0.0%) | 0 (0.0%) |
| 7+ Person Households | 0 (0.0%) | 0 (0.0%) |
| Total | 166 (100.0%) | 0 (0.0%) |
Female Fertility in Petersburg
Fertility by Age in Petersburg
| Age Bracket | Women with Births | Births / 1,000 Women |
| 15 to 19 years | 0 (0.0%) | 0.0 |
| 20 to 34 years | 0 (0.0%) | 0.0 |
| 35 to 50 years | 0 (0.0%) | 0.0 |
| Total | 0 (0.0%) | 0.0 |
Fertility by Age by Marriage Status in Petersburg
| Age Bracket | Married | Unmarried |
| 15 to 19 years | 0 (0.0%) | 0 (0.0%) |
| 20 to 34 years | 0 (0.0%) | 0 (0.0%) |
| 35 to 50 years | 0 (0.0%) | 0 (0.0%) |
| Total | 0 (0.0%) | 0 (0.0%) |
Fertility by Education in Petersburg
| Educational Attainment | Women with Births | Births / 1,000 Women |
| Less than High School | 0 (0.0%) | 0.0 |
| High School Diploma | 0 (0.0%) | 0.0 |
| College or Associate's Degree | 0 (0.0%) | 0.0 |
| Bachelor's Degree | 0 (0.0%) | 0.0 |
| Graduate Degree | 0 (0.0%) | 0.0 |
| Total | 0 (0.0%) | 0.0 |
Fertility by Education by Marriage Status in Petersburg
| Educational Attainment | Married | Unmarried |
| Less than High School | 0 (0.0%) | 0 (0.0%) |
| High School Diploma | 0 (0.0%) | 0 (0.0%) |
| College or Associate's Degree | 0 (0.0%) | 0 (0.0%) |
| Bachelor's Degree | 0 (0.0%) | 0 (0.0%) |
| Graduate Degree | 0 (0.0%) | 0 (0.0%) |
| Total | 0 (0.0%) | 0 (0.0%) |
Employment Characteristics in Petersburg
Employment by Class of Employer in Petersburg
Among the 351 employed individuals in Petersburg, private company employees (282 | 80.3%), self-employed (not incorporated) (27 | 7.7%), and not-for-profit organizations (19 | 5.4%) make up the most common classes of employment.
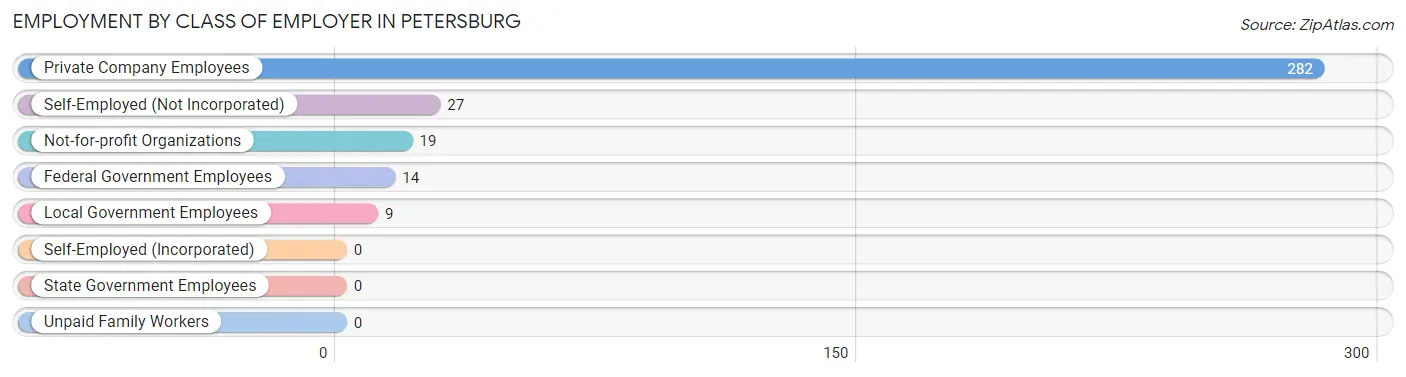
| Employer Class | # Employees | % Employees |
| Private Company Employees | 282 | 80.3% |
| Self-Employed (Incorporated) | 0 | 0.0% |
| Self-Employed (Not Incorporated) | 27 | 7.7% |
| Not-for-profit Organizations | 19 | 5.4% |
| Local Government Employees | 9 | 2.6% |
| State Government Employees | 0 | 0.0% |
| Federal Government Employees | 14 | 4.0% |
| Unpaid Family Workers | 0 | 0.0% |
| Total | 351 | 100.0% |
Employment Status by Age in Petersburg
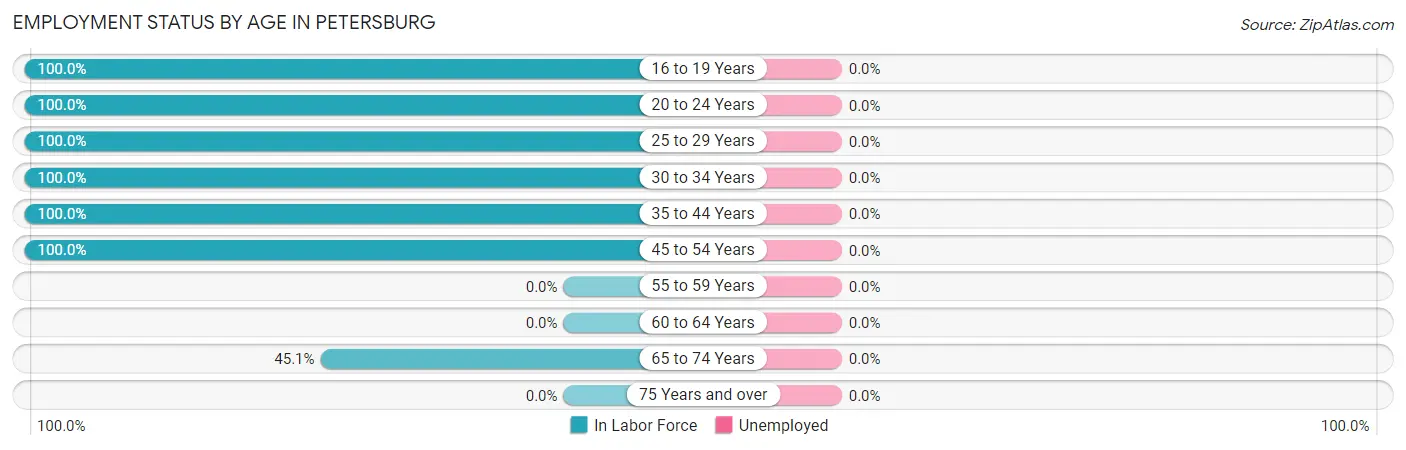
| Age Bracket | In Labor Force | Unemployed |
| 16 to 19 Years | 11 (100.0%) | 0 (0.0%) |
| 20 to 24 Years | 40 (100.0%) | 0 (0.0%) |
| 25 to 29 Years | 42 (100.0%) | 0 (0.0%) |
| 30 to 34 Years | 144 (100.0%) | 0 (0.0%) |
| 35 to 44 Years | 43 (100.0%) | 0 (0.0%) |
| 45 to 54 Years | 48 (100.0%) | 0 (0.0%) |
| 55 to 59 Years | 0 (0.0%) | 0 (0.0%) |
| 60 to 64 Years | 0 (0.0%) | 0 (0.0%) |
| 65 to 74 Years | 23 (45.1%) | 0 (0.0%) |
| 75 Years and over | 0 (0.0%) | 0 (0.0%) |
| Total | 351 (90.9%) | 0 (0.0%) |
Employment Status by Educational Attainment in Petersburg
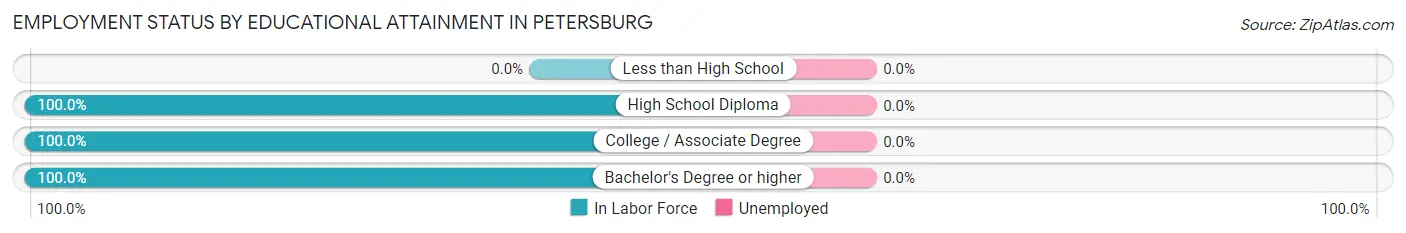
| Educational Attainment | In Labor Force | Unemployed |
| Less than High School | 0 (0.0%) | 0 (0.0%) |
| High School Diploma | 29 (100.0%) | 0 (0.0%) |
| College / Associate Degree | 117 (100.0%) | 0 (0.0%) |
| Bachelor's Degree or higher | 131 (100.0%) | 0 (0.0%) |
| Total | 277 (100.0%) | 0 (0.0%) |
Employment Occupations by Sex in Petersburg
Management, Business, Science and Arts Occupations
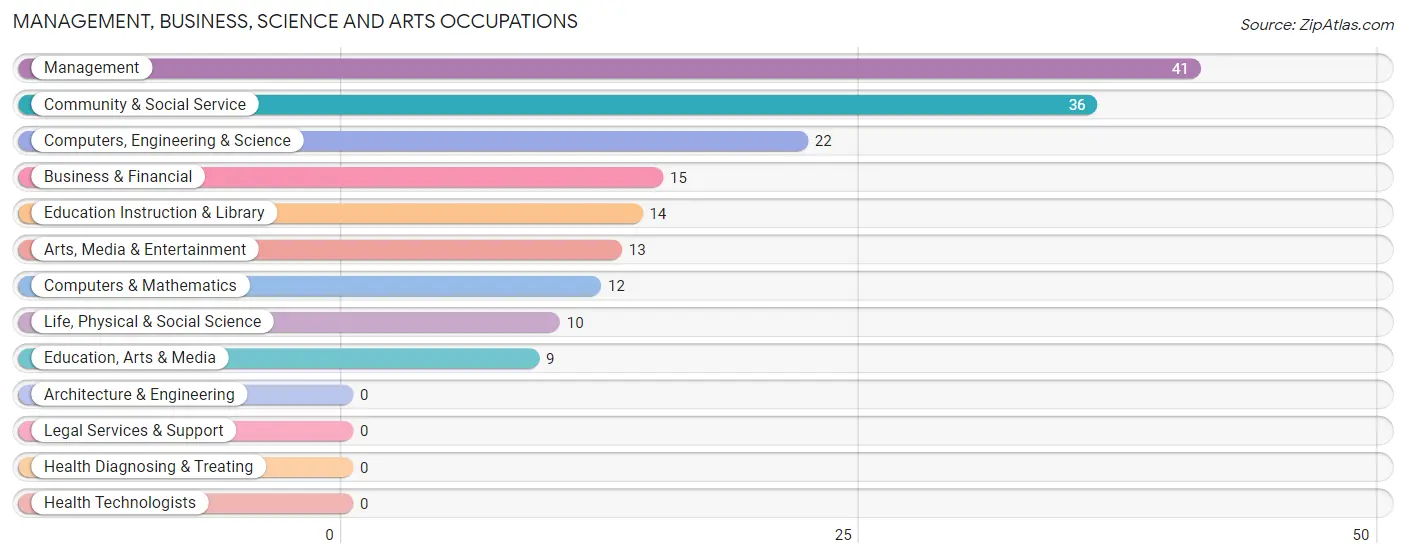
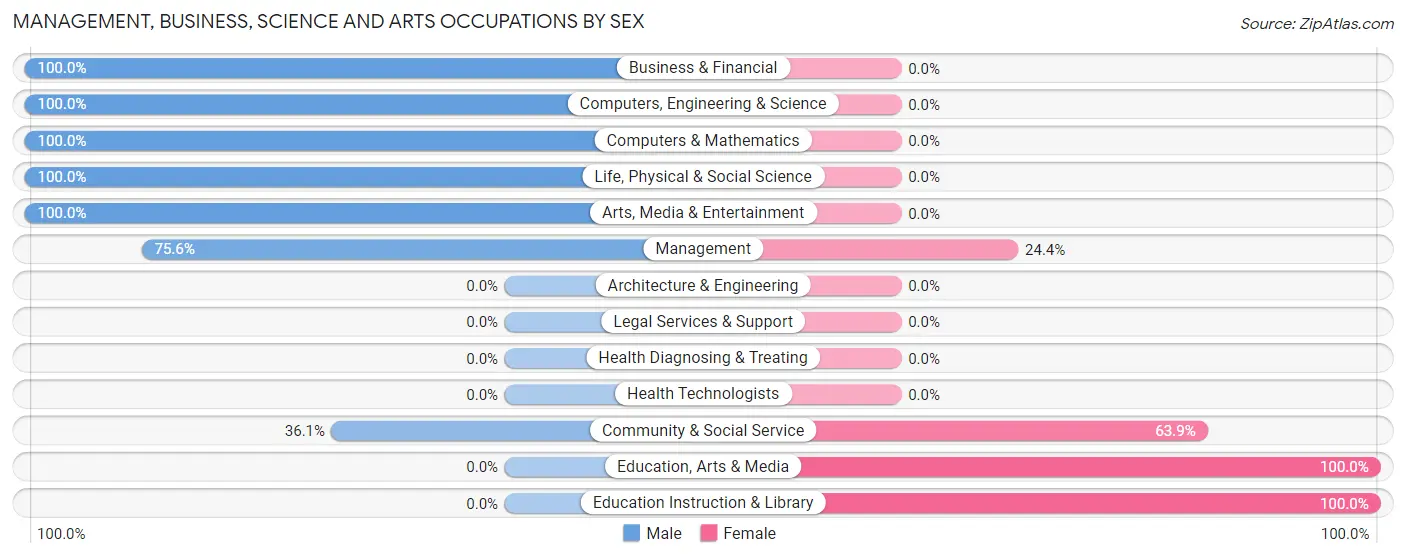
The most common Management, Business, Science and Arts occupations in Petersburg are Management (41 | 11.7%), Community & Social Service (36 | 10.3%), Computers, Engineering & Science (22 | 6.3%), Business & Financial (15 | 4.3%), and Education Instruction & Library (14 | 4.0%).
Management, Business, Science and Arts Occupations by Sex
Within the Management, Business, Science and Arts occupations in Petersburg, the most male-oriented occupations are Business & Financial (100.0%), Computers, Engineering & Science (100.0%), and Computers & Mathematics (100.0%), while the most female-oriented occupations are Education, Arts & Media (100.0%), Education Instruction & Library (100.0%), and Community & Social Service (63.9%).
| Occupation | Male | Female |
| Management | 31 (75.6%) | 10 (24.4%) |
| Business & Financial | 15 (100.0%) | 0 (0.0%) |
| Computers, Engineering & Science | 22 (100.0%) | 0 (0.0%) |
| Computers & Mathematics | 12 (100.0%) | 0 (0.0%) |
| Architecture & Engineering | 0 (0.0%) | 0 (0.0%) |
| Life, Physical & Social Science | 10 (100.0%) | 0 (0.0%) |
| Community & Social Service | 13 (36.1%) | 23 (63.9%) |
| Education, Arts & Media | 0 (0.0%) | 9 (100.0%) |
| Legal Services & Support | 0 (0.0%) | 0 (0.0%) |
| Education Instruction & Library | 0 (0.0%) | 14 (100.0%) |
| Arts, Media & Entertainment | 13 (100.0%) | 0 (0.0%) |
| Health Diagnosing & Treating | 0 (0.0%) | 0 (0.0%) |
| Health Technologists | 0 (0.0%) | 0 (0.0%) |
| Total (Category) | 81 (71.1%) | 33 (28.9%) |
| Total (Overall) | 194 (55.3%) | 157 (44.7%) |
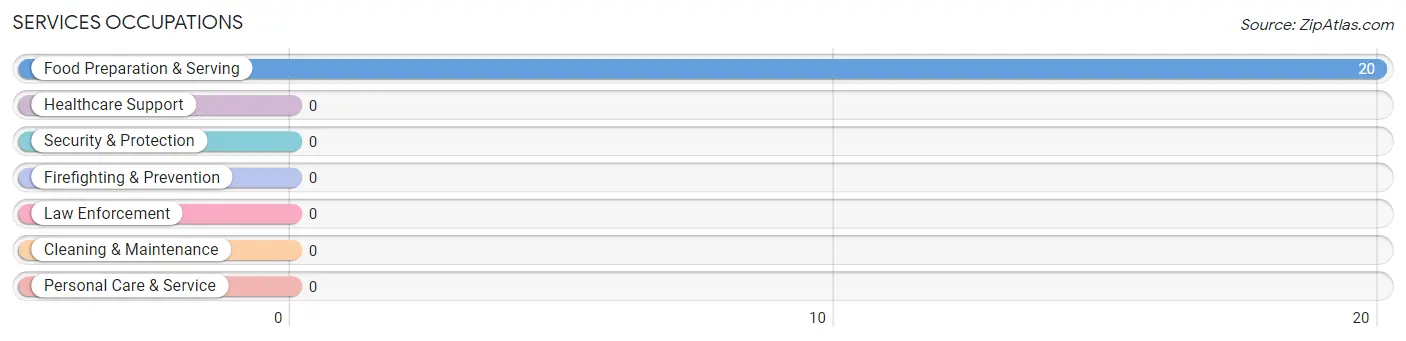
Services Occupations
The most common Services occupations in Petersburg are , and Food Preparation & Serving (20 | 5.7%).
Services Occupations by Sex
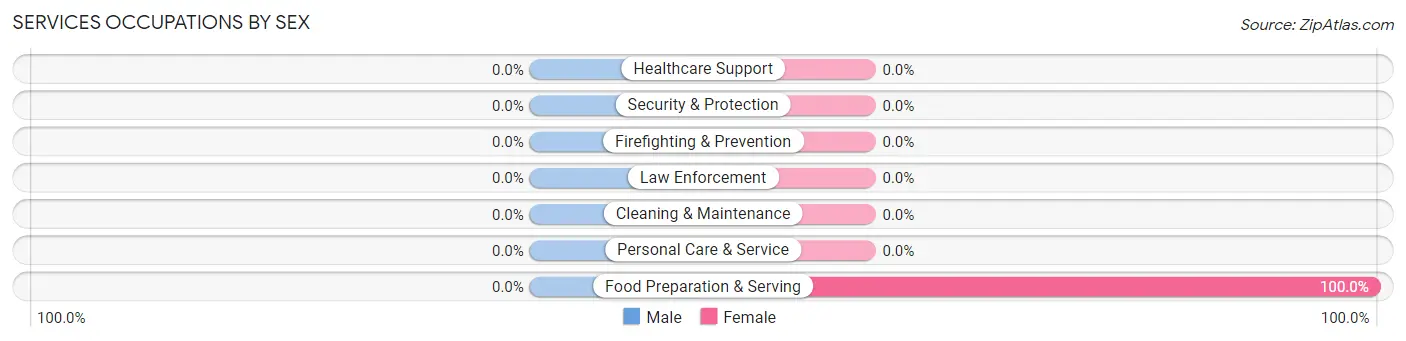
| Occupation | Male | Female |
| Healthcare Support | 0 (0.0%) | 0 (0.0%) |
| Security & Protection | 0 (0.0%) | 0 (0.0%) |
| Firefighting & Prevention | 0 (0.0%) | 0 (0.0%) |
| Law Enforcement | 0 (0.0%) | 0 (0.0%) |
| Food Preparation & Serving | 0 (0.0%) | 20 (100.0%) |
| Cleaning & Maintenance | 0 (0.0%) | 0 (0.0%) |
| Personal Care & Service | 0 (0.0%) | 0 (0.0%) |
| Total (Category) | 0 (0.0%) | 20 (100.0%) |
| Total (Overall) | 194 (55.3%) | 157 (44.7%) |
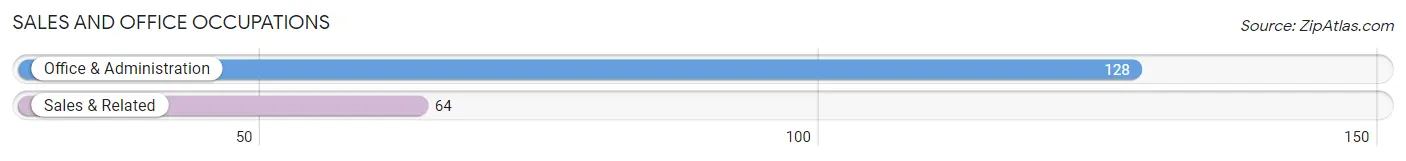
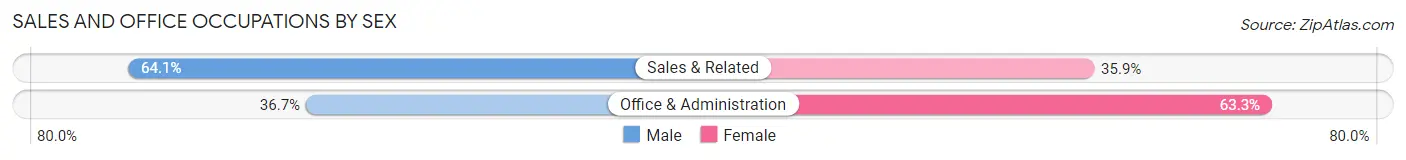
Sales and Office Occupations
The most common Sales and Office occupations in Petersburg are Office & Administration (128 | 36.5%), and Sales & Related (64 | 18.2%).
Sales and Office Occupations by Sex
| Occupation | Male | Female |
| Sales & Related | 41 (64.1%) | 23 (35.9%) |
| Office & Administration | 47 (36.7%) | 81 (63.3%) |
| Total (Category) | 88 (45.8%) | 104 (54.2%) |
| Total (Overall) | 194 (55.3%) | 157 (44.7%) |
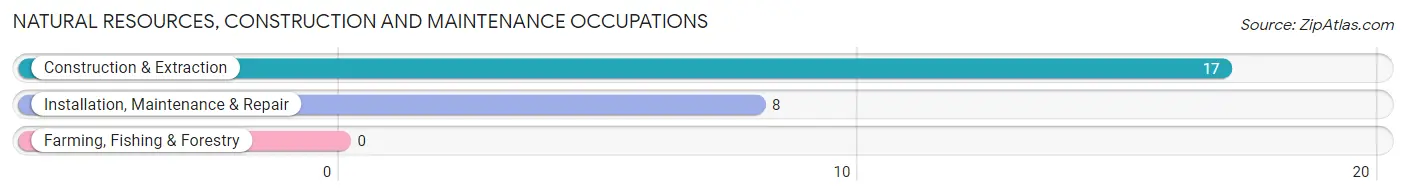
Natural Resources, Construction and Maintenance Occupations
The most common Natural Resources, Construction and Maintenance occupations in Petersburg are Construction & Extraction (17 | 4.8%), and Installation, Maintenance & Repair (8 | 2.3%).
Natural Resources, Construction and Maintenance Occupations by Sex
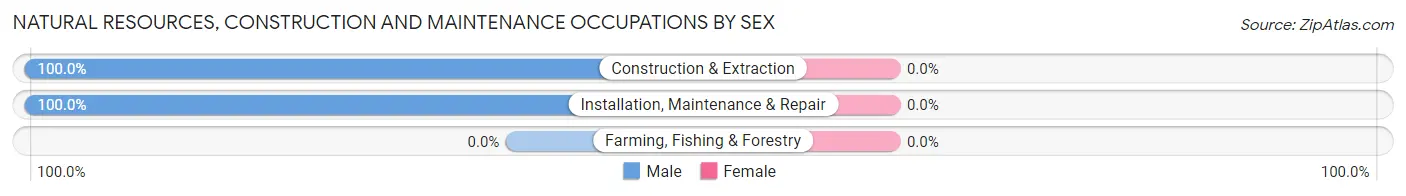
| Occupation | Male | Female |
| Farming, Fishing & Forestry | 0 (0.0%) | 0 (0.0%) |
| Construction & Extraction | 17 (100.0%) | 0 (0.0%) |
| Installation, Maintenance & Repair | 8 (100.0%) | 0 (0.0%) |
| Total (Category) | 25 (100.0%) | 0 (0.0%) |
| Total (Overall) | 194 (55.3%) | 157 (44.7%) |
Production, Transportation and Moving Occupations
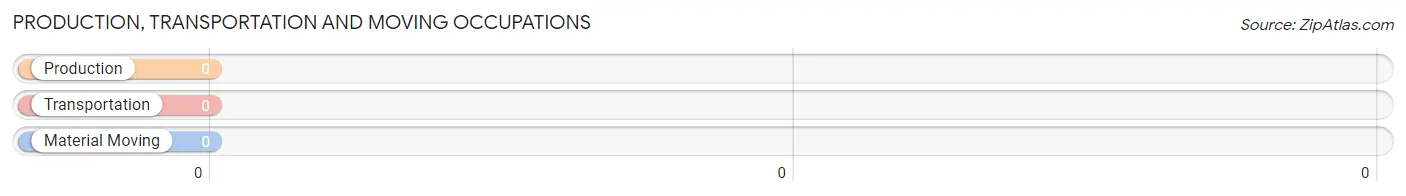
Production, Transportation and Moving Occupations by Sex
| Occupation | Male | Female |
| Production | 0 (0.0%) | 0 (0.0%) |
| Transportation | 0 (0.0%) | 0 (0.0%) |
| Material Moving | 0 (0.0%) | 0 (0.0%) |
| Total (Category) | 0 (0.0%) | 0 (0.0%) |
| Total (Overall) | 194 (55.3%) | 157 (44.7%) |
Employment Industries by Sex in Petersburg
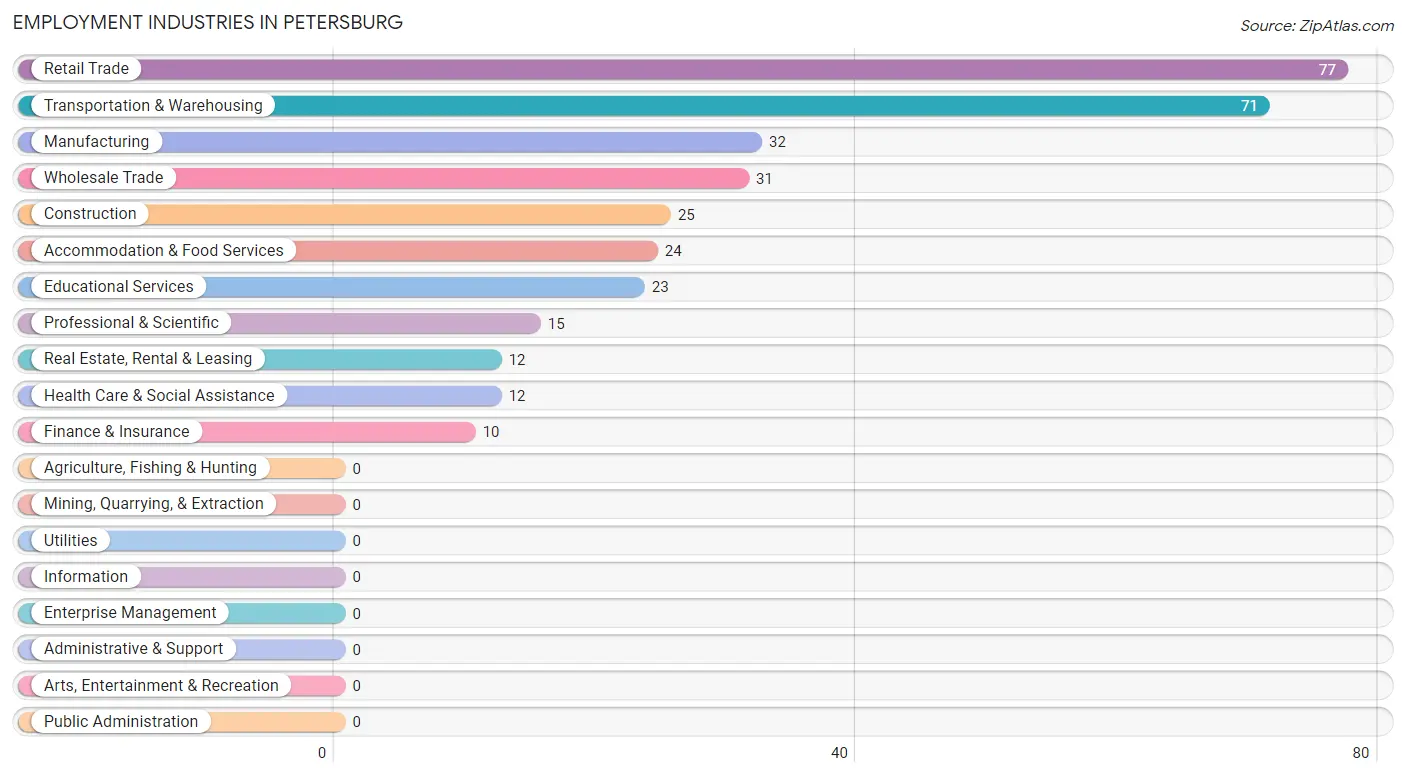
Employment Industries in Petersburg
The major employment industries in Petersburg include Retail Trade (77 | 21.9%), Transportation & Warehousing (71 | 20.2%), Manufacturing (32 | 9.1%), Wholesale Trade (31 | 8.8%), and Construction (25 | 7.1%).
Employment Industries by Sex in Petersburg
The Petersburg industries that see more men than women are Construction (100.0%), Wholesale Trade (100.0%), and Professional & Scientific (100.0%), whereas the industries that tend to have a higher number of women are Manufacturing (100.0%), Finance & Insurance (100.0%), and Real Estate, Rental & Leasing (100.0%).

| Industry | Male | Female |
| Agriculture, Fishing & Hunting | 0 (0.0%) | 0 (0.0%) |
| Mining, Quarrying, & Extraction | 0 (0.0%) | 0 (0.0%) |
| Construction | 25 (100.0%) | 0 (0.0%) |
| Manufacturing | 0 (0.0%) | 32 (100.0%) |
| Wholesale Trade | 31 (100.0%) | 0 (0.0%) |
| Retail Trade | 53 (68.8%) | 24 (31.2%) |
| Transportation & Warehousing | 35 (49.3%) | 36 (50.7%) |
| Utilities | 0 (0.0%) | 0 (0.0%) |
| Information | 0 (0.0%) | 0 (0.0%) |
| Finance & Insurance | 0 (0.0%) | 10 (100.0%) |
| Real Estate, Rental & Leasing | 0 (0.0%) | 12 (100.0%) |
| Professional & Scientific | 15 (100.0%) | 0 (0.0%) |
| Enterprise Management | 0 (0.0%) | 0 (0.0%) |
| Administrative & Support | 0 (0.0%) | 0 (0.0%) |
| Educational Services | 0 (0.0%) | 23 (100.0%) |
| Health Care & Social Assistance | 12 (100.0%) | 0 (0.0%) |
| Arts, Entertainment & Recreation | 0 (0.0%) | 0 (0.0%) |
| Accommodation & Food Services | 13 (54.2%) | 11 (45.8%) |
| Public Administration | 0 (0.0%) | 0 (0.0%) |
| Total | 194 (55.3%) | 157 (44.7%) |
Education in Petersburg
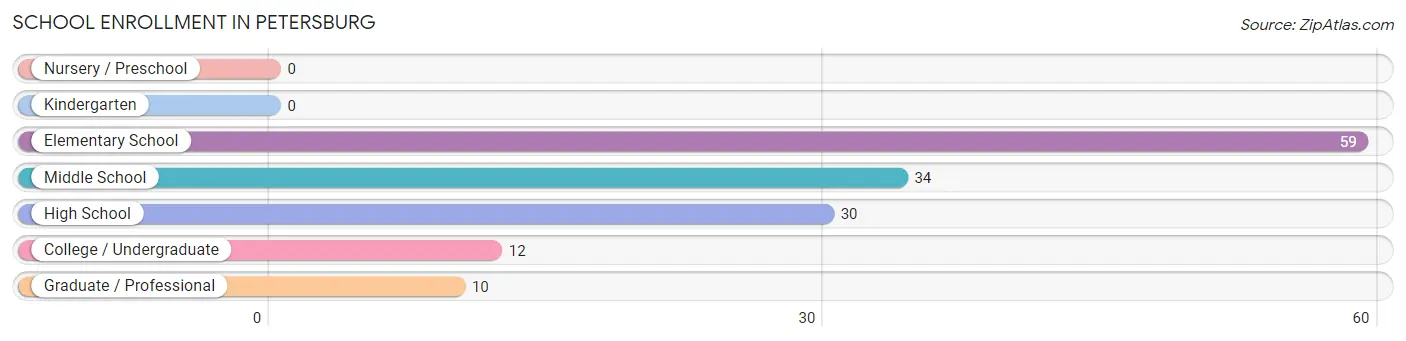
School Enrollment in Petersburg
The most common levels of schooling among the 145 students in Petersburg are elementary school (59 | 40.7%), middle school (34 | 23.4%), and high school (30 | 20.7%).
| School Level | # Students | % Students |
| Nursery / Preschool | 0 | 0.0% |
| Kindergarten | 0 | 0.0% |
| Elementary School | 59 | 40.7% |
| Middle School | 34 | 23.4% |
| High School | 30 | 20.7% |
| College / Undergraduate | 12 | 8.3% |
| Graduate / Professional | 10 | 6.9% |
| Total | 145 | 100.0% |
School Enrollment by Age by Funding Source in Petersburg
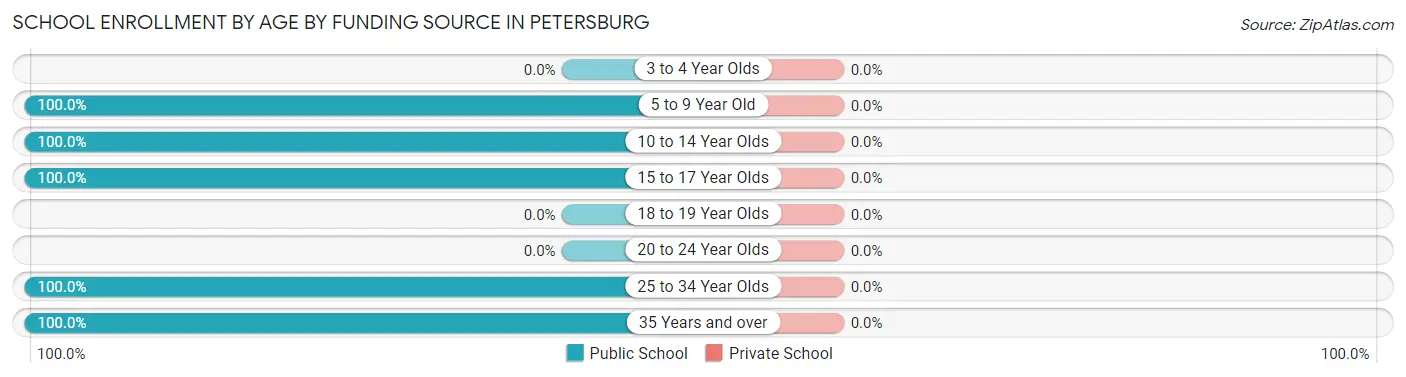
| Age Bracket | Public School | Private School |
| 3 to 4 Year Olds | 0 (0.0%) | 0 (0.0%) |
| 5 to 9 Year Old | 59 (100.0%) | 0 (0.0%) |
| 10 to 14 Year Olds | 34 (100.0%) | 0 (0.0%) |
| 15 to 17 Year Olds | 30 (100.0%) | 0 (0.0%) |
| 18 to 19 Year Olds | 0 (0.0%) | 0 (0.0%) |
| 20 to 24 Year Olds | 0 (0.0%) | 0 (0.0%) |
| 25 to 34 Year Olds | 10 (100.0%) | 0 (0.0%) |
| 35 Years and over | 12 (100.0%) | 0 (0.0%) |
| Total | 145 (100.0%) | 0 (0.0%) |
Educational Attainment by Field of Study in Petersburg
Business (53 | 31.2%), arts & humanities (46 | 27.1%), education (14 | 8.2%), visual & performing arts (13 | 7.6%), and communications (13 | 7.6%) are the most common fields of study among 170 individuals in Petersburg who have obtained a bachelor's degree or higher.
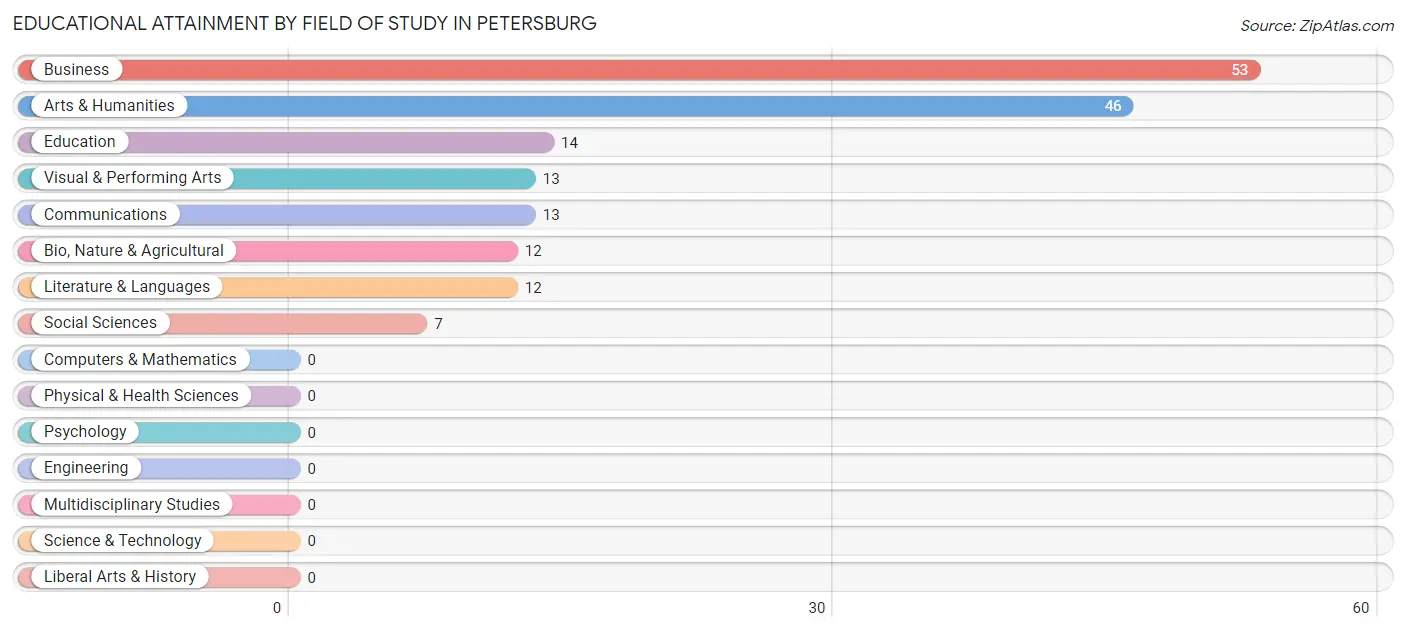
| Field of Study | # Graduates | % Graduates |
| Computers & Mathematics | 0 | 0.0% |
| Bio, Nature & Agricultural | 12 | 7.1% |
| Physical & Health Sciences | 0 | 0.0% |
| Psychology | 0 | 0.0% |
| Social Sciences | 7 | 4.1% |
| Engineering | 0 | 0.0% |
| Multidisciplinary Studies | 0 | 0.0% |
| Science & Technology | 0 | 0.0% |
| Business | 53 | 31.2% |
| Education | 14 | 8.2% |
| Literature & Languages | 12 | 7.1% |
| Liberal Arts & History | 0 | 0.0% |
| Visual & Performing Arts | 13 | 7.6% |
| Communications | 13 | 7.6% |
| Arts & Humanities | 46 | 27.1% |
| Total | 170 | 100.0% |
Transportation & Commute in Petersburg
Vehicle Availability by Sex in Petersburg
The most prevalent vehicle ownership categories in Petersburg are males with 2 vehicles (139, accounting for 71.7%) and females with 2 vehicles (104, making up 88.5%).
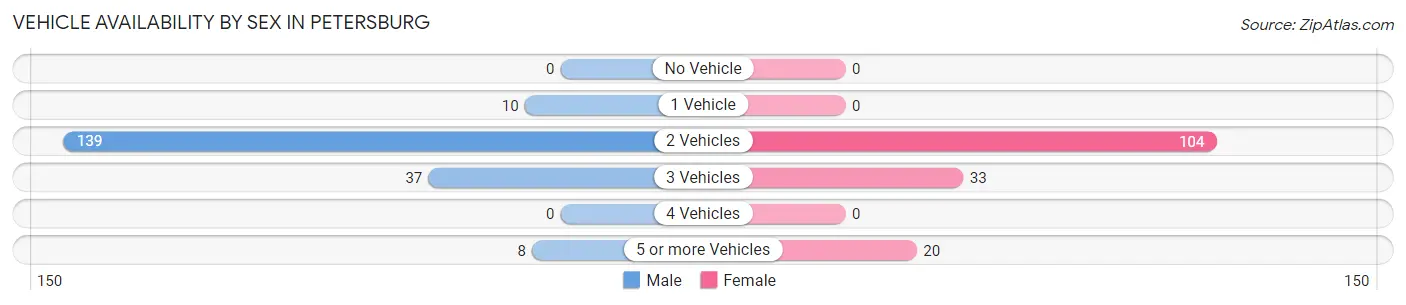
| Vehicles Available | Male | Female |
| No Vehicle | 0 (0.0%) | 0 (0.0%) |
| 1 Vehicle | 10 (5.1%) | 0 (0.0%) |
| 2 Vehicles | 139 (71.7%) | 104 (66.2%) |
| 3 Vehicles | 37 (19.1%) | 33 (21.0%) |
| 4 Vehicles | 0 (0.0%) | 0 (0.0%) |
| 5 or more Vehicles | 8 (4.1%) | 20 (12.7%) |
| Total | 194 (100.0%) | 157 (100.0%) |
Commute Time in Petersburg
The most frequently occuring commute durations in Petersburg are 30 to 34 minutes (127 commuters, 37.2%), 20 to 24 minutes (75 commuters, 22.0%), and 25 to 29 minutes (40 commuters, 11.7%).
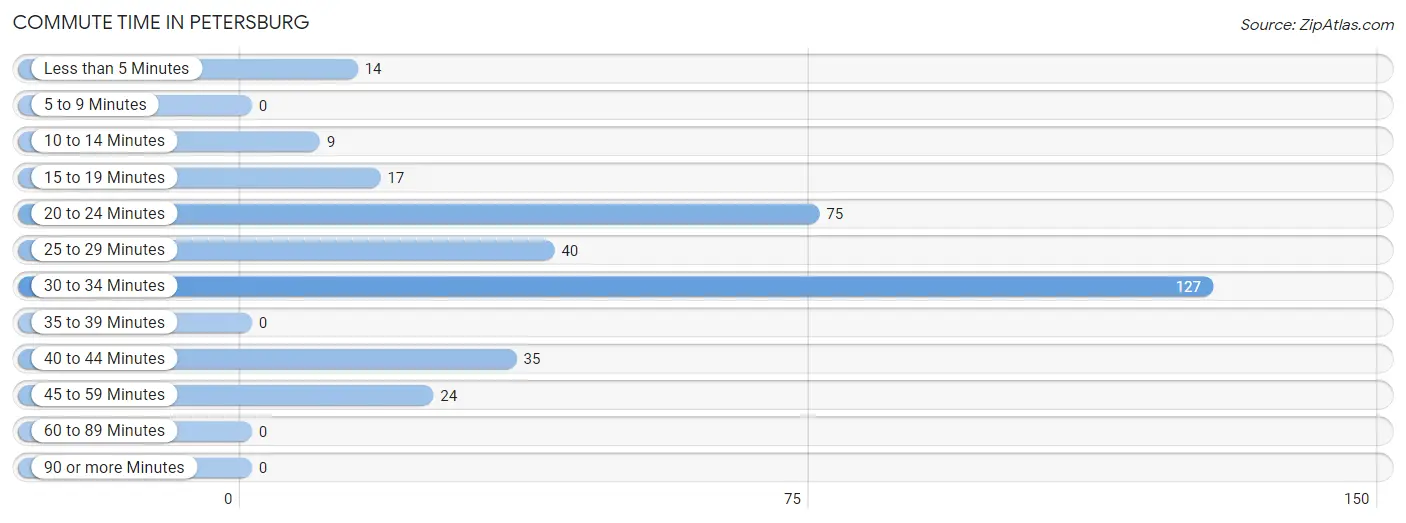
| Commute Time | # Commuters | % Commuters |
| Less than 5 Minutes | 14 | 4.1% |
| 5 to 9 Minutes | 0 | 0.0% |
| 10 to 14 Minutes | 9 | 2.6% |
| 15 to 19 Minutes | 17 | 5.0% |
| 20 to 24 Minutes | 75 | 22.0% |
| 25 to 29 Minutes | 40 | 11.7% |
| 30 to 34 Minutes | 127 | 37.2% |
| 35 to 39 Minutes | 0 | 0.0% |
| 40 to 44 Minutes | 35 | 10.3% |
| 45 to 59 Minutes | 24 | 7.0% |
| 60 to 89 Minutes | 0 | 0.0% |
| 90 or more Minutes | 0 | 0.0% |
Commute Time by Sex in Petersburg
The most common commute times in Petersburg are 30 to 34 minutes (78 commuters, 40.2%) for males and 20 to 24 minutes (75 commuters, 51.0%) for females.
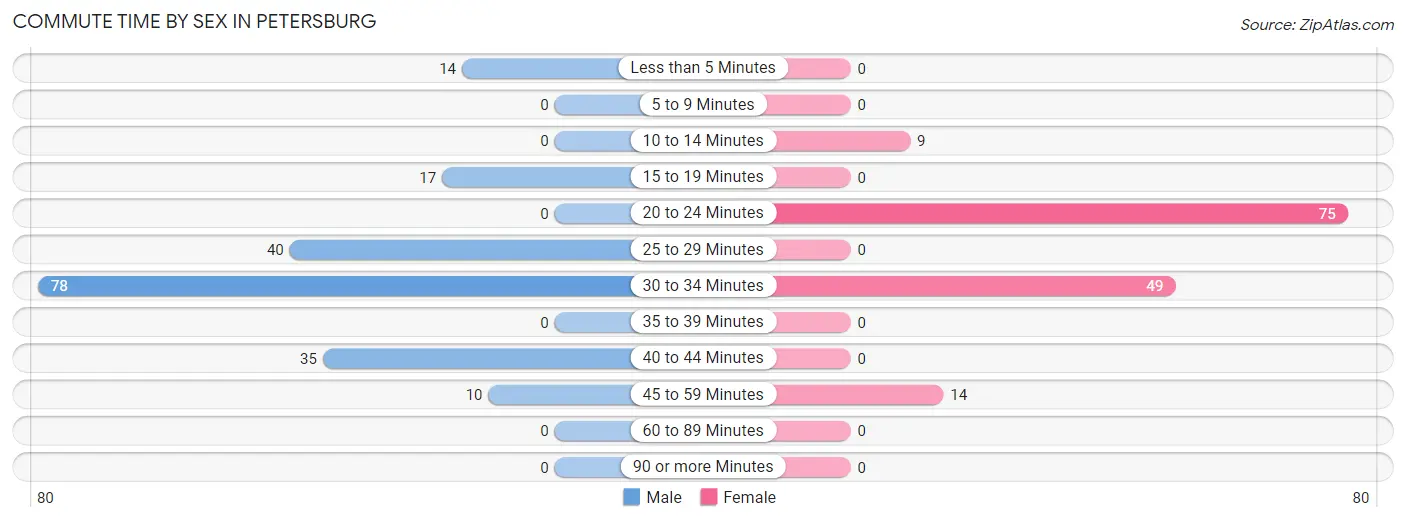
| Commute Time | Male | Female |
| Less than 5 Minutes | 14 (7.2%) | 0 (0.0%) |
| 5 to 9 Minutes | 0 (0.0%) | 0 (0.0%) |
| 10 to 14 Minutes | 0 (0.0%) | 9 (6.1%) |
| 15 to 19 Minutes | 17 (8.8%) | 0 (0.0%) |
| 20 to 24 Minutes | 0 (0.0%) | 75 (51.0%) |
| 25 to 29 Minutes | 40 (20.6%) | 0 (0.0%) |
| 30 to 34 Minutes | 78 (40.2%) | 49 (33.3%) |
| 35 to 39 Minutes | 0 (0.0%) | 0 (0.0%) |
| 40 to 44 Minutes | 35 (18.0%) | 0 (0.0%) |
| 45 to 59 Minutes | 10 (5.1%) | 14 (9.5%) |
| 60 to 89 Minutes | 0 (0.0%) | 0 (0.0%) |
| 90 or more Minutes | 0 (0.0%) | 0 (0.0%) |
Time of Departure to Work by Sex in Petersburg
The most frequent times of departure to work in Petersburg are 10:00 AM to 10:59 AM (52, 26.8%) for males and 12:00 AM to 4:59 AM (48, 32.7%) for females.
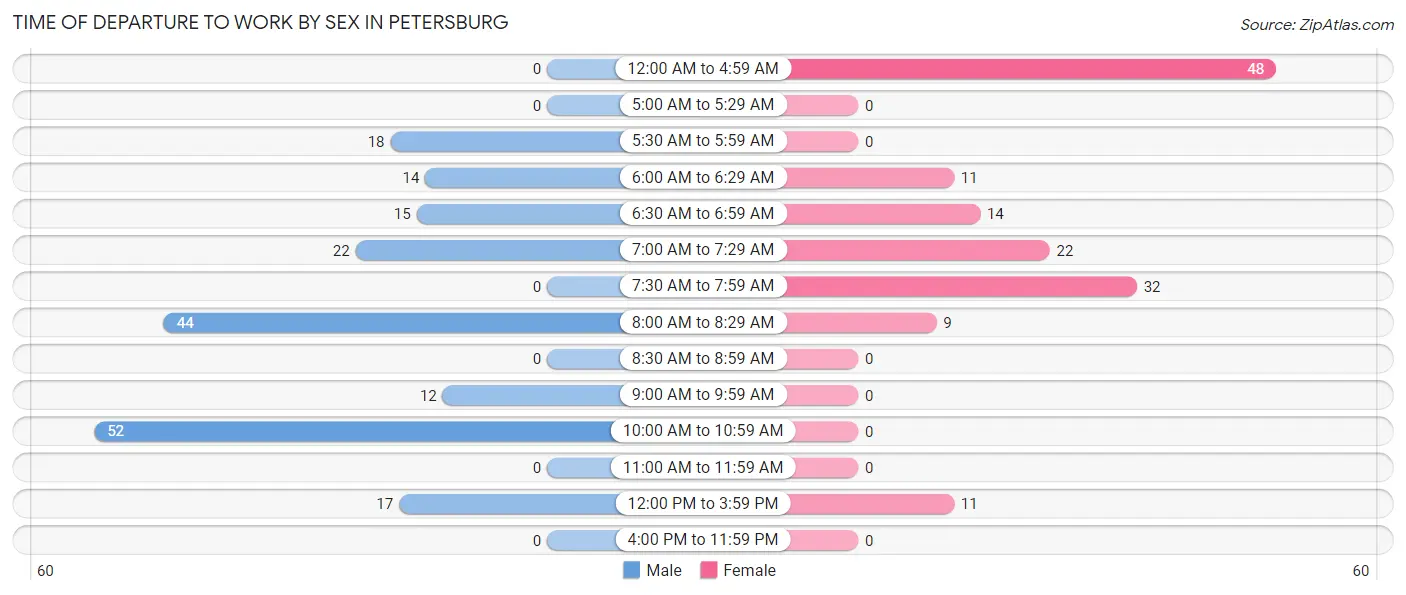
| Time of Departure | Male | Female |
| 12:00 AM to 4:59 AM | 0 (0.0%) | 48 (32.7%) |
| 5:00 AM to 5:29 AM | 0 (0.0%) | 0 (0.0%) |
| 5:30 AM to 5:59 AM | 18 (9.3%) | 0 (0.0%) |
| 6:00 AM to 6:29 AM | 14 (7.2%) | 11 (7.5%) |
| 6:30 AM to 6:59 AM | 15 (7.7%) | 14 (9.5%) |
| 7:00 AM to 7:29 AM | 22 (11.3%) | 22 (15.0%) |
| 7:30 AM to 7:59 AM | 0 (0.0%) | 32 (21.8%) |
| 8:00 AM to 8:29 AM | 44 (22.7%) | 9 (6.1%) |
| 8:30 AM to 8:59 AM | 0 (0.0%) | 0 (0.0%) |
| 9:00 AM to 9:59 AM | 12 (6.2%) | 0 (0.0%) |
| 10:00 AM to 10:59 AM | 52 (26.8%) | 0 (0.0%) |
| 11:00 AM to 11:59 AM | 0 (0.0%) | 0 (0.0%) |
| 12:00 PM to 3:59 PM | 17 (8.8%) | 11 (7.5%) |
| 4:00 PM to 11:59 PM | 0 (0.0%) | 0 (0.0%) |
| Total | 194 (100.0%) | 147 (100.0%) |
Housing Occupancy in Petersburg
Occupancy by Ownership in Petersburg
Of the total 166 dwellings in Petersburg, owner-occupied units account for 166 (100.0%), while renter-occupied units make up 0 (0.0%).
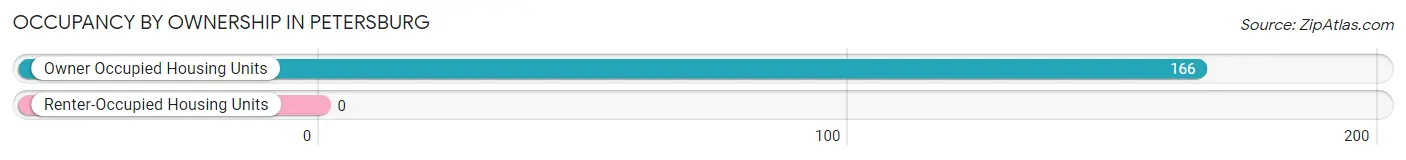
| Occupancy | # Housing Units | % Housing Units |
| Owner Occupied Housing Units | 166 | 100.0% |
| Renter-Occupied Housing Units | 0 | 0.0% |
| Total Occupied Housing Units | 166 | 100.0% |
Occupancy by Household Size in Petersburg
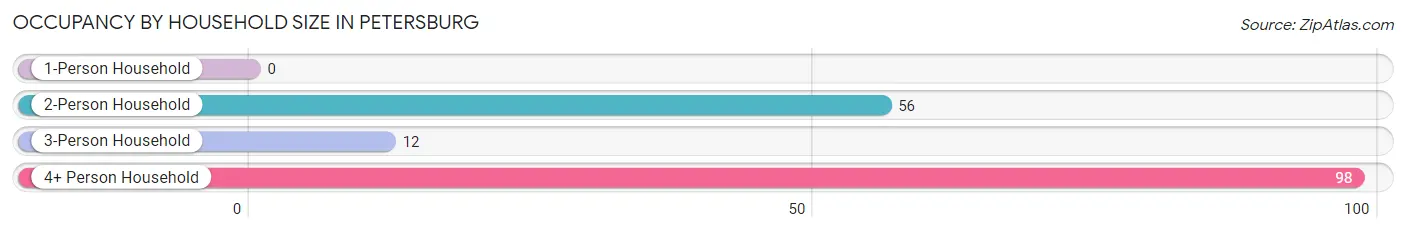
| Household Size | # Housing Units | % Housing Units |
| 1-Person Household | 0 | 0.0% |
| 2-Person Household | 56 | 33.7% |
| 3-Person Household | 12 | 7.2% |
| 4+ Person Household | 98 | 59.0% |
| Total Housing Units | 166 | 100.0% |
Occupancy by Ownership by Household Size in Petersburg
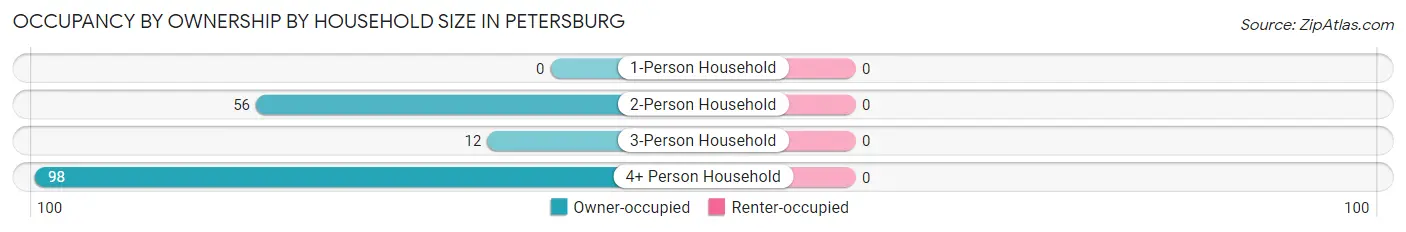
| Household Size | Owner-occupied | Renter-occupied |
| 1-Person Household | 0 (0.0%) | 0 (0.0%) |
| 2-Person Household | 56 (100.0%) | 0 (0.0%) |
| 3-Person Household | 12 (100.0%) | 0 (0.0%) |
| 4+ Person Household | 98 (100.0%) | 0 (0.0%) |
| Total Housing Units | 166 (100.0%) | 0 (0.0%) |
Occupancy by Educational Attainment in Petersburg
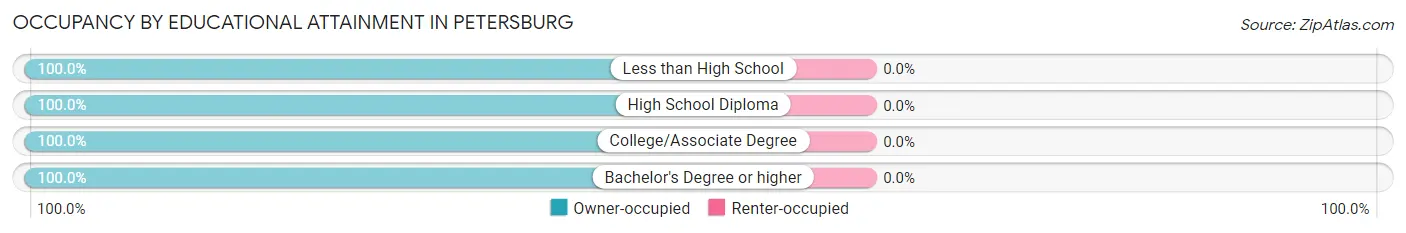
| Household Size | Owner-occupied | Renter-occupied |
| Less than High School | 10 (100.0%) | 0 (0.0%) |
| High School Diploma | 33 (100.0%) | 0 (0.0%) |
| College/Associate Degree | 24 (100.0%) | 0 (0.0%) |
| Bachelor's Degree or higher | 99 (100.0%) | 0 (0.0%) |
Occupancy by Age of Householder in Petersburg
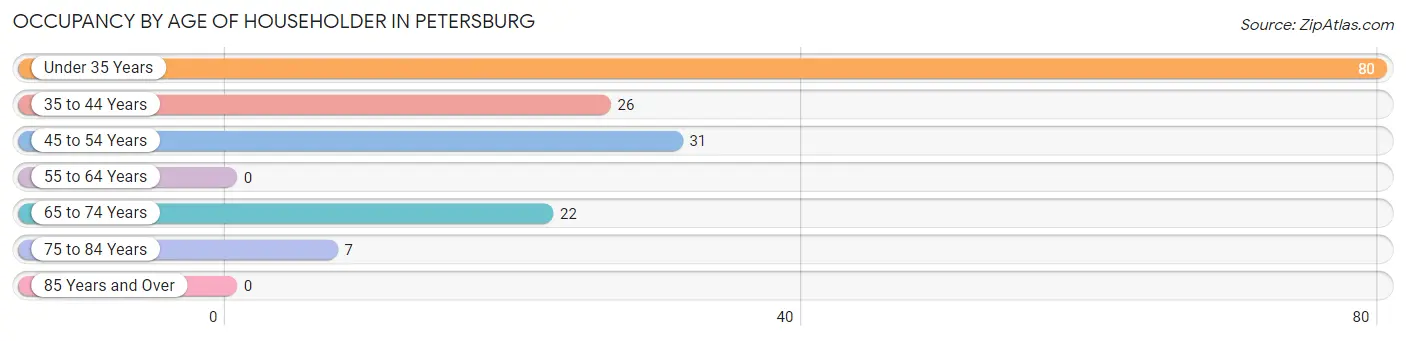
| Age Bracket | # Households | % Households |
| Under 35 Years | 80 | 48.2% |
| 35 to 44 Years | 26 | 15.7% |
| 45 to 54 Years | 31 | 18.7% |
| 55 to 64 Years | 0 | 0.0% |
| 65 to 74 Years | 22 | 13.3% |
| 75 to 84 Years | 7 | 4.2% |
| 85 Years and Over | 0 | 0.0% |
| Total | 166 | 100.0% |
Housing Finances in Petersburg
Median Income by Occupancy in Petersburg
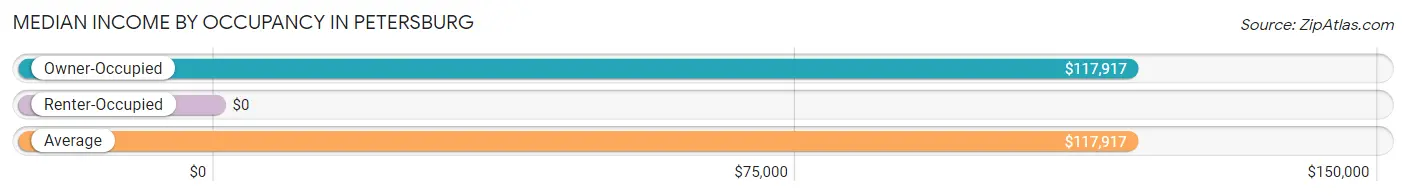
| Occupancy Type | # Households | Median Income |
| Owner-Occupied | 166 (100.0%) | $117,917 |
| Renter-Occupied | 0 (0.0%) | $0 |
| Average | 166 (100.0%) | $117,917 |
Occupancy by Householder Income Bracket in Petersburg
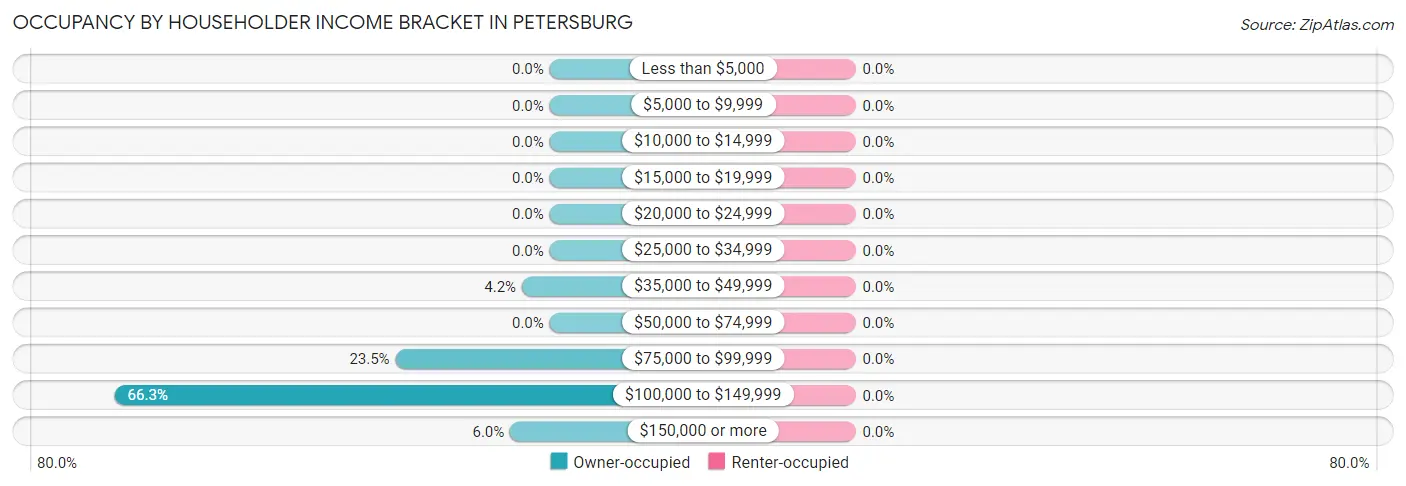
| Income Bracket | Owner-occupied | Renter-occupied |
| Less than $5,000 | 0 (0.0%) | 0 (0.0%) |
| $5,000 to $9,999 | 0 (0.0%) | 0 (0.0%) |
| $10,000 to $14,999 | 0 (0.0%) | 0 (0.0%) |
| $15,000 to $19,999 | 0 (0.0%) | 0 (0.0%) |
| $20,000 to $24,999 | 0 (0.0%) | 0 (0.0%) |
| $25,000 to $34,999 | 0 (0.0%) | 0 (0.0%) |
| $35,000 to $49,999 | 7 (4.2%) | 0 (0.0%) |
| $50,000 to $74,999 | 0 (0.0%) | 0 (0.0%) |
| $75,000 to $99,999 | 39 (23.5%) | 0 (0.0%) |
| $100,000 to $149,999 | 110 (66.3%) | 0 (0.0%) |
| $150,000 or more | 10 (6.0%) | 0 (0.0%) |
| Total | 166 (100.0%) | 0 (0.0%) |
Monthly Housing Cost Tiers in Petersburg
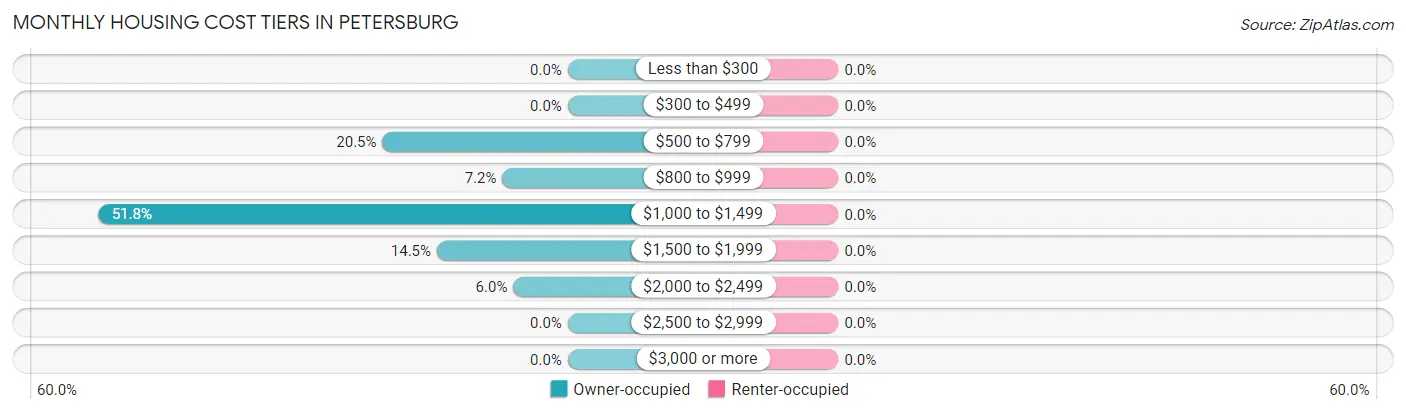
| Monthly Cost | Owner-occupied | Renter-occupied |
| Less than $300 | 0 (0.0%) | 0 (0.0%) |
| $300 to $499 | 0 (0.0%) | 0 (0.0%) |
| $500 to $799 | 34 (20.5%) | 0 (0.0%) |
| $800 to $999 | 12 (7.2%) | 0 (0.0%) |
| $1,000 to $1,499 | 86 (51.8%) | 0 (0.0%) |
| $1,500 to $1,999 | 24 (14.5%) | 0 (0.0%) |
| $2,000 to $2,499 | 10 (6.0%) | 0 (0.0%) |
| $2,500 to $2,999 | 0 (0.0%) | 0 (0.0%) |
| $3,000 or more | 0 (0.0%) | 0 (0.0%) |
| Total | 166 (100.0%) | 0 (0.0%) |
Physical Housing Characteristics in Petersburg
Housing Structures in Petersburg
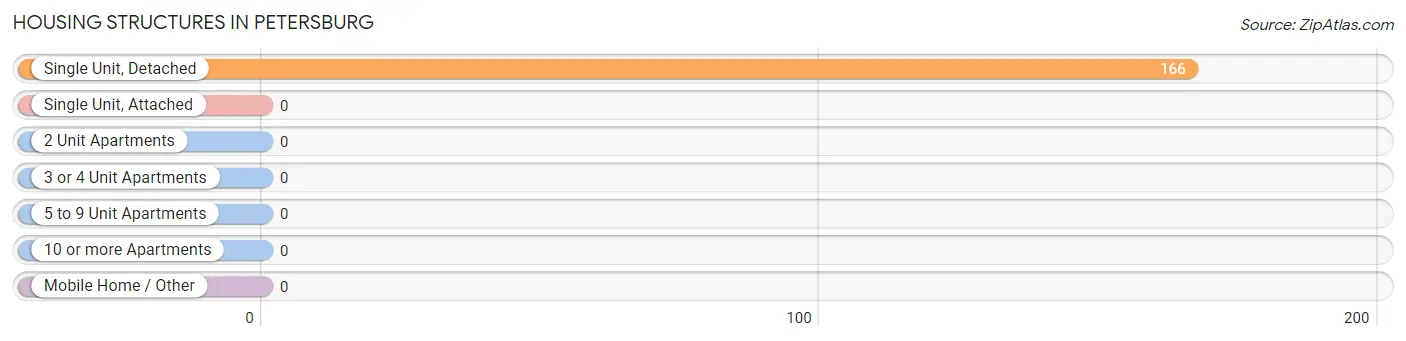
| Structure Type | # Housing Units | % Housing Units |
| Single Unit, Detached | 166 | 100.0% |
| Single Unit, Attached | 0 | 0.0% |
| 2 Unit Apartments | 0 | 0.0% |
| 3 or 4 Unit Apartments | 0 | 0.0% |
| 5 to 9 Unit Apartments | 0 | 0.0% |
| 10 or more Apartments | 0 | 0.0% |
| Mobile Home / Other | 0 | 0.0% |
| Total | 166 | 100.0% |
Housing Structures by Occupancy in Petersburg
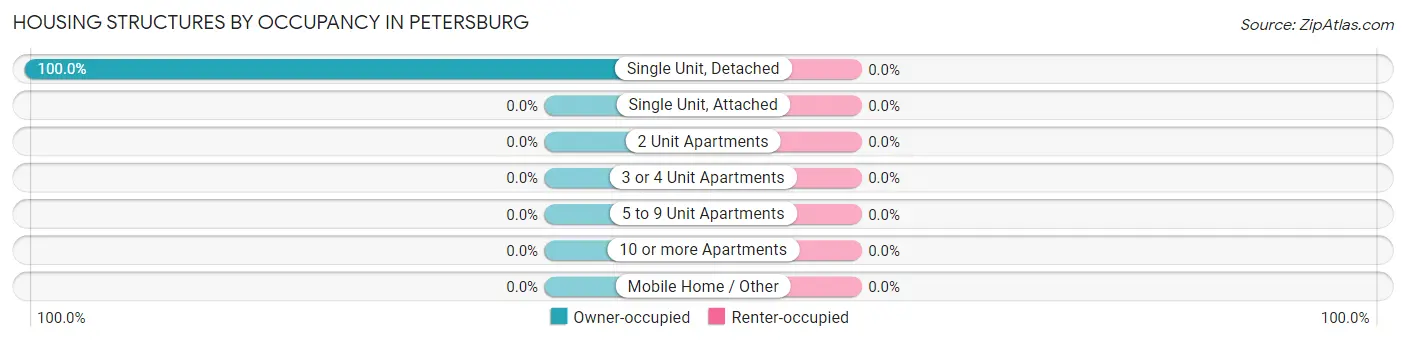
| Structure Type | Owner-occupied | Renter-occupied |
| Single Unit, Detached | 166 (100.0%) | 0 (0.0%) |
| Single Unit, Attached | 0 (0.0%) | 0 (0.0%) |
| 2 Unit Apartments | 0 (0.0%) | 0 (0.0%) |
| 3 or 4 Unit Apartments | 0 (0.0%) | 0 (0.0%) |
| 5 to 9 Unit Apartments | 0 (0.0%) | 0 (0.0%) |
| 10 or more Apartments | 0 (0.0%) | 0 (0.0%) |
| Mobile Home / Other | 0 (0.0%) | 0 (0.0%) |
| Total | 166 (100.0%) | 0 (0.0%) |
Housing Structures by Number of Rooms in Petersburg
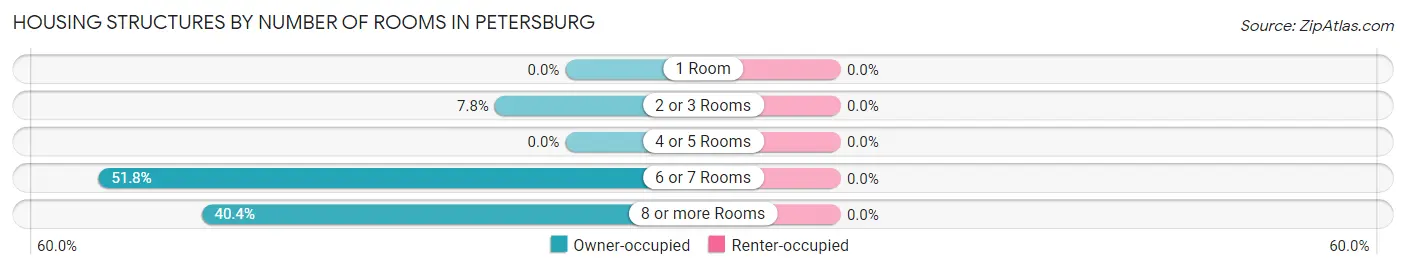
| Number of Rooms | Owner-occupied | Renter-occupied |
| 1 Room | 0 (0.0%) | 0 (0.0%) |
| 2 or 3 Rooms | 13 (7.8%) | 0 (0.0%) |
| 4 or 5 Rooms | 0 (0.0%) | 0 (0.0%) |
| 6 or 7 Rooms | 86 (51.8%) | 0 (0.0%) |
| 8 or more Rooms | 67 (40.4%) | 0 (0.0%) |
| Total | 166 (100.0%) | 0 (0.0%) |
Housing Structure by Heating Type in Petersburg
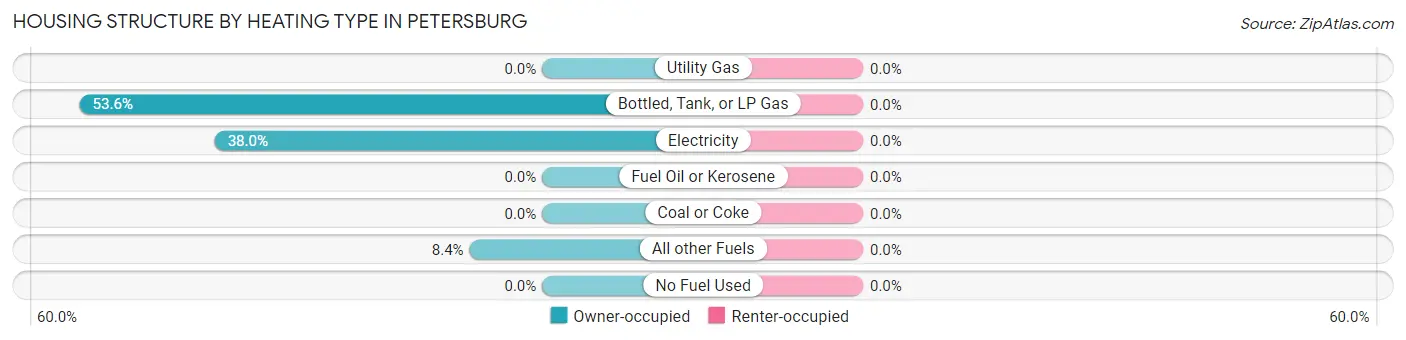
| Heating Type | Owner-occupied | Renter-occupied |
| Utility Gas | 0 (0.0%) | 0 (0.0%) |
| Bottled, Tank, or LP Gas | 89 (53.6%) | 0 (0.0%) |
| Electricity | 63 (38.0%) | 0 (0.0%) |
| Fuel Oil or Kerosene | 0 (0.0%) | 0 (0.0%) |
| Coal or Coke | 0 (0.0%) | 0 (0.0%) |
| All other Fuels | 14 (8.4%) | 0 (0.0%) |
| No Fuel Used | 0 (0.0%) | 0 (0.0%) |
| Total | 166 (100.0%) | 0 (0.0%) |
Household Vehicle Usage in Petersburg
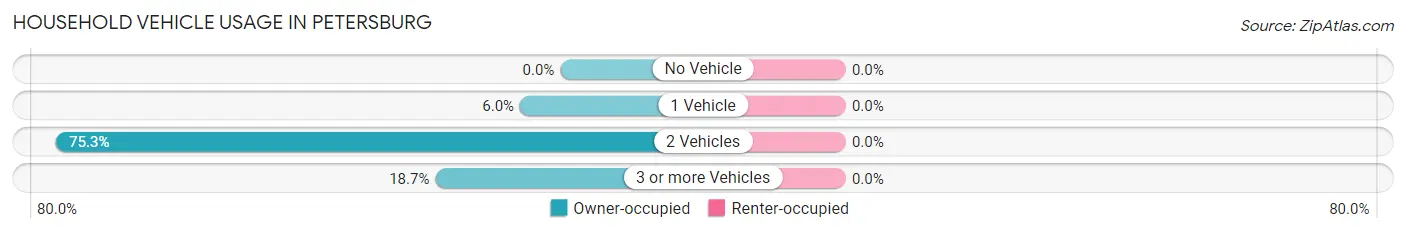
| Vehicles per Household | Owner-occupied | Renter-occupied |
| No Vehicle | 0 (0.0%) | 0 (0.0%) |
| 1 Vehicle | 10 (6.0%) | 0 (0.0%) |
| 2 Vehicles | 125 (75.3%) | 0 (0.0%) |
| 3 or more Vehicles | 31 (18.7%) | 0 (0.0%) |
| Total | 166 (100.0%) | 0 (0.0%) |
Real Estate & Mortgages in Petersburg
Real Estate and Mortgage Overview in Petersburg
| Characteristic | Without Mortgage | With Mortgage |
| Housing Units | 21 | 145 |
| Median Property Value | - | - |
| Median Household Income | - | - |
| Monthly Housing Costs | - | - |
| Real Estate Taxes | - | - |
Property Value by Mortgage Status in Petersburg
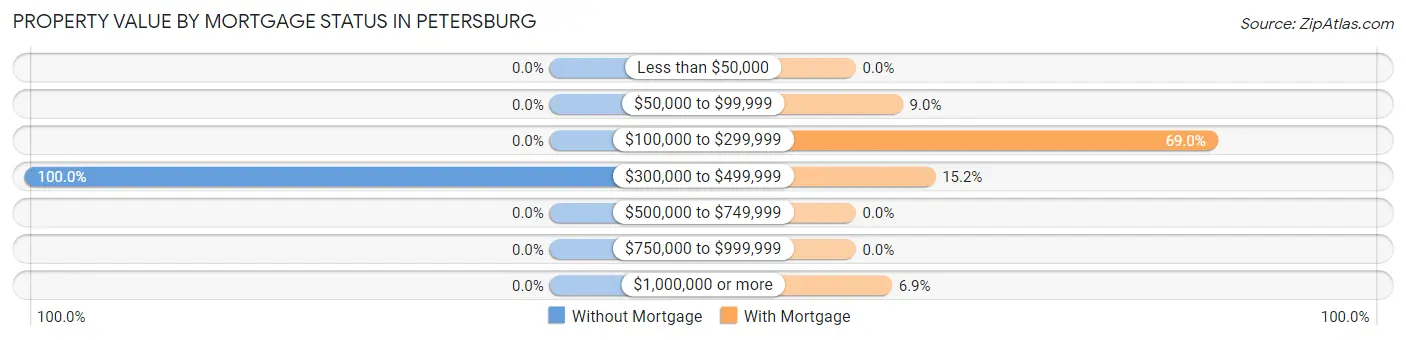
| Property Value | Without Mortgage | With Mortgage |
| Less than $50,000 | 0 (0.0%) | 0 (0.0%) |
| $50,000 to $99,999 | 0 (0.0%) | 13 (9.0%) |
| $100,000 to $299,999 | 0 (0.0%) | 100 (69.0%) |
| $300,000 to $499,999 | 21 (100.0%) | 22 (15.2%) |
| $500,000 to $749,999 | 0 (0.0%) | 0 (0.0%) |
| $750,000 to $999,999 | 0 (0.0%) | 0 (0.0%) |
| $1,000,000 or more | 0 (0.0%) | 10 (6.9%) |
| Total | 21 (100.0%) | 145 (100.0%) |
Household Income by Mortgage Status in Petersburg
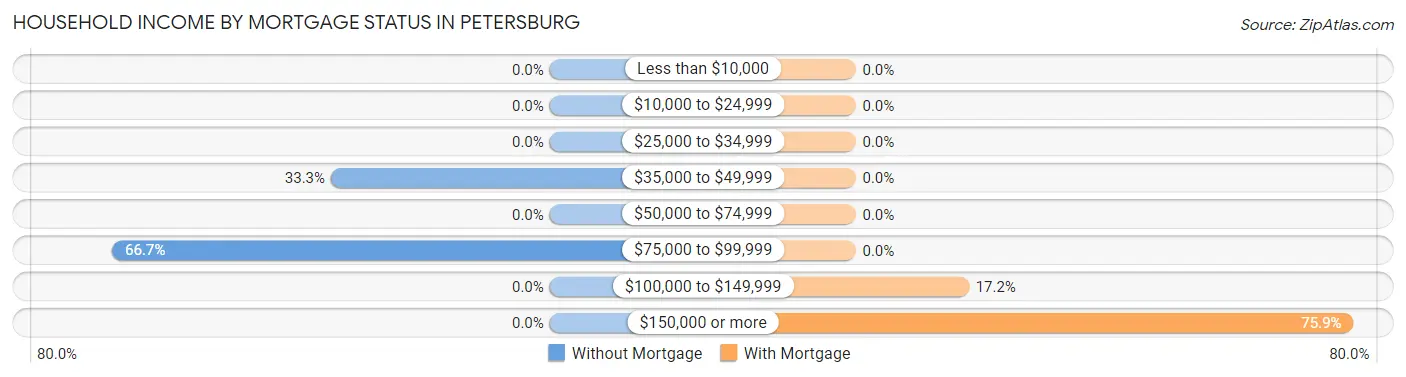
| Household Income | Without Mortgage | With Mortgage |
| Less than $10,000 | 0 (0.0%) | 0 (0.0%) |
| $10,000 to $24,999 | 0 (0.0%) | 0 (0.0%) |
| $25,000 to $34,999 | 0 (0.0%) | 0 (0.0%) |
| $35,000 to $49,999 | 7 (33.3%) | 0 (0.0%) |
| $50,000 to $74,999 | 0 (0.0%) | 0 (0.0%) |
| $75,000 to $99,999 | 14 (66.7%) | 0 (0.0%) |
| $100,000 to $149,999 | 0 (0.0%) | 25 (17.2%) |
| $150,000 or more | 0 (0.0%) | 110 (75.9%) |
| Total | 21 (100.0%) | 145 (100.0%) |
Property Value to Household Income Ratio in Petersburg
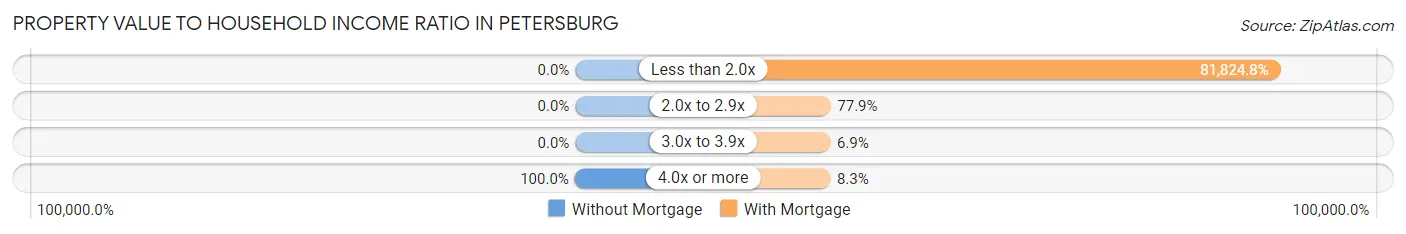
| Value-to-Income Ratio | Without Mortgage | With Mortgage |
| Less than 2.0x | 0 (0.0%) | 118,646 (81,824.8%) |
| 2.0x to 2.9x | 0 (0.0%) | 113 (77.9%) |
| 3.0x to 3.9x | 0 (0.0%) | 10 (6.9%) |
| 4.0x or more | 21 (100.0%) | 12 (8.3%) |
| Total | 21 (100.0%) | 145 (100.0%) |
Real Estate Taxes by Mortgage Status in Petersburg
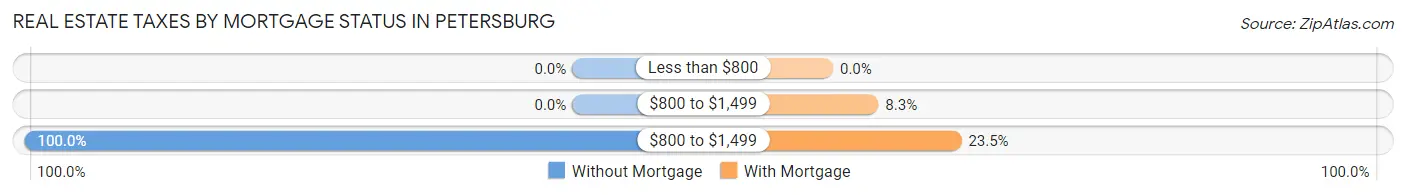
| Property Taxes | Without Mortgage | With Mortgage |
| Less than $800 | 0 (0.0%) | 0 (0.0%) |
| $800 to $1,499 | 0 (0.0%) | 12 (8.3%) |
| $800 to $1,499 | 21 (100.0%) | 34 (23.4%) |
| Total | 21 (100.0%) | 145 (100.0%) |
Health & Disability in Petersburg
Health Insurance Coverage by Age in Petersburg
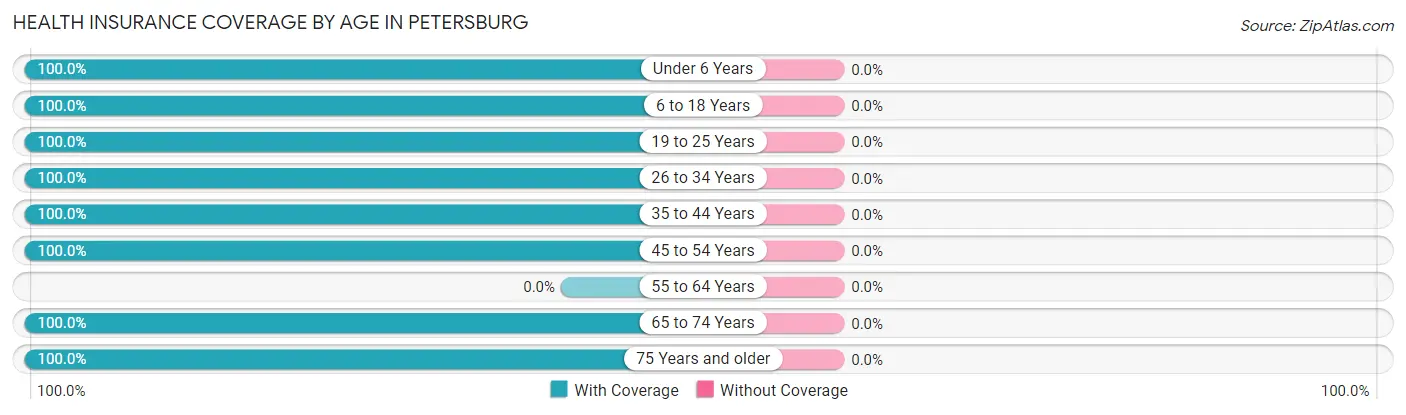
| Age Bracket | With Coverage | Without Coverage |
| Under 6 Years | 69 (100.0%) | 0 (0.0%) |
| 6 to 18 Years | 132 (100.0%) | 0 (0.0%) |
| 19 to 25 Years | 78 (100.0%) | 0 (0.0%) |
| 26 to 34 Years | 159 (100.0%) | 0 (0.0%) |
| 35 to 44 Years | 43 (100.0%) | 0 (0.0%) |
| 45 to 54 Years | 48 (100.0%) | 0 (0.0%) |
| 55 to 64 Years | 0 (0.0%) | 0 (0.0%) |
| 65 to 74 Years | 51 (100.0%) | 0 (0.0%) |
| 75 Years and older | 7 (100.0%) | 0 (0.0%) |
| Total | 587 (100.0%) | 0 (0.0%) |
Health Insurance Coverage by Citizenship Status in Petersburg
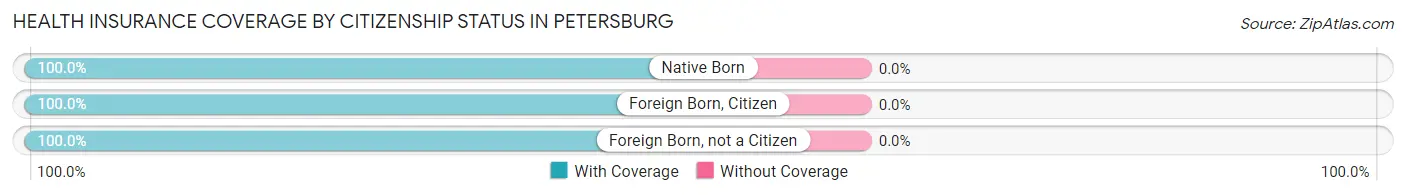
| Citizenship Status | With Coverage | Without Coverage |
| Native Born | 69 (100.0%) | 0 (0.0%) |
| Foreign Born, Citizen | 132 (100.0%) | 0 (0.0%) |
| Foreign Born, not a Citizen | 78 (100.0%) | 0 (0.0%) |
Health Insurance Coverage by Household Income in Petersburg
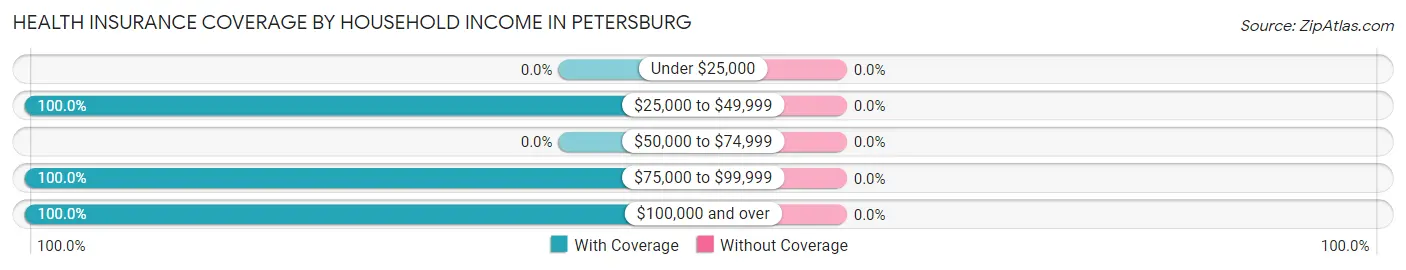
| Household Income | With Coverage | Without Coverage |
| Under $25,000 | 0 (0.0%) | 0 (0.0%) |
| $25,000 to $49,999 | 14 (100.0%) | 0 (0.0%) |
| $50,000 to $74,999 | 0 (0.0%) | 0 (0.0%) |
| $75,000 to $99,999 | 87 (100.0%) | 0 (0.0%) |
| $100,000 and over | 486 (100.0%) | 0 (0.0%) |
Public vs Private Health Insurance Coverage by Age in Petersburg
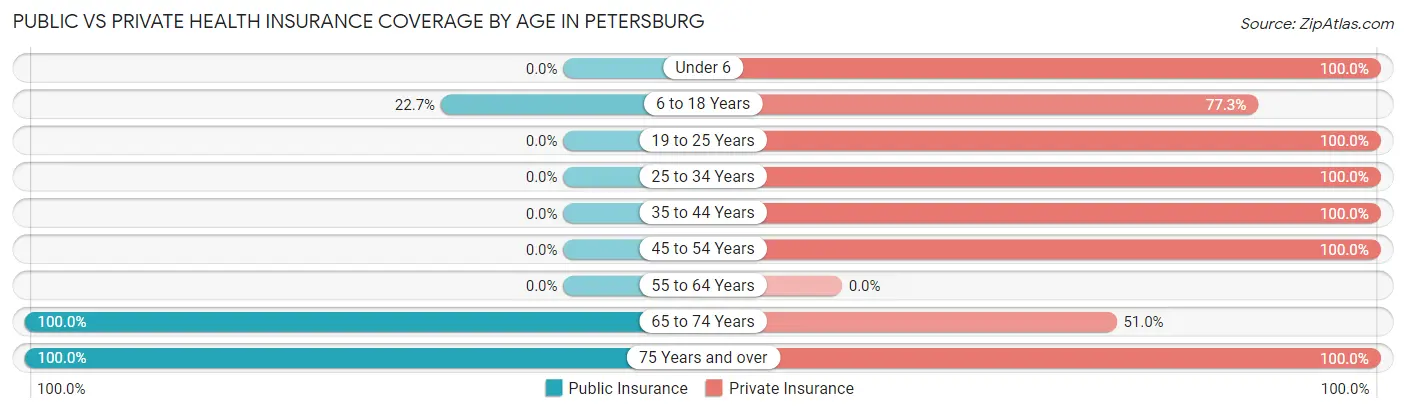
| Age Bracket | Public Insurance | Private Insurance |
| Under 6 | 0 (0.0%) | 69 (100.0%) |
| 6 to 18 Years | 30 (22.7%) | 102 (77.3%) |
| 19 to 25 Years | 0 (0.0%) | 78 (100.0%) |
| 25 to 34 Years | 0 (0.0%) | 159 (100.0%) |
| 35 to 44 Years | 0 (0.0%) | 43 (100.0%) |
| 45 to 54 Years | 0 (0.0%) | 48 (100.0%) |
| 55 to 64 Years | 0 (0.0%) | 0 (0.0%) |
| 65 to 74 Years | 51 (100.0%) | 26 (51.0%) |
| 75 Years and over | 7 (100.0%) | 7 (100.0%) |
| Total | 88 (15.0%) | 532 (90.6%) |
Disability Status by Sex by Age in Petersburg
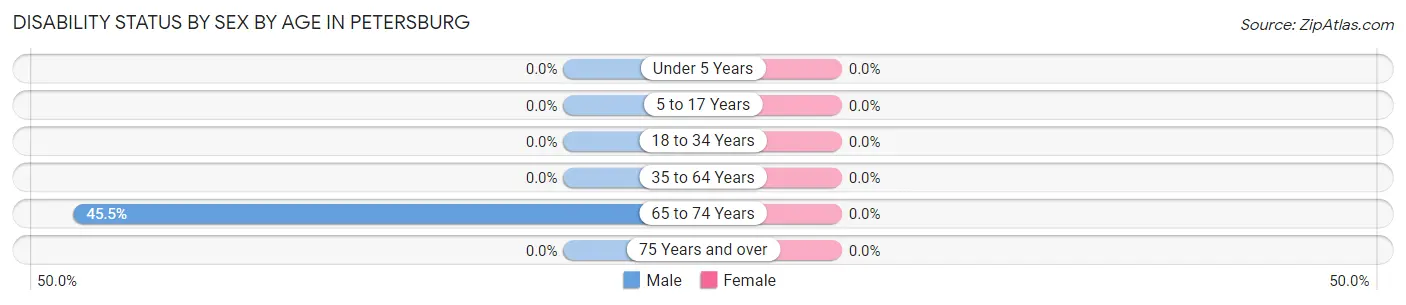
| Age Bracket | Male | Female |
| Under 5 Years | 0 (0.0%) | 0 (0.0%) |
| 5 to 17 Years | 0 (0.0%) | 0 (0.0%) |
| 18 to 34 Years | 0 (0.0%) | 0 (0.0%) |
| 35 to 64 Years | 0 (0.0%) | 0 (0.0%) |
| 65 to 74 Years | 10 (45.5%) | 0 (0.0%) |
| 75 Years and over | 0 (0.0%) | 0 (0.0%) |
Disability Class by Sex by Age in Petersburg
Disability Class: Hearing Difficulty
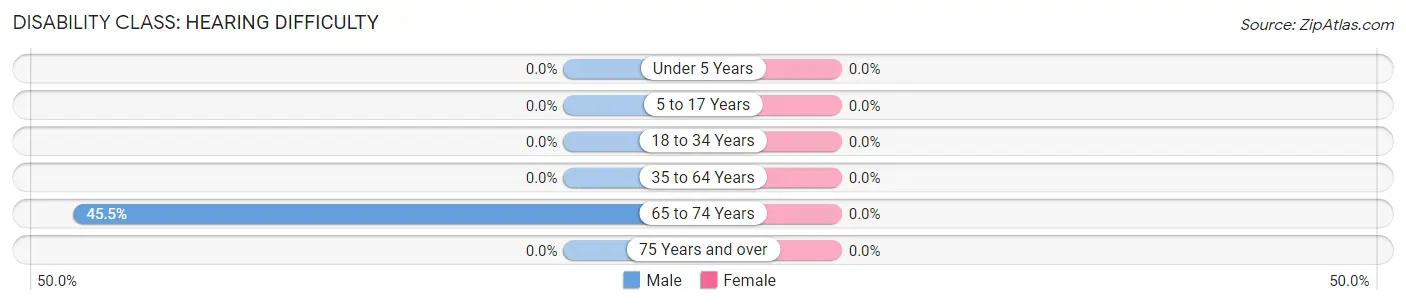
| Age Bracket | Male | Female |
| Under 5 Years | 0 (0.0%) | 0 (0.0%) |
| 5 to 17 Years | 0 (0.0%) | 0 (0.0%) |
| 18 to 34 Years | 0 (0.0%) | 0 (0.0%) |
| 35 to 64 Years | 0 (0.0%) | 0 (0.0%) |
| 65 to 74 Years | 10 (45.5%) | 0 (0.0%) |
| 75 Years and over | 0 (0.0%) | 0 (0.0%) |
Disability Class: Vision Difficulty
| Age Bracket | Male | Female |
| Under 5 Years | 0 (0.0%) | 0 (0.0%) |
| 5 to 17 Years | 0 (0.0%) | 0 (0.0%) |
| 18 to 34 Years | 0 (0.0%) | 0 (0.0%) |
| 35 to 64 Years | 0 (0.0%) | 0 (0.0%) |
| 65 to 74 Years | 0 (0.0%) | 0 (0.0%) |
| 75 Years and over | 0 (0.0%) | 0 (0.0%) |
Disability Class: Cognitive Difficulty
| Age Bracket | Male | Female |
| 5 to 17 Years | 0 (0.0%) | 0 (0.0%) |
| 18 to 34 Years | 0 (0.0%) | 0 (0.0%) |
| 35 to 64 Years | 0 (0.0%) | 0 (0.0%) |
| 65 to 74 Years | 0 (0.0%) | 0 (0.0%) |
| 75 Years and over | 0 (0.0%) | 0 (0.0%) |
Disability Class: Ambulatory Difficulty
| Age Bracket | Male | Female |
| 5 to 17 Years | 0 (0.0%) | 0 (0.0%) |
| 18 to 34 Years | 0 (0.0%) | 0 (0.0%) |
| 35 to 64 Years | 0 (0.0%) | 0 (0.0%) |
| 65 to 74 Years | 0 (0.0%) | 0 (0.0%) |
| 75 Years and over | 0 (0.0%) | 0 (0.0%) |
Disability Class: Self-Care Difficulty
| Age Bracket | Male | Female |
| 5 to 17 Years | 0 (0.0%) | 0 (0.0%) |
| 18 to 34 Years | 0 (0.0%) | 0 (0.0%) |
| 35 to 64 Years | 0 (0.0%) | 0 (0.0%) |
| 65 to 74 Years | 0 (0.0%) | 0 (0.0%) |
| 75 Years and over | 0 (0.0%) | 0 (0.0%) |
Technology Access in Petersburg
Computing Device Access in Petersburg
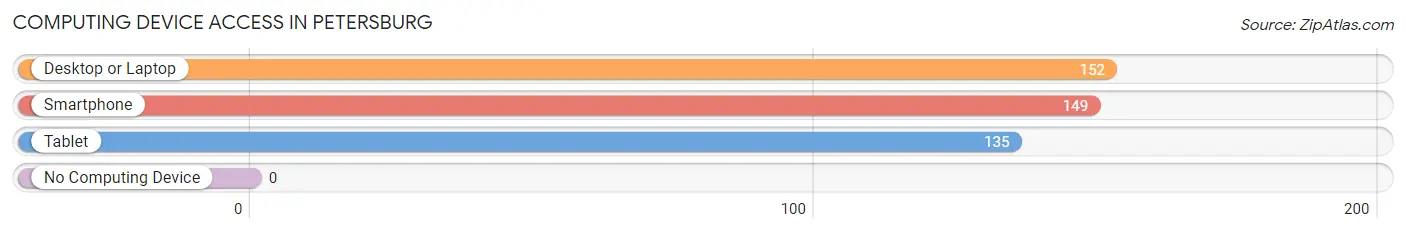
| Device Type | # Households | % Households |
| Desktop or Laptop | 152 | 91.6% |
| Smartphone | 149 | 89.8% |
| Tablet | 135 | 81.3% |
| No Computing Device | 0 | 0.0% |
| Total | 166 | 100.0% |
Internet Access in Petersburg
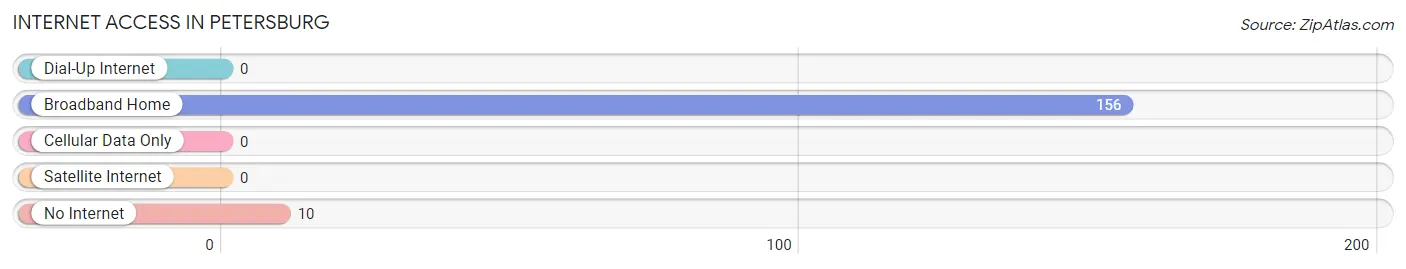
| Internet Type | # Households | % Households |
| Dial-Up Internet | 0 | 0.0% |
| Broadband Home | 156 | 94.0% |
| Cellular Data Only | 0 | 0.0% |
| Satellite Internet | 0 | 0.0% |
| No Internet | 10 | 6.0% |
| Total | 166 | 100.0% |
Petersburg Summary
Petersburg, Kentucky is a small city located in Boone County, Kentucky. It is situated on the banks of the Ohio River, just south of Cincinnati, Ohio. The city has a population of approximately 1,500 people and is part of the Cincinnati metropolitan area.
History
Petersburg was founded in 1817 by a group of settlers from Pennsylvania. The city was named after Peter Smith, one of the original settlers. The city was incorporated in 1820 and was the first city in Boone County.
In the early 19th century, Petersburg was a thriving river port and a major center for the production of tobacco. The city was also home to a number of mills and factories, including a paper mill, a flour mill, and a woolen mill.
In the late 19th century, the city experienced a period of decline as the river port industry declined and the tobacco industry moved away. The city was also affected by the Great Depression and World War II.
Geography
Petersburg is located in Boone County, Kentucky, on the banks of the Ohio River. The city is situated at the intersection of Interstate 75 and US Route 25. The city is approximately 20 miles south of Cincinnati, Ohio.
The city has a total area of 1.2 square miles, all of which is land. The city is located in a hilly region and is surrounded by wooded areas.
Economy
Petersburg’s economy is largely based on agriculture and manufacturing. The city is home to a number of small businesses, including a number of restaurants, retail stores, and service providers.
The city is also home to a number of industrial and manufacturing companies, including a paper mill, a flour mill, and a woolen mill.
Demographics
As of the 2010 census, the population of Petersburg was 1,500. The racial makeup of the city was 97.3% White, 0.7% African American, 0.3% Native American, 0.3% Asian, and 1.3% from other races.
The median household income in Petersburg was $37,500, and the median family income was $45,000. The per capita income in the city was $18,000.
Conclusion
Petersburg, Kentucky is a small city located in Boone County, Kentucky. It is situated on the banks of the Ohio River, just south of Cincinnati, Ohio. The city has a population of approximately 1,500 people and is part of the Cincinnati metropolitan area. The city’s economy is largely based on agriculture and manufacturing, and it is home to a number of small businesses, industrial and manufacturing companies, and restaurants. The racial makeup of the city is predominantly White, with a small percentage of African American, Native American, and Asian residents. The median household income in Petersburg is $37,500, and the median family income is $45,000.
Common Questions
What is Per Capita Income in Petersburg?
Per Capita income in Petersburg is $33,627.
What is the Median Family Income in Petersburg?
Median Family Income in Petersburg is $101,667.
What is the Median Household income in Petersburg?
Median Household Income in Petersburg is $117,917.
What is Income or Wage Gap in Petersburg?
Income or Wage Gap in Petersburg is 4.4%.
Women in Petersburg earn 95.6 cents for every dollar earned by a man.
What is Inequality or Gini Index in Petersburg?
Inequality or Gini Index in Petersburg is 0.15.
What is the Total Population of Petersburg?
Total Population of Petersburg is 587.
What is the Total Male Population of Petersburg?
Total Male Population of Petersburg is 310.
What is the Total Female Population of Petersburg?
Total Female Population of Petersburg is 277.
What is the Ratio of Males per 100 Females in Petersburg?
There are 111.91 Males per 100 Females in Petersburg.
What is the Ratio of Females per 100 Males in Petersburg?
There are 89.35 Females per 100 Males in Petersburg.
What is the Median Population Age in Petersburg?
Median Population Age in Petersburg is 30.0 Years.
What is the Average Family Size in Petersburg
Average Family Size in Petersburg is 3.3 People.
What is the Average Household Size in Petersburg
Average Household Size in Petersburg is 3.5 People.
How Large is the Labor Force in Petersburg?
There are 351 People in the Labor Forcein in Petersburg.
What is the Percentage of People in the Labor Force in Petersburg?
90.9% of People are in the Labor Force in Petersburg.