New Haven, KY Map & Demographics
New Haven Map
New Haven Overview
$31,051
PER CAPITA INCOME
$76,979
AVG FAMILY INCOME
$68,750
AVG HOUSEHOLD INCOME
50.2%
WAGE / INCOME GAP [ % ]
49.8¢/ $1
WAGE / INCOME GAP [ $ ]
0.36
INEQUALITY / GINI INDEX
789
TOTAL POPULATION
360
MALE POPULATION
429
FEMALE POPULATION
83.92
MALES / 100 FEMALES
119.17
FEMALES / 100 MALES
40.5
MEDIAN AGE
2.9
AVG FAMILY SIZE
2.5
AVG HOUSEHOLD SIZE
395
LABOR FORCE [ PEOPLE ]
63.8%
PERCENT IN LABOR FORCE
12.4%
UNEMPLOYMENT RATE
New Haven Zip Codes
New Haven Area Codes
Income in New Haven
Income Overview in New Haven
Per Capita Income in New Haven is $31,051, while median incomes of families and households are $76,979 and $68,750 respectively.
| Characteristic | Number | Measure |
| Per Capita Income | 789 | $31,051 |
| Median Family Income | 221 | $76,979 |
| Mean Family Income | 221 | $85,563 |
| Median Household Income | 322 | $68,750 |
| Mean Household Income | 322 | $74,952 |
| Income Deficit | 221 | $0 |
| Wage / Income Gap (%) | 789 | 50.19% |
| Wage / Income Gap ($) | 789 | 49.81¢ per $1 |
| Gini / Inequality Index | 789 | 0.36 |
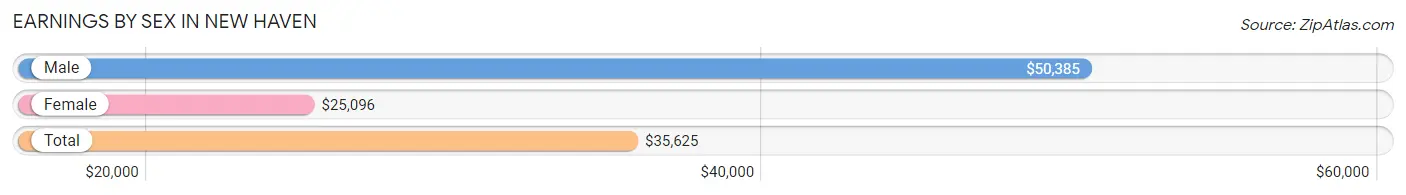
Earnings by Sex in New Haven
Average Earnings in New Haven are $35,625, $50,385 for men and $25,096 for women, a difference of 50.2%.
| Sex | Number | Average Earnings |
| Male | 208 (52.1%) | $50,385 |
| Female | 191 (47.9%) | $25,096 |
| Total | 399 (100.0%) | $35,625 |
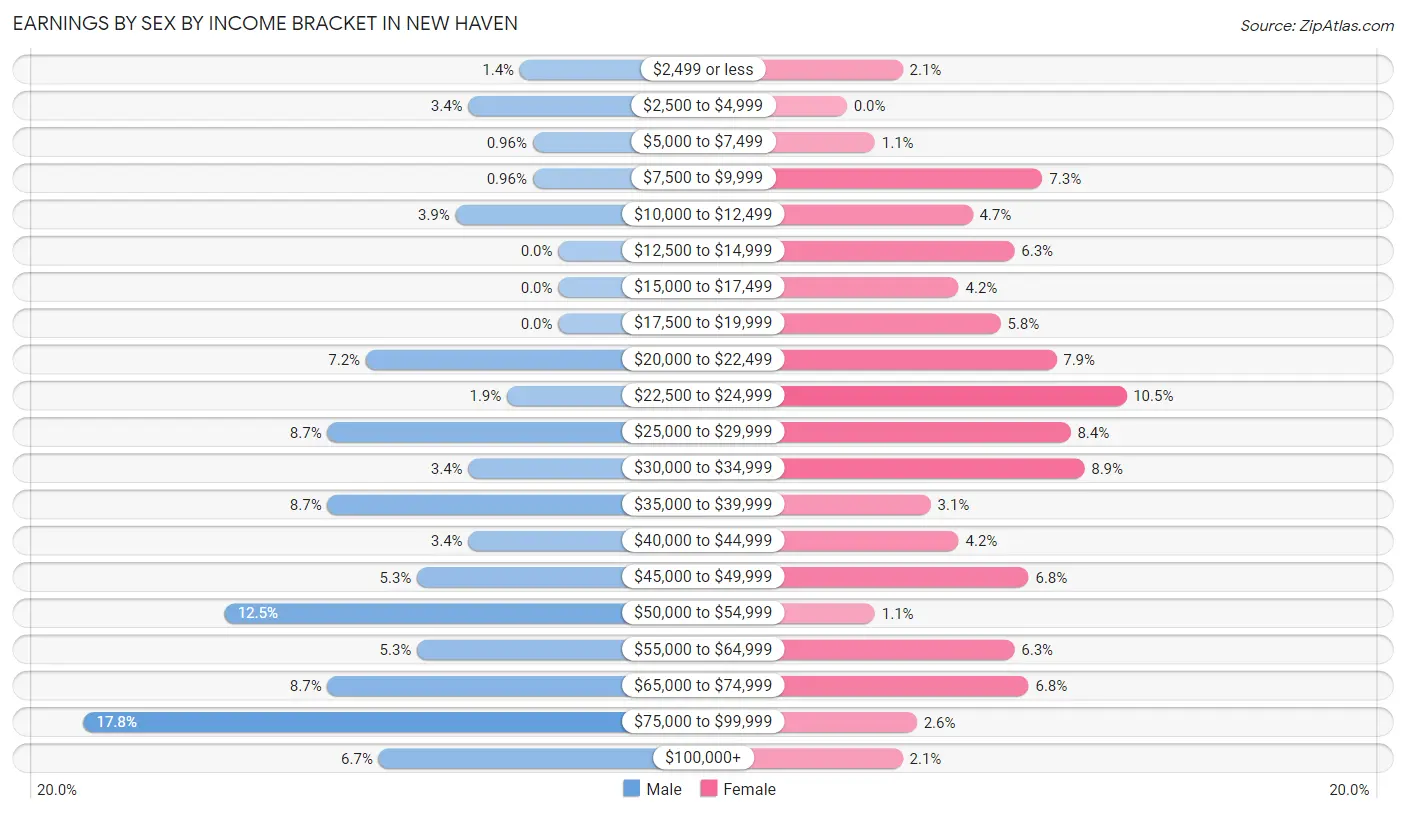
Earnings by Sex by Income Bracket in New Haven
The most common earnings brackets in New Haven are $75,000 to $99,999 for men (37 | 17.8%) and $22,500 to $24,999 for women (20 | 10.5%).
| Income | Male | Female |
| $2,499 or less | 3 (1.4%) | 4 (2.1%) |
| $2,500 to $4,999 | 7 (3.4%) | 0 (0.0%) |
| $5,000 to $7,499 | 2 (1.0%) | 2 (1.1%) |
| $7,500 to $9,999 | 2 (1.0%) | 14 (7.3%) |
| $10,000 to $12,499 | 8 (3.8%) | 9 (4.7%) |
| $12,500 to $14,999 | 0 (0.0%) | 12 (6.3%) |
| $15,000 to $17,499 | 0 (0.0%) | 8 (4.2%) |
| $17,500 to $19,999 | 0 (0.0%) | 11 (5.8%) |
| $20,000 to $22,499 | 15 (7.2%) | 15 (7.9%) |
| $22,500 to $24,999 | 4 (1.9%) | 20 (10.5%) |
| $25,000 to $29,999 | 18 (8.6%) | 16 (8.4%) |
| $30,000 to $34,999 | 7 (3.4%) | 17 (8.9%) |
| $35,000 to $39,999 | 18 (8.6%) | 6 (3.1%) |
| $40,000 to $44,999 | 7 (3.4%) | 8 (4.2%) |
| $45,000 to $49,999 | 11 (5.3%) | 13 (6.8%) |
| $50,000 to $54,999 | 26 (12.5%) | 2 (1.1%) |
| $55,000 to $64,999 | 11 (5.3%) | 12 (6.3%) |
| $65,000 to $74,999 | 18 (8.6%) | 13 (6.8%) |
| $75,000 to $99,999 | 37 (17.8%) | 5 (2.6%) |
| $100,000+ | 14 (6.7%) | 4 (2.1%) |
| Total | 208 (100.0%) | 191 (100.0%) |
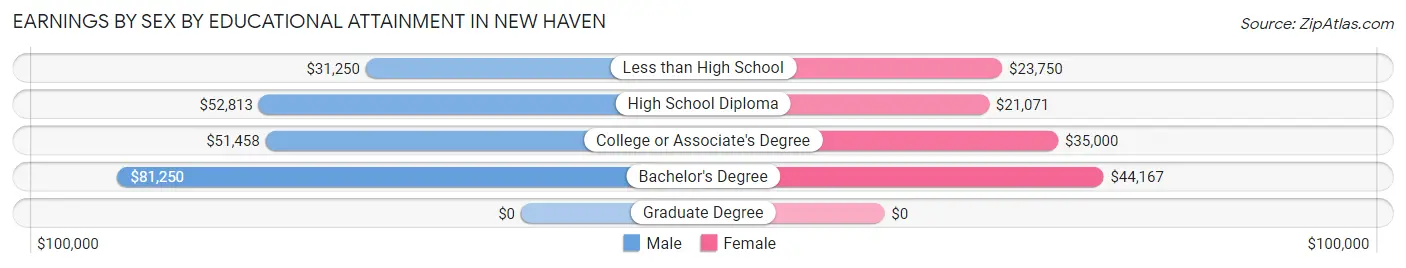
Earnings by Sex by Educational Attainment in New Haven
Average earnings in New Haven are $52,788 for men and $26,538 for women, a difference of 49.7%. Men with an educational attainment of bachelor's degree enjoy the highest average annual earnings of $81,250, while those with less than high school education earn the least with $31,250. Women with an educational attainment of bachelor's degree earn the most with the average annual earnings of $44,167, while those with high school diploma education have the smallest earnings of $21,071.
| Educational Attainment | Male Income | Female Income |
| Less than High School | $31,250 | $23,750 |
| High School Diploma | $52,813 | $21,071 |
| College or Associate's Degree | $51,458 | $35,000 |
| Bachelor's Degree | $81,250 | $44,167 |
| Graduate Degree | - | - |
| Total | $52,788 | $26,538 |
Family Income in New Haven
Family Income Brackets in New Haven
According to the New Haven family income data, there are 57 families falling into the $100,000 to $149,999 income range, which is the most common income bracket and makes up 25.8% of all families. Conversely, the less than $10,000 income bracket is the least frequent group with only 5 families (2.3%) belonging to this category.
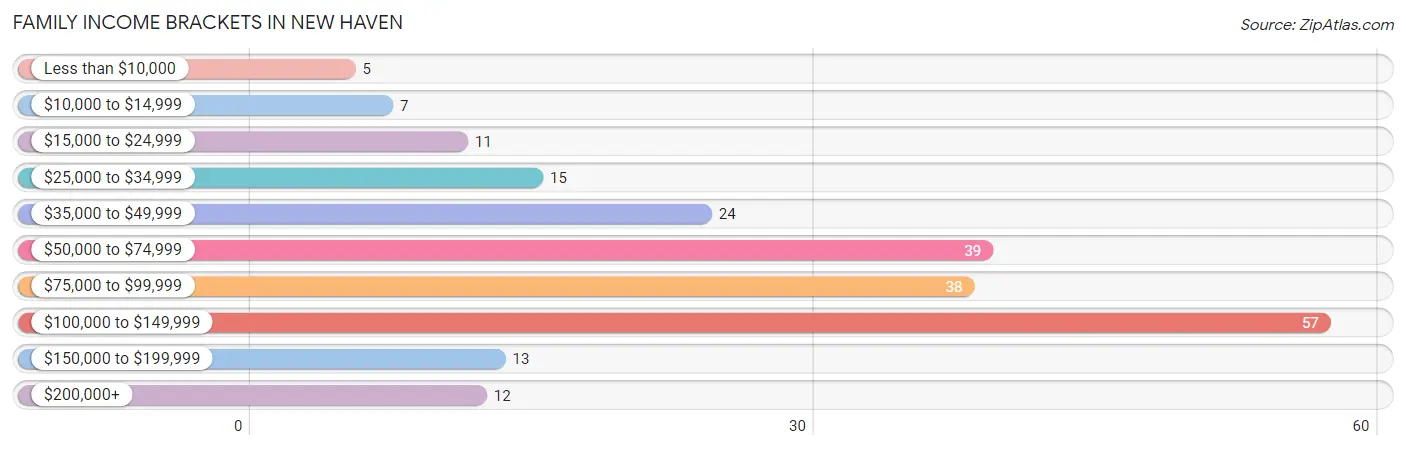
| Income Bracket | # Families | % Families |
| Less than $10,000 | 5 | 2.3% |
| $10,000 to $14,999 | 7 | 3.2% |
| $15,000 to $24,999 | 11 | 5.0% |
| $25,000 to $34,999 | 15 | 6.8% |
| $35,000 to $49,999 | 24 | 10.9% |
| $50,000 to $74,999 | 39 | 17.6% |
| $75,000 to $99,999 | 38 | 17.2% |
| $100,000 to $149,999 | 57 | 25.8% |
| $150,000 to $199,999 | 13 | 5.9% |
| $200,000+ | 12 | 5.4% |
Family Income by Famaliy Size in New Haven
2-person families (111 | 50.2%) account for the highest median family income in New Haven with $83,125 per family, while 2-person families (111 | 50.2%) have the highest median income of $41,562 per family member.
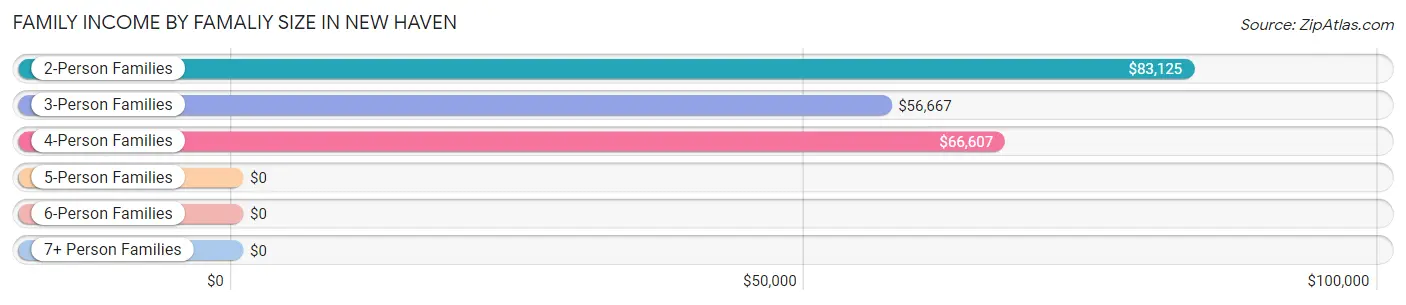
| Income Bracket | # Families | Median Income |
| 2-Person Families | 111 (50.2%) | $83,125 |
| 3-Person Families | 56 (25.3%) | $56,667 |
| 4-Person Families | 33 (14.9%) | $66,607 |
| 5-Person Families | 21 (9.5%) | $0 |
| 6-Person Families | 0 (0.0%) | $0 |
| 7+ Person Families | 0 (0.0%) | $0 |
| Total | 221 (100.0%) | $76,979 |
Family Income by Number of Earners in New Haven
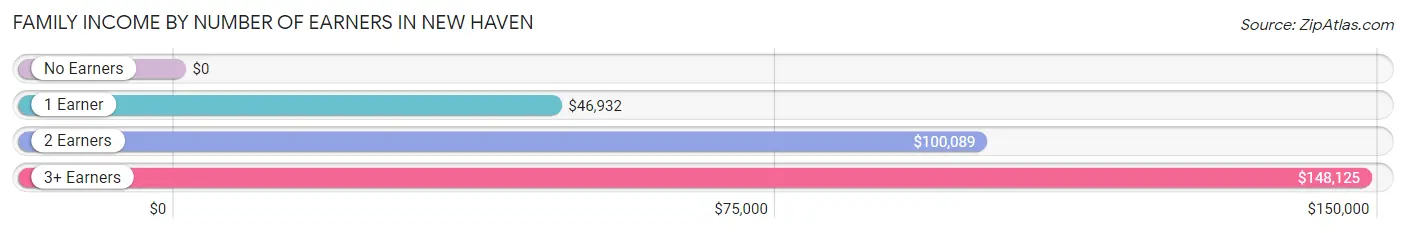
| Number of Earners | # Families | Median Income |
| No Earners | 46 (20.8%) | $0 |
| 1 Earner | 75 (33.9%) | $46,932 |
| 2 Earners | 73 (33.0%) | $100,089 |
| 3+ Earners | 27 (12.2%) | $148,125 |
| Total | 221 (100.0%) | $76,979 |
Household Income in New Haven
Household Income Brackets in New Haven
With 61 households falling in the category, the $75,000 to $99,999 income range is the most frequent in New Haven, accounting for 18.9% of all households. In contrast, only 11 households (3.4%) fall into the less than $10,000 income bracket, making it the least populous group.
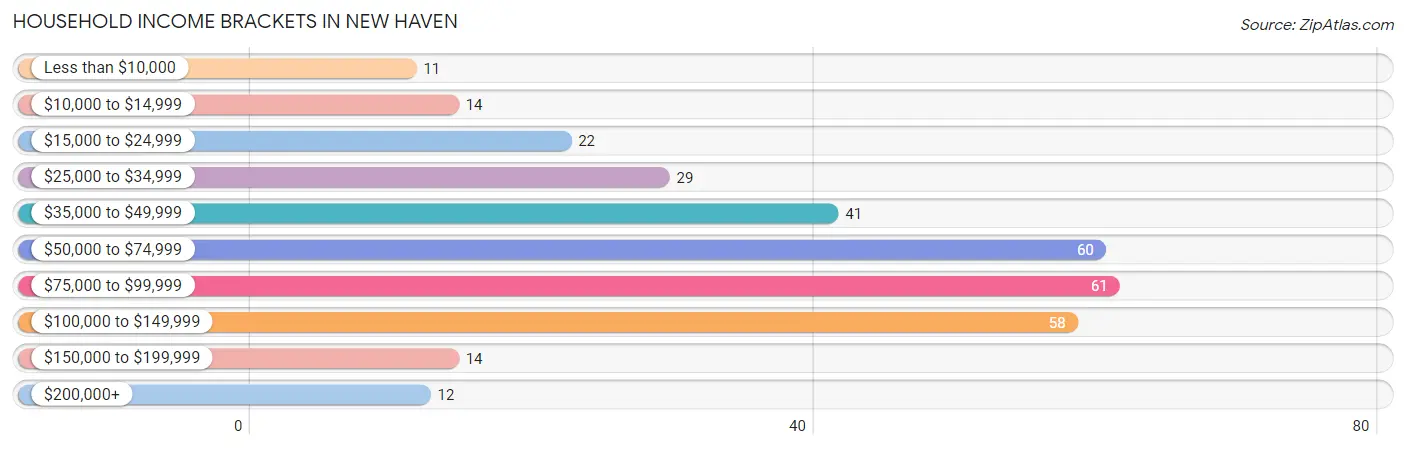
| Income Bracket | # Households | % Households |
| Less than $10,000 | 11 | 3.4% |
| $10,000 to $14,999 | 14 | 4.3% |
| $15,000 to $24,999 | 22 | 6.8% |
| $25,000 to $34,999 | 29 | 9.0% |
| $35,000 to $49,999 | 41 | 12.7% |
| $50,000 to $74,999 | 60 | 18.6% |
| $75,000 to $99,999 | 61 | 18.9% |
| $100,000 to $149,999 | 58 | 18.0% |
| $150,000 to $199,999 | 14 | 4.3% |
| $200,000+ | 12 | 3.7% |
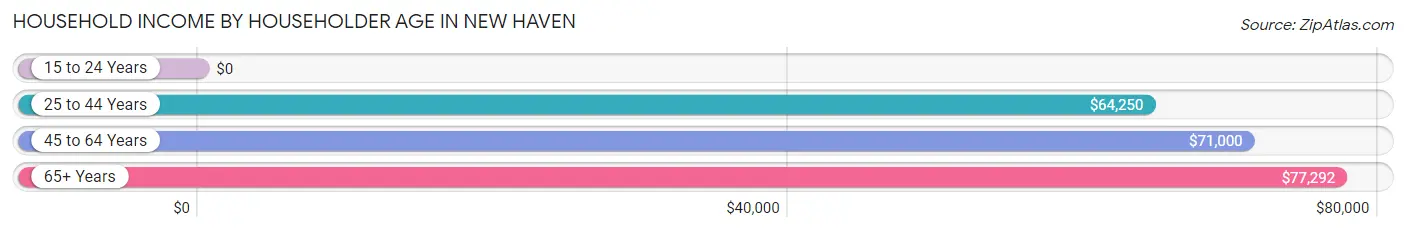
Household Income by Householder Age in New Haven
The median household income in New Haven is $68,750, with the highest median household income of $77,292 found in the 65+ years age bracket for the primary householder. A total of 99 households (30.7%) fall into this category. Meanwhile, the 15 to 24 years age bracket for the primary householder has the lowest median household income of $0, with 10 households (3.1%) in this group.
| Income Bracket | # Households | Median Income |
| 15 to 24 Years | 10 (3.1%) | $0 |
| 25 to 44 Years | 101 (31.4%) | $64,250 |
| 45 to 64 Years | 112 (34.8%) | $71,000 |
| 65+ Years | 99 (30.7%) | $77,292 |
| Total | 322 (100.0%) | $68,750 |
Poverty in New Haven
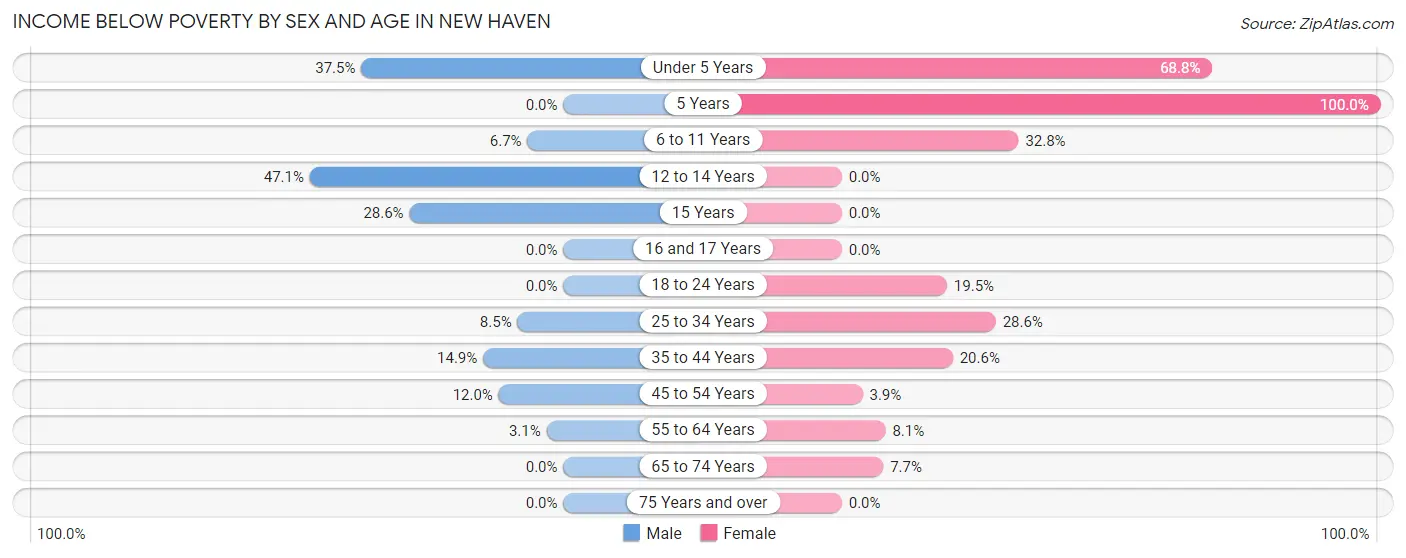
Income Below Poverty by Sex and Age in New Haven
With 9.4% poverty level for males and 19.4% for females among the residents of New Haven, 12 to 14 year old males and 5 year old females are the most vulnerable to poverty, with 8 males (47.1%) and 12 females (100.0%) in their respective age groups living below the poverty level.
| Age Bracket | Male | Female |
| Under 5 Years | 3 (37.5%) | 11 (68.8%) |
| 5 Years | 0 (0.0%) | 12 (100.0%) |
| 6 to 11 Years | 2 (6.7%) | 20 (32.8%) |
| 12 to 14 Years | 8 (47.1%) | 0 (0.0%) |
| 15 Years | 2 (28.6%) | 0 (0.0%) |
| 16 and 17 Years | 0 (0.0%) | 0 (0.0%) |
| 18 to 24 Years | 0 (0.0%) | 8 (19.5%) |
| 25 to 34 Years | 4 (8.5%) | 16 (28.6%) |
| 35 to 44 Years | 7 (14.9%) | 7 (20.6%) |
| 45 to 54 Years | 6 (12.0%) | 2 (3.8%) |
| 55 to 64 Years | 2 (3.1%) | 3 (8.1%) |
| 65 to 74 Years | 0 (0.0%) | 4 (7.7%) |
| 75 Years and over | 0 (0.0%) | 0 (0.0%) |
| Total | 34 (9.4%) | 83 (19.4%) |
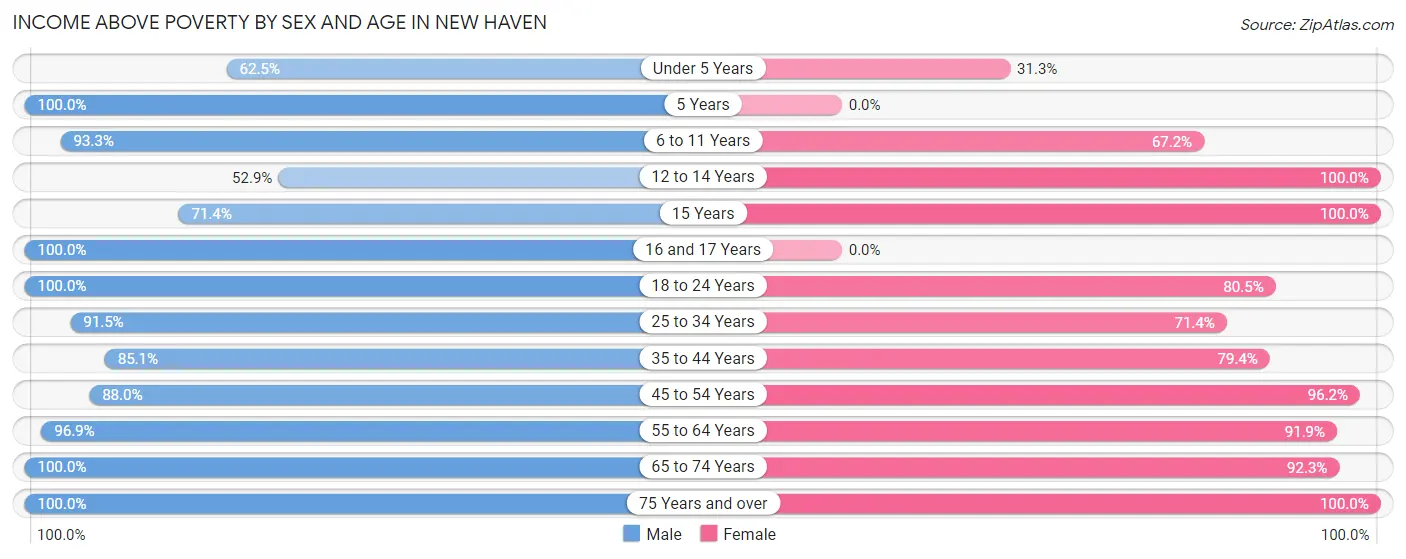
Income Above Poverty by Sex and Age in New Haven
According to the poverty statistics in New Haven, males aged 5 years and females aged 12 to 14 years are the age groups that are most secure financially, with 100.0% of males and 100.0% of females in these age groups living above the poverty line.
| Age Bracket | Male | Female |
| Under 5 Years | 5 (62.5%) | 5 (31.2%) |
| 5 Years | 6 (100.0%) | 0 (0.0%) |
| 6 to 11 Years | 28 (93.3%) | 41 (67.2%) |
| 12 to 14 Years | 9 (52.9%) | 7 (100.0%) |
| 15 Years | 5 (71.4%) | 4 (100.0%) |
| 16 and 17 Years | 6 (100.0%) | 0 (0.0%) |
| 18 to 24 Years | 27 (100.0%) | 33 (80.5%) |
| 25 to 34 Years | 43 (91.5%) | 40 (71.4%) |
| 35 to 44 Years | 40 (85.1%) | 27 (79.4%) |
| 45 to 54 Years | 44 (88.0%) | 50 (96.2%) |
| 55 to 64 Years | 62 (96.9%) | 34 (91.9%) |
| 65 to 74 Years | 22 (100.0%) | 48 (92.3%) |
| 75 Years and over | 29 (100.0%) | 55 (100.0%) |
| Total | 326 (90.6%) | 344 (80.6%) |
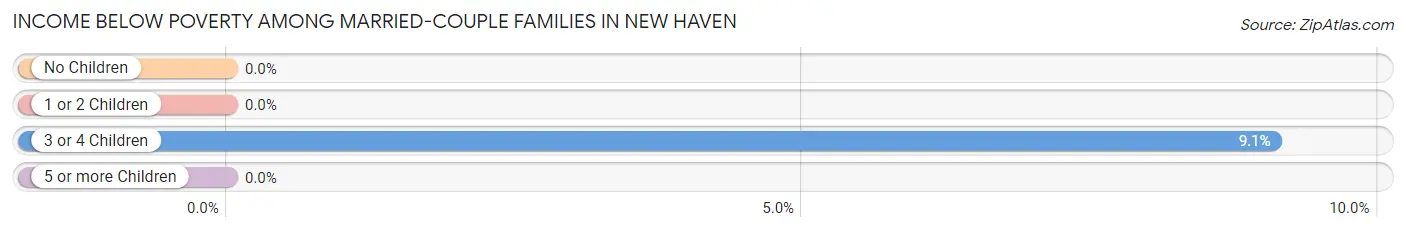
Income Below Poverty Among Married-Couple Families in New Haven
The poverty statistics for married-couple families in New Haven show that 0.7% or 1 of the total 140 families live below the poverty line. Families with 3 or 4 children have the highest poverty rate of 9.1%, comprising of 1 families. On the other hand, families with no children have the lowest poverty rate of 0.0%, which includes 0 families.
| Children | Above Poverty | Below Poverty |
| No Children | 84 (100.0%) | 0 (0.0%) |
| 1 or 2 Children | 45 (100.0%) | 0 (0.0%) |
| 3 or 4 Children | 10 (90.9%) | 1 (9.1%) |
| 5 or more Children | 0 (0.0%) | 0 (0.0%) |
| Total | 139 (99.3%) | 1 (0.7%) |
Income Below Poverty Among Single-Parent Households in New Haven
According to the poverty data in New Haven, 6.5% or 2 single-father households and 38.0% or 19 single-mother households are living below the poverty line. Among single-father households, those with 3 or 4 children have the highest poverty rate, with 2 households (50.0%) experiencing poverty. Likewise, among single-mother households, those with 3 or 4 children have the highest poverty rate, with 2 households (100.0%) falling below the poverty line.
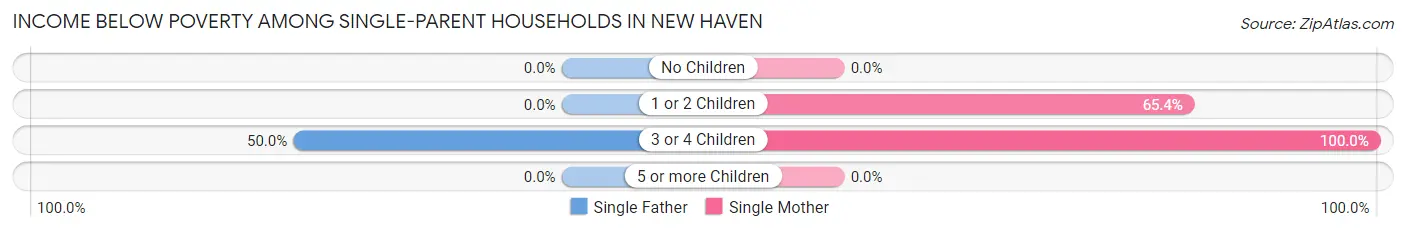
| Children | Single Father | Single Mother |
| No Children | 0 (0.0%) | 0 (0.0%) |
| 1 or 2 Children | 0 (0.0%) | 17 (65.4%) |
| 3 or 4 Children | 2 (50.0%) | 2 (100.0%) |
| 5 or more Children | 0 (0.0%) | 0 (0.0%) |
| Total | 2 (6.5%) | 19 (38.0%) |
Income Below Poverty Among Married-Couple vs Single-Parent Households in New Haven
The poverty data for New Haven shows that 1 of the married-couple family households (0.7%) and 21 of the single-parent households (25.9%) are living below the poverty level. Within the married-couple family households, those with 3 or 4 children have the highest poverty rate, with 1 households (9.1%) falling below the poverty line. Among the single-parent households, those with 3 or 4 children have the highest poverty rate, with 4 household (66.7%) living below poverty.
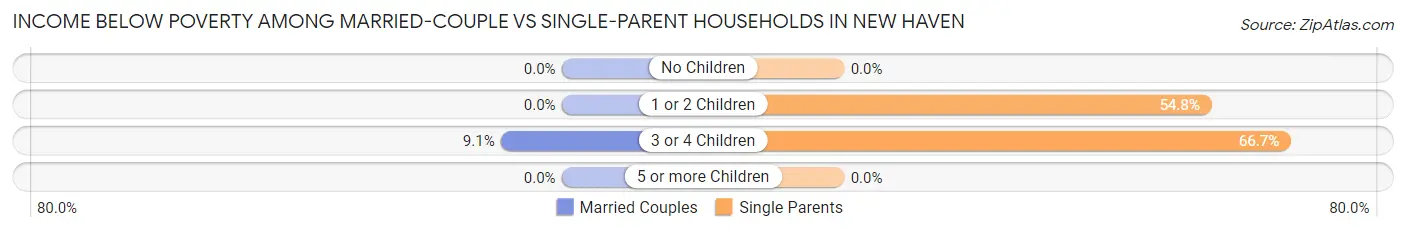
| Children | Married-Couple Families | Single-Parent Households |
| No Children | 0 (0.0%) | 0 (0.0%) |
| 1 or 2 Children | 0 (0.0%) | 17 (54.8%) |
| 3 or 4 Children | 1 (9.1%) | 4 (66.7%) |
| 5 or more Children | 0 (0.0%) | 0 (0.0%) |
| Total | 1 (0.7%) | 21 (25.9%) |
Race in New Haven
The most populous races in New Haven are White / Caucasian (768 | 97.3%), Hispanic or Latino (17 | 2.1%), and Black / African American (10 | 1.3%).
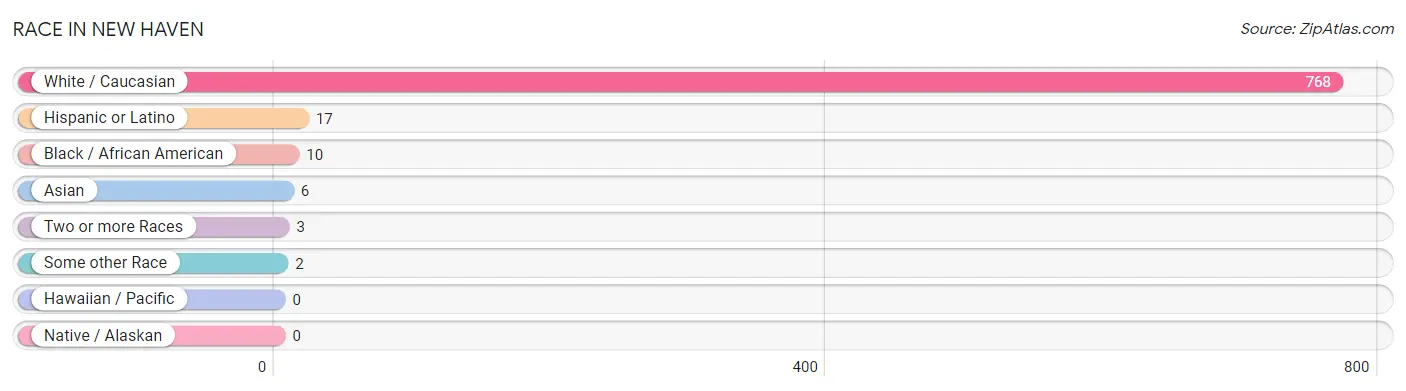
| Race | # Population | % Population |
| Asian | 6 | 0.8% |
| Black / African American | 10 | 1.3% |
| Hawaiian / Pacific | 0 | 0.0% |
| Hispanic or Latino | 17 | 2.1% |
| Native / Alaskan | 0 | 0.0% |
| White / Caucasian | 768 | 97.3% |
| Two or more Races | 3 | 0.4% |
| Some other Race | 2 | 0.3% |
| Total | 789 | 100.0% |
Ancestry in New Haven
The most populous ancestries reported in New Haven are English (151 | 19.1%), American (105 | 13.3%), Irish (99 | 12.6%), German (59 | 7.5%), and Scandinavian (25 | 3.2%), together accounting for 55.6% of all New Haven residents.
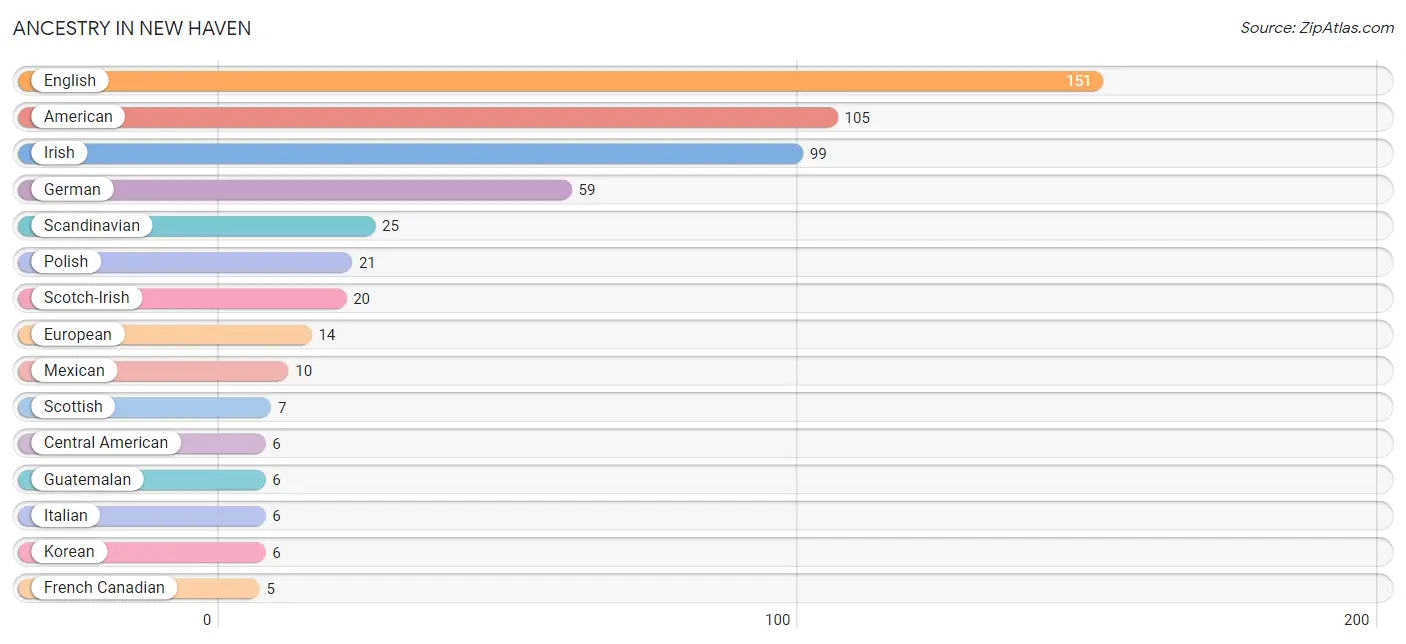
| Ancestry | # Population | % Population |
| American | 105 | 13.3% |
| British | 3 | 0.4% |
| Central American | 6 | 0.8% |
| English | 151 | 19.1% |
| European | 14 | 1.8% |
| French | 2 | 0.3% |
| French Canadian | 5 | 0.6% |
| German | 59 | 7.5% |
| Guatemalan | 6 | 0.8% |
| Irish | 99 | 12.6% |
| Italian | 6 | 0.8% |
| Korean | 6 | 0.8% |
| Mexican | 10 | 1.3% |
| Polish | 21 | 2.7% |
| Puerto Rican | 1 | 0.1% |
| Scandinavian | 25 | 3.2% |
| Scotch-Irish | 20 | 2.5% |
| Scottish | 7 | 0.9% |
| Swedish | 2 | 0.3% |
| Welsh | 2 | 0.3% | View All 20 Rows |
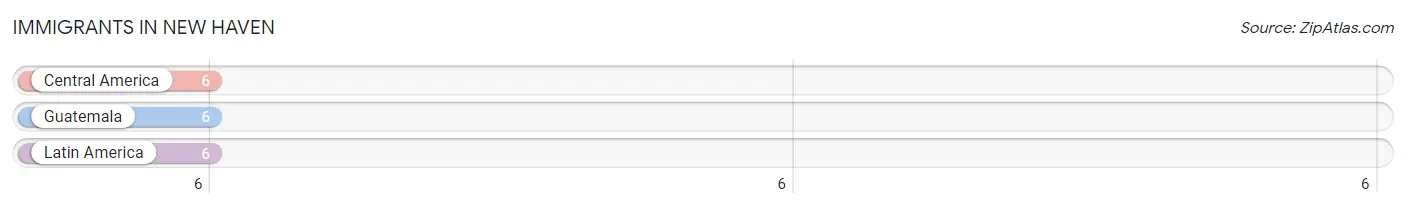
Immigrants in New Haven
The most numerous immigrant groups reported in New Haven came from Central America (6 | 0.8%), Guatemala (6 | 0.8%), and Latin America (6 | 0.8%), together accounting for 2.3% of all New Haven residents.
| Immigration Origin | # Population | % Population |
| Central America | 6 | 0.8% |
| Guatemala | 6 | 0.8% |
| Latin America | 6 | 0.8% | View All 3 Rows |
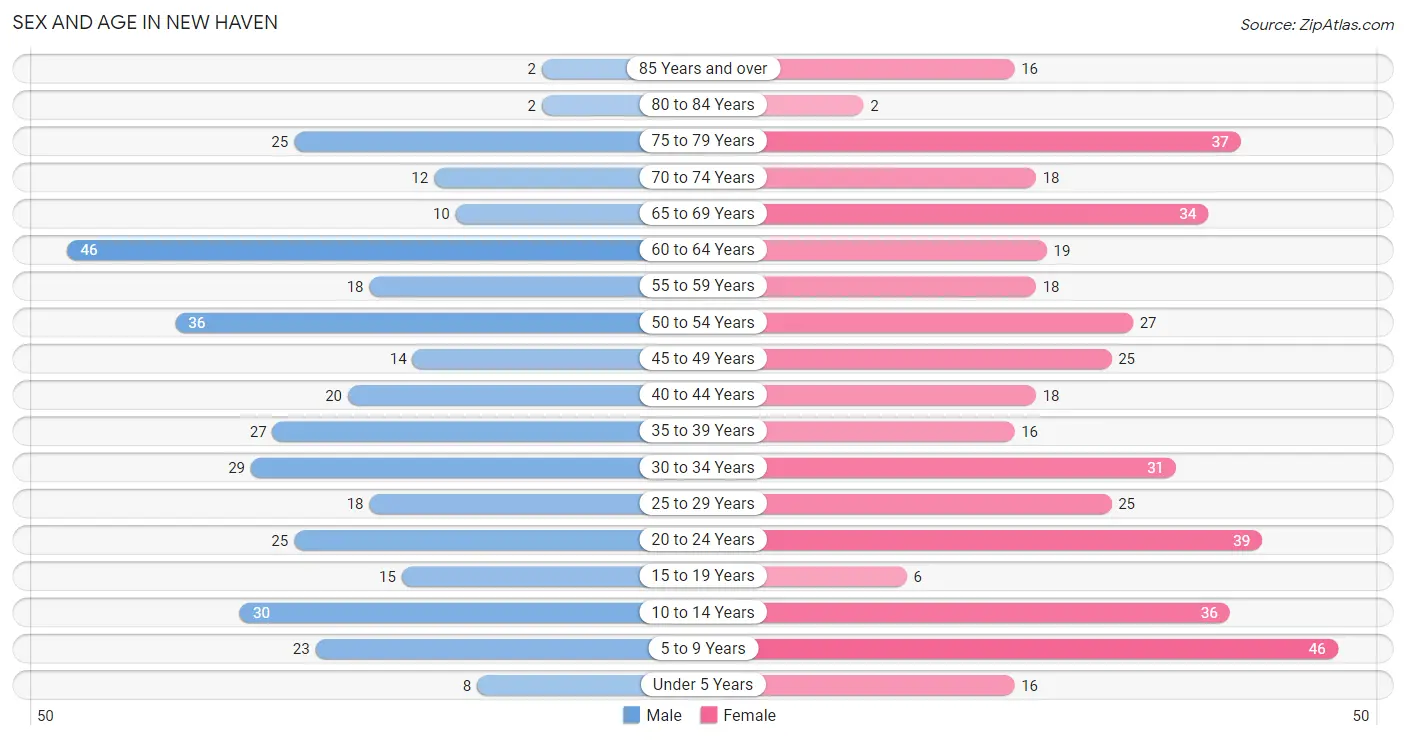
Sex and Age in New Haven
Sex and Age in New Haven
The most populous age groups in New Haven are 60 to 64 Years (46 | 12.8%) for men and 5 to 9 Years (46 | 10.7%) for women.
| Age Bracket | Male | Female |
| Under 5 Years | 8 (2.2%) | 16 (3.7%) |
| 5 to 9 Years | 23 (6.4%) | 46 (10.7%) |
| 10 to 14 Years | 30 (8.3%) | 36 (8.4%) |
| 15 to 19 Years | 15 (4.2%) | 6 (1.4%) |
| 20 to 24 Years | 25 (6.9%) | 39 (9.1%) |
| 25 to 29 Years | 18 (5.0%) | 25 (5.8%) |
| 30 to 34 Years | 29 (8.1%) | 31 (7.2%) |
| 35 to 39 Years | 27 (7.5%) | 16 (3.7%) |
| 40 to 44 Years | 20 (5.6%) | 18 (4.2%) |
| 45 to 49 Years | 14 (3.9%) | 25 (5.8%) |
| 50 to 54 Years | 36 (10.0%) | 27 (6.3%) |
| 55 to 59 Years | 18 (5.0%) | 18 (4.2%) |
| 60 to 64 Years | 46 (12.8%) | 19 (4.4%) |
| 65 to 69 Years | 10 (2.8%) | 34 (7.9%) |
| 70 to 74 Years | 12 (3.3%) | 18 (4.2%) |
| 75 to 79 Years | 25 (6.9%) | 37 (8.6%) |
| 80 to 84 Years | 2 (0.6%) | 2 (0.5%) |
| 85 Years and over | 2 (0.6%) | 16 (3.7%) |
| Total | 360 (100.0%) | 429 (100.0%) |
Families and Households in New Haven
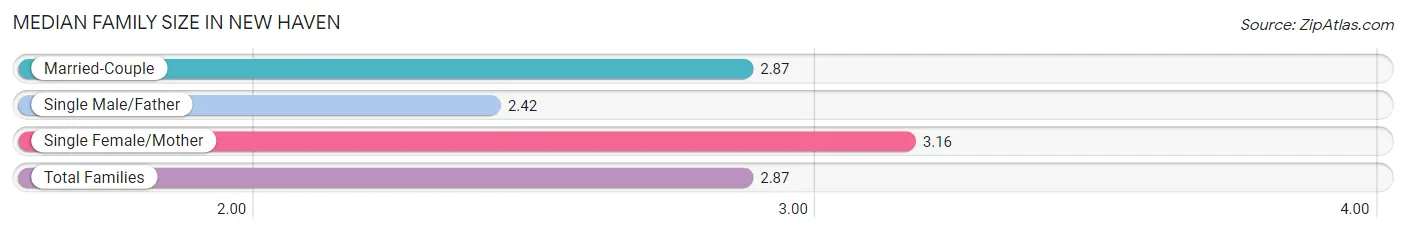
Median Family Size in New Haven
The median family size in New Haven is 2.87 persons per family, with single female/mother families (50 | 22.6%) accounting for the largest median family size of 3.16 persons per family. On the other hand, single male/father families (31 | 14.0%) represent the smallest median family size with 2.42 persons per family.
| Family Type | # Families | Family Size |
| Married-Couple | 140 (63.3%) | 2.87 |
| Single Male/Father | 31 (14.0%) | 2.42 |
| Single Female/Mother | 50 (22.6%) | 3.16 |
| Total Families | 221 (100.0%) | 2.87 |
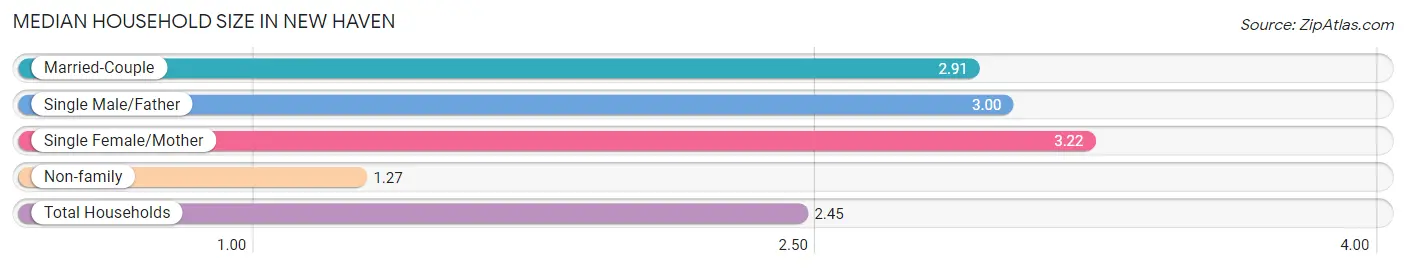
Median Household Size in New Haven
The median household size in New Haven is 2.45 persons per household, with single female/mother households (50 | 15.5%) accounting for the largest median household size of 3.22 persons per household. non-family households (101 | 31.4%) represent the smallest median household size with 1.27 persons per household.
| Household Type | # Households | Household Size |
| Married-Couple | 140 (43.5%) | 2.91 |
| Single Male/Father | 31 (9.6%) | 3.00 |
| Single Female/Mother | 50 (15.5%) | 3.22 |
| Non-family | 101 (31.4%) | 1.27 |
| Total Households | 322 (100.0%) | 2.45 |
Household Size by Marriage Status in New Haven
Out of a total of 322 households in New Haven, 221 (68.6%) are family households, while 101 (31.4%) are nonfamily households. The most numerous type of family households are 2-person households, comprising 105, and the most common type of nonfamily households are 1-person households, comprising 71.
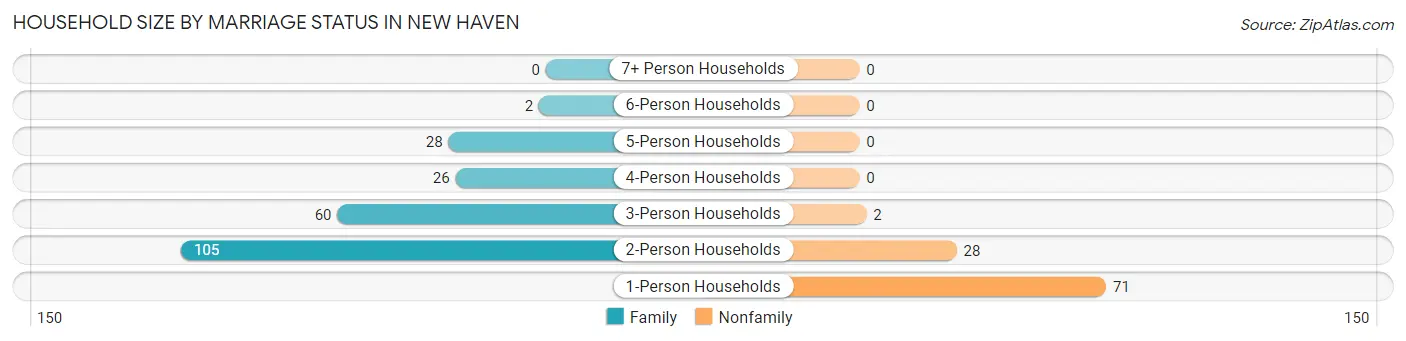
| Household Size | Family Households | Nonfamily Households |
| 1-Person Households | - | 71 (22.1%) |
| 2-Person Households | 105 (32.6%) | 28 (8.7%) |
| 3-Person Households | 60 (18.6%) | 2 (0.6%) |
| 4-Person Households | 26 (8.1%) | 0 (0.0%) |
| 5-Person Households | 28 (8.7%) | 0 (0.0%) |
| 6-Person Households | 2 (0.6%) | 0 (0.0%) |
| 7+ Person Households | 0 (0.0%) | 0 (0.0%) |
| Total | 221 (68.6%) | 101 (31.4%) |
Female Fertility in New Haven
Fertility by Age in New Haven
Average fertility rate in New Haven is 18.0 births per 1,000 women. Women in the age bracket of 20 to 34 years have the highest fertility rate with 32.0 births per 1,000 women. Women in the age bracket of 20 to 34 years acount for 100.0% of all women with births.
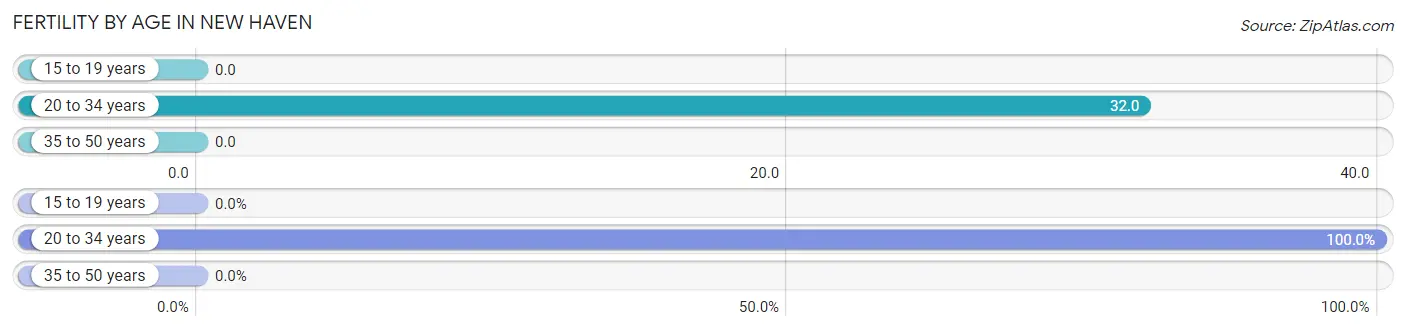
| Age Bracket | Women with Births | Births / 1,000 Women |
| 15 to 19 years | 0 (0.0%) | 0.0 |
| 20 to 34 years | 3 (100.0%) | 32.0 |
| 35 to 50 years | 0 (0.0%) | 0.0 |
| Total | 3 (100.0%) | 18.0 |
Fertility by Age by Marriage Status in New Haven
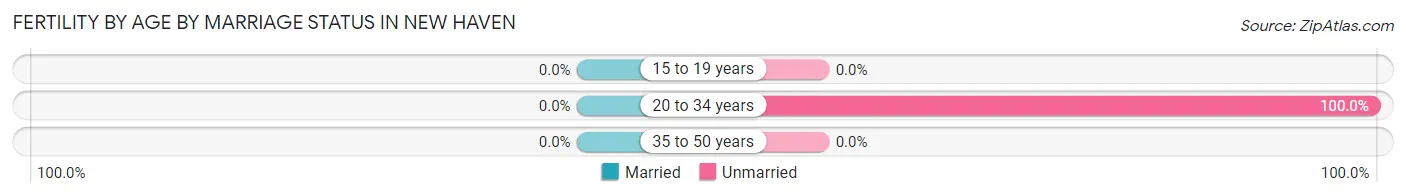
| Age Bracket | Married | Unmarried |
| 15 to 19 years | 0 (0.0%) | 0 (0.0%) |
| 20 to 34 years | 0 (0.0%) | 3 (100.0%) |
| 35 to 50 years | 0 (0.0%) | 0 (0.0%) |
| Total | 0 (0.0%) | 3 (100.0%) |
Fertility by Education in New Haven
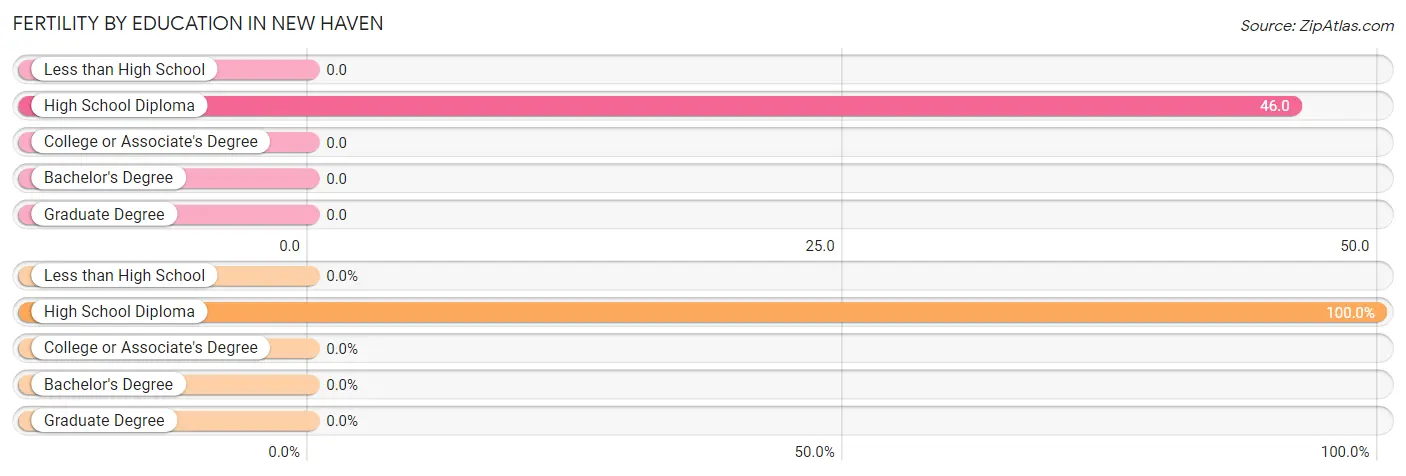
| Educational Attainment | Women with Births | Births / 1,000 Women |
| Less than High School | 0 (0.0%) | 0.0 |
| High School Diploma | 3 (100.0%) | 46.0 |
| College or Associate's Degree | 0 (0.0%) | 0.0 |
| Bachelor's Degree | 0 (0.0%) | 0.0 |
| Graduate Degree | 0 (0.0%) | 0.0 |
| Total | 3 (100.0%) | 18.0 |
Fertility by Education by Marriage Status in New Haven

| Educational Attainment | Married | Unmarried |
| Less than High School | 0 (0.0%) | 0 (0.0%) |
| High School Diploma | 0 (0.0%) | 3 (100.0%) |
| College or Associate's Degree | 0 (0.0%) | 0 (0.0%) |
| Bachelor's Degree | 0 (0.0%) | 0 (0.0%) |
| Graduate Degree | 0 (0.0%) | 0 (0.0%) |
| Total | 0 (0.0%) | 3 (100.0%) |
Employment Characteristics in New Haven
Employment by Class of Employer in New Haven
Among the 327 employed individuals in New Haven, private company employees (272 | 83.2%), local government employees (16 | 4.9%), and state government employees (11 | 3.4%) make up the most common classes of employment.
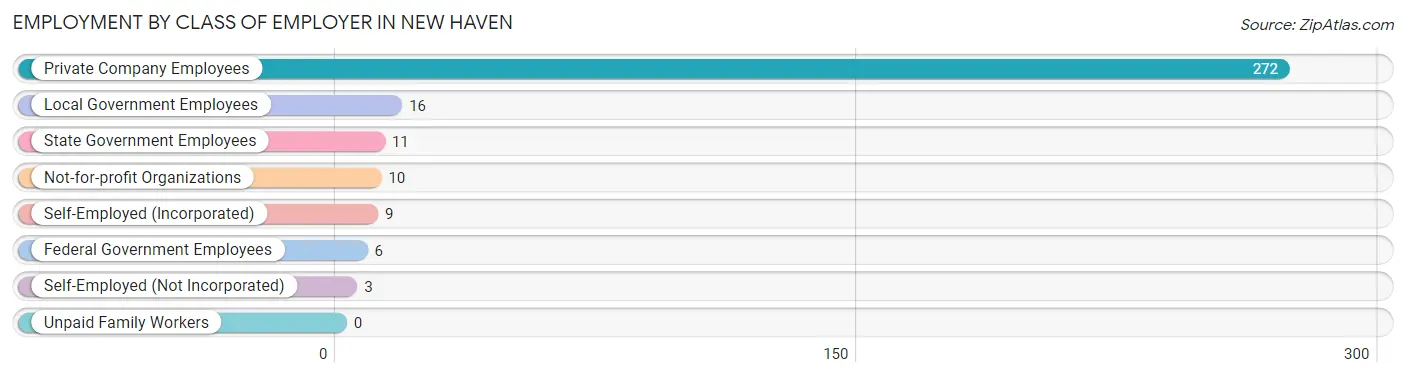
| Employer Class | # Employees | % Employees |
| Private Company Employees | 272 | 83.2% |
| Self-Employed (Incorporated) | 9 | 2.8% |
| Self-Employed (Not Incorporated) | 3 | 0.9% |
| Not-for-profit Organizations | 10 | 3.1% |
| Local Government Employees | 16 | 4.9% |
| State Government Employees | 11 | 3.4% |
| Federal Government Employees | 6 | 1.8% |
| Unpaid Family Workers | 0 | 0.0% |
| Total | 327 | 100.0% |
Employment Status by Age in New Haven
According to the labor force statistics for New Haven, out of the total population over 16 years of age (619), 63.8% or 395 individuals are in the labor force, with 12.4% or 49 of them unemployed. The age group with the highest labor force participation rate is 25 to 29 years, with 97.7% or 42 individuals in the labor force. Within the labor force, the 16 to 19 years age range has the highest percentage of unemployed individuals, with 100.0% or 2 of them being unemployed.
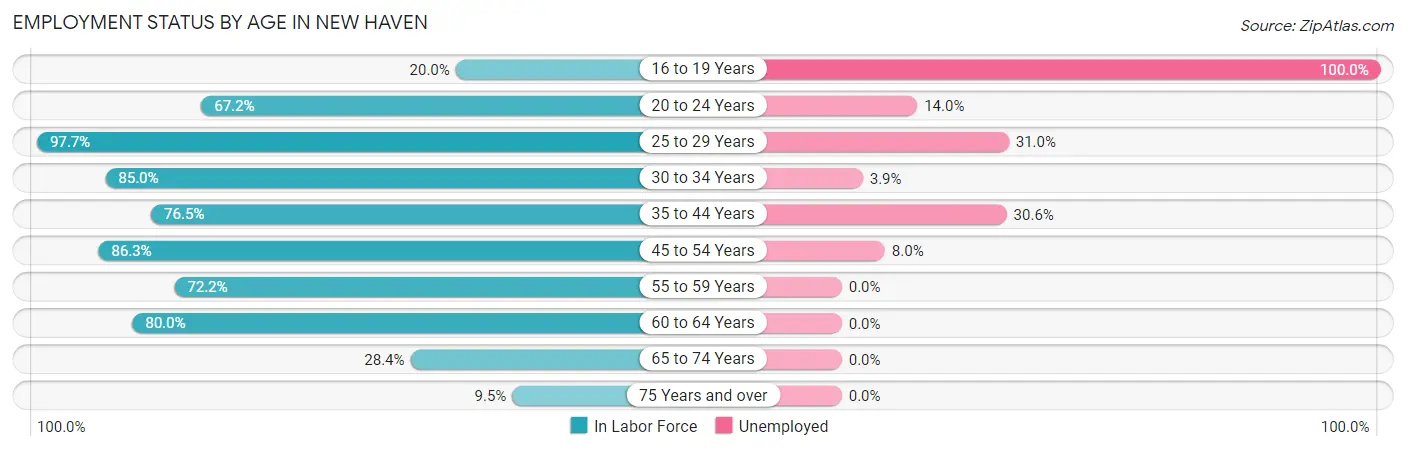
| Age Bracket | In Labor Force | Unemployed |
| 16 to 19 Years | 2 (20.0%) | 2 (100.0%) |
| 20 to 24 Years | 43 (67.2%) | 6 (14.0%) |
| 25 to 29 Years | 42 (97.7%) | 13 (31.0%) |
| 30 to 34 Years | 51 (85.0%) | 2 (3.9%) |
| 35 to 44 Years | 62 (76.5%) | 19 (30.6%) |
| 45 to 54 Years | 88 (86.3%) | 7 (8.0%) |
| 55 to 59 Years | 26 (72.2%) | 0 (0.0%) |
| 60 to 64 Years | 52 (80.0%) | 0 (0.0%) |
| 65 to 74 Years | 21 (28.4%) | 0 (0.0%) |
| 75 Years and over | 8 (9.5%) | 0 (0.0%) |
| Total | 395 (63.8%) | 49 (12.4%) |
Employment Status by Educational Attainment in New Haven
According to labor force statistics for New Haven, 82.9% of individuals (321) out of the total population between 25 and 64 years of age (387) are in the labor force, with 12.8% or 41 of them being unemployed. The group with the highest labor force participation rate are those with the educational attainment of bachelor's degree or higher, with 100.0% or 42 individuals in the labor force. Within the labor force, individuals with less than high school education have the highest percentage of unemployment, with 25.0% or 5 of them being unemployed.
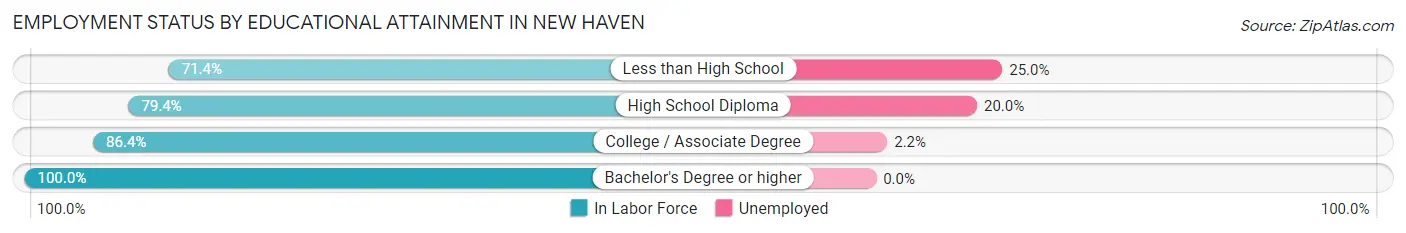
| Educational Attainment | In Labor Force | Unemployed |
| Less than High School | 20 (71.4%) | 7 (25.0%) |
| High School Diploma | 170 (79.4%) | 43 (20.0%) |
| College / Associate Degree | 89 (86.4%) | 2 (2.2%) |
| Bachelor's Degree or higher | 42 (100.0%) | 0 (0.0%) |
| Total | 321 (82.9%) | 50 (12.8%) |
Employment Occupations by Sex in New Haven
Management, Business, Science and Arts Occupations
The most common Management, Business, Science and Arts occupations in New Haven are Management (27 | 7.8%), Computers, Engineering & Science (22 | 6.4%), Health Diagnosing & Treating (14 | 4.1%), Life, Physical & Social Science (13 | 3.8%), and Community & Social Service (12 | 3.5%).
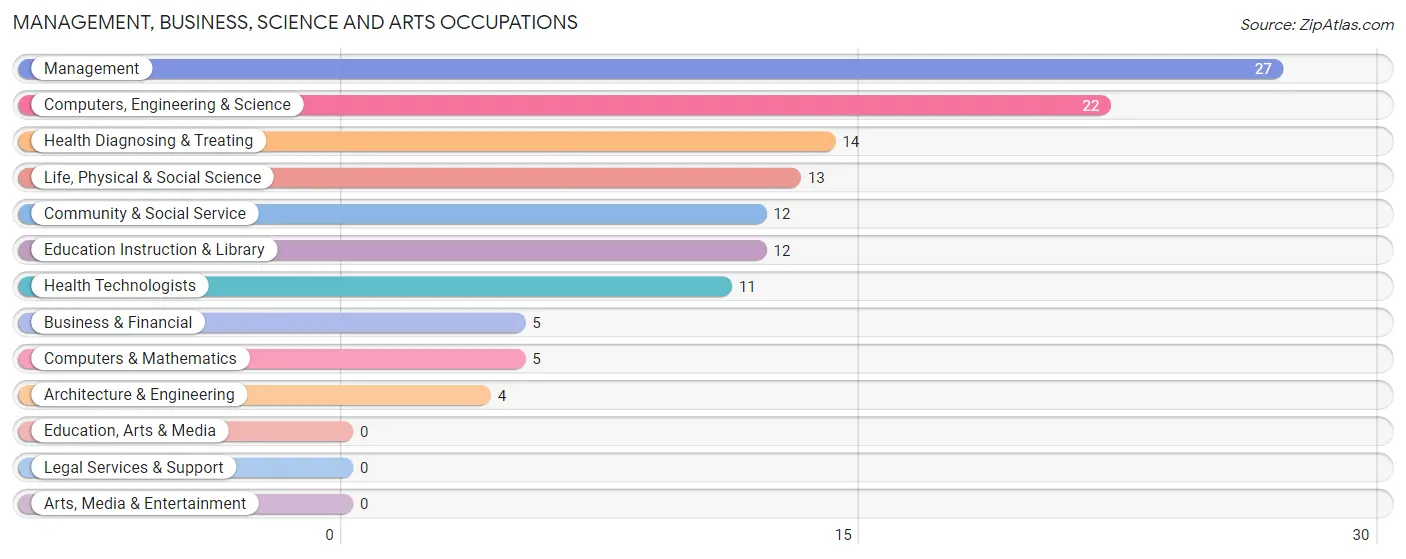
Management, Business, Science and Arts Occupations by Sex
Within the Management, Business, Science and Arts occupations in New Haven, the most male-oriented occupations are Life, Physical & Social Science (100.0%), Computers, Engineering & Science (81.8%), and Management (74.1%), while the most female-oriented occupations are Health Diagnosing & Treating (100.0%), Health Technologists (100.0%), and Community & Social Service (83.3%).
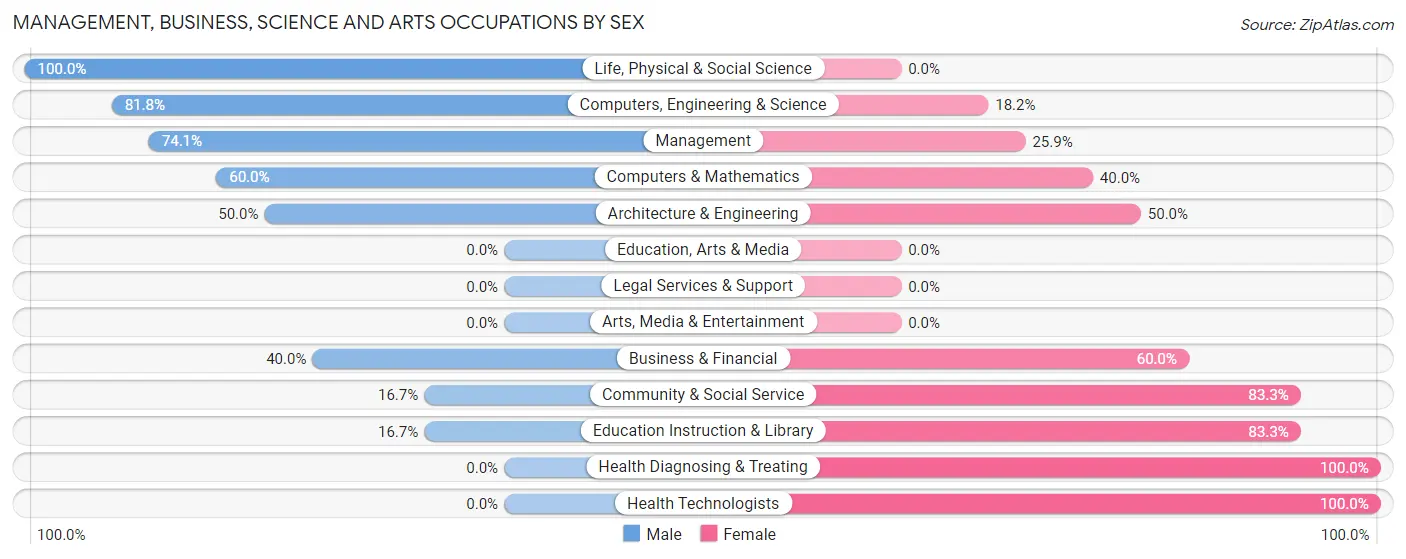
| Occupation | Male | Female |
| Management | 20 (74.1%) | 7 (25.9%) |
| Business & Financial | 2 (40.0%) | 3 (60.0%) |
| Computers, Engineering & Science | 18 (81.8%) | 4 (18.2%) |
| Computers & Mathematics | 3 (60.0%) | 2 (40.0%) |
| Architecture & Engineering | 2 (50.0%) | 2 (50.0%) |
| Life, Physical & Social Science | 13 (100.0%) | 0 (0.0%) |
| Community & Social Service | 2 (16.7%) | 10 (83.3%) |
| Education, Arts & Media | 0 (0.0%) | 0 (0.0%) |
| Legal Services & Support | 0 (0.0%) | 0 (0.0%) |
| Education Instruction & Library | 2 (16.7%) | 10 (83.3%) |
| Arts, Media & Entertainment | 0 (0.0%) | 0 (0.0%) |
| Health Diagnosing & Treating | 0 (0.0%) | 14 (100.0%) |
| Health Technologists | 0 (0.0%) | 11 (100.0%) |
| Total (Category) | 42 (52.5%) | 38 (47.5%) |
| Total (Overall) | 175 (50.6%) | 171 (49.4%) |
Services Occupations
The most common Services occupations in New Haven are Food Preparation & Serving (13 | 3.8%), Cleaning & Maintenance (9 | 2.6%), Healthcare Support (4 | 1.2%), and Personal Care & Service (3 | 0.9%).
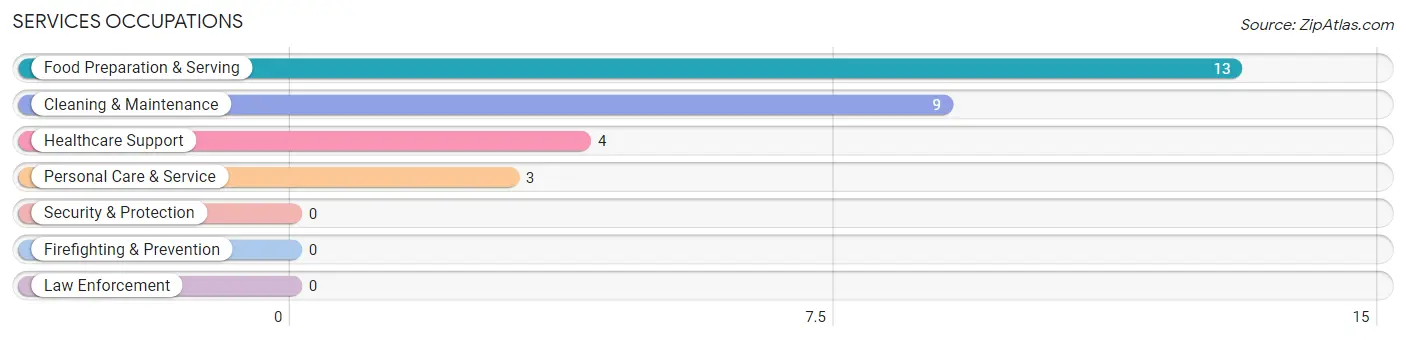
Services Occupations by Sex
Within the Services occupations in New Haven, the most male-oriented occupations are Food Preparation & Serving (46.2%), and Cleaning & Maintenance (22.2%), while the most female-oriented occupations are Healthcare Support (100.0%), Personal Care & Service (100.0%), and Cleaning & Maintenance (77.8%).

| Occupation | Male | Female |
| Healthcare Support | 0 (0.0%) | 4 (100.0%) |
| Security & Protection | 0 (0.0%) | 0 (0.0%) |
| Firefighting & Prevention | 0 (0.0%) | 0 (0.0%) |
| Law Enforcement | 0 (0.0%) | 0 (0.0%) |
| Food Preparation & Serving | 6 (46.2%) | 7 (53.8%) |
| Cleaning & Maintenance | 2 (22.2%) | 7 (77.8%) |
| Personal Care & Service | 0 (0.0%) | 3 (100.0%) |
| Total (Category) | 8 (27.6%) | 21 (72.4%) |
| Total (Overall) | 175 (50.6%) | 171 (49.4%) |
Sales and Office Occupations
The most common Sales and Office occupations in New Haven are Office & Administration (63 | 18.2%), and Sales & Related (30 | 8.7%).

Sales and Office Occupations by Sex

| Occupation | Male | Female |
| Sales & Related | 0 (0.0%) | 30 (100.0%) |
| Office & Administration | 23 (36.5%) | 40 (63.5%) |
| Total (Category) | 23 (24.7%) | 70 (75.3%) |
| Total (Overall) | 175 (50.6%) | 171 (49.4%) |
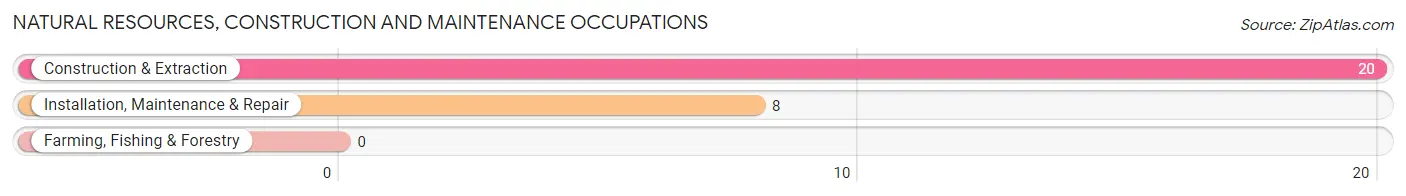
Natural Resources, Construction and Maintenance Occupations
The most common Natural Resources, Construction and Maintenance occupations in New Haven are Construction & Extraction (20 | 5.8%), and Installation, Maintenance & Repair (8 | 2.3%).
Natural Resources, Construction and Maintenance Occupations by Sex
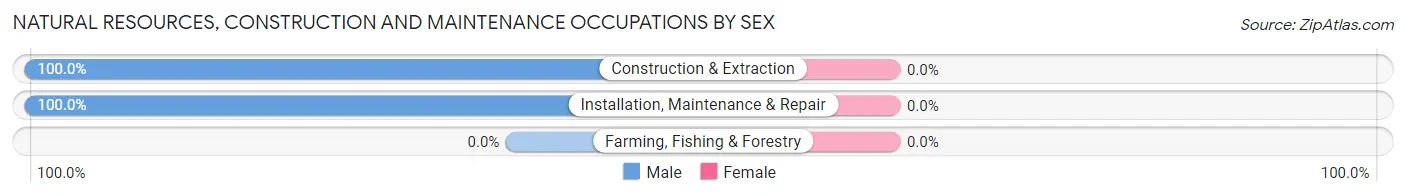
| Occupation | Male | Female |
| Farming, Fishing & Forestry | 0 (0.0%) | 0 (0.0%) |
| Construction & Extraction | 20 (100.0%) | 0 (0.0%) |
| Installation, Maintenance & Repair | 8 (100.0%) | 0 (0.0%) |
| Total (Category) | 28 (100.0%) | 0 (0.0%) |
| Total (Overall) | 175 (50.6%) | 171 (49.4%) |
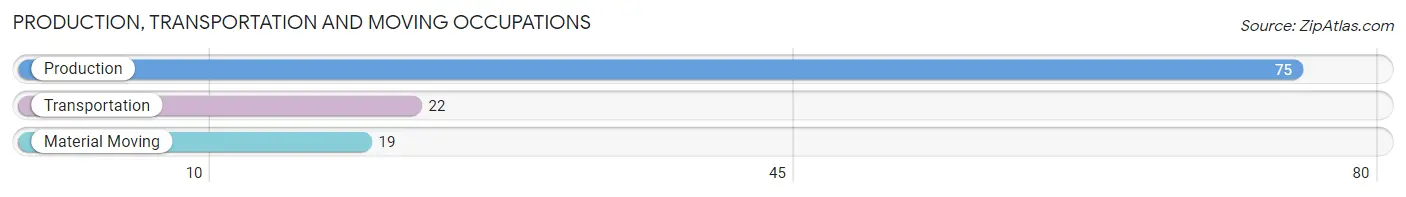
Production, Transportation and Moving Occupations
The most common Production, Transportation and Moving occupations in New Haven are Production (75 | 21.7%), Transportation (22 | 6.4%), and Material Moving (19 | 5.5%).
Production, Transportation and Moving Occupations by Sex
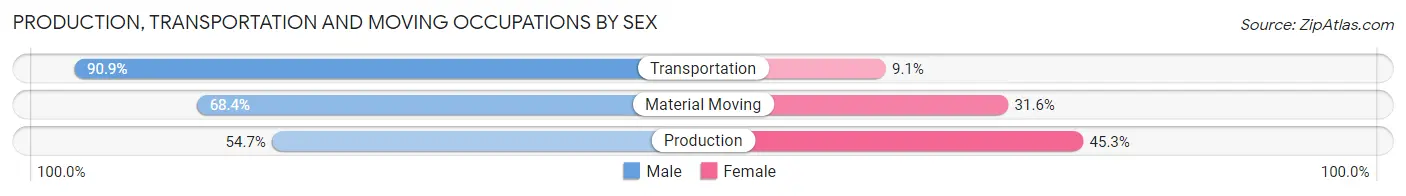
| Occupation | Male | Female |
| Production | 41 (54.7%) | 34 (45.3%) |
| Transportation | 20 (90.9%) | 2 (9.1%) |
| Material Moving | 13 (68.4%) | 6 (31.6%) |
| Total (Category) | 74 (63.8%) | 42 (36.2%) |
| Total (Overall) | 175 (50.6%) | 171 (49.4%) |
Employment Industries by Sex in New Haven
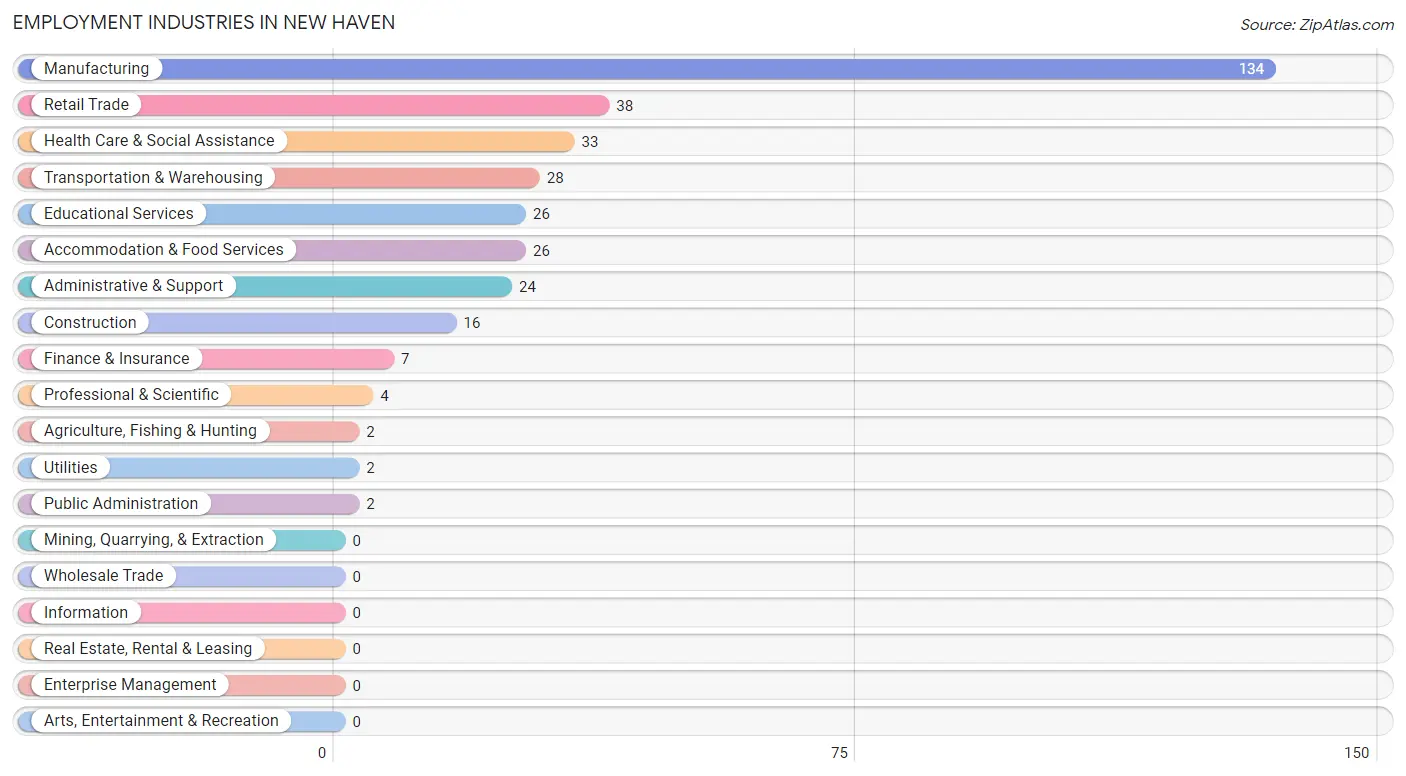
Employment Industries in New Haven
The major employment industries in New Haven include Manufacturing (134 | 38.7%), Retail Trade (38 | 11.0%), Health Care & Social Assistance (33 | 9.5%), Transportation & Warehousing (28 | 8.1%), and Educational Services (26 | 7.5%).
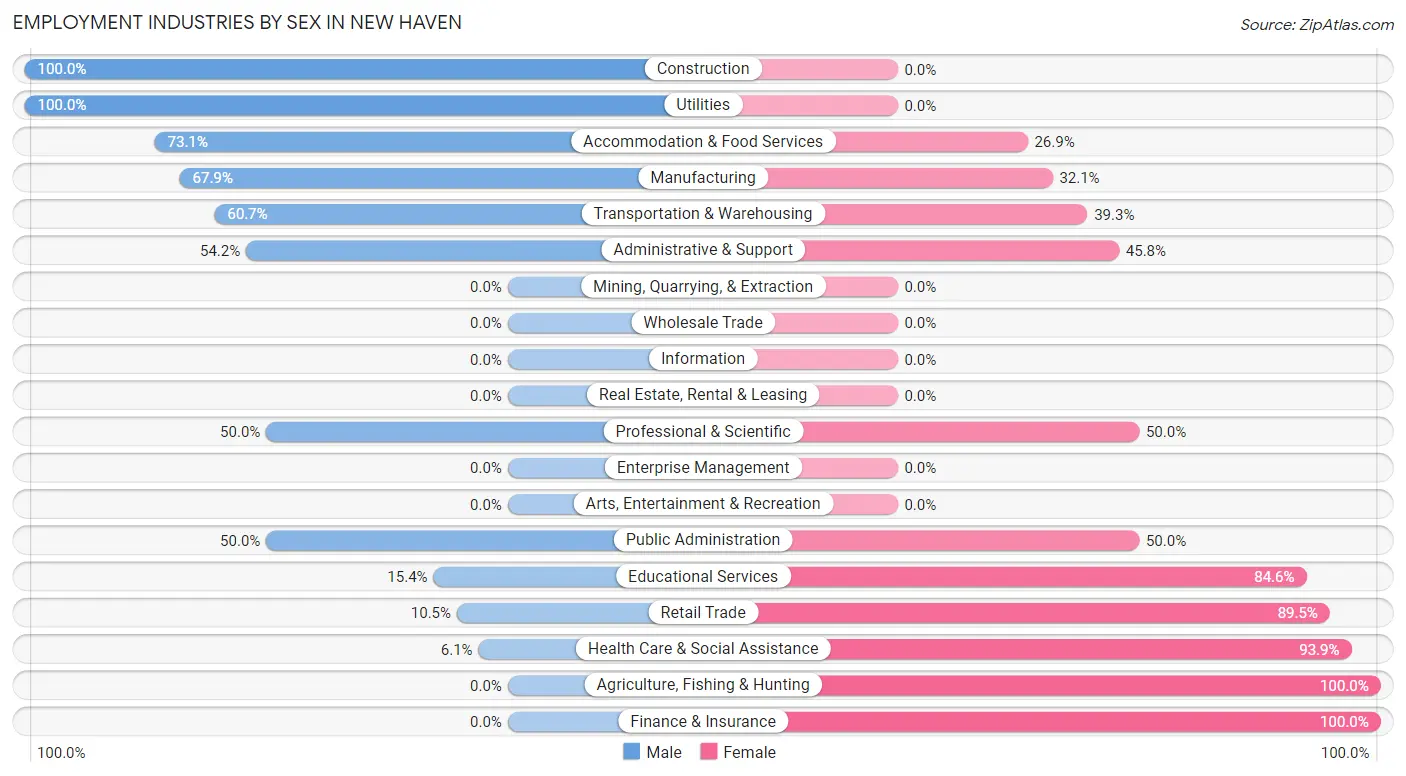
Employment Industries by Sex in New Haven
The New Haven industries that see more men than women are Construction (100.0%), Utilities (100.0%), and Accommodation & Food Services (73.1%), whereas the industries that tend to have a higher number of women are Agriculture, Fishing & Hunting (100.0%), Finance & Insurance (100.0%), and Health Care & Social Assistance (93.9%).
| Industry | Male | Female |
| Agriculture, Fishing & Hunting | 0 (0.0%) | 2 (100.0%) |
| Mining, Quarrying, & Extraction | 0 (0.0%) | 0 (0.0%) |
| Construction | 16 (100.0%) | 0 (0.0%) |
| Manufacturing | 91 (67.9%) | 43 (32.1%) |
| Wholesale Trade | 0 (0.0%) | 0 (0.0%) |
| Retail Trade | 4 (10.5%) | 34 (89.5%) |
| Transportation & Warehousing | 17 (60.7%) | 11 (39.3%) |
| Utilities | 2 (100.0%) | 0 (0.0%) |
| Information | 0 (0.0%) | 0 (0.0%) |
| Finance & Insurance | 0 (0.0%) | 7 (100.0%) |
| Real Estate, Rental & Leasing | 0 (0.0%) | 0 (0.0%) |
| Professional & Scientific | 2 (50.0%) | 2 (50.0%) |
| Enterprise Management | 0 (0.0%) | 0 (0.0%) |
| Administrative & Support | 13 (54.2%) | 11 (45.8%) |
| Educational Services | 4 (15.4%) | 22 (84.6%) |
| Health Care & Social Assistance | 2 (6.1%) | 31 (93.9%) |
| Arts, Entertainment & Recreation | 0 (0.0%) | 0 (0.0%) |
| Accommodation & Food Services | 19 (73.1%) | 7 (26.9%) |
| Public Administration | 1 (50.0%) | 1 (50.0%) |
| Total | 175 (50.6%) | 171 (49.4%) |
Education in New Haven
School Enrollment in New Haven
The most common levels of schooling among the 215 students in New Haven are elementary school (55 | 25.6%), middle school (51 | 23.7%), and college / undergraduate (39 | 18.1%).
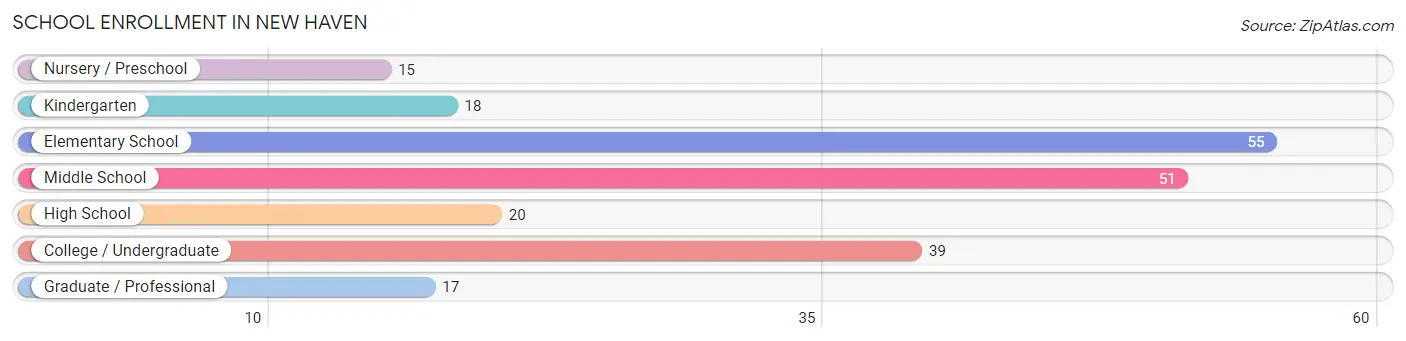
| School Level | # Students | % Students |
| Nursery / Preschool | 15 | 7.0% |
| Kindergarten | 18 | 8.4% |
| Elementary School | 55 | 25.6% |
| Middle School | 51 | 23.7% |
| High School | 20 | 9.3% |
| College / Undergraduate | 39 | 18.1% |
| Graduate / Professional | 17 | 7.9% |
| Total | 215 | 100.0% |
School Enrollment by Age by Funding Source in New Haven
Out of a total of 215 students who are enrolled in schools in New Haven, 19 (8.8%) attend a private institution, while the remaining 196 (91.2%) are enrolled in public schools. The age group of 35 years and over has the highest likelihood of being enrolled in private schools, with 5 (35.7% in the age bracket) enrolled. Conversely, the age group of 3 to 4 year olds has the lowest likelihood of being enrolled in a private school, with 5 (100.0% in the age bracket) attending a public institution.
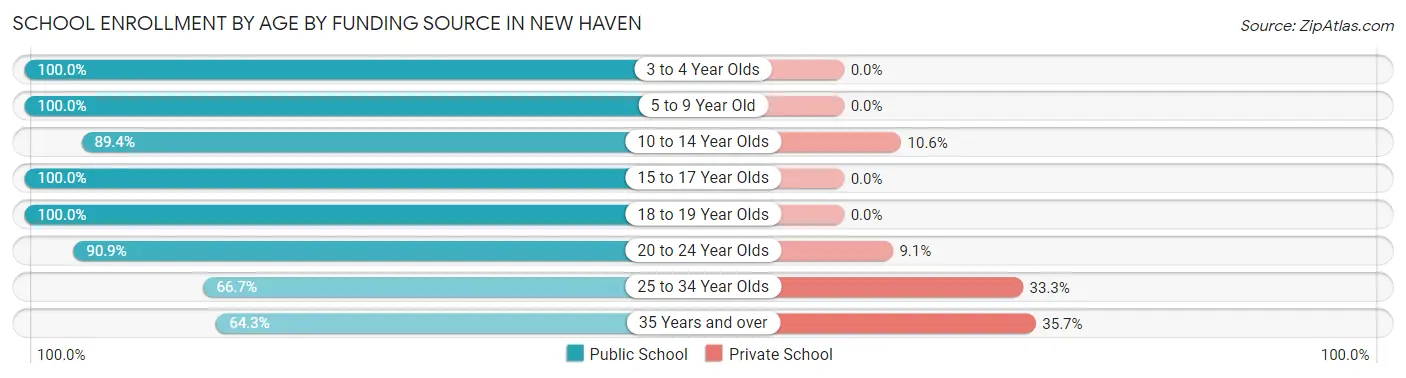
| Age Bracket | Public School | Private School |
| 3 to 4 Year Olds | 5 (100.0%) | 0 (0.0%) |
| 5 to 9 Year Old | 69 (100.0%) | 0 (0.0%) |
| 10 to 14 Year Olds | 59 (89.4%) | 7 (10.6%) |
| 15 to 17 Year Olds | 14 (100.0%) | 0 (0.0%) |
| 18 to 19 Year Olds | 2 (100.0%) | 0 (0.0%) |
| 20 to 24 Year Olds | 30 (90.9%) | 3 (9.1%) |
| 25 to 34 Year Olds | 8 (66.7%) | 4 (33.3%) |
| 35 Years and over | 9 (64.3%) | 5 (35.7%) |
| Total | 196 (91.2%) | 19 (8.8%) |
Educational Attainment by Field of Study in New Haven
Liberal arts & history (24 | 32.9%), physical & health sciences (13 | 17.8%), business (12 | 16.4%), education (10 | 13.7%), and psychology (6 | 8.2%) are the most common fields of study among 73 individuals in New Haven who have obtained a bachelor's degree or higher.
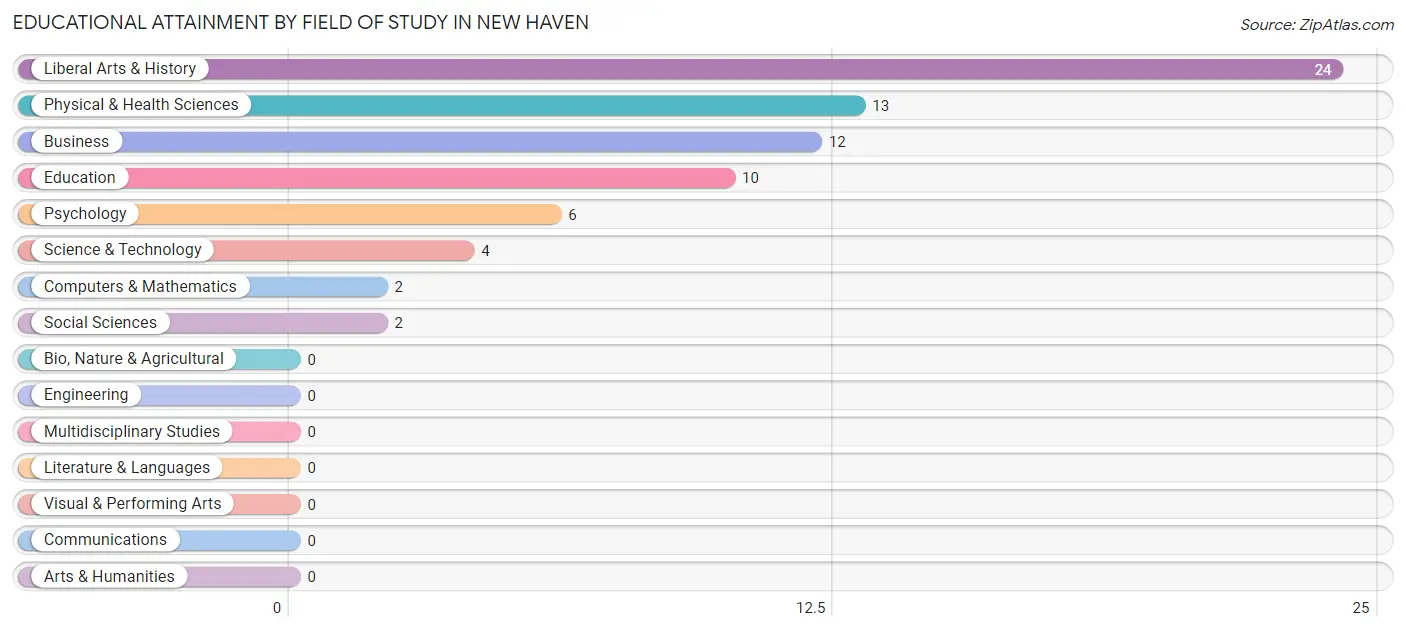
| Field of Study | # Graduates | % Graduates |
| Computers & Mathematics | 2 | 2.7% |
| Bio, Nature & Agricultural | 0 | 0.0% |
| Physical & Health Sciences | 13 | 17.8% |
| Psychology | 6 | 8.2% |
| Social Sciences | 2 | 2.7% |
| Engineering | 0 | 0.0% |
| Multidisciplinary Studies | 0 | 0.0% |
| Science & Technology | 4 | 5.5% |
| Business | 12 | 16.4% |
| Education | 10 | 13.7% |
| Literature & Languages | 0 | 0.0% |
| Liberal Arts & History | 24 | 32.9% |
| Visual & Performing Arts | 0 | 0.0% |
| Communications | 0 | 0.0% |
| Arts & Humanities | 0 | 0.0% |
| Total | 73 | 100.0% |
Transportation & Commute in New Haven
Vehicle Availability by Sex in New Haven
The most prevalent vehicle ownership categories in New Haven are males with 2 vehicles (78, accounting for 44.6%) and females with 2 vehicles (47, making up 51.3%).
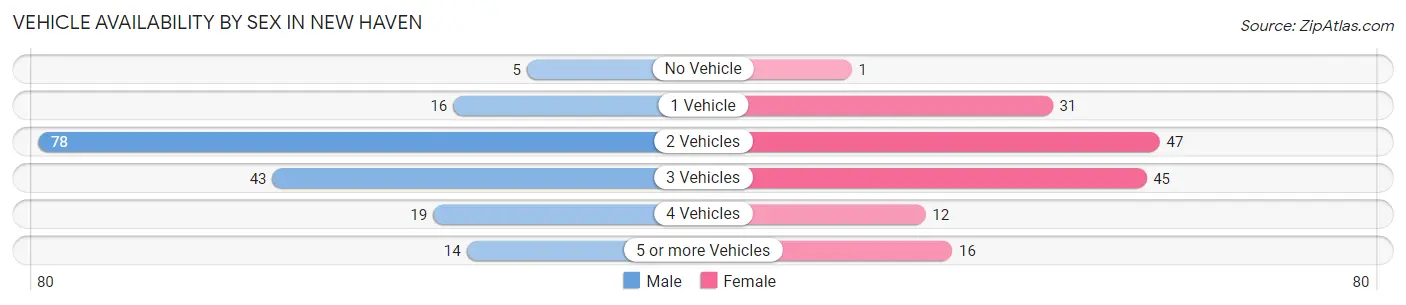
| Vehicles Available | Male | Female |
| No Vehicle | 5 (2.9%) | 1 (0.7%) |
| 1 Vehicle | 16 (9.1%) | 31 (20.4%) |
| 2 Vehicles | 78 (44.6%) | 47 (30.9%) |
| 3 Vehicles | 43 (24.6%) | 45 (29.6%) |
| 4 Vehicles | 19 (10.9%) | 12 (7.9%) |
| 5 or more Vehicles | 14 (8.0%) | 16 (10.5%) |
| Total | 175 (100.0%) | 152 (100.0%) |
Commute Time in New Haven
The most frequently occuring commute durations in New Haven are 20 to 24 minutes (82 commuters, 25.6%), 60 to 89 minutes (45 commuters, 14.1%), and 45 to 59 minutes (41 commuters, 12.8%).
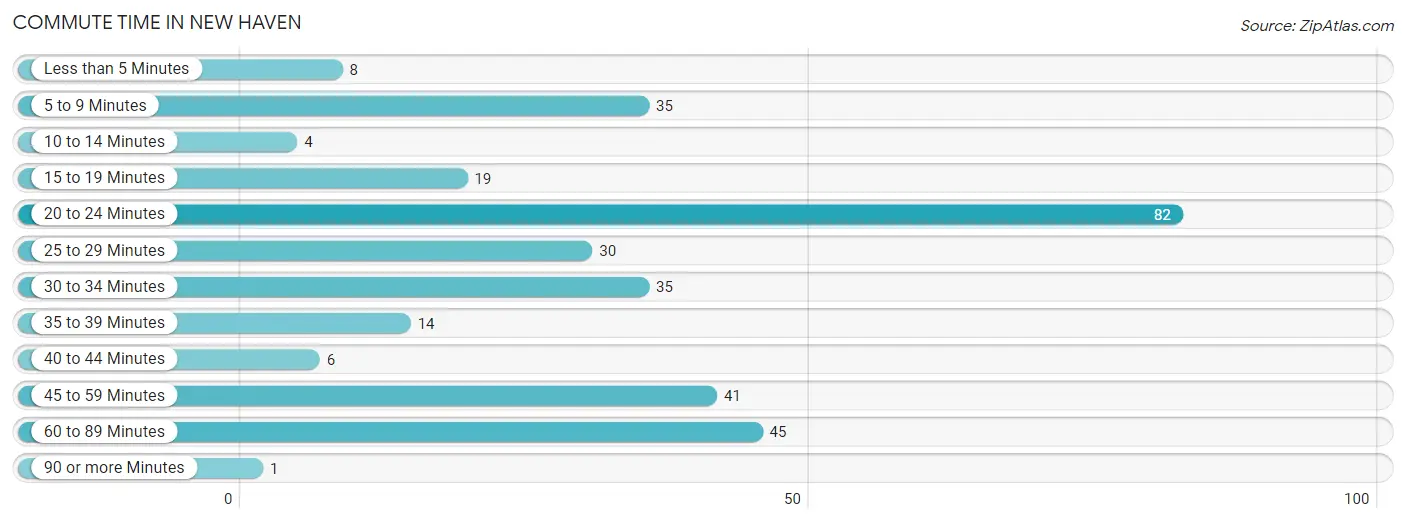
| Commute Time | # Commuters | % Commuters |
| Less than 5 Minutes | 8 | 2.5% |
| 5 to 9 Minutes | 35 | 10.9% |
| 10 to 14 Minutes | 4 | 1.3% |
| 15 to 19 Minutes | 19 | 5.9% |
| 20 to 24 Minutes | 82 | 25.6% |
| 25 to 29 Minutes | 30 | 9.4% |
| 30 to 34 Minutes | 35 | 10.9% |
| 35 to 39 Minutes | 14 | 4.4% |
| 40 to 44 Minutes | 6 | 1.9% |
| 45 to 59 Minutes | 41 | 12.8% |
| 60 to 89 Minutes | 45 | 14.1% |
| 90 or more Minutes | 1 | 0.3% |
Commute Time by Sex in New Haven
The most common commute times in New Haven are 60 to 89 minutes (45 commuters, 26.2%) for males and 20 to 24 minutes (48 commuters, 32.4%) for females.
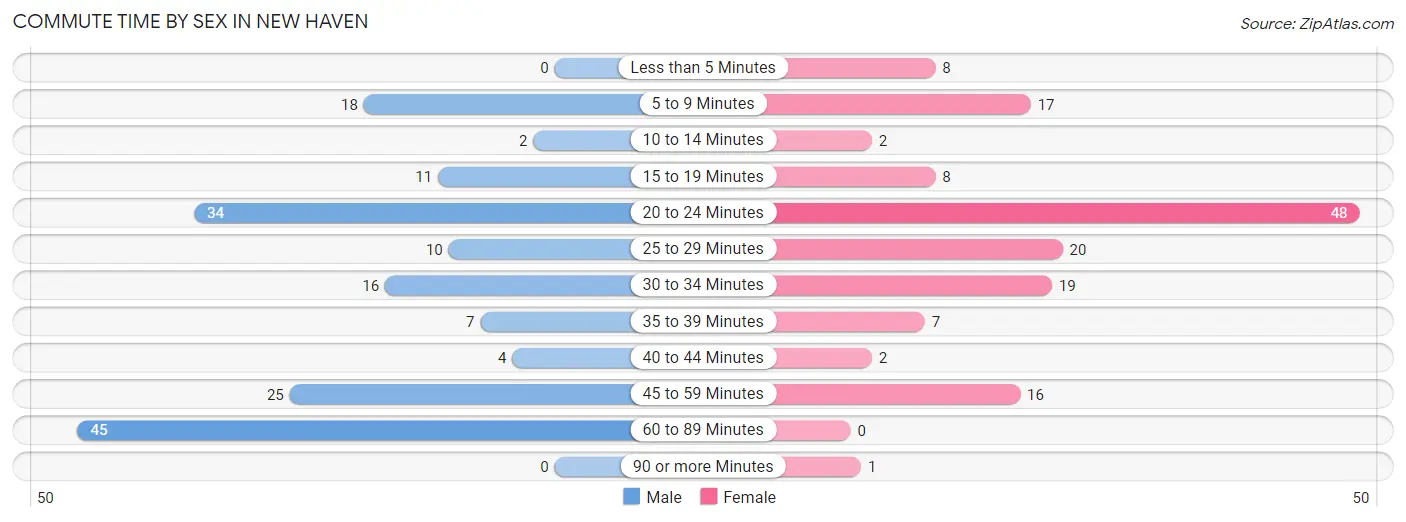
| Commute Time | Male | Female |
| Less than 5 Minutes | 0 (0.0%) | 8 (5.4%) |
| 5 to 9 Minutes | 18 (10.5%) | 17 (11.5%) |
| 10 to 14 Minutes | 2 (1.2%) | 2 (1.3%) |
| 15 to 19 Minutes | 11 (6.4%) | 8 (5.4%) |
| 20 to 24 Minutes | 34 (19.8%) | 48 (32.4%) |
| 25 to 29 Minutes | 10 (5.8%) | 20 (13.5%) |
| 30 to 34 Minutes | 16 (9.3%) | 19 (12.8%) |
| 35 to 39 Minutes | 7 (4.1%) | 7 (4.7%) |
| 40 to 44 Minutes | 4 (2.3%) | 2 (1.3%) |
| 45 to 59 Minutes | 25 (14.5%) | 16 (10.8%) |
| 60 to 89 Minutes | 45 (26.2%) | 0 (0.0%) |
| 90 or more Minutes | 0 (0.0%) | 1 (0.7%) |
Time of Departure to Work by Sex in New Haven
The most frequent times of departure to work in New Haven are 12:00 PM to 3:59 PM (44, 25.6%) for males and 7:00 AM to 7:29 AM (33, 22.3%) for females.
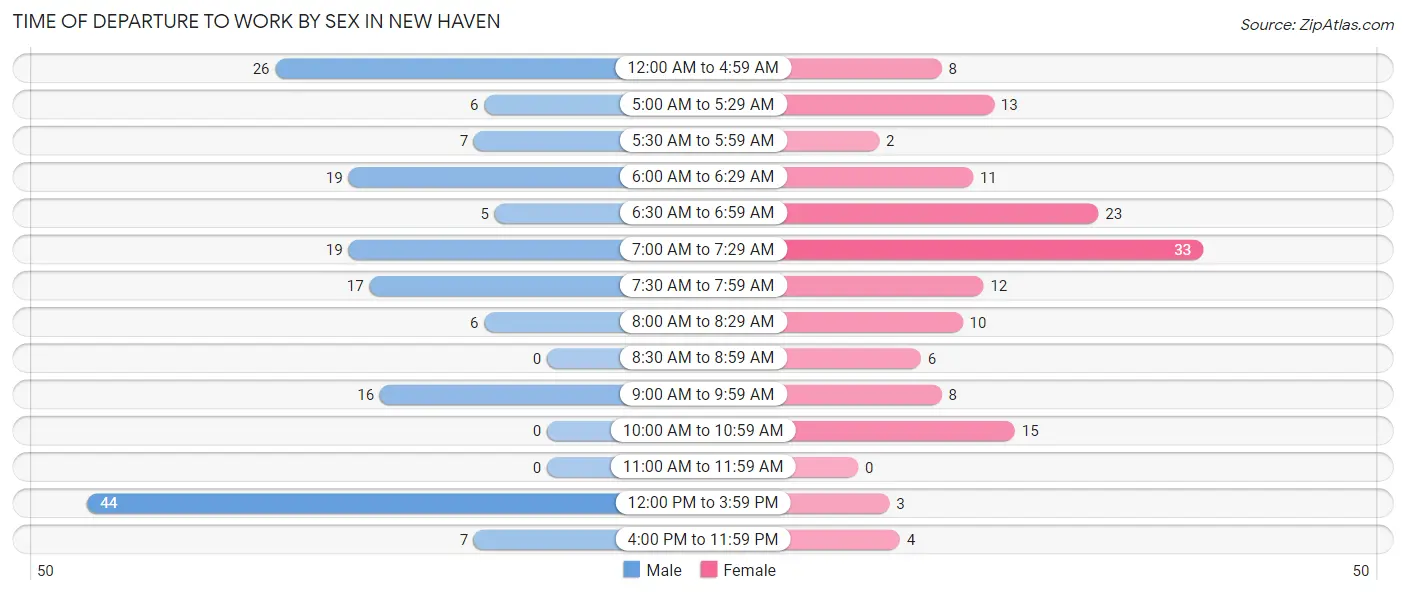
| Time of Departure | Male | Female |
| 12:00 AM to 4:59 AM | 26 (15.1%) | 8 (5.4%) |
| 5:00 AM to 5:29 AM | 6 (3.5%) | 13 (8.8%) |
| 5:30 AM to 5:59 AM | 7 (4.1%) | 2 (1.3%) |
| 6:00 AM to 6:29 AM | 19 (11.1%) | 11 (7.4%) |
| 6:30 AM to 6:59 AM | 5 (2.9%) | 23 (15.5%) |
| 7:00 AM to 7:29 AM | 19 (11.1%) | 33 (22.3%) |
| 7:30 AM to 7:59 AM | 17 (9.9%) | 12 (8.1%) |
| 8:00 AM to 8:29 AM | 6 (3.5%) | 10 (6.8%) |
| 8:30 AM to 8:59 AM | 0 (0.0%) | 6 (4.1%) |
| 9:00 AM to 9:59 AM | 16 (9.3%) | 8 (5.4%) |
| 10:00 AM to 10:59 AM | 0 (0.0%) | 15 (10.1%) |
| 11:00 AM to 11:59 AM | 0 (0.0%) | 0 (0.0%) |
| 12:00 PM to 3:59 PM | 44 (25.6%) | 3 (2.0%) |
| 4:00 PM to 11:59 PM | 7 (4.1%) | 4 (2.7%) |
| Total | 172 (100.0%) | 148 (100.0%) |
Housing Occupancy in New Haven
Occupancy by Ownership in New Haven
Of the total 322 dwellings in New Haven, owner-occupied units account for 226 (70.2%), while renter-occupied units make up 96 (29.8%).
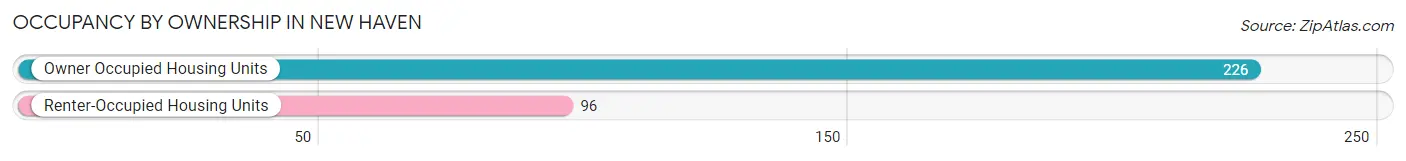
| Occupancy | # Housing Units | % Housing Units |
| Owner Occupied Housing Units | 226 | 70.2% |
| Renter-Occupied Housing Units | 96 | 29.8% |
| Total Occupied Housing Units | 322 | 100.0% |
Occupancy by Household Size in New Haven
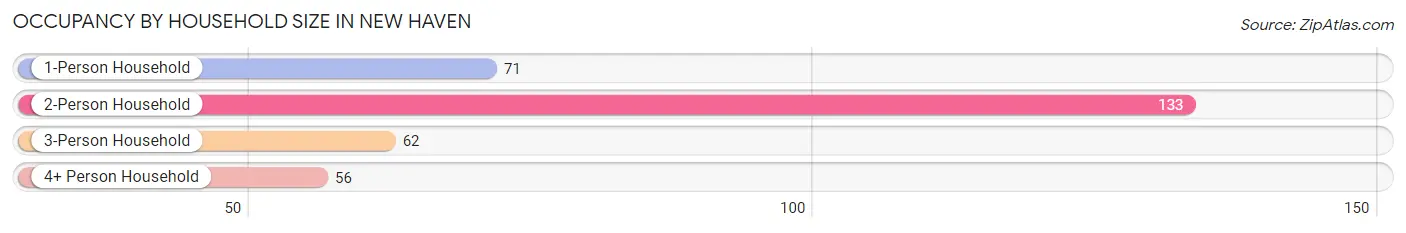
| Household Size | # Housing Units | % Housing Units |
| 1-Person Household | 71 | 22.1% |
| 2-Person Household | 133 | 41.3% |
| 3-Person Household | 62 | 19.3% |
| 4+ Person Household | 56 | 17.4% |
| Total Housing Units | 322 | 100.0% |
Occupancy by Ownership by Household Size in New Haven
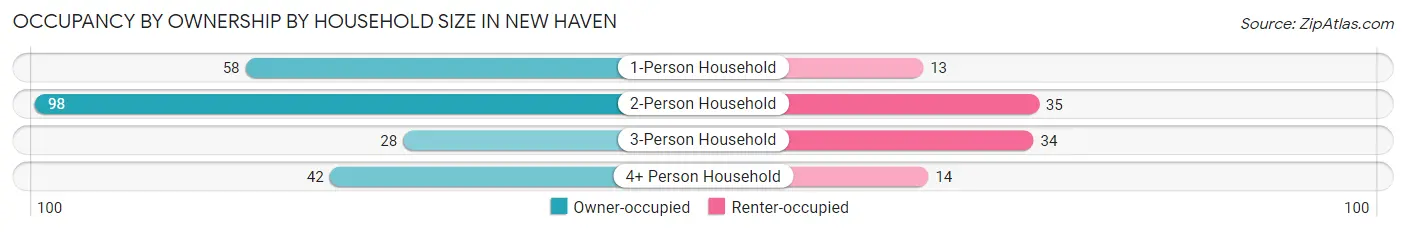
| Household Size | Owner-occupied | Renter-occupied |
| 1-Person Household | 58 (81.7%) | 13 (18.3%) |
| 2-Person Household | 98 (73.7%) | 35 (26.3%) |
| 3-Person Household | 28 (45.2%) | 34 (54.8%) |
| 4+ Person Household | 42 (75.0%) | 14 (25.0%) |
| Total Housing Units | 226 (70.2%) | 96 (29.8%) |
Occupancy by Educational Attainment in New Haven
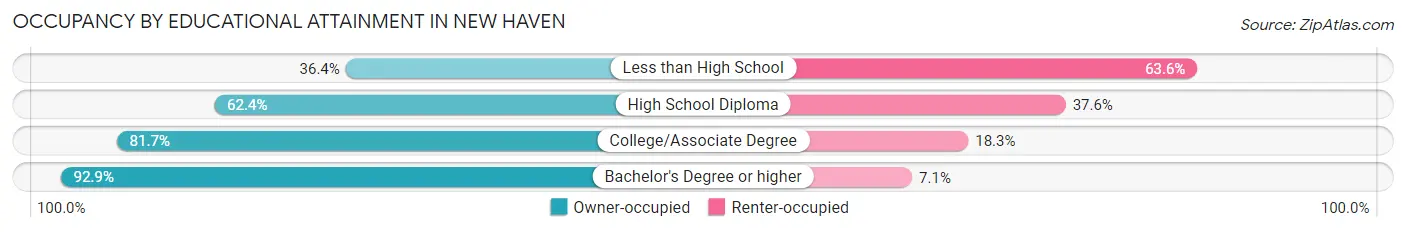
| Household Size | Owner-occupied | Renter-occupied |
| Less than High School | 8 (36.4%) | 14 (63.6%) |
| High School Diploma | 98 (62.4%) | 59 (37.6%) |
| College/Associate Degree | 94 (81.7%) | 21 (18.3%) |
| Bachelor's Degree or higher | 26 (92.9%) | 2 (7.1%) |
Occupancy by Age of Householder in New Haven
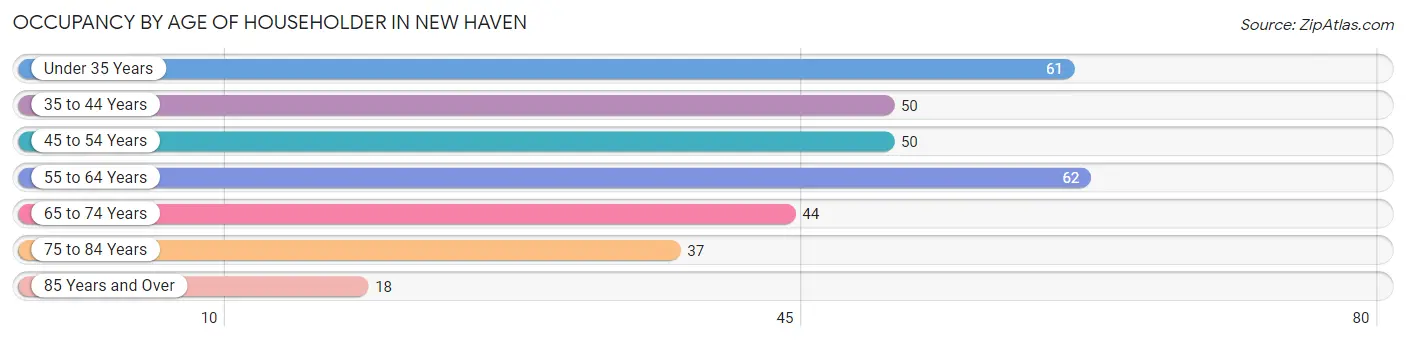
| Age Bracket | # Households | % Households |
| Under 35 Years | 61 | 18.9% |
| 35 to 44 Years | 50 | 15.5% |
| 45 to 54 Years | 50 | 15.5% |
| 55 to 64 Years | 62 | 19.3% |
| 65 to 74 Years | 44 | 13.7% |
| 75 to 84 Years | 37 | 11.5% |
| 85 Years and Over | 18 | 5.6% |
| Total | 322 | 100.0% |
Housing Finances in New Haven
Median Income by Occupancy in New Haven
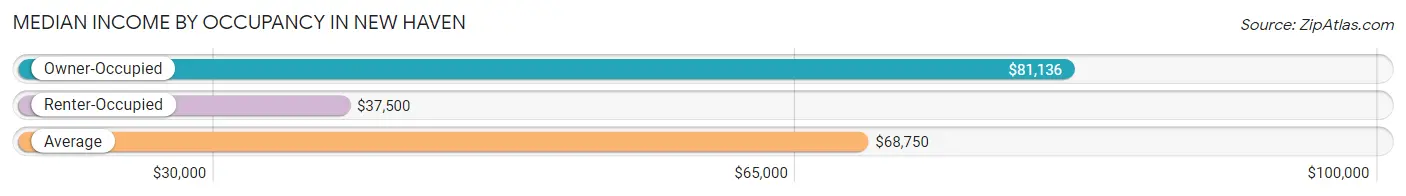
| Occupancy Type | # Households | Median Income |
| Owner-Occupied | 226 (70.2%) | $81,136 |
| Renter-Occupied | 96 (29.8%) | $37,500 |
| Average | 322 (100.0%) | $68,750 |
Occupancy by Householder Income Bracket in New Haven
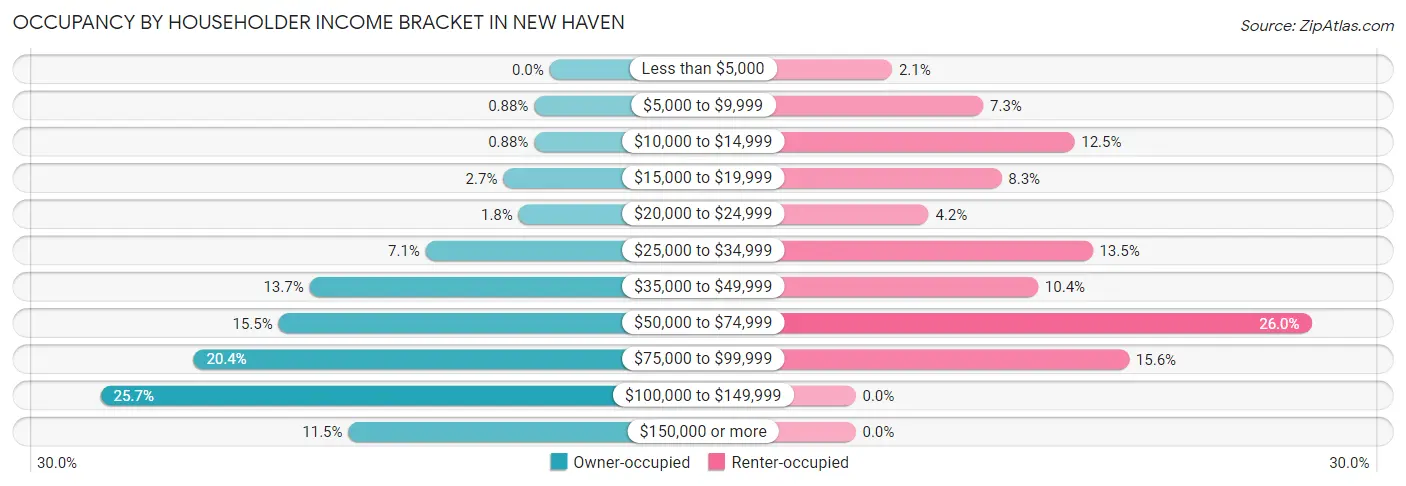
| Income Bracket | Owner-occupied | Renter-occupied |
| Less than $5,000 | 0 (0.0%) | 2 (2.1%) |
| $5,000 to $9,999 | 2 (0.9%) | 7 (7.3%) |
| $10,000 to $14,999 | 2 (0.9%) | 12 (12.5%) |
| $15,000 to $19,999 | 6 (2.6%) | 8 (8.3%) |
| $20,000 to $24,999 | 4 (1.8%) | 4 (4.2%) |
| $25,000 to $34,999 | 16 (7.1%) | 13 (13.5%) |
| $35,000 to $49,999 | 31 (13.7%) | 10 (10.4%) |
| $50,000 to $74,999 | 35 (15.5%) | 25 (26.0%) |
| $75,000 to $99,999 | 46 (20.3%) | 15 (15.6%) |
| $100,000 to $149,999 | 58 (25.7%) | 0 (0.0%) |
| $150,000 or more | 26 (11.5%) | 0 (0.0%) |
| Total | 226 (100.0%) | 96 (100.0%) |
Monthly Housing Cost Tiers in New Haven
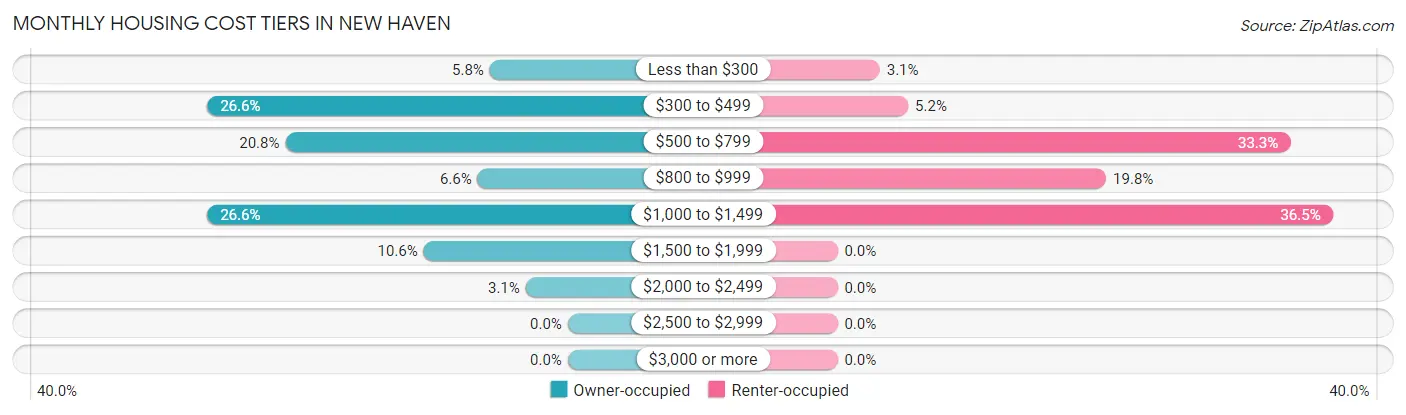
| Monthly Cost | Owner-occupied | Renter-occupied |
| Less than $300 | 13 (5.8%) | 3 (3.1%) |
| $300 to $499 | 60 (26.6%) | 5 (5.2%) |
| $500 to $799 | 47 (20.8%) | 32 (33.3%) |
| $800 to $999 | 15 (6.6%) | 19 (19.8%) |
| $1,000 to $1,499 | 60 (26.6%) | 35 (36.5%) |
| $1,500 to $1,999 | 24 (10.6%) | 0 (0.0%) |
| $2,000 to $2,499 | 7 (3.1%) | 0 (0.0%) |
| $2,500 to $2,999 | 0 (0.0%) | 0 (0.0%) |
| $3,000 or more | 0 (0.0%) | 0 (0.0%) |
| Total | 226 (100.0%) | 96 (100.0%) |
Physical Housing Characteristics in New Haven
Housing Structures in New Haven
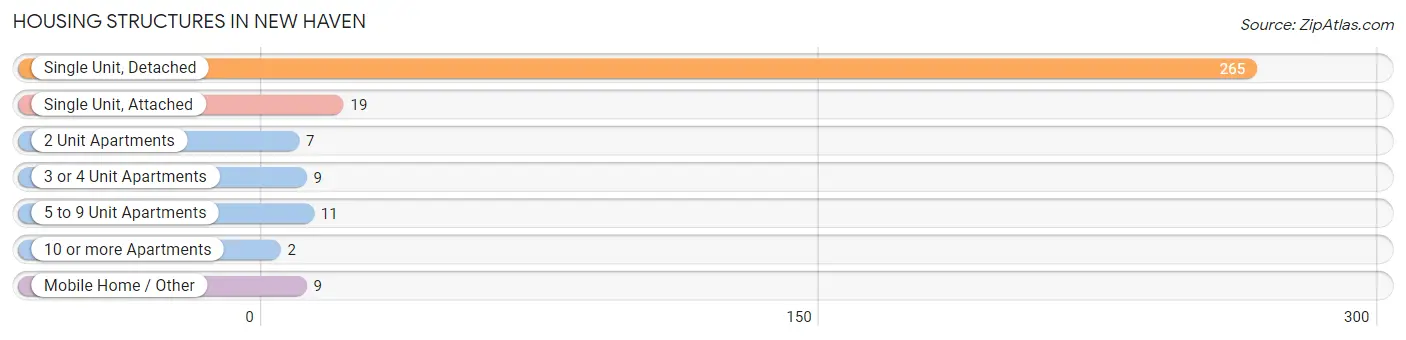
| Structure Type | # Housing Units | % Housing Units |
| Single Unit, Detached | 265 | 82.3% |
| Single Unit, Attached | 19 | 5.9% |
| 2 Unit Apartments | 7 | 2.2% |
| 3 or 4 Unit Apartments | 9 | 2.8% |
| 5 to 9 Unit Apartments | 11 | 3.4% |
| 10 or more Apartments | 2 | 0.6% |
| Mobile Home / Other | 9 | 2.8% |
| Total | 322 | 100.0% |
Housing Structures by Occupancy in New Haven
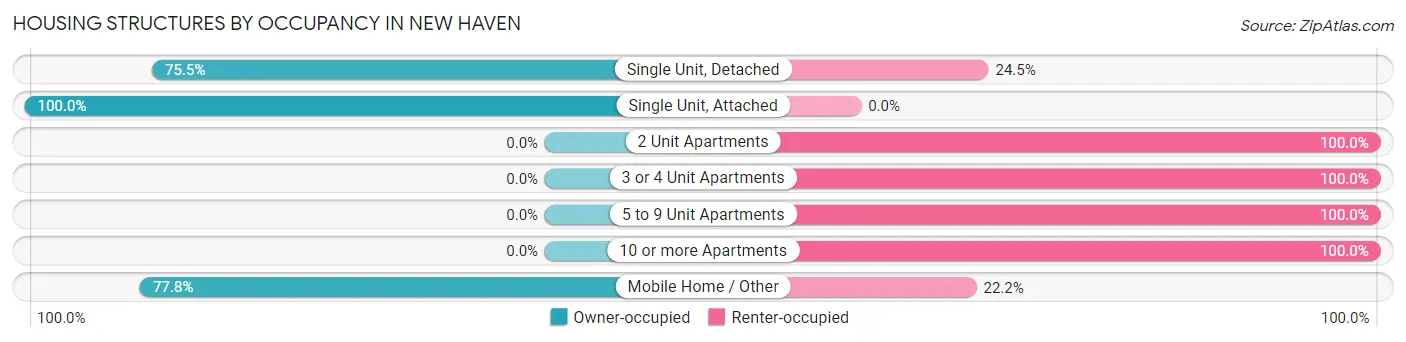
| Structure Type | Owner-occupied | Renter-occupied |
| Single Unit, Detached | 200 (75.5%) | 65 (24.5%) |
| Single Unit, Attached | 19 (100.0%) | 0 (0.0%) |
| 2 Unit Apartments | 0 (0.0%) | 7 (100.0%) |
| 3 or 4 Unit Apartments | 0 (0.0%) | 9 (100.0%) |
| 5 to 9 Unit Apartments | 0 (0.0%) | 11 (100.0%) |
| 10 or more Apartments | 0 (0.0%) | 2 (100.0%) |
| Mobile Home / Other | 7 (77.8%) | 2 (22.2%) |
| Total | 226 (70.2%) | 96 (29.8%) |
Housing Structures by Number of Rooms in New Haven
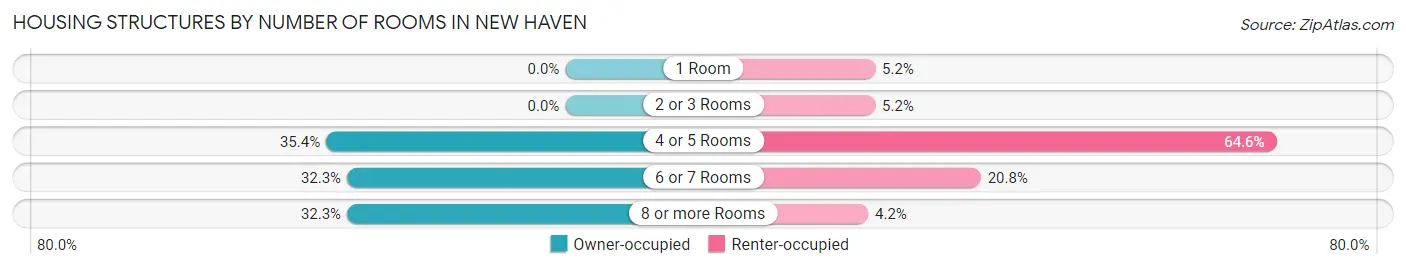
| Number of Rooms | Owner-occupied | Renter-occupied |
| 1 Room | 0 (0.0%) | 5 (5.2%) |
| 2 or 3 Rooms | 0 (0.0%) | 5 (5.2%) |
| 4 or 5 Rooms | 80 (35.4%) | 62 (64.6%) |
| 6 or 7 Rooms | 73 (32.3%) | 20 (20.8%) |
| 8 or more Rooms | 73 (32.3%) | 4 (4.2%) |
| Total | 226 (100.0%) | 96 (100.0%) |
Housing Structure by Heating Type in New Haven
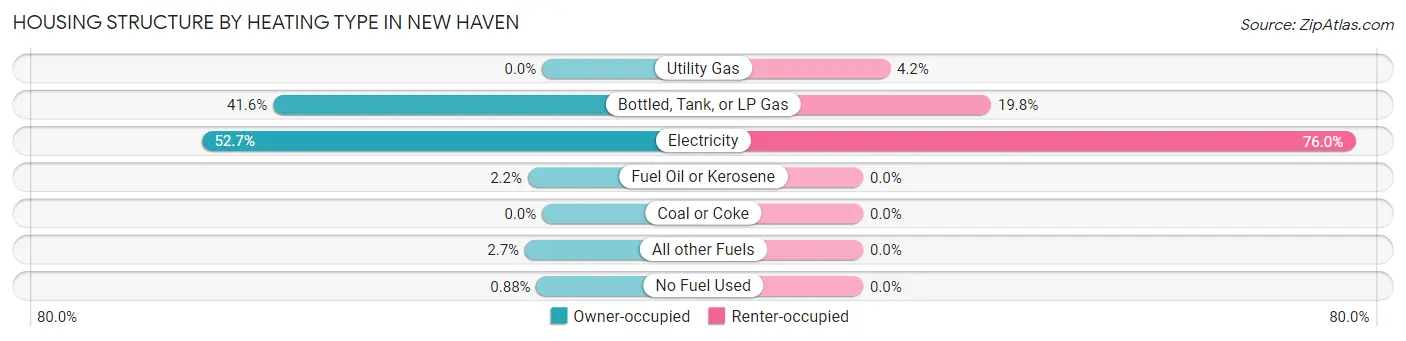
| Heating Type | Owner-occupied | Renter-occupied |
| Utility Gas | 0 (0.0%) | 4 (4.2%) |
| Bottled, Tank, or LP Gas | 94 (41.6%) | 19 (19.8%) |
| Electricity | 119 (52.6%) | 73 (76.0%) |
| Fuel Oil or Kerosene | 5 (2.2%) | 0 (0.0%) |
| Coal or Coke | 0 (0.0%) | 0 (0.0%) |
| All other Fuels | 6 (2.6%) | 0 (0.0%) |
| No Fuel Used | 2 (0.9%) | 0 (0.0%) |
| Total | 226 (100.0%) | 96 (100.0%) |
Household Vehicle Usage in New Haven
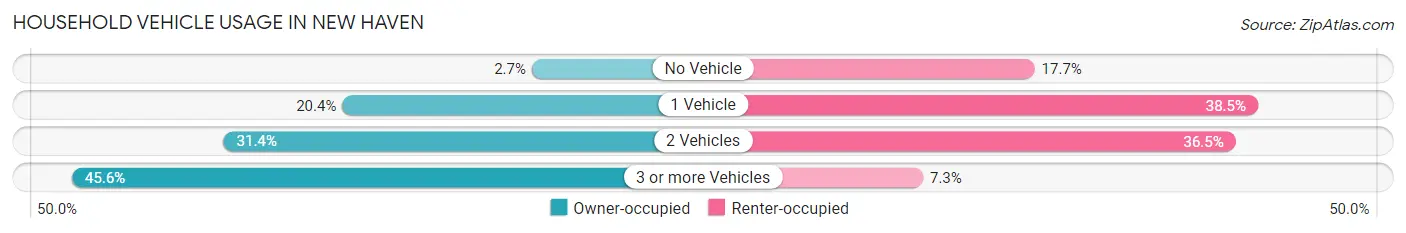
| Vehicles per Household | Owner-occupied | Renter-occupied |
| No Vehicle | 6 (2.6%) | 17 (17.7%) |
| 1 Vehicle | 46 (20.3%) | 37 (38.5%) |
| 2 Vehicles | 71 (31.4%) | 35 (36.5%) |
| 3 or more Vehicles | 103 (45.6%) | 7 (7.3%) |
| Total | 226 (100.0%) | 96 (100.0%) |
Real Estate & Mortgages in New Haven
Real Estate and Mortgage Overview in New Haven
| Characteristic | Without Mortgage | With Mortgage |
| Housing Units | 115 | 111 |
| Median Property Value | $144,200 | $121,800 |
| Median Household Income | $76,458 | $8 |
| Monthly Housing Costs | $396 | $0 |
| Real Estate Taxes | $950 | $12 |
Property Value by Mortgage Status in New Haven
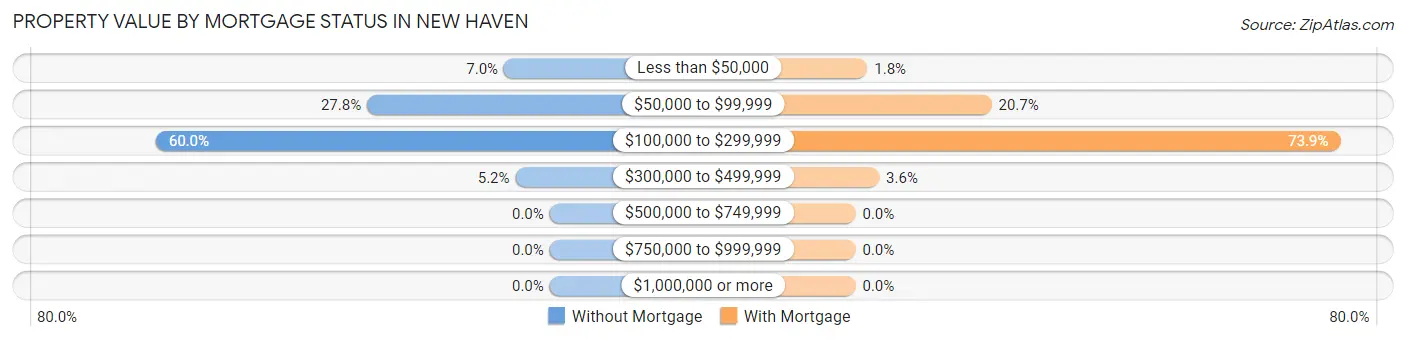
| Property Value | Without Mortgage | With Mortgage |
| Less than $50,000 | 8 (7.0%) | 2 (1.8%) |
| $50,000 to $99,999 | 32 (27.8%) | 23 (20.7%) |
| $100,000 to $299,999 | 69 (60.0%) | 82 (73.9%) |
| $300,000 to $499,999 | 6 (5.2%) | 4 (3.6%) |
| $500,000 to $749,999 | 0 (0.0%) | 0 (0.0%) |
| $750,000 to $999,999 | 0 (0.0%) | 0 (0.0%) |
| $1,000,000 or more | 0 (0.0%) | 0 (0.0%) |
| Total | 115 (100.0%) | 111 (100.0%) |
Household Income by Mortgage Status in New Haven
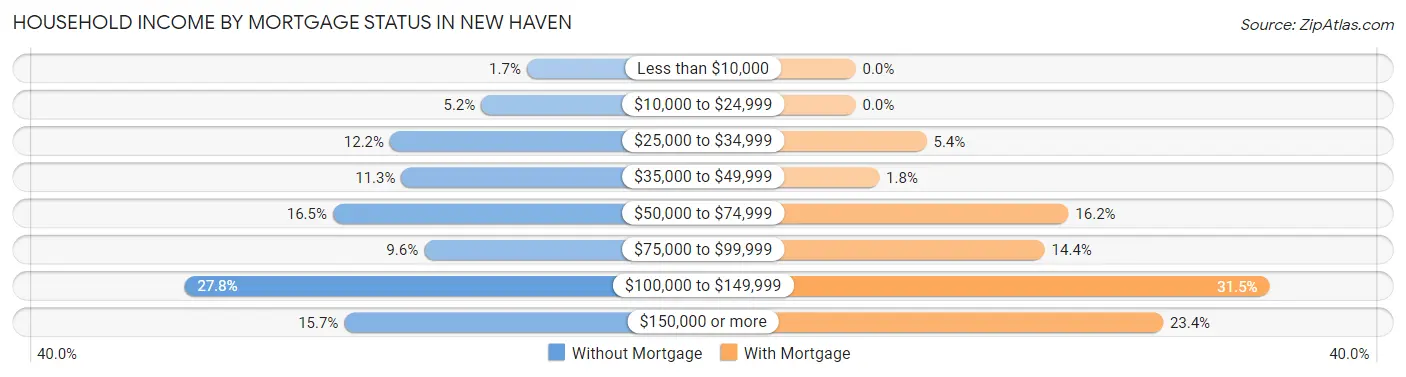
| Household Income | Without Mortgage | With Mortgage |
| Less than $10,000 | 2 (1.7%) | 0 (0.0%) |
| $10,000 to $24,999 | 6 (5.2%) | 0 (0.0%) |
| $25,000 to $34,999 | 14 (12.2%) | 6 (5.4%) |
| $35,000 to $49,999 | 13 (11.3%) | 2 (1.8%) |
| $50,000 to $74,999 | 19 (16.5%) | 18 (16.2%) |
| $75,000 to $99,999 | 11 (9.6%) | 16 (14.4%) |
| $100,000 to $149,999 | 32 (27.8%) | 35 (31.5%) |
| $150,000 or more | 18 (15.7%) | 26 (23.4%) |
| Total | 115 (100.0%) | 111 (100.0%) |
Property Value to Household Income Ratio in New Haven
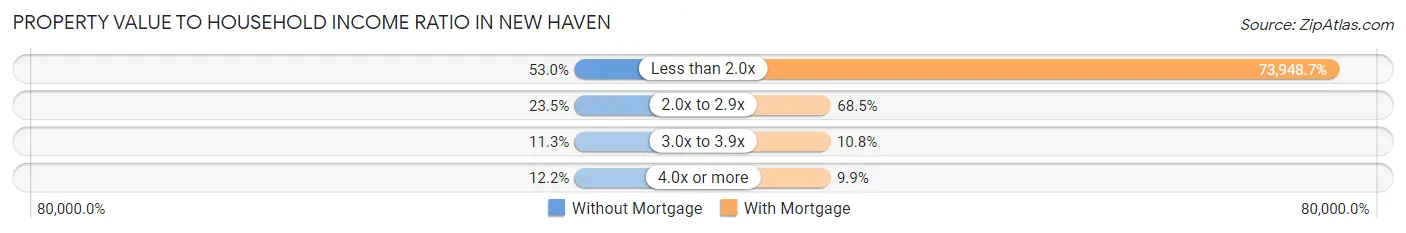
| Value-to-Income Ratio | Without Mortgage | With Mortgage |
| Less than 2.0x | 61 (53.0%) | 82,083 (73,948.6%) |
| 2.0x to 2.9x | 27 (23.5%) | 76 (68.5%) |
| 3.0x to 3.9x | 13 (11.3%) | 12 (10.8%) |
| 4.0x or more | 14 (12.2%) | 11 (9.9%) |
| Total | 115 (100.0%) | 111 (100.0%) |
Real Estate Taxes by Mortgage Status in New Haven
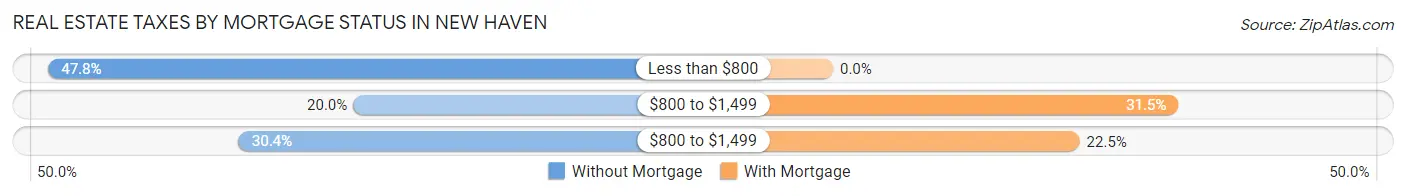
| Property Taxes | Without Mortgage | With Mortgage |
| Less than $800 | 55 (47.8%) | 0 (0.0%) |
| $800 to $1,499 | 23 (20.0%) | 35 (31.5%) |
| $800 to $1,499 | 35 (30.4%) | 25 (22.5%) |
| Total | 115 (100.0%) | 111 (100.0%) |
Health & Disability in New Haven
Health Insurance Coverage by Age in New Haven
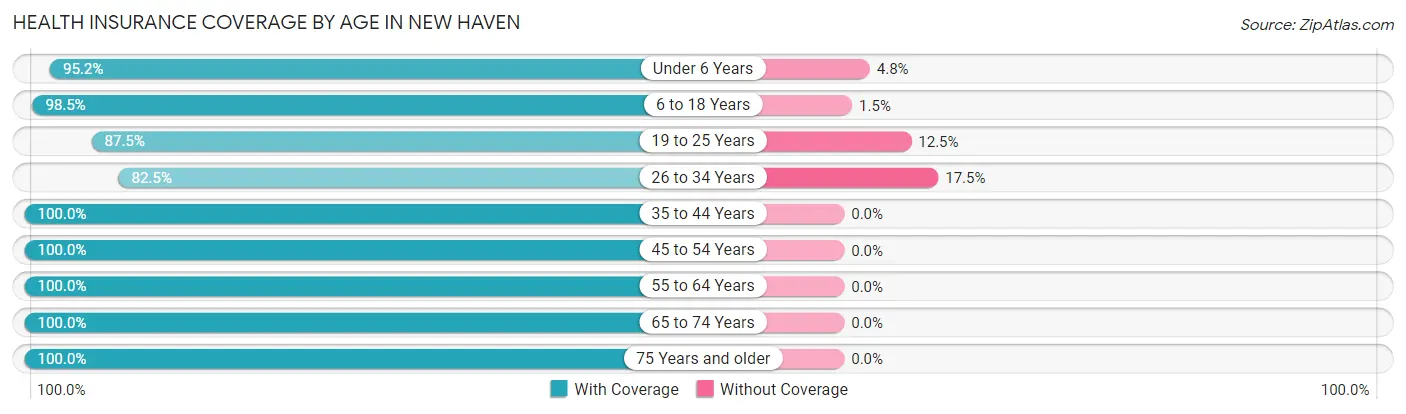
| Age Bracket | With Coverage | Without Coverage |
| Under 6 Years | 40 (95.2%) | 2 (4.8%) |
| 6 to 18 Years | 134 (98.5%) | 2 (1.5%) |
| 19 to 25 Years | 63 (87.5%) | 9 (12.5%) |
| 26 to 34 Years | 80 (82.5%) | 17 (17.5%) |
| 35 to 44 Years | 81 (100.0%) | 0 (0.0%) |
| 45 to 54 Years | 102 (100.0%) | 0 (0.0%) |
| 55 to 64 Years | 101 (100.0%) | 0 (0.0%) |
| 65 to 74 Years | 74 (100.0%) | 0 (0.0%) |
| 75 Years and older | 84 (100.0%) | 0 (0.0%) |
| Total | 759 (96.2%) | 30 (3.8%) |
Health Insurance Coverage by Citizenship Status in New Haven
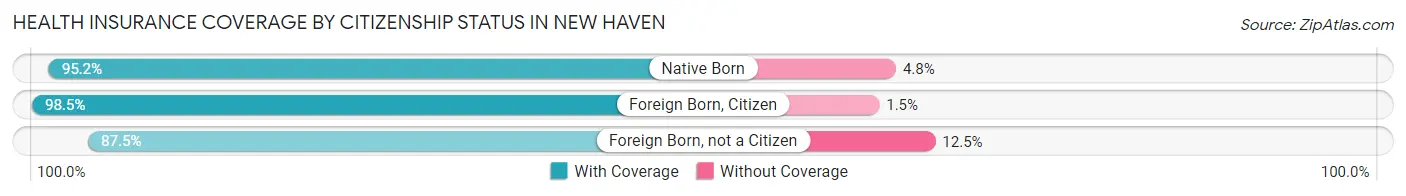
| Citizenship Status | With Coverage | Without Coverage |
| Native Born | 40 (95.2%) | 2 (4.8%) |
| Foreign Born, Citizen | 134 (98.5%) | 2 (1.5%) |
| Foreign Born, not a Citizen | 63 (87.5%) | 9 (12.5%) |
Health Insurance Coverage by Household Income in New Haven
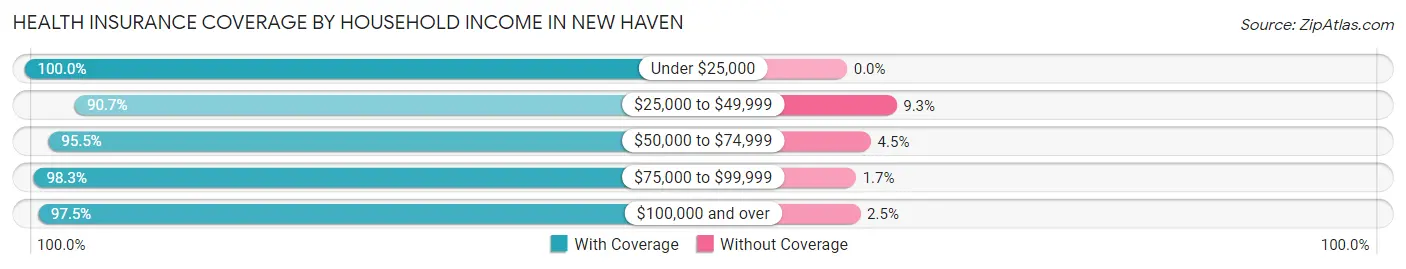
| Household Income | With Coverage | Without Coverage |
| Under $25,000 | 99 (100.0%) | 0 (0.0%) |
| $25,000 to $49,999 | 137 (90.7%) | 14 (9.3%) |
| $50,000 to $74,999 | 171 (95.5%) | 8 (4.5%) |
| $75,000 to $99,999 | 118 (98.3%) | 2 (1.7%) |
| $100,000 and over | 234 (97.5%) | 6 (2.5%) |
Public vs Private Health Insurance Coverage by Age in New Haven
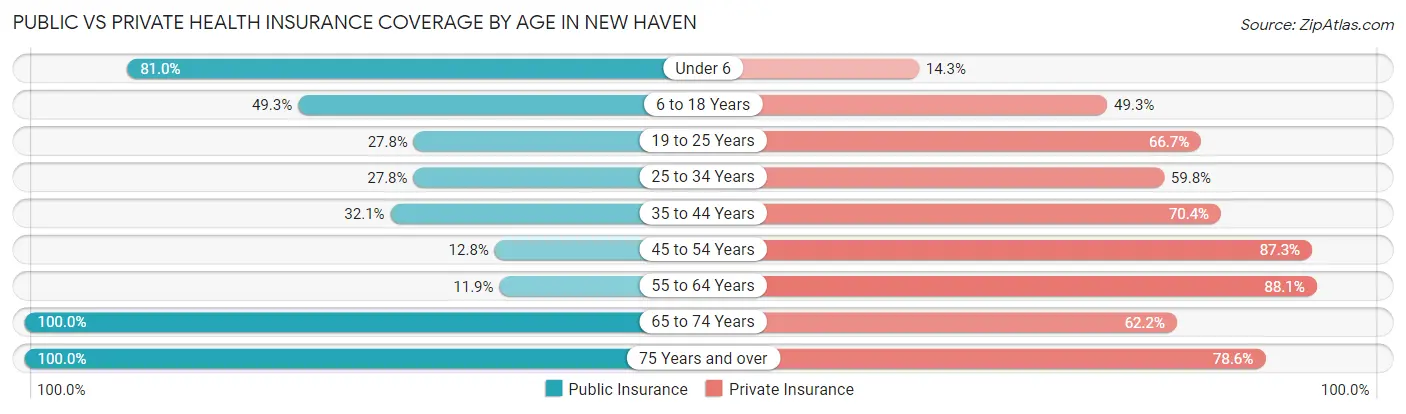
| Age Bracket | Public Insurance | Private Insurance |
| Under 6 | 34 (80.9%) | 6 (14.3%) |
| 6 to 18 Years | 67 (49.3%) | 67 (49.3%) |
| 19 to 25 Years | 20 (27.8%) | 48 (66.7%) |
| 25 to 34 Years | 27 (27.8%) | 58 (59.8%) |
| 35 to 44 Years | 26 (32.1%) | 57 (70.4%) |
| 45 to 54 Years | 13 (12.8%) | 89 (87.3%) |
| 55 to 64 Years | 12 (11.9%) | 89 (88.1%) |
| 65 to 74 Years | 74 (100.0%) | 46 (62.2%) |
| 75 Years and over | 84 (100.0%) | 66 (78.6%) |
| Total | 357 (45.3%) | 526 (66.7%) |
Disability Status by Sex by Age in New Haven
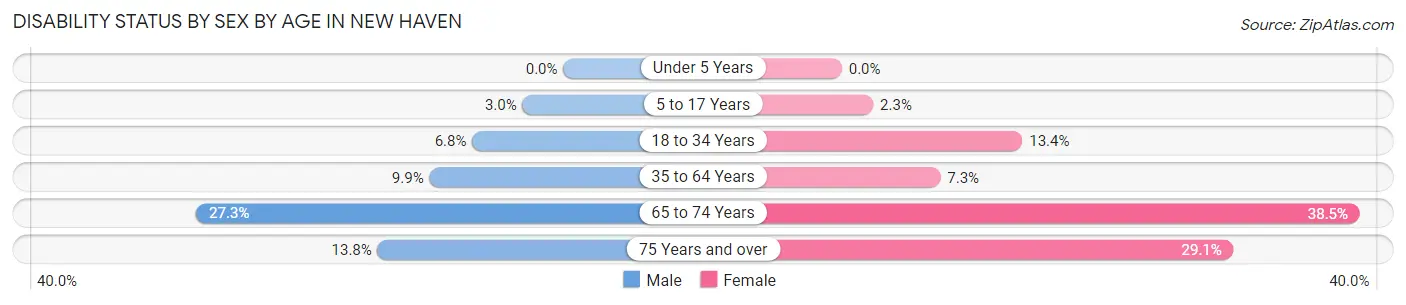
| Age Bracket | Male | Female |
| Under 5 Years | 0 (0.0%) | 0 (0.0%) |
| 5 to 17 Years | 2 (3.0%) | 2 (2.3%) |
| 18 to 34 Years | 5 (6.8%) | 13 (13.4%) |
| 35 to 64 Years | 16 (9.9%) | 9 (7.3%) |
| 65 to 74 Years | 6 (27.3%) | 20 (38.5%) |
| 75 Years and over | 4 (13.8%) | 16 (29.1%) |
Disability Class by Sex by Age in New Haven
Disability Class: Hearing Difficulty
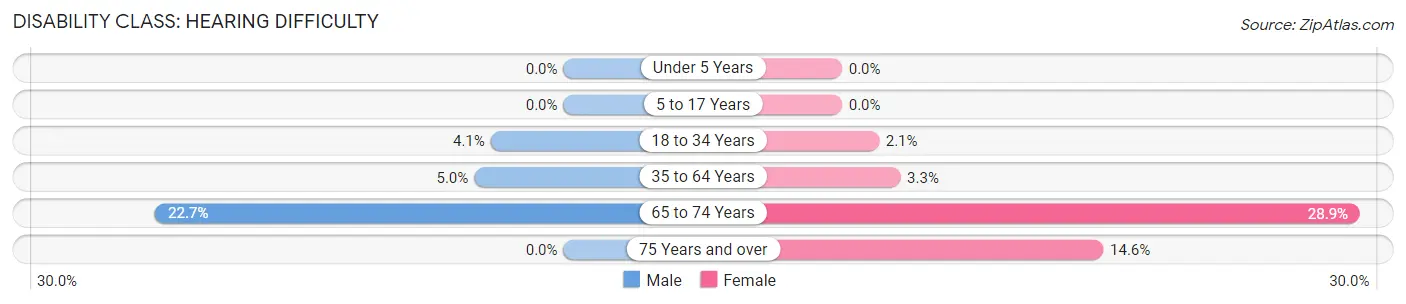
| Age Bracket | Male | Female |
| Under 5 Years | 0 (0.0%) | 0 (0.0%) |
| 5 to 17 Years | 0 (0.0%) | 0 (0.0%) |
| 18 to 34 Years | 3 (4.1%) | 2 (2.1%) |
| 35 to 64 Years | 8 (5.0%) | 4 (3.3%) |
| 65 to 74 Years | 5 (22.7%) | 15 (28.8%) |
| 75 Years and over | 0 (0.0%) | 8 (14.5%) |
Disability Class: Vision Difficulty
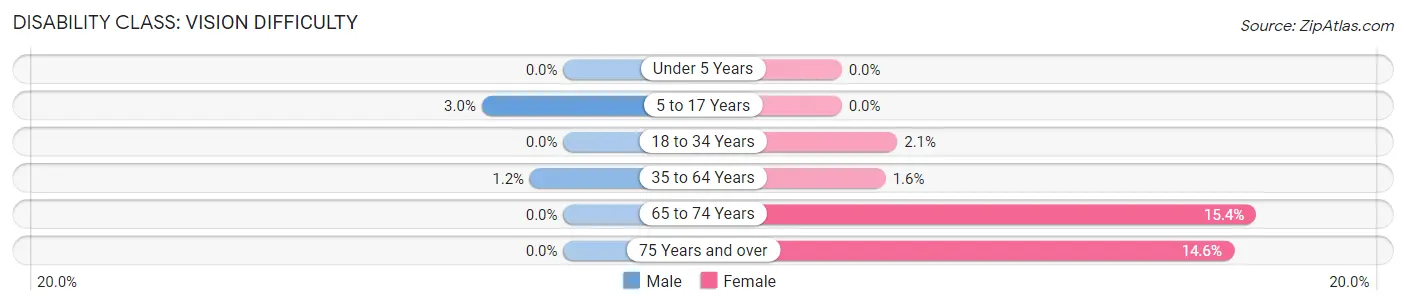
| Age Bracket | Male | Female |
| Under 5 Years | 0 (0.0%) | 0 (0.0%) |
| 5 to 17 Years | 2 (3.0%) | 0 (0.0%) |
| 18 to 34 Years | 0 (0.0%) | 2 (2.1%) |
| 35 to 64 Years | 2 (1.2%) | 2 (1.6%) |
| 65 to 74 Years | 0 (0.0%) | 8 (15.4%) |
| 75 Years and over | 0 (0.0%) | 8 (14.5%) |
Disability Class: Cognitive Difficulty
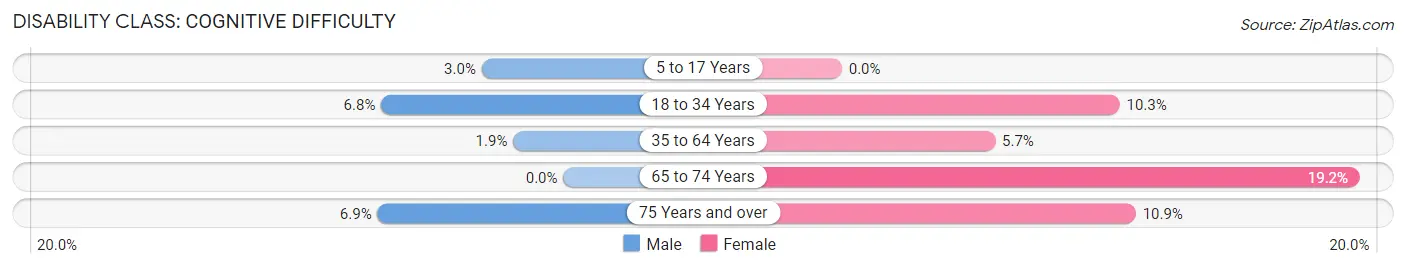
| Age Bracket | Male | Female |
| 5 to 17 Years | 2 (3.0%) | 0 (0.0%) |
| 18 to 34 Years | 5 (6.8%) | 10 (10.3%) |
| 35 to 64 Years | 3 (1.9%) | 7 (5.7%) |
| 65 to 74 Years | 0 (0.0%) | 10 (19.2%) |
| 75 Years and over | 2 (6.9%) | 6 (10.9%) |
Disability Class: Ambulatory Difficulty
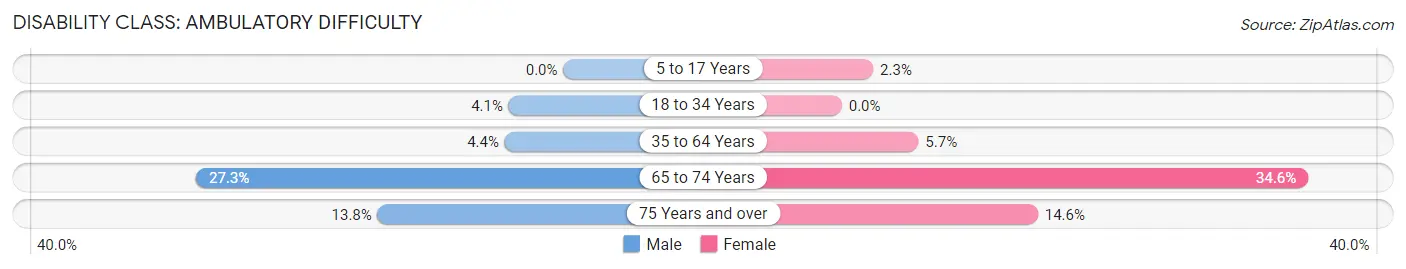
| Age Bracket | Male | Female |
| 5 to 17 Years | 0 (0.0%) | 2 (2.3%) |
| 18 to 34 Years | 3 (4.1%) | 0 (0.0%) |
| 35 to 64 Years | 7 (4.3%) | 7 (5.7%) |
| 65 to 74 Years | 6 (27.3%) | 18 (34.6%) |
| 75 Years and over | 4 (13.8%) | 8 (14.5%) |
Disability Class: Self-Care Difficulty
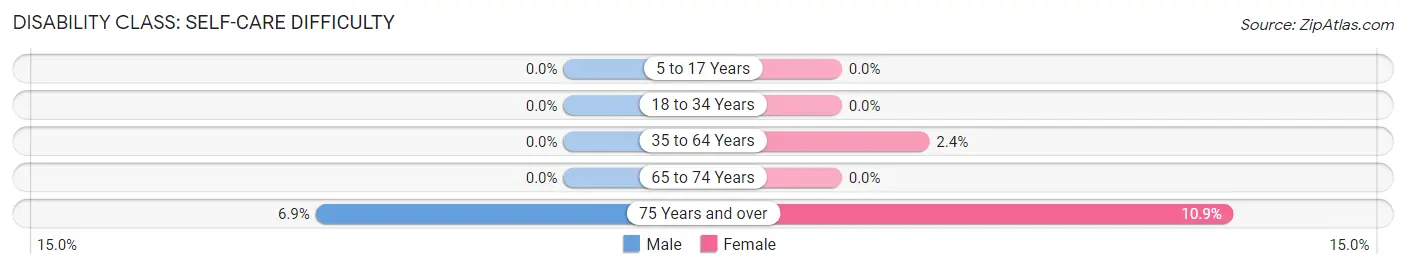
| Age Bracket | Male | Female |
| 5 to 17 Years | 0 (0.0%) | 0 (0.0%) |
| 18 to 34 Years | 0 (0.0%) | 0 (0.0%) |
| 35 to 64 Years | 0 (0.0%) | 3 (2.4%) |
| 65 to 74 Years | 0 (0.0%) | 0 (0.0%) |
| 75 Years and over | 2 (6.9%) | 6 (10.9%) |
Technology Access in New Haven
Computing Device Access in New Haven
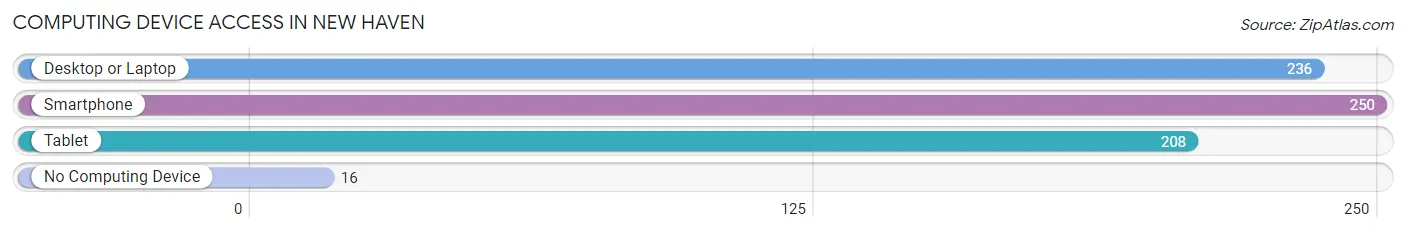
| Device Type | # Households | % Households |
| Desktop or Laptop | 236 | 73.3% |
| Smartphone | 250 | 77.6% |
| Tablet | 208 | 64.6% |
| No Computing Device | 16 | 5.0% |
| Total | 322 | 100.0% |
Internet Access in New Haven
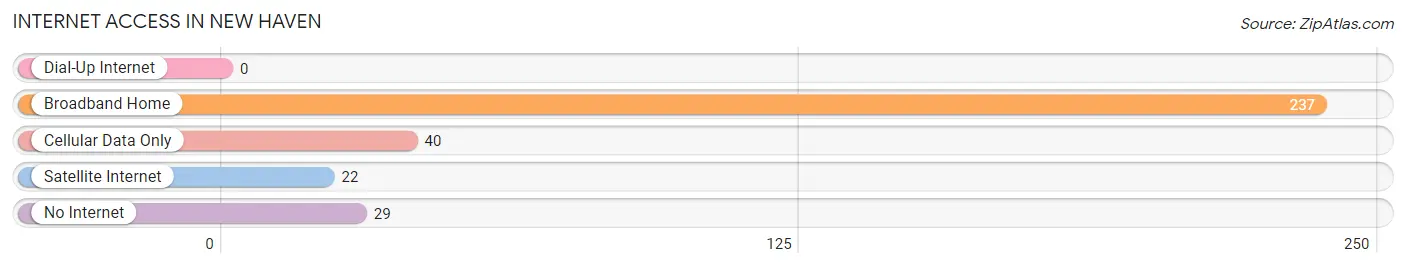
| Internet Type | # Households | % Households |
| Dial-Up Internet | 0 | 0.0% |
| Broadband Home | 237 | 73.6% |
| Cellular Data Only | 40 | 12.4% |
| Satellite Internet | 22 | 6.8% |
| No Internet | 29 | 9.0% |
| Total | 322 | 100.0% |
New Haven Summary
New Haven, Kentucky is a small city located in Nelson County, Kentucky. It is situated on the banks of the Rolling Fork River, and is part of the Louisville metropolitan area. The city has a population of approximately 1,400 people, and is known for its rural charm and small-town atmosphere.
History
New Haven was founded in 1817 by a group of settlers from Virginia. The town was originally known as “New Haven Station”, and was named after the city of New Haven, Connecticut. The town was incorporated in 1820, and was the first town in Nelson County.
The town grew slowly, but steadily, and by the mid-1800s, it had become a thriving agricultural center. The town was home to several mills, including a grist mill, a saw mill, and a woolen mill. The town also had a blacksmith shop, a general store, and a post office.
In the late 1800s, the town began to decline, as the railroad bypassed it and the mills began to close. The town was revitalized in the early 1900s, when the Louisville and Nashville Railroad built a line through the town. This allowed the town to become a shipping center for the surrounding area.
Geography
New Haven is located in the rolling hills of central Kentucky, about 25 miles southeast of Louisville. The city is situated on the banks of the Rolling Fork River, and is surrounded by farmland. The city is located in the Bluegrass region of Kentucky, and is known for its lush green pastures and rolling hills.
The climate in New Haven is humid subtropical, with hot, humid summers and mild winters. The average annual temperature is around 60 degrees Fahrenheit, and the average annual precipitation is around 45 inches.
Economy
The economy of New Haven is largely based on agriculture. The town is home to several farms, and the surrounding area is known for its production of tobacco, corn, and hay. The town is also home to several small businesses, including a grocery store, a hardware store, and a restaurant.
The town is also home to a small manufacturing plant, which produces plastic products. The town is served by the Louisville and Nashville Railroad, which provides freight service to the surrounding area.
Demographics
As of the 2010 census, the population of New Haven was 1,400 people. The racial makeup of the town was 97.4% White, 0.7% African American, 0.3% Native American, 0.3% Asian, and 1.3% from other races. The median household income was $37,500, and the median family income was $45,000.
Conclusion
New Haven, Kentucky is a small city located in Nelson County, Kentucky. It is situated on the banks of the Rolling Fork River, and is part of the Louisville metropolitan area. The city has a population of approximately 1,400 people, and is known for its rural charm and small-town atmosphere. The economy of New Haven is largely based on agriculture, and the town is home to several small businesses. The racial makeup of the town is predominantly White, with a small percentage of African American, Native American, and Asian residents.
Common Questions
What is Per Capita Income in New Haven?
Per Capita income in New Haven is $31,051.
What is the Median Family Income in New Haven?
Median Family Income in New Haven is $76,979.
What is the Median Household income in New Haven?
Median Household Income in New Haven is $68,750.
What is Income or Wage Gap in New Haven?
Income or Wage Gap in New Haven is 50.2%.
Women in New Haven earn 49.8 cents for every dollar earned by a man.
What is Inequality or Gini Index in New Haven?
Inequality or Gini Index in New Haven is 0.36.
What is the Total Population of New Haven?
Total Population of New Haven is 789.
What is the Total Male Population of New Haven?
Total Male Population of New Haven is 360.
What is the Total Female Population of New Haven?
Total Female Population of New Haven is 429.
What is the Ratio of Males per 100 Females in New Haven?
There are 83.92 Males per 100 Females in New Haven.
What is the Ratio of Females per 100 Males in New Haven?
There are 119.17 Females per 100 Males in New Haven.
What is the Median Population Age in New Haven?
Median Population Age in New Haven is 40.5 Years.
What is the Average Family Size in New Haven
Average Family Size in New Haven is 2.9 People.
What is the Average Household Size in New Haven
Average Household Size in New Haven is 2.5 People.
How Large is the Labor Force in New Haven?
There are 395 People in the Labor Forcein in New Haven.
What is the Percentage of People in the Labor Force in New Haven?
63.8% of People are in the Labor Force in New Haven.
What is the Unemployment Rate in New Haven?
Unemployment Rate in New Haven is 12.4%.