Nortonville, KY Map & Demographics
Nortonville Map
Nortonville Overview
$23,354
PER CAPITA INCOME
$52,446
AVG FAMILY INCOME
$39,583
AVG HOUSEHOLD INCOME
45.6%
WAGE / INCOME GAP [ % ]
54.4¢/ $1
WAGE / INCOME GAP [ $ ]
0.39
INEQUALITY / GINI INDEX
882
TOTAL POPULATION
402
MALE POPULATION
480
FEMALE POPULATION
83.75
MALES / 100 FEMALES
119.40
FEMALES / 100 MALES
44.6
MEDIAN AGE
3.1
AVG FAMILY SIZE
2.3
AVG HOUSEHOLD SIZE
358
LABOR FORCE [ PEOPLE ]
46.8%
PERCENT IN LABOR FORCE
13.4%
UNEMPLOYMENT RATE
Nortonville Zip Codes
Nortonville Area Codes
Income in Nortonville
Income Overview in Nortonville
Per Capita Income in Nortonville is $23,354, while median incomes of families and households are $52,446 and $39,583 respectively.
| Characteristic | Number | Measure |
| Per Capita Income | 882 | $23,354 |
| Median Family Income | 211 | $52,446 |
| Mean Family Income | 211 | $62,750 |
| Median Household Income | 381 | $39,583 |
| Mean Household Income | 381 | $50,130 |
| Income Deficit | 211 | $0 |
| Wage / Income Gap (%) | 882 | 45.64% |
| Wage / Income Gap ($) | 882 | 54.36¢ per $1 |
| Gini / Inequality Index | 882 | 0.39 |
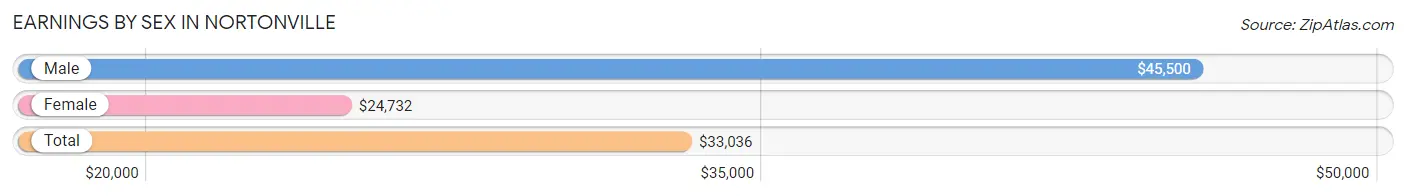
Earnings by Sex in Nortonville
Average Earnings in Nortonville are $33,036, $45,500 for men and $24,732 for women, a difference of 45.6%.
| Sex | Number | Average Earnings |
| Male | 184 (50.4%) | $45,500 |
| Female | 181 (49.6%) | $24,732 |
| Total | 365 (100.0%) | $33,036 |
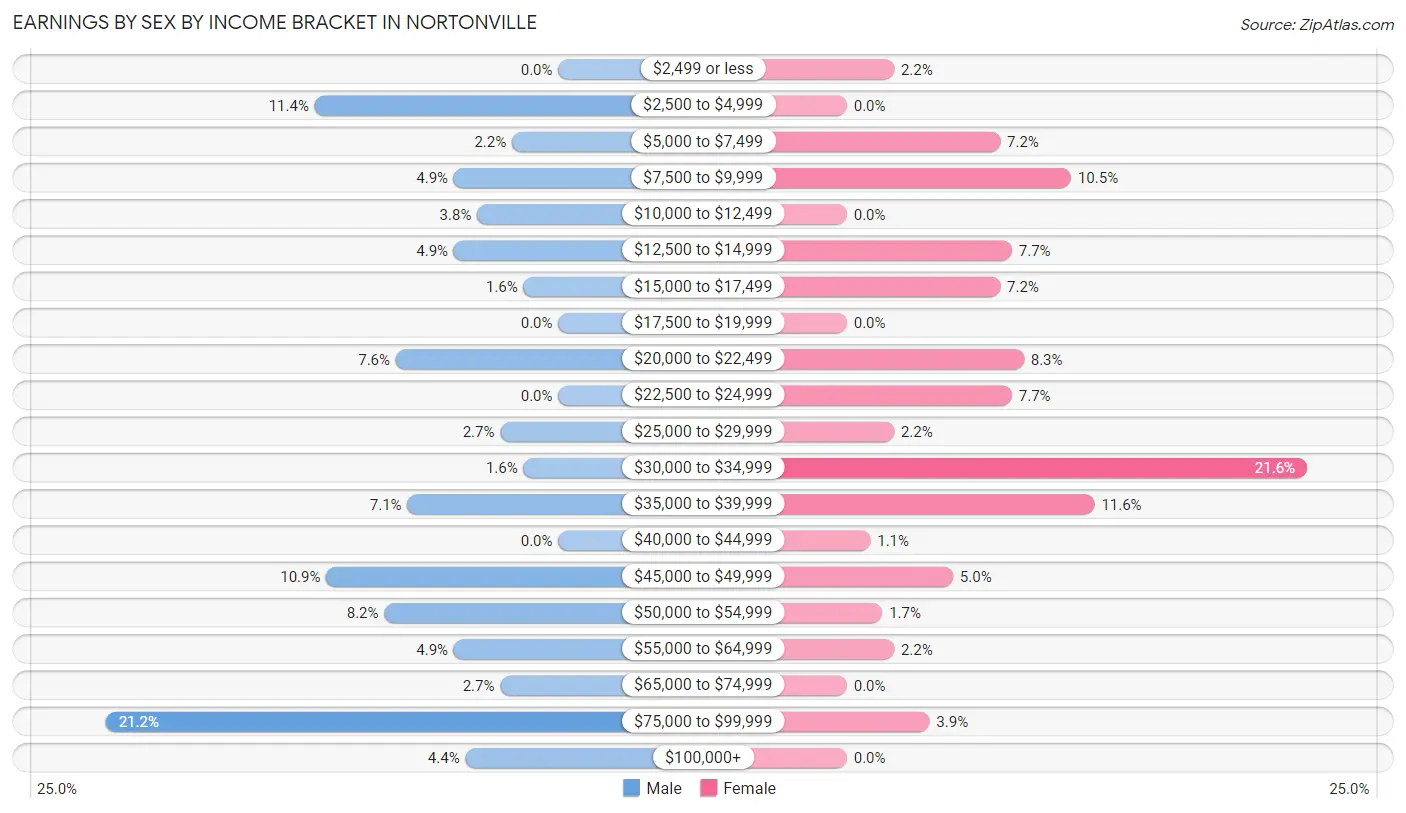
Earnings by Sex by Income Bracket in Nortonville
The most common earnings brackets in Nortonville are $75,000 to $99,999 for men (39 | 21.2%) and $30,000 to $34,999 for women (39 | 21.5%).
| Income | Male | Female |
| $2,499 or less | 0 (0.0%) | 4 (2.2%) |
| $2,500 to $4,999 | 21 (11.4%) | 0 (0.0%) |
| $5,000 to $7,499 | 4 (2.2%) | 13 (7.2%) |
| $7,500 to $9,999 | 9 (4.9%) | 19 (10.5%) |
| $10,000 to $12,499 | 7 (3.8%) | 0 (0.0%) |
| $12,500 to $14,999 | 9 (4.9%) | 14 (7.7%) |
| $15,000 to $17,499 | 3 (1.6%) | 13 (7.2%) |
| $17,500 to $19,999 | 0 (0.0%) | 0 (0.0%) |
| $20,000 to $22,499 | 14 (7.6%) | 15 (8.3%) |
| $22,500 to $24,999 | 0 (0.0%) | 14 (7.7%) |
| $25,000 to $29,999 | 5 (2.7%) | 4 (2.2%) |
| $30,000 to $34,999 | 3 (1.6%) | 39 (21.5%) |
| $35,000 to $39,999 | 13 (7.1%) | 21 (11.6%) |
| $40,000 to $44,999 | 0 (0.0%) | 2 (1.1%) |
| $45,000 to $49,999 | 20 (10.9%) | 9 (5.0%) |
| $50,000 to $54,999 | 15 (8.2%) | 3 (1.7%) |
| $55,000 to $64,999 | 9 (4.9%) | 4 (2.2%) |
| $65,000 to $74,999 | 5 (2.7%) | 0 (0.0%) |
| $75,000 to $99,999 | 39 (21.2%) | 7 (3.9%) |
| $100,000+ | 8 (4.3%) | 0 (0.0%) |
| Total | 184 (100.0%) | 181 (100.0%) |
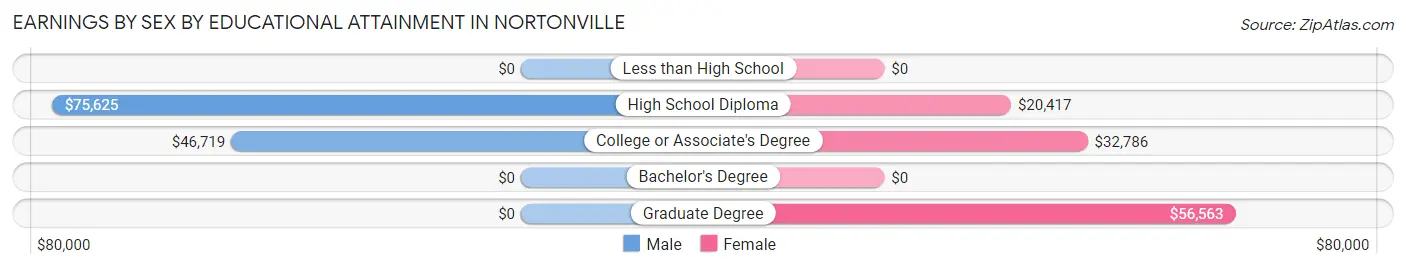
Earnings by Sex by Educational Attainment in Nortonville
Average earnings in Nortonville are $51,500 for men and $32,821 for women, a difference of 36.3%. Men with an educational attainment of high school diploma enjoy the highest average annual earnings of $75,625, while those with college or associate's degree education earn the least with $46,719. Women with an educational attainment of graduate degree earn the most with the average annual earnings of $56,563, while those with high school diploma education have the smallest earnings of $20,417.
| Educational Attainment | Male Income | Female Income |
| Less than High School | - | - |
| High School Diploma | $75,625 | $20,417 |
| College or Associate's Degree | $46,719 | $32,786 |
| Bachelor's Degree | - | - |
| Graduate Degree | - | - |
| Total | $51,500 | $32,821 |
Family Income in Nortonville
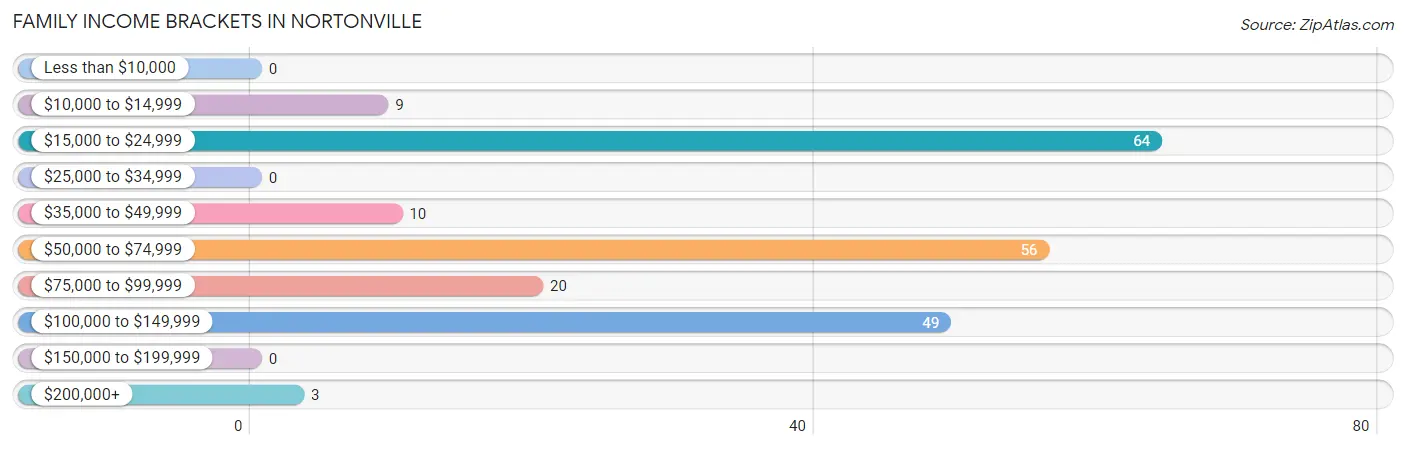
Family Income Brackets in Nortonville
According to the Nortonville family income data, there are 64 families falling into the $15,000 to $24,999 income range, which is the most common income bracket and makes up 30.3% of all families.
| Income Bracket | # Families | % Families |
| Less than $10,000 | 0 | 0.0% |
| $10,000 to $14,999 | 9 | 4.3% |
| $15,000 to $24,999 | 64 | 30.3% |
| $25,000 to $34,999 | 0 | 0.0% |
| $35,000 to $49,999 | 10 | 4.7% |
| $50,000 to $74,999 | 56 | 26.5% |
| $75,000 to $99,999 | 20 | 9.5% |
| $100,000 to $149,999 | 49 | 23.2% |
| $150,000 to $199,999 | 0 | 0.0% |
| $200,000+ | 3 | 1.4% |
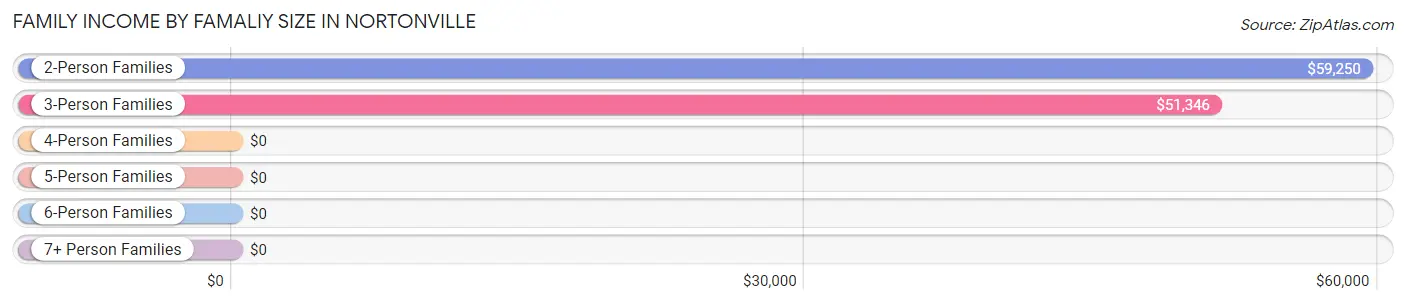
Family Income by Famaliy Size in Nortonville
2-person families (124 | 58.8%) account for the highest median family income in Nortonville with $59,250 per family, while 2-person families (124 | 58.8%) have the highest median income of $29,625 per family member.
| Income Bracket | # Families | Median Income |
| 2-Person Families | 124 (58.8%) | $59,250 |
| 3-Person Families | 34 (16.1%) | $51,346 |
| 4-Person Families | 18 (8.5%) | $0 |
| 5-Person Families | 32 (15.2%) | $0 |
| 6-Person Families | 3 (1.4%) | $0 |
| 7+ Person Families | 0 (0.0%) | $0 |
| Total | 211 (100.0%) | $52,446 |
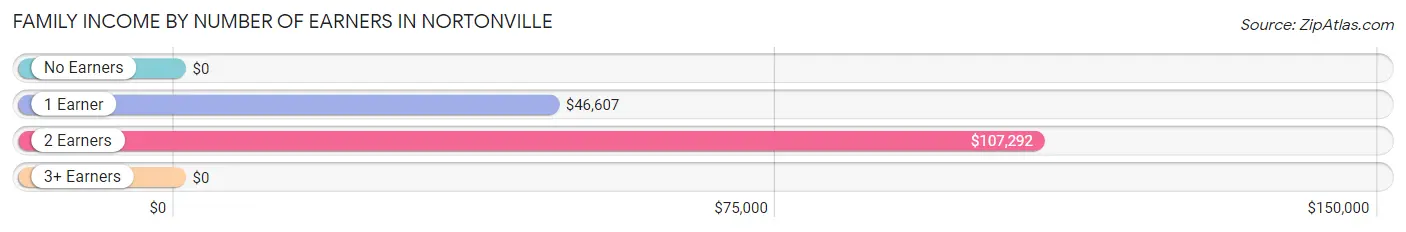
Family Income by Number of Earners in Nortonville
| Number of Earners | # Families | Median Income |
| No Earners | 63 (29.9%) | $0 |
| 1 Earner | 75 (35.5%) | $46,607 |
| 2 Earners | 69 (32.7%) | $107,292 |
| 3+ Earners | 4 (1.9%) | $0 |
| Total | 211 (100.0%) | $52,446 |
Household Income in Nortonville
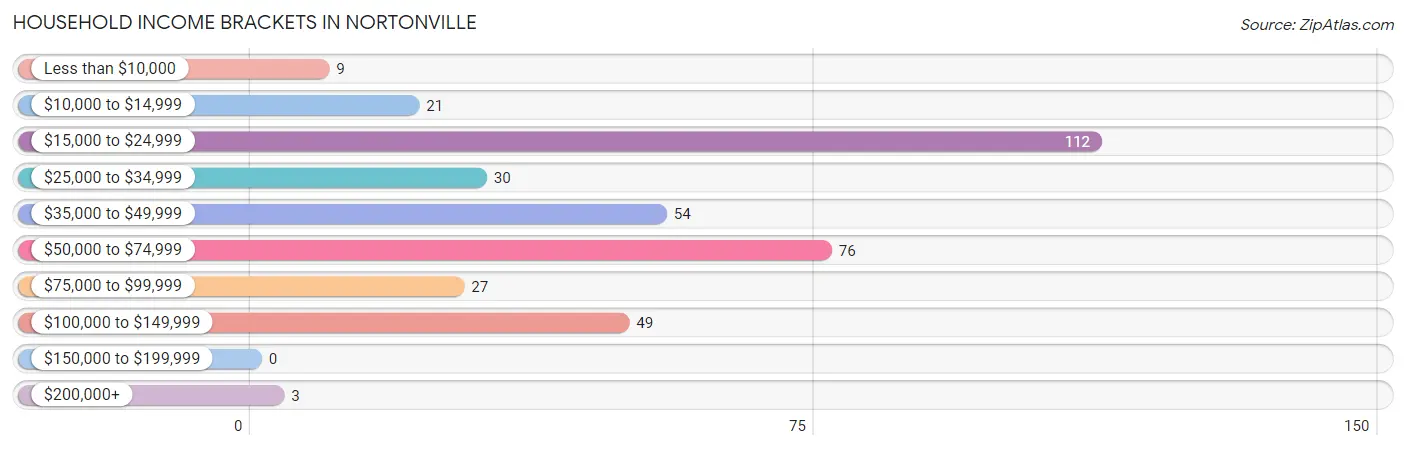
Household Income Brackets in Nortonville
With 112 households falling in the category, the $15,000 to $24,999 income range is the most frequent in Nortonville, accounting for 29.4% of all households.
| Income Bracket | # Households | % Households |
| Less than $10,000 | 9 | 2.4% |
| $10,000 to $14,999 | 21 | 5.5% |
| $15,000 to $24,999 | 112 | 29.4% |
| $25,000 to $34,999 | 30 | 7.9% |
| $35,000 to $49,999 | 54 | 14.2% |
| $50,000 to $74,999 | 76 | 19.9% |
| $75,000 to $99,999 | 27 | 7.1% |
| $100,000 to $149,999 | 49 | 12.9% |
| $150,000 to $199,999 | 0 | 0.0% |
| $200,000+ | 3 | 0.8% |
Household Income by Householder Age in Nortonville
The median household income in Nortonville is $39,583, with the highest median household income of $52,250 found in the 25 to 44 years age bracket for the primary householder. A total of 54 households (14.2%) fall into this category. Meanwhile, the 65+ years age bracket for the primary householder has the lowest median household income of $27,361, with 119 households (31.2%) in this group.
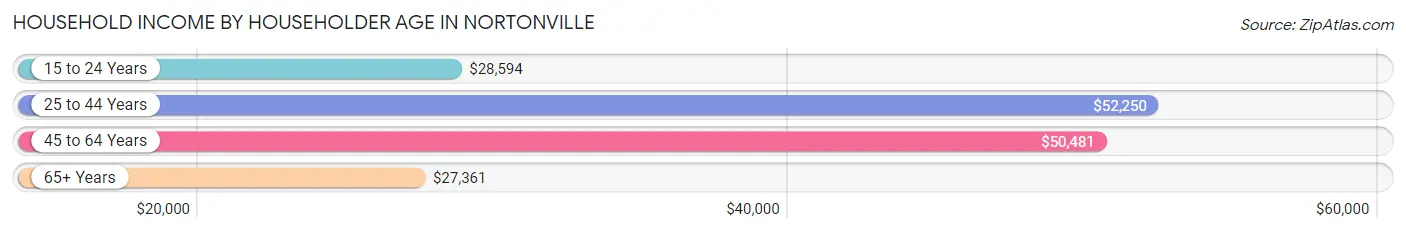
| Income Bracket | # Households | Median Income |
| 15 to 24 Years | 39 (10.2%) | $28,594 |
| 25 to 44 Years | 54 (14.2%) | $52,250 |
| 45 to 64 Years | 169 (44.4%) | $50,481 |
| 65+ Years | 119 (31.2%) | $27,361 |
| Total | 381 (100.0%) | $39,583 |
Poverty in Nortonville
Income Below Poverty by Sex and Age in Nortonville
With 30.6% poverty level for males and 20.6% for females among the residents of Nortonville, 6 to 11 year old males and 15 year old females are the most vulnerable to poverty, with 30 males (76.9%) and 10 females (71.4%) in their respective age groups living below the poverty level.
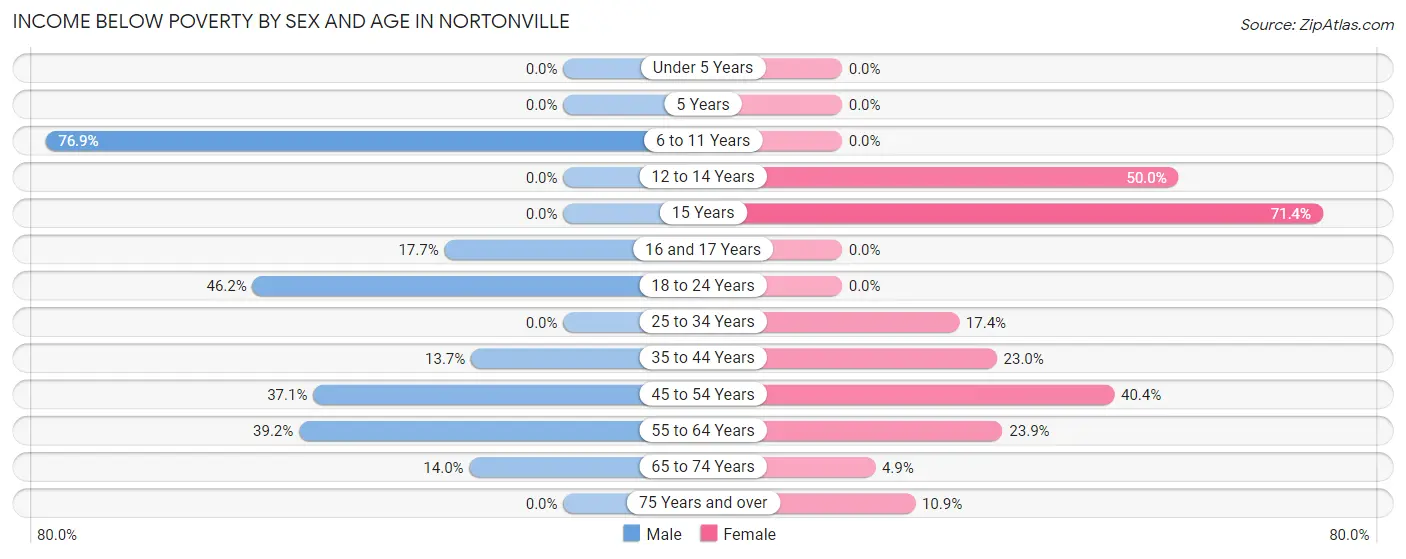
| Age Bracket | Male | Female |
| Under 5 Years | 0 (0.0%) | 0 (0.0%) |
| 5 Years | 0 (0.0%) | 0 (0.0%) |
| 6 to 11 Years | 30 (76.9%) | 0 (0.0%) |
| 12 to 14 Years | 0 (0.0%) | 12 (50.0%) |
| 15 Years | 0 (0.0%) | 10 (71.4%) |
| 16 and 17 Years | 3 (17.6%) | 0 (0.0%) |
| 18 to 24 Years | 30 (46.2%) | 0 (0.0%) |
| 25 to 34 Years | 0 (0.0%) | 4 (17.4%) |
| 35 to 44 Years | 10 (13.7%) | 20 (23.0%) |
| 45 to 54 Years | 13 (37.1%) | 19 (40.4%) |
| 55 to 64 Years | 31 (39.2%) | 26 (23.8%) |
| 65 to 74 Years | 6 (14.0%) | 3 (4.9%) |
| 75 Years and over | 0 (0.0%) | 5 (10.9%) |
| Total | 123 (30.6%) | 99 (20.6%) |
Income Above Poverty by Sex and Age in Nortonville
According to the poverty statistics in Nortonville, males aged under 5 years and females aged under 5 years are the age groups that are most secure financially, with 100.0% of males and 100.0% of females in these age groups living above the poverty line.
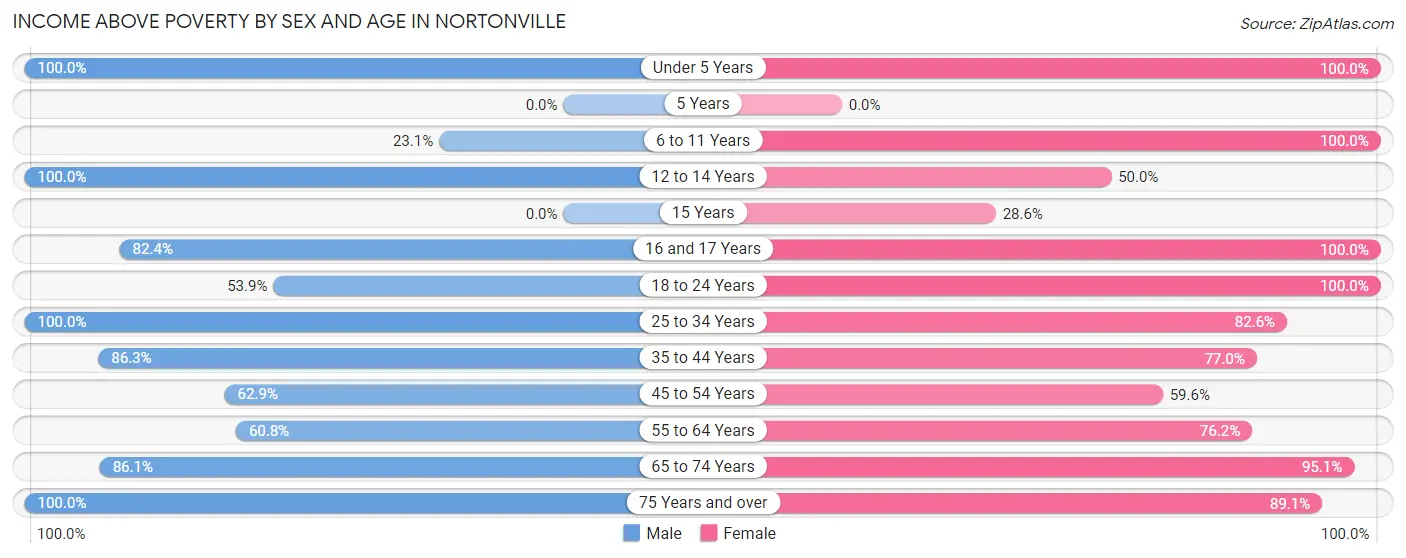
| Age Bracket | Male | Female |
| Under 5 Years | 7 (100.0%) | 2 (100.0%) |
| 5 Years | 0 (0.0%) | 0 (0.0%) |
| 6 to 11 Years | 9 (23.1%) | 21 (100.0%) |
| 12 to 14 Years | 10 (100.0%) | 12 (50.0%) |
| 15 Years | 0 (0.0%) | 4 (28.6%) |
| 16 and 17 Years | 14 (82.4%) | 22 (100.0%) |
| 18 to 24 Years | 35 (53.8%) | 24 (100.0%) |
| 25 to 34 Years | 19 (100.0%) | 19 (82.6%) |
| 35 to 44 Years | 63 (86.3%) | 67 (77.0%) |
| 45 to 54 Years | 22 (62.9%) | 28 (59.6%) |
| 55 to 64 Years | 48 (60.8%) | 83 (76.1%) |
| 65 to 74 Years | 37 (86.1%) | 58 (95.1%) |
| 75 Years and over | 15 (100.0%) | 41 (89.1%) |
| Total | 279 (69.4%) | 381 (79.4%) |
Income Below Poverty Among Married-Couple Families in Nortonville
The poverty statistics for married-couple families in Nortonville show that 26.9% or 40 of the total 149 families live below the poverty line. Families with 3 or 4 children have the highest poverty rate of 50.0%, comprising of 10 families. On the other hand, families with 1 or 2 children have the lowest poverty rate of 21.2%, which includes 7 families.
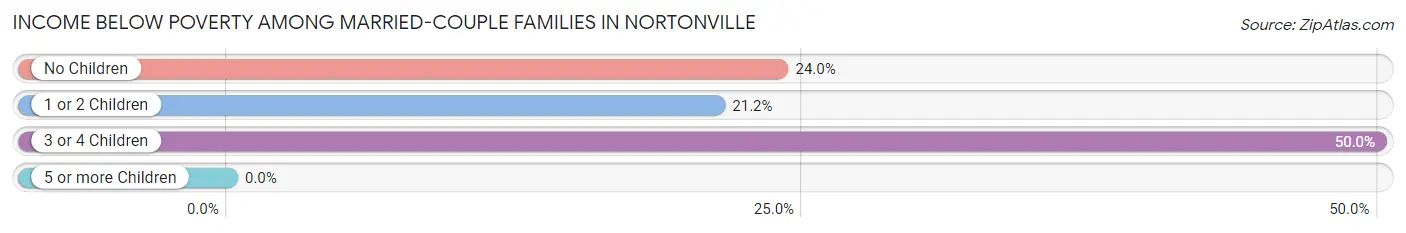
| Children | Above Poverty | Below Poverty |
| No Children | 73 (76.0%) | 23 (24.0%) |
| 1 or 2 Children | 26 (78.8%) | 7 (21.2%) |
| 3 or 4 Children | 10 (50.0%) | 10 (50.0%) |
| 5 or more Children | 0 (0.0%) | 0 (0.0%) |
| Total | 109 (73.2%) | 40 (26.9%) |
Income Below Poverty Among Single-Parent Households in Nortonville
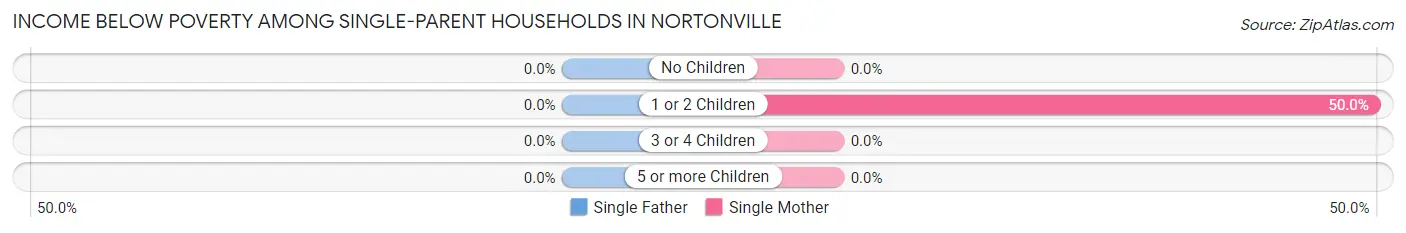
| Children | Single Father | Single Mother |
| No Children | 0 (0.0%) | 0 (0.0%) |
| 1 or 2 Children | 0 (0.0%) | 8 (50.0%) |
| 3 or 4 Children | 0 (0.0%) | 0 (0.0%) |
| 5 or more Children | 0 (0.0%) | 0 (0.0%) |
| Total | 0 (0.0%) | 8 (19.5%) |
Income Below Poverty Among Married-Couple vs Single-Parent Households in Nortonville
The poverty data for Nortonville shows that 40 of the married-couple family households (26.9%) and 8 of the single-parent households (12.9%) are living below the poverty level. Within the married-couple family households, those with 3 or 4 children have the highest poverty rate, with 10 households (50.0%) falling below the poverty line. Among the single-parent households, those with 1 or 2 children have the highest poverty rate, with 8 household (29.6%) living below poverty.
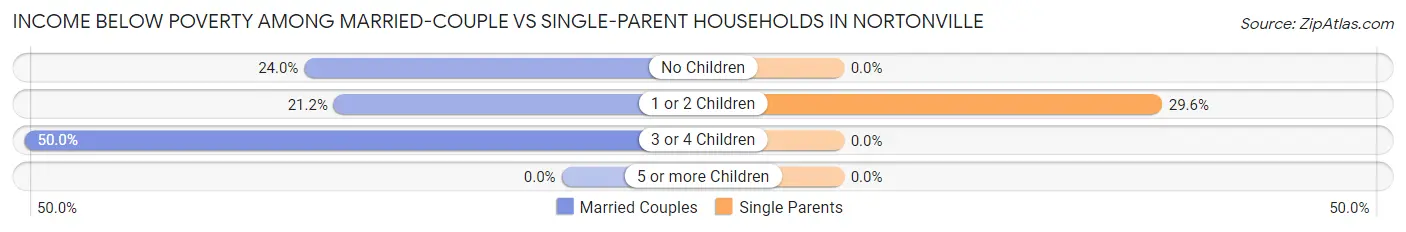
| Children | Married-Couple Families | Single-Parent Households |
| No Children | 23 (24.0%) | 0 (0.0%) |
| 1 or 2 Children | 7 (21.2%) | 8 (29.6%) |
| 3 or 4 Children | 10 (50.0%) | 0 (0.0%) |
| 5 or more Children | 0 (0.0%) | 0 (0.0%) |
| Total | 40 (26.9%) | 8 (12.9%) |
Race in Nortonville
The most populous races in Nortonville are White / Caucasian (797 | 90.4%), Black / African American (66 | 7.5%), and Two or more Races (18 | 2.0%).
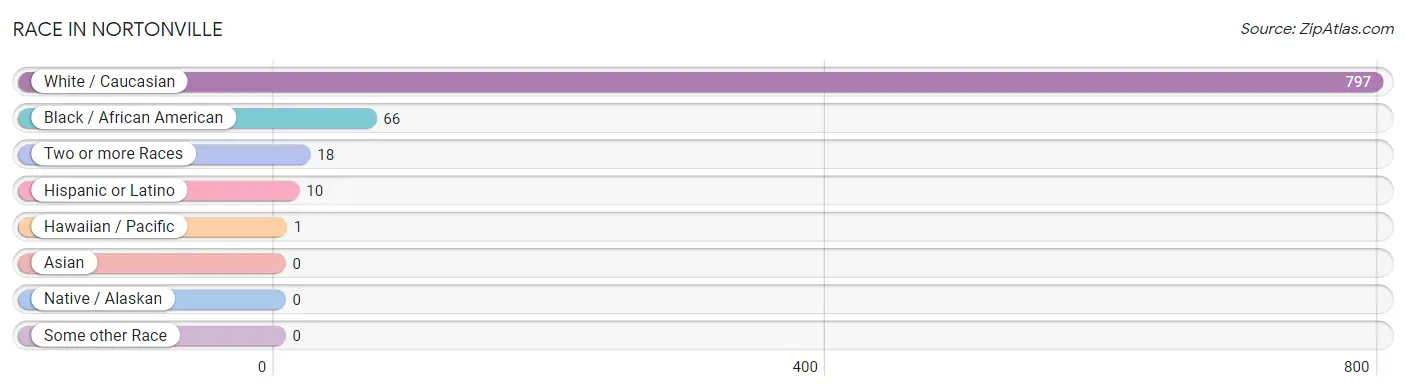
| Race | # Population | % Population |
| Asian | 0 | 0.0% |
| Black / African American | 66 | 7.5% |
| Hawaiian / Pacific | 1 | 0.1% |
| Hispanic or Latino | 10 | 1.1% |
| Native / Alaskan | 0 | 0.0% |
| White / Caucasian | 797 | 90.4% |
| Two or more Races | 18 | 2.0% |
| Some other Race | 0 | 0.0% |
| Total | 882 | 100.0% |
Ancestry in Nortonville
The most populous ancestries reported in Nortonville are American (109 | 12.4%), English (105 | 11.9%), German (55 | 6.2%), Irish (49 | 5.6%), and European (19 | 2.1%), together accounting for 38.2% of all Nortonville residents.
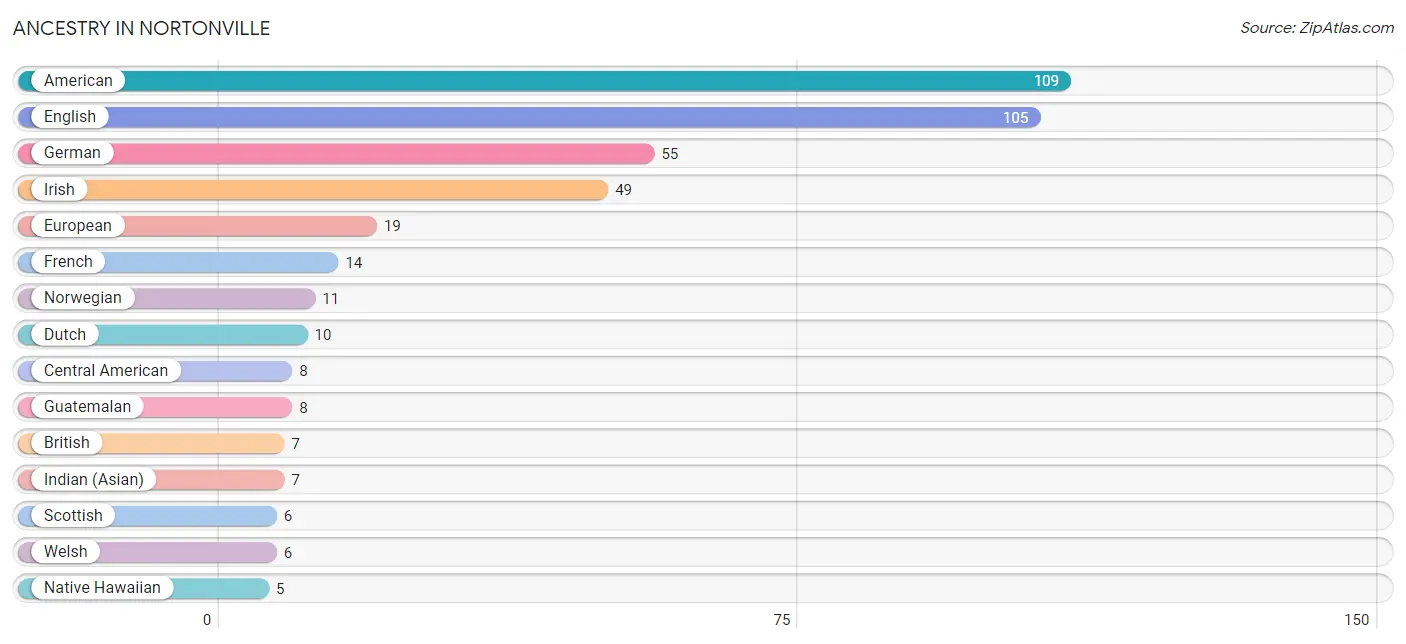
| Ancestry | # Population | % Population |
| American | 109 | 12.4% |
| British | 7 | 0.8% |
| Cajun | 4 | 0.4% |
| Central American | 8 | 0.9% |
| Dutch | 10 | 1.1% |
| English | 105 | 11.9% |
| European | 19 | 2.1% |
| French | 14 | 1.6% |
| German | 55 | 6.2% |
| Guatemalan | 8 | 0.9% |
| Indian (Asian) | 7 | 0.8% |
| Irish | 49 | 5.6% |
| Mexican | 2 | 0.2% |
| Native Hawaiian | 5 | 0.6% |
| Norwegian | 11 | 1.3% |
| Scandinavian | 4 | 0.4% |
| Scotch-Irish | 4 | 0.4% |
| Scottish | 6 | 0.7% |
| Welsh | 6 | 0.7% | View All 19 Rows |
Immigrants in Nortonville

| Immigration Origin | # Population | % Population | View All 0 Rows |
Sex and Age in Nortonville
Sex and Age in Nortonville
The most populous age groups in Nortonville are 40 to 44 Years (60 | 14.9%) for men and 40 to 44 Years (66 | 13.8%) for women.
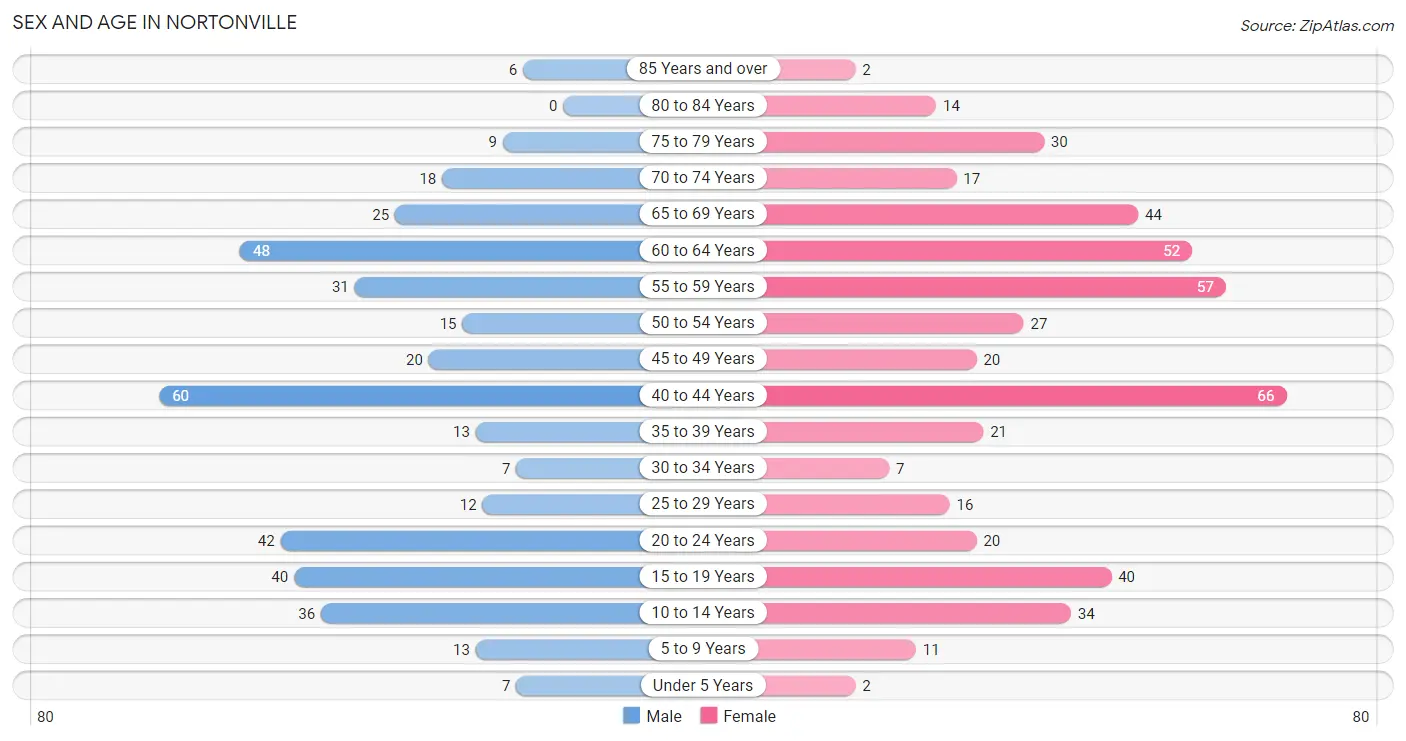
| Age Bracket | Male | Female |
| Under 5 Years | 7 (1.7%) | 2 (0.4%) |
| 5 to 9 Years | 13 (3.2%) | 11 (2.3%) |
| 10 to 14 Years | 36 (9.0%) | 34 (7.1%) |
| 15 to 19 Years | 40 (10.0%) | 40 (8.3%) |
| 20 to 24 Years | 42 (10.4%) | 20 (4.2%) |
| 25 to 29 Years | 12 (3.0%) | 16 (3.3%) |
| 30 to 34 Years | 7 (1.7%) | 7 (1.5%) |
| 35 to 39 Years | 13 (3.2%) | 21 (4.4%) |
| 40 to 44 Years | 60 (14.9%) | 66 (13.8%) |
| 45 to 49 Years | 20 (5.0%) | 20 (4.2%) |
| 50 to 54 Years | 15 (3.7%) | 27 (5.6%) |
| 55 to 59 Years | 31 (7.7%) | 57 (11.9%) |
| 60 to 64 Years | 48 (11.9%) | 52 (10.8%) |
| 65 to 69 Years | 25 (6.2%) | 44 (9.2%) |
| 70 to 74 Years | 18 (4.5%) | 17 (3.5%) |
| 75 to 79 Years | 9 (2.2%) | 30 (6.2%) |
| 80 to 84 Years | 0 (0.0%) | 14 (2.9%) |
| 85 Years and over | 6 (1.5%) | 2 (0.4%) |
| Total | 402 (100.0%) | 480 (100.0%) |
Families and Households in Nortonville
Median Family Size in Nortonville
The median family size in Nortonville is 3.07 persons per family, with single female/mother families (41 | 19.4%) accounting for the largest median family size of 3.46 persons per family. On the other hand, married-couple families (149 | 70.6%) represent the smallest median family size with 2.97 persons per family.
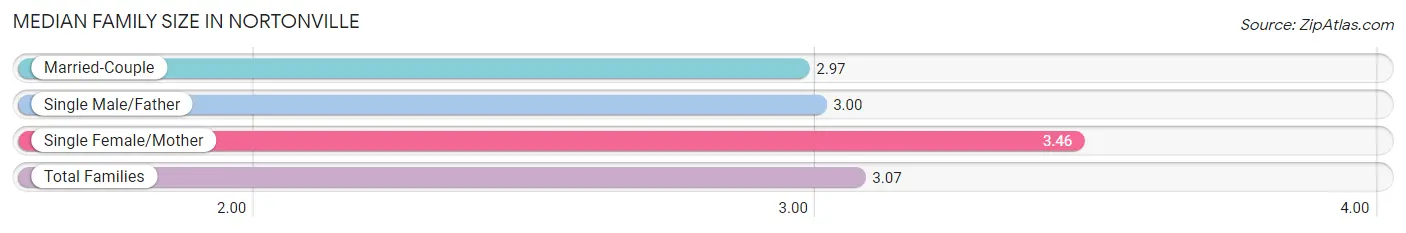
| Family Type | # Families | Family Size |
| Married-Couple | 149 (70.6%) | 2.97 |
| Single Male/Father | 21 (10.0%) | 3.00 |
| Single Female/Mother | 41 (19.4%) | 3.46 |
| Total Families | 211 (100.0%) | 3.07 |
Median Household Size in Nortonville
The median household size in Nortonville is 2.31 persons per household, with single female/mother households (41 | 10.8%) accounting for the largest median household size of 3.71 persons per household. non-family households (170 | 44.6%) represent the smallest median household size with 1.25 persons per household.
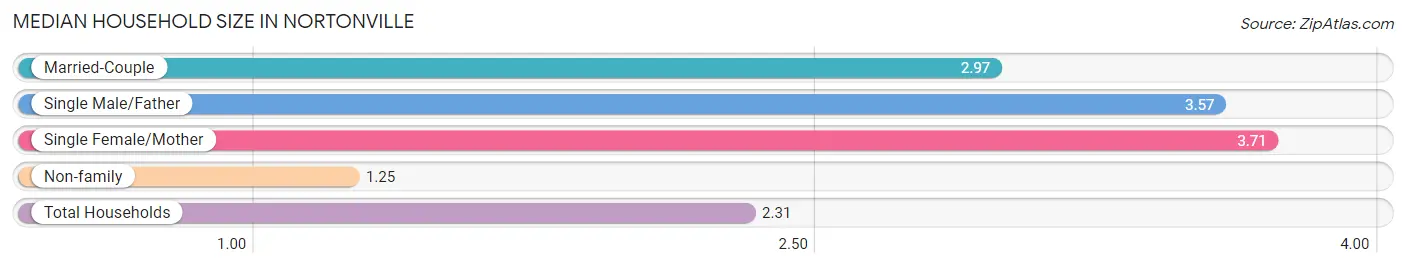
| Household Type | # Households | Household Size |
| Married-Couple | 149 (39.1%) | 2.97 |
| Single Male/Father | 21 (5.5%) | 3.57 |
| Single Female/Mother | 41 (10.8%) | 3.71 |
| Non-family | 170 (44.6%) | 1.25 |
| Total Households | 381 (100.0%) | 2.31 |
Household Size by Marriage Status in Nortonville
Out of a total of 381 households in Nortonville, 211 (55.4%) are family households, while 170 (44.6%) are nonfamily households. The most numerous type of family households are 2-person households, comprising 113, and the most common type of nonfamily households are 1-person households, comprising 137.
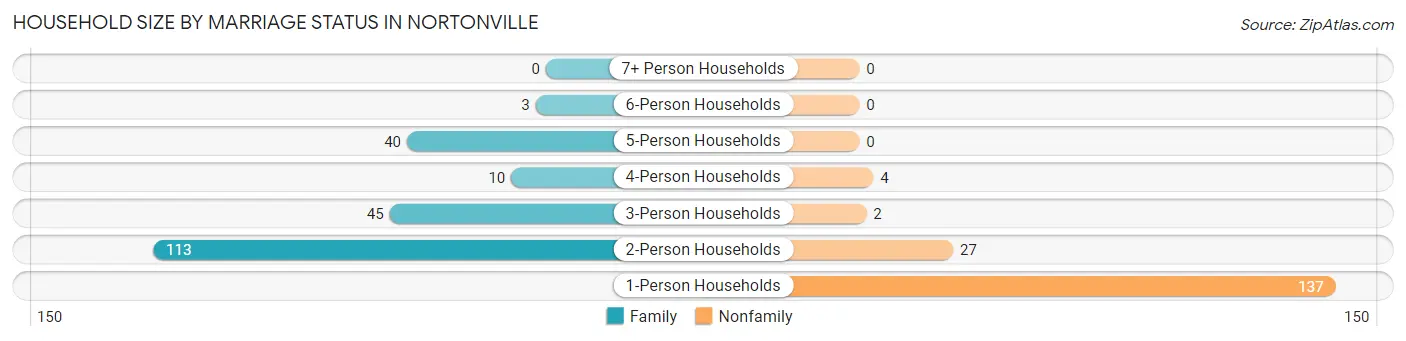
| Household Size | Family Households | Nonfamily Households |
| 1-Person Households | - | 137 (36.0%) |
| 2-Person Households | 113 (29.7%) | 27 (7.1%) |
| 3-Person Households | 45 (11.8%) | 2 (0.5%) |
| 4-Person Households | 10 (2.6%) | 4 (1.1%) |
| 5-Person Households | 40 (10.5%) | 0 (0.0%) |
| 6-Person Households | 3 (0.8%) | 0 (0.0%) |
| 7+ Person Households | 0 (0.0%) | 0 (0.0%) |
| Total | 211 (55.4%) | 170 (44.6%) |
Female Fertility in Nortonville
Fertility by Age in Nortonville
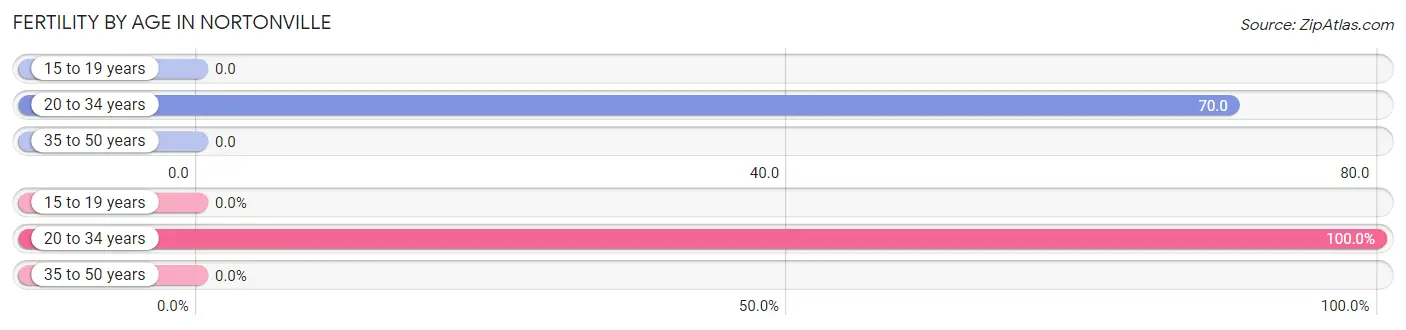
Average fertility rate in Nortonville is 16.0 births per 1,000 women. Women in the age bracket of 20 to 34 years have the highest fertility rate with 70.0 births per 1,000 women. Women in the age bracket of 20 to 34 years acount for 100.0% of all women with births.
| Age Bracket | Women with Births | Births / 1,000 Women |
| 15 to 19 years | 0 (0.0%) | 0.0 |
| 20 to 34 years | 3 (100.0%) | 70.0 |
| 35 to 50 years | 0 (0.0%) | 0.0 |
| Total | 3 (100.0%) | 16.0 |
Fertility by Age by Marriage Status in Nortonville
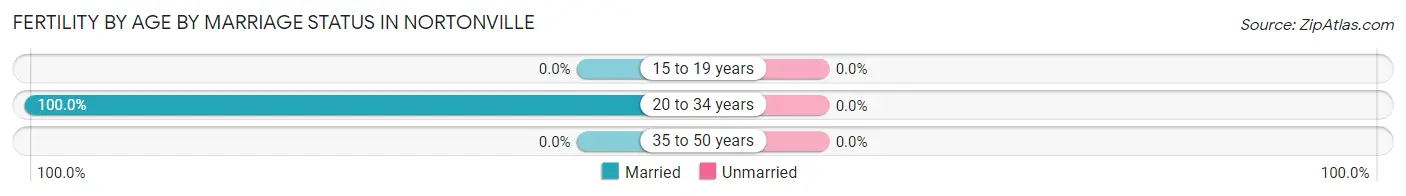
| Age Bracket | Married | Unmarried |
| 15 to 19 years | 0 (0.0%) | 0 (0.0%) |
| 20 to 34 years | 3 (100.0%) | 0 (0.0%) |
| 35 to 50 years | 0 (0.0%) | 0 (0.0%) |
| Total | 3 (100.0%) | 0 (0.0%) |
Fertility by Education in Nortonville
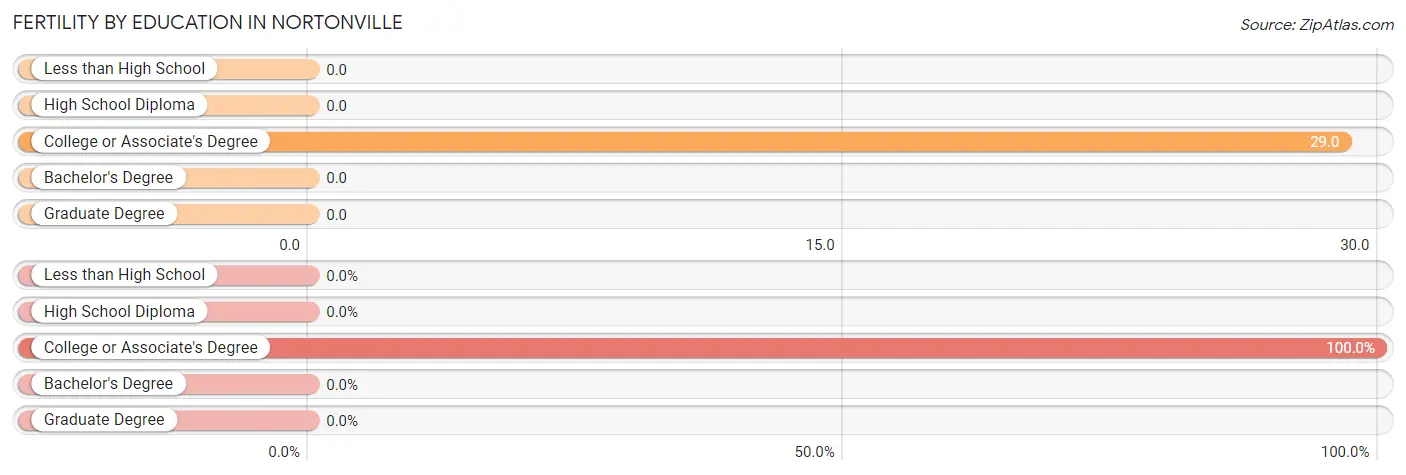
| Educational Attainment | Women with Births | Births / 1,000 Women |
| Less than High School | 0 (0.0%) | 0.0 |
| High School Diploma | 0 (0.0%) | 0.0 |
| College or Associate's Degree | 3 (100.0%) | 29.0 |
| Bachelor's Degree | 0 (0.0%) | 0.0 |
| Graduate Degree | 0 (0.0%) | 0.0 |
| Total | 3 (100.0%) | 16.0 |
Fertility by Education by Marriage Status in Nortonville
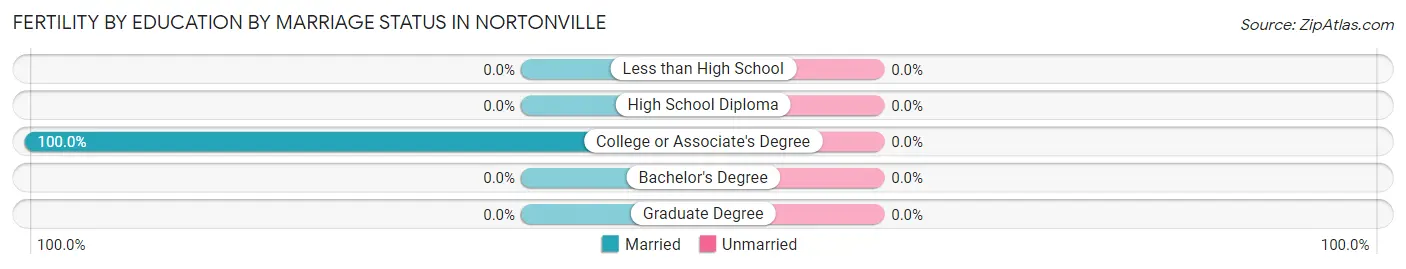
| Educational Attainment | Married | Unmarried |
| Less than High School | 0 (0.0%) | 0 (0.0%) |
| High School Diploma | 0 (0.0%) | 0 (0.0%) |
| College or Associate's Degree | 3 (100.0%) | 0 (0.0%) |
| Bachelor's Degree | 0 (0.0%) | 0 (0.0%) |
| Graduate Degree | 0 (0.0%) | 0 (0.0%) |
| Total | 3 (100.0%) | 0 (0.0%) |
Employment Characteristics in Nortonville
Employment by Class of Employer in Nortonville
Among the 298 employed individuals in Nortonville, private company employees (194 | 65.1%), not-for-profit organizations (43 | 14.4%), and local government employees (24 | 8.1%) make up the most common classes of employment.
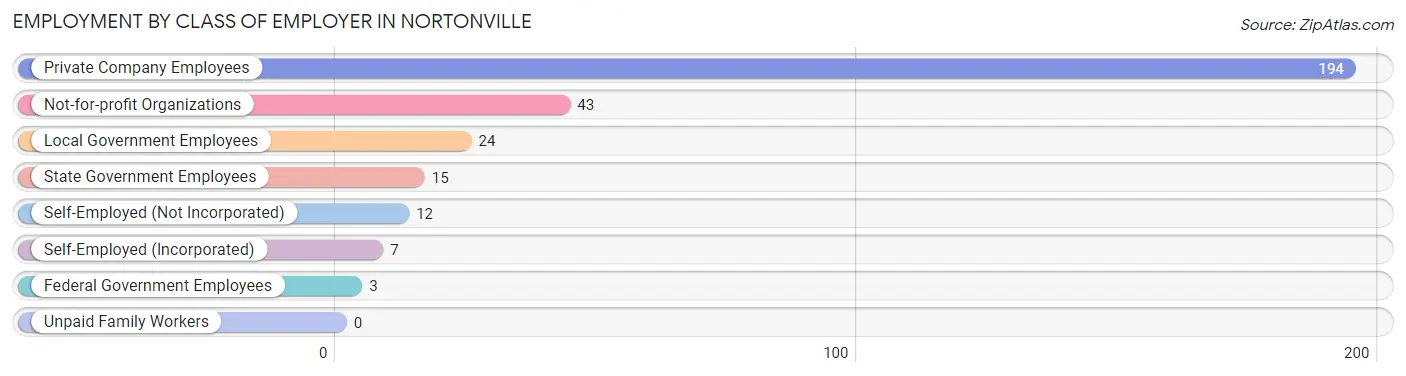
| Employer Class | # Employees | % Employees |
| Private Company Employees | 194 | 65.1% |
| Self-Employed (Incorporated) | 7 | 2.4% |
| Self-Employed (Not Incorporated) | 12 | 4.0% |
| Not-for-profit Organizations | 43 | 14.4% |
| Local Government Employees | 24 | 8.1% |
| State Government Employees | 15 | 5.0% |
| Federal Government Employees | 3 | 1.0% |
| Unpaid Family Workers | 0 | 0.0% |
| Total | 298 | 100.0% |
Employment Status by Age in Nortonville
According to the labor force statistics for Nortonville, out of the total population over 16 years of age (765), 46.8% or 358 individuals are in the labor force, with 13.4% or 48 of them unemployed. The age group with the highest labor force participation rate is 25 to 29 years, with 100.0% or 28 individuals in the labor force. Within the labor force, the 25 to 29 years age range has the highest percentage of unemployed individuals, with 42.9% or 12 of them being unemployed.
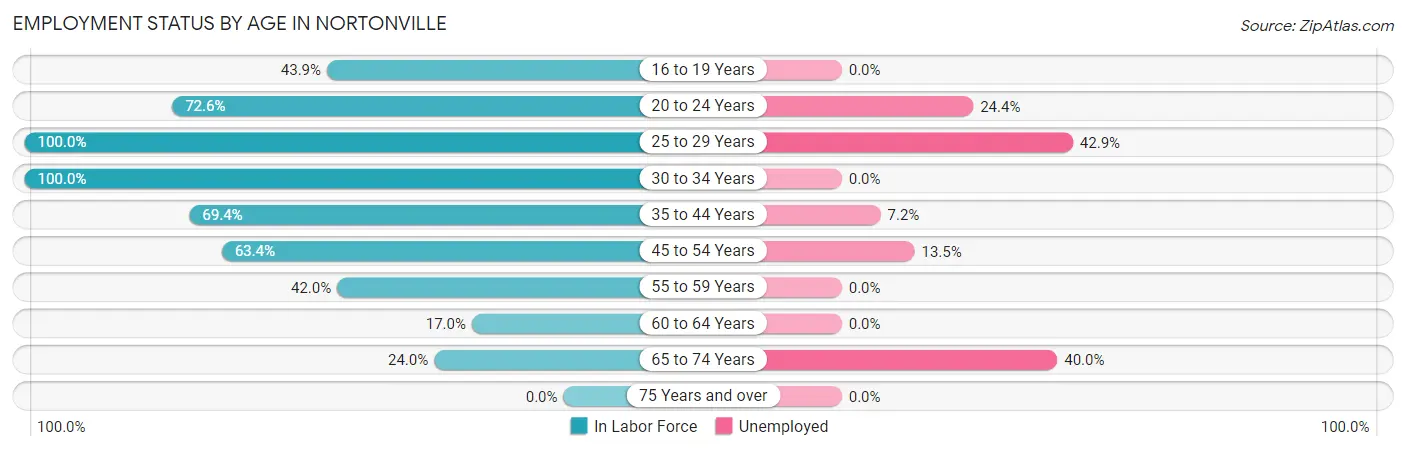
| Age Bracket | In Labor Force | Unemployed |
| 16 to 19 Years | 29 (43.9%) | 0 (0.0%) |
| 20 to 24 Years | 45 (72.6%) | 11 (24.4%) |
| 25 to 29 Years | 28 (100.0%) | 12 (42.9%) |
| 30 to 34 Years | 14 (100.0%) | 0 (0.0%) |
| 35 to 44 Years | 111 (69.4%) | 8 (7.2%) |
| 45 to 54 Years | 52 (63.4%) | 7 (13.5%) |
| 55 to 59 Years | 37 (42.0%) | 0 (0.0%) |
| 60 to 64 Years | 17 (17.0%) | 0 (0.0%) |
| 65 to 74 Years | 25 (24.0%) | 10 (40.0%) |
| 75 Years and over | 0 (0.0%) | 0 (0.0%) |
| Total | 358 (46.8%) | 48 (13.4%) |
Employment Status by Educational Attainment in Nortonville
According to labor force statistics for Nortonville, 54.9% of individuals (259) out of the total population between 25 and 64 years of age (472) are in the labor force, with 10.4% or 27 of them being unemployed. The group with the highest labor force participation rate are those with the educational attainment of bachelor's degree or higher, with 100.0% or 25 individuals in the labor force. Within the labor force, individuals with college / associate degree education have the highest percentage of unemployment, with 17.9% or 27 of them being unemployed.
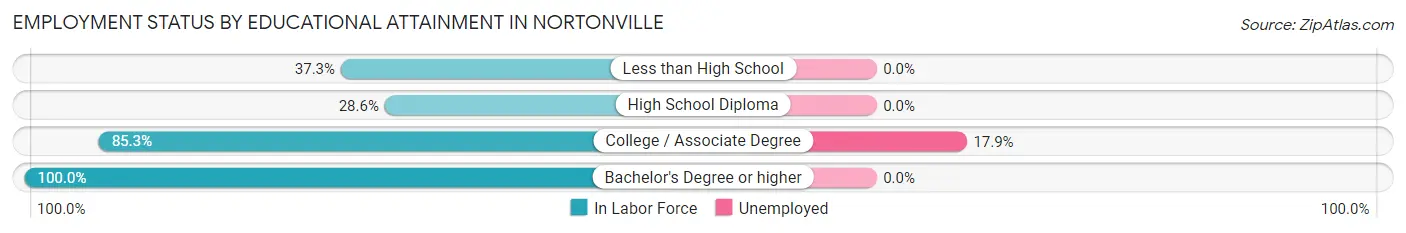
| Educational Attainment | In Labor Force | Unemployed |
| Less than High School | 25 (37.3%) | 0 (0.0%) |
| High School Diploma | 58 (28.6%) | 0 (0.0%) |
| College / Associate Degree | 151 (85.3%) | 32 (17.9%) |
| Bachelor's Degree or higher | 25 (100.0%) | 0 (0.0%) |
| Total | 259 (54.9%) | 49 (10.4%) |
Employment Occupations by Sex in Nortonville
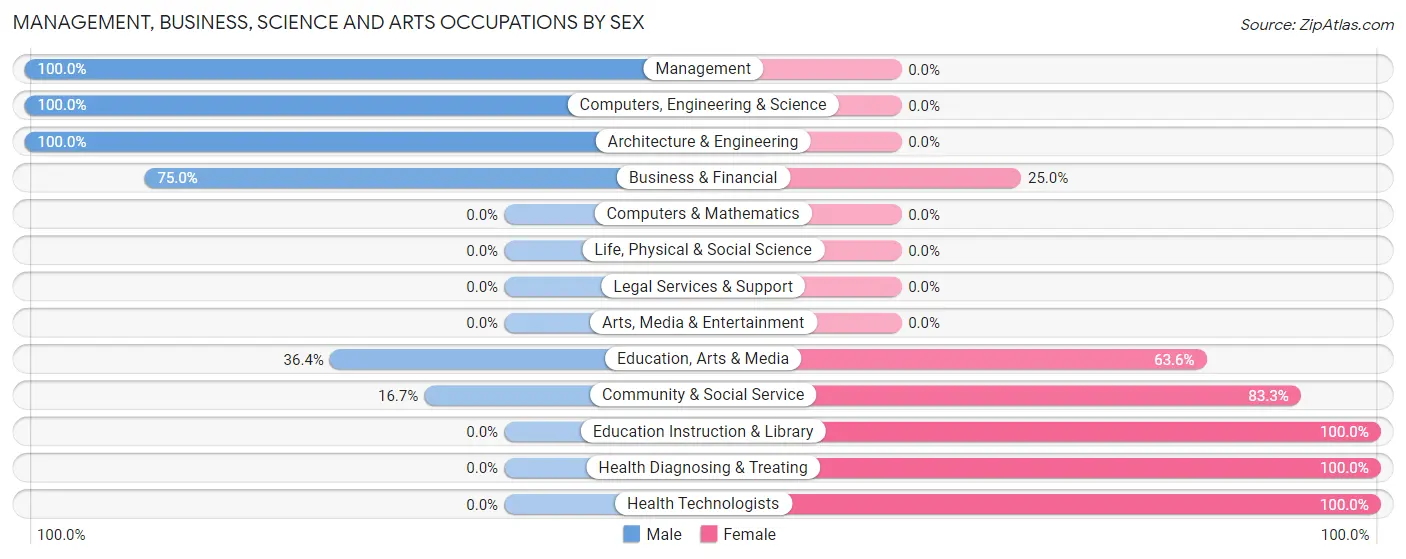
Management, Business, Science and Arts Occupations
The most common Management, Business, Science and Arts occupations in Nortonville are Community & Social Service (24 | 7.7%), Management (14 | 4.5%), Health Diagnosing & Treating (14 | 4.5%), Education Instruction & Library (13 | 4.2%), and Education, Arts & Media (11 | 3.5%).
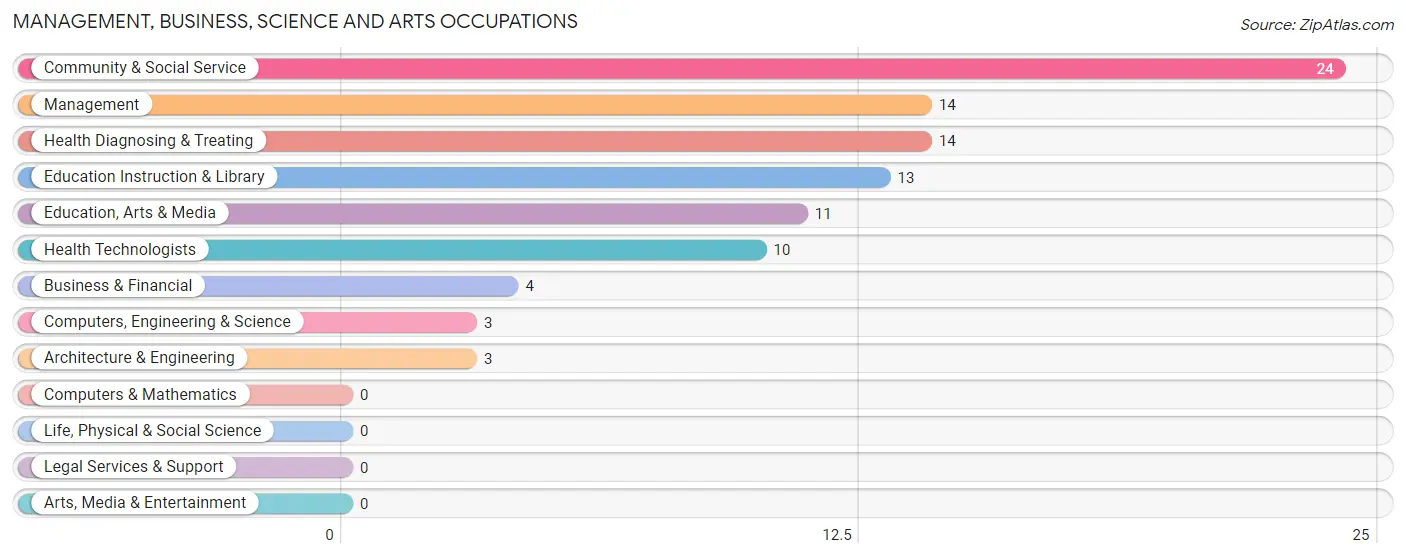
Management, Business, Science and Arts Occupations by Sex
Within the Management, Business, Science and Arts occupations in Nortonville, the most male-oriented occupations are Management (100.0%), Computers, Engineering & Science (100.0%), and Architecture & Engineering (100.0%), while the most female-oriented occupations are Education Instruction & Library (100.0%), Health Diagnosing & Treating (100.0%), and Health Technologists (100.0%).
| Occupation | Male | Female |
| Management | 14 (100.0%) | 0 (0.0%) |
| Business & Financial | 3 (75.0%) | 1 (25.0%) |
| Computers, Engineering & Science | 3 (100.0%) | 0 (0.0%) |
| Computers & Mathematics | 0 (0.0%) | 0 (0.0%) |
| Architecture & Engineering | 3 (100.0%) | 0 (0.0%) |
| Life, Physical & Social Science | 0 (0.0%) | 0 (0.0%) |
| Community & Social Service | 4 (16.7%) | 20 (83.3%) |
| Education, Arts & Media | 4 (36.4%) | 7 (63.6%) |
| Legal Services & Support | 0 (0.0%) | 0 (0.0%) |
| Education Instruction & Library | 0 (0.0%) | 13 (100.0%) |
| Arts, Media & Entertainment | 0 (0.0%) | 0 (0.0%) |
| Health Diagnosing & Treating | 0 (0.0%) | 14 (100.0%) |
| Health Technologists | 0 (0.0%) | 10 (100.0%) |
| Total (Category) | 24 (40.7%) | 35 (59.3%) |
| Total (Overall) | 157 (50.6%) | 153 (49.3%) |
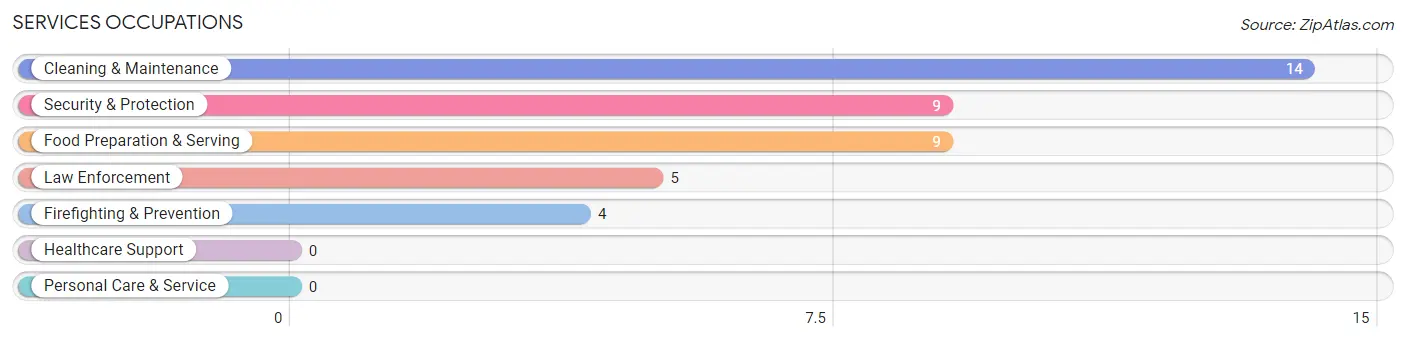
Services Occupations
The most common Services occupations in Nortonville are Cleaning & Maintenance (14 | 4.5%), Security & Protection (9 | 2.9%), Food Preparation & Serving (9 | 2.9%), Law Enforcement (5 | 1.6%), and Firefighting & Prevention (4 | 1.3%).
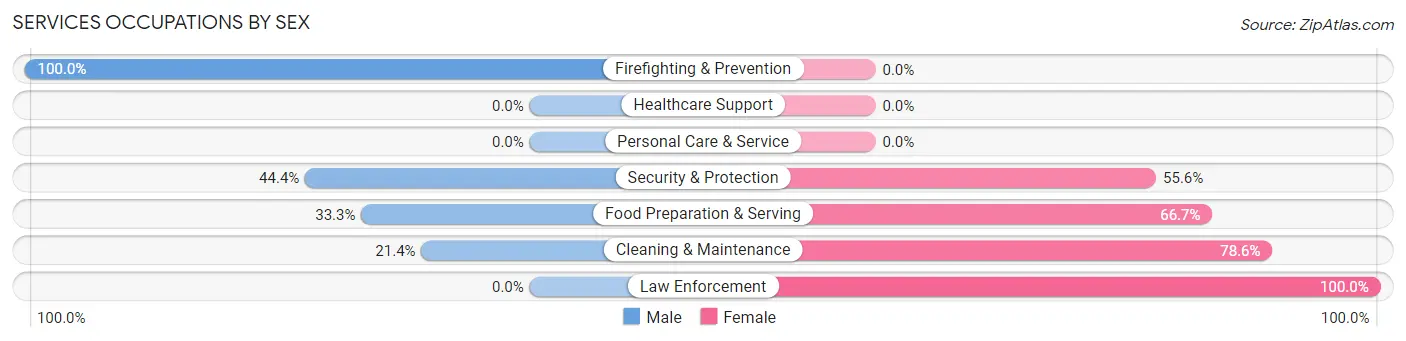
Services Occupations by Sex
Within the Services occupations in Nortonville, the most male-oriented occupations are Firefighting & Prevention (100.0%), Security & Protection (44.4%), and Food Preparation & Serving (33.3%), while the most female-oriented occupations are Law Enforcement (100.0%), Cleaning & Maintenance (78.6%), and Food Preparation & Serving (66.7%).
| Occupation | Male | Female |
| Healthcare Support | 0 (0.0%) | 0 (0.0%) |
| Security & Protection | 4 (44.4%) | 5 (55.6%) |
| Firefighting & Prevention | 4 (100.0%) | 0 (0.0%) |
| Law Enforcement | 0 (0.0%) | 5 (100.0%) |
| Food Preparation & Serving | 3 (33.3%) | 6 (66.7%) |
| Cleaning & Maintenance | 3 (21.4%) | 11 (78.6%) |
| Personal Care & Service | 0 (0.0%) | 0 (0.0%) |
| Total (Category) | 10 (31.2%) | 22 (68.8%) |
| Total (Overall) | 157 (50.6%) | 153 (49.3%) |
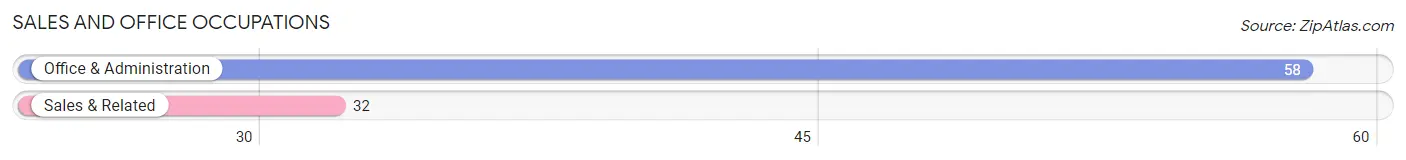
Sales and Office Occupations
The most common Sales and Office occupations in Nortonville are Office & Administration (58 | 18.7%), and Sales & Related (32 | 10.3%).
Sales and Office Occupations by Sex
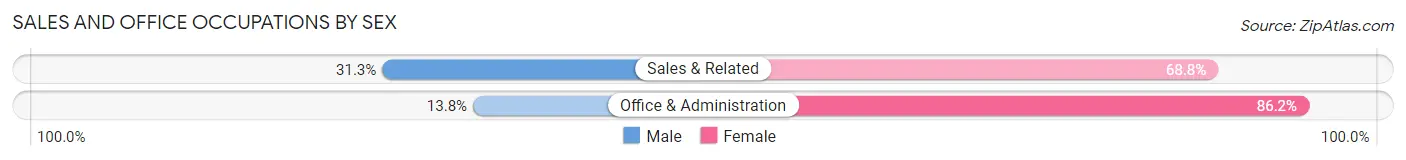
| Occupation | Male | Female |
| Sales & Related | 10 (31.2%) | 22 (68.8%) |
| Office & Administration | 8 (13.8%) | 50 (86.2%) |
| Total (Category) | 18 (20.0%) | 72 (80.0%) |
| Total (Overall) | 157 (50.6%) | 153 (49.3%) |
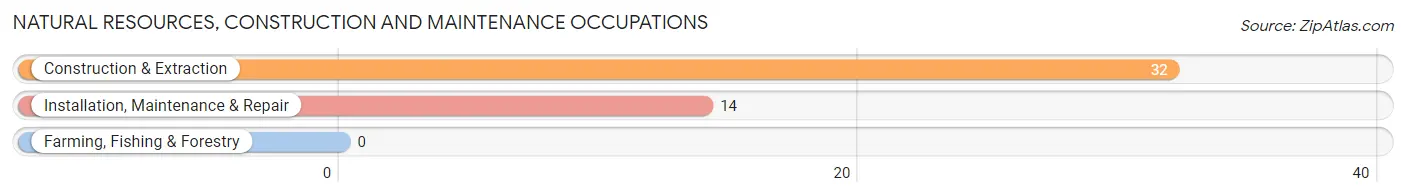
Natural Resources, Construction and Maintenance Occupations
The most common Natural Resources, Construction and Maintenance occupations in Nortonville are Construction & Extraction (32 | 10.3%), and Installation, Maintenance & Repair (14 | 4.5%).
Natural Resources, Construction and Maintenance Occupations by Sex
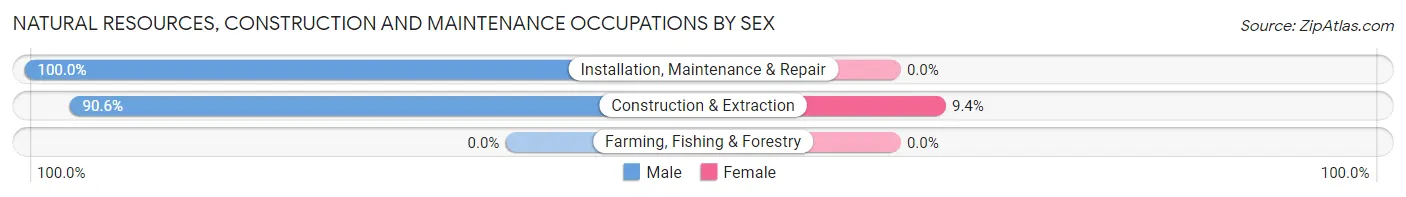
| Occupation | Male | Female |
| Farming, Fishing & Forestry | 0 (0.0%) | 0 (0.0%) |
| Construction & Extraction | 29 (90.6%) | 3 (9.4%) |
| Installation, Maintenance & Repair | 14 (100.0%) | 0 (0.0%) |
| Total (Category) | 43 (93.5%) | 3 (6.5%) |
| Total (Overall) | 157 (50.6%) | 153 (49.3%) |
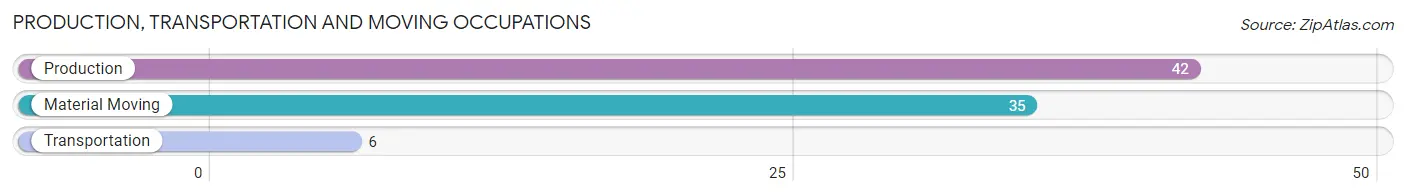
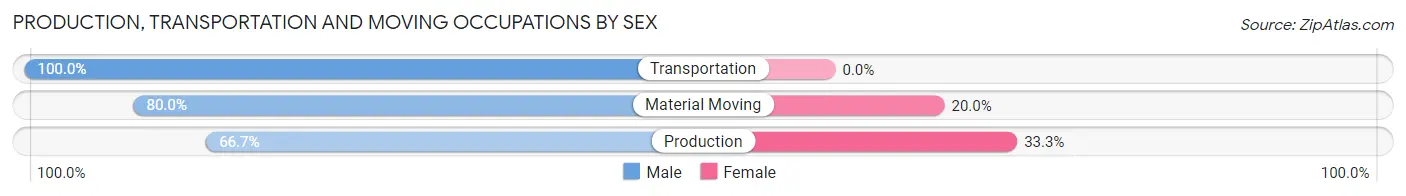
Production, Transportation and Moving Occupations
The most common Production, Transportation and Moving occupations in Nortonville are Production (42 | 13.6%), Material Moving (35 | 11.3%), and Transportation (6 | 1.9%).
Production, Transportation and Moving Occupations by Sex
| Occupation | Male | Female |
| Production | 28 (66.7%) | 14 (33.3%) |
| Transportation | 6 (100.0%) | 0 (0.0%) |
| Material Moving | 28 (80.0%) | 7 (20.0%) |
| Total (Category) | 62 (74.7%) | 21 (25.3%) |
| Total (Overall) | 157 (50.6%) | 153 (49.3%) |
Employment Industries by Sex in Nortonville
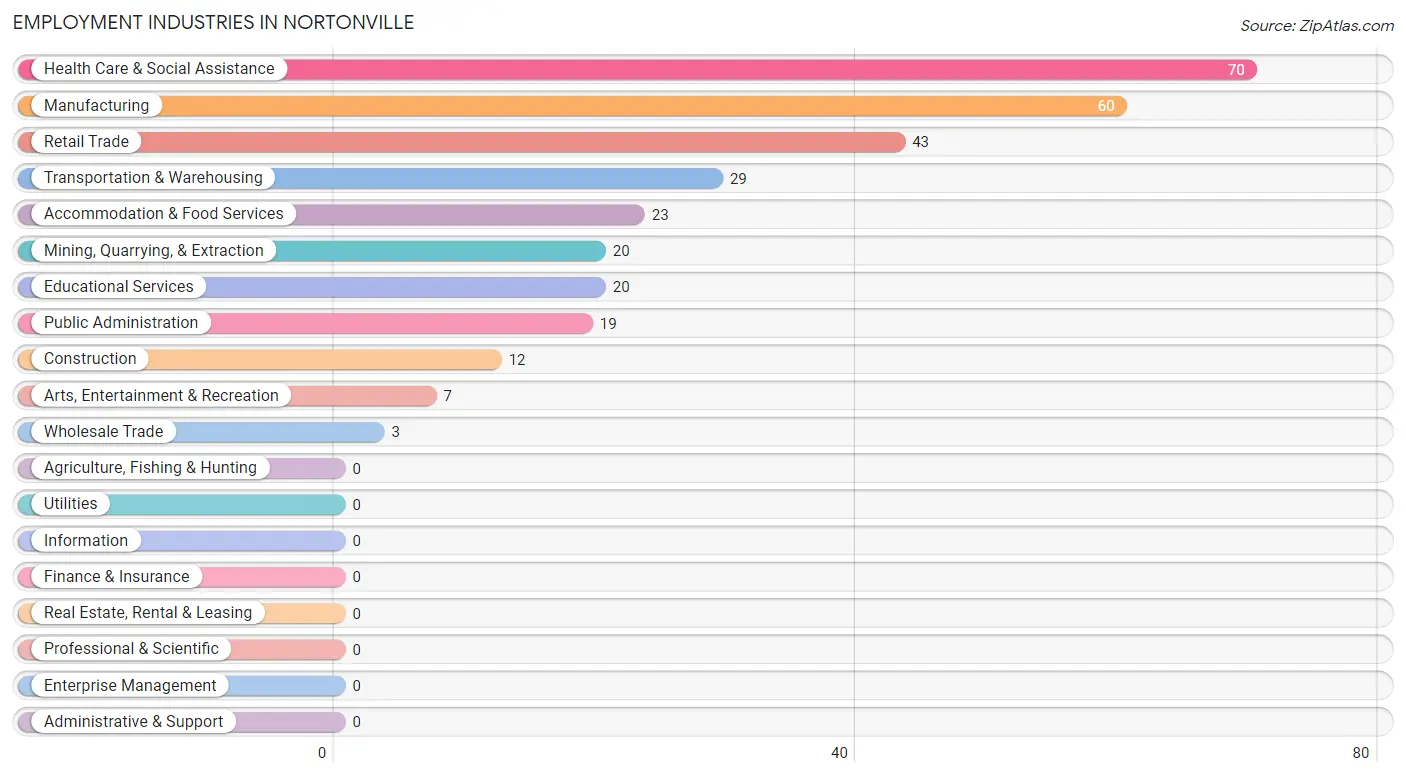
Employment Industries in Nortonville
The major employment industries in Nortonville include Health Care & Social Assistance (70 | 22.6%), Manufacturing (60 | 19.4%), Retail Trade (43 | 13.9%), Transportation & Warehousing (29 | 9.3%), and Accommodation & Food Services (23 | 7.4%).
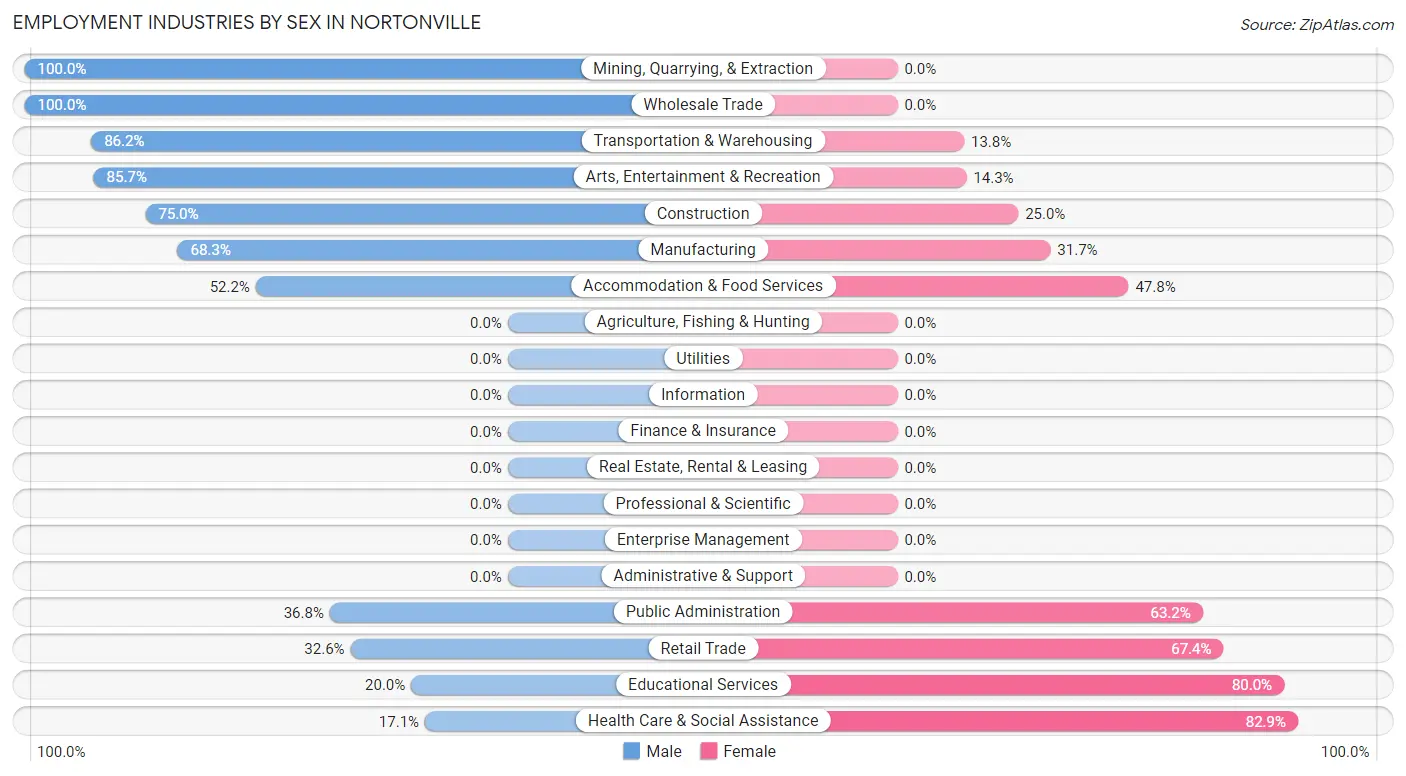
Employment Industries by Sex in Nortonville
The Nortonville industries that see more men than women are Mining, Quarrying, & Extraction (100.0%), Wholesale Trade (100.0%), and Transportation & Warehousing (86.2%), whereas the industries that tend to have a higher number of women are Health Care & Social Assistance (82.9%), Educational Services (80.0%), and Retail Trade (67.4%).
| Industry | Male | Female |
| Agriculture, Fishing & Hunting | 0 (0.0%) | 0 (0.0%) |
| Mining, Quarrying, & Extraction | 20 (100.0%) | 0 (0.0%) |
| Construction | 9 (75.0%) | 3 (25.0%) |
| Manufacturing | 41 (68.3%) | 19 (31.7%) |
| Wholesale Trade | 3 (100.0%) | 0 (0.0%) |
| Retail Trade | 14 (32.6%) | 29 (67.4%) |
| Transportation & Warehousing | 25 (86.2%) | 4 (13.8%) |
| Utilities | 0 (0.0%) | 0 (0.0%) |
| Information | 0 (0.0%) | 0 (0.0%) |
| Finance & Insurance | 0 (0.0%) | 0 (0.0%) |
| Real Estate, Rental & Leasing | 0 (0.0%) | 0 (0.0%) |
| Professional & Scientific | 0 (0.0%) | 0 (0.0%) |
| Enterprise Management | 0 (0.0%) | 0 (0.0%) |
| Administrative & Support | 0 (0.0%) | 0 (0.0%) |
| Educational Services | 4 (20.0%) | 16 (80.0%) |
| Health Care & Social Assistance | 12 (17.1%) | 58 (82.9%) |
| Arts, Entertainment & Recreation | 6 (85.7%) | 1 (14.3%) |
| Accommodation & Food Services | 12 (52.2%) | 11 (47.8%) |
| Public Administration | 7 (36.8%) | 12 (63.2%) |
| Total | 157 (50.6%) | 153 (49.3%) |
Education in Nortonville
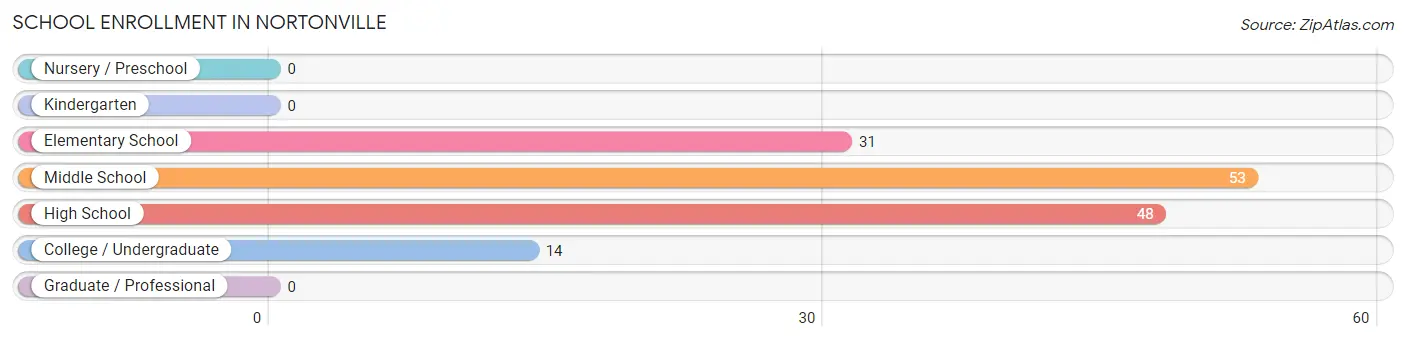
School Enrollment in Nortonville
The most common levels of schooling among the 146 students in Nortonville are middle school (53 | 36.3%), high school (48 | 32.9%), and elementary school (31 | 21.2%).
| School Level | # Students | % Students |
| Nursery / Preschool | 0 | 0.0% |
| Kindergarten | 0 | 0.0% |
| Elementary School | 31 | 21.2% |
| Middle School | 53 | 36.3% |
| High School | 48 | 32.9% |
| College / Undergraduate | 14 | 9.6% |
| Graduate / Professional | 0 | 0.0% |
| Total | 146 | 100.0% |
School Enrollment by Age by Funding Source in Nortonville
Out of a total of 146 students who are enrolled in schools in Nortonville, 2 (1.4%) attend a private institution, while the remaining 144 (98.6%) are enrolled in public schools. The age group of 15 to 17 year olds has the highest likelihood of being enrolled in private schools, with 2 (5.3% in the age bracket) enrolled. Conversely, the age group of 5 to 9 year old has the lowest likelihood of being enrolled in a private school, with 24 (100.0% in the age bracket) attending a public institution.
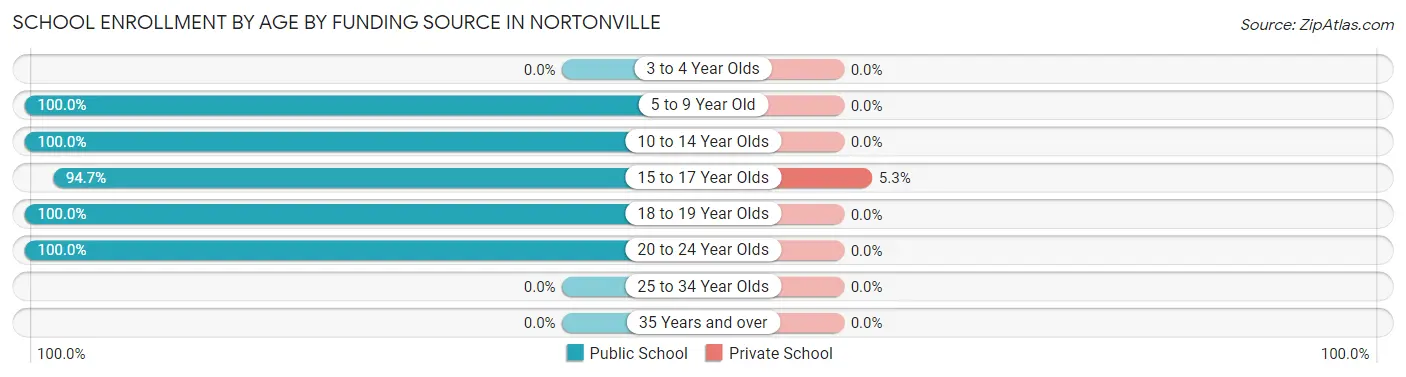
| Age Bracket | Public School | Private School |
| 3 to 4 Year Olds | 0 (0.0%) | 0 (0.0%) |
| 5 to 9 Year Old | 24 (100.0%) | 0 (0.0%) |
| 10 to 14 Year Olds | 70 (100.0%) | 0 (0.0%) |
| 15 to 17 Year Olds | 36 (94.7%) | 2 (5.3%) |
| 18 to 19 Year Olds | 4 (100.0%) | 0 (0.0%) |
| 20 to 24 Year Olds | 10 (100.0%) | 0 (0.0%) |
| 25 to 34 Year Olds | 0 (0.0%) | 0 (0.0%) |
| 35 Years and over | 0 (0.0%) | 0 (0.0%) |
| Total | 144 (98.6%) | 2 (1.4%) |
Educational Attainment by Field of Study in Nortonville
Education (12 | 24.0%), bio, nature & agricultural (10 | 20.0%), science & technology (8 | 16.0%), arts & humanities (7 | 14.0%), and business (6 | 12.0%) are the most common fields of study among 50 individuals in Nortonville who have obtained a bachelor's degree or higher.
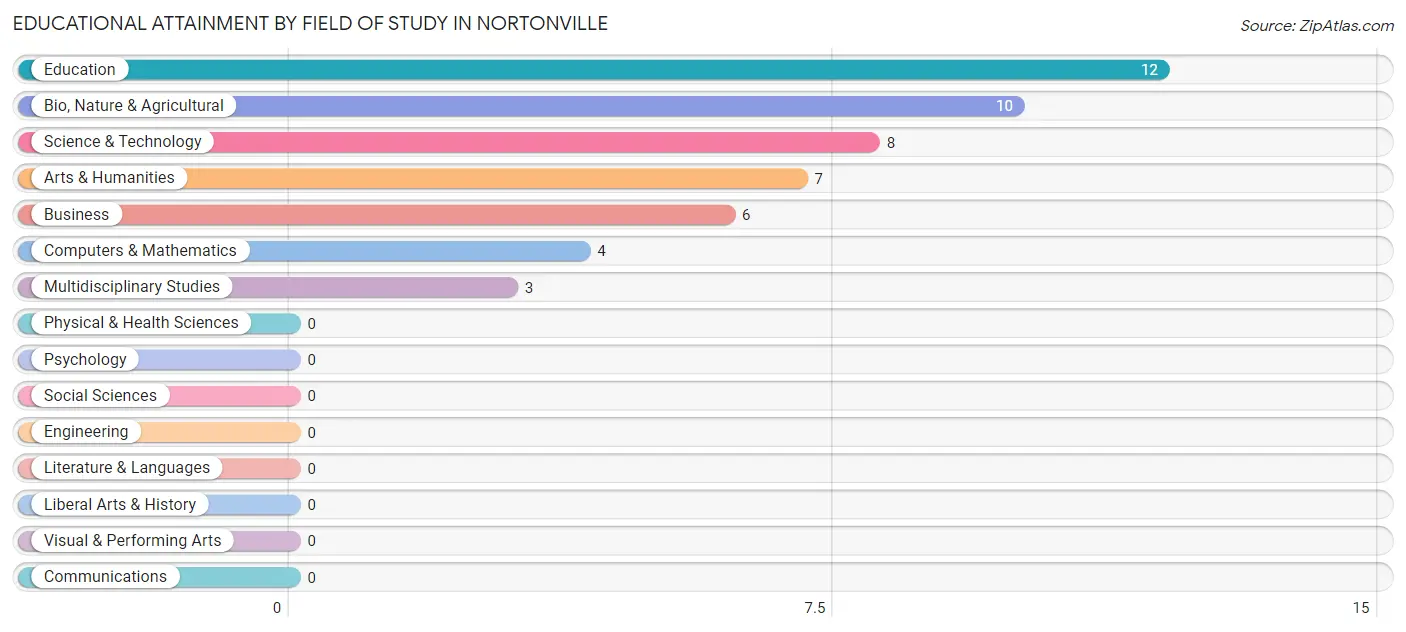
| Field of Study | # Graduates | % Graduates |
| Computers & Mathematics | 4 | 8.0% |
| Bio, Nature & Agricultural | 10 | 20.0% |
| Physical & Health Sciences | 0 | 0.0% |
| Psychology | 0 | 0.0% |
| Social Sciences | 0 | 0.0% |
| Engineering | 0 | 0.0% |
| Multidisciplinary Studies | 3 | 6.0% |
| Science & Technology | 8 | 16.0% |
| Business | 6 | 12.0% |
| Education | 12 | 24.0% |
| Literature & Languages | 0 | 0.0% |
| Liberal Arts & History | 0 | 0.0% |
| Visual & Performing Arts | 0 | 0.0% |
| Communications | 0 | 0.0% |
| Arts & Humanities | 7 | 14.0% |
| Total | 50 | 100.0% |
Transportation & Commute in Nortonville
Vehicle Availability by Sex in Nortonville
The most prevalent vehicle ownership categories in Nortonville are males with 4 vehicles (55, accounting for 37.9%) and females with 4 vehicles (28, making up 35.9%).
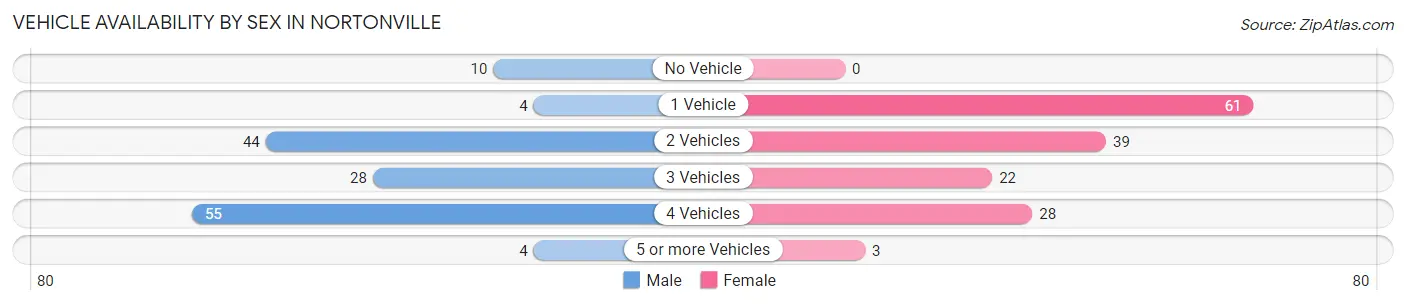
| Vehicles Available | Male | Female |
| No Vehicle | 10 (6.9%) | 0 (0.0%) |
| 1 Vehicle | 4 (2.8%) | 61 (39.9%) |
| 2 Vehicles | 44 (30.3%) | 39 (25.5%) |
| 3 Vehicles | 28 (19.3%) | 22 (14.4%) |
| 4 Vehicles | 55 (37.9%) | 28 (18.3%) |
| 5 or more Vehicles | 4 (2.8%) | 3 (2.0%) |
| Total | 145 (100.0%) | 153 (100.0%) |
Commute Time in Nortonville
The most frequently occuring commute durations in Nortonville are 20 to 24 minutes (103 commuters, 34.6%), 15 to 19 minutes (87 commuters, 29.2%), and 30 to 34 minutes (48 commuters, 16.1%).
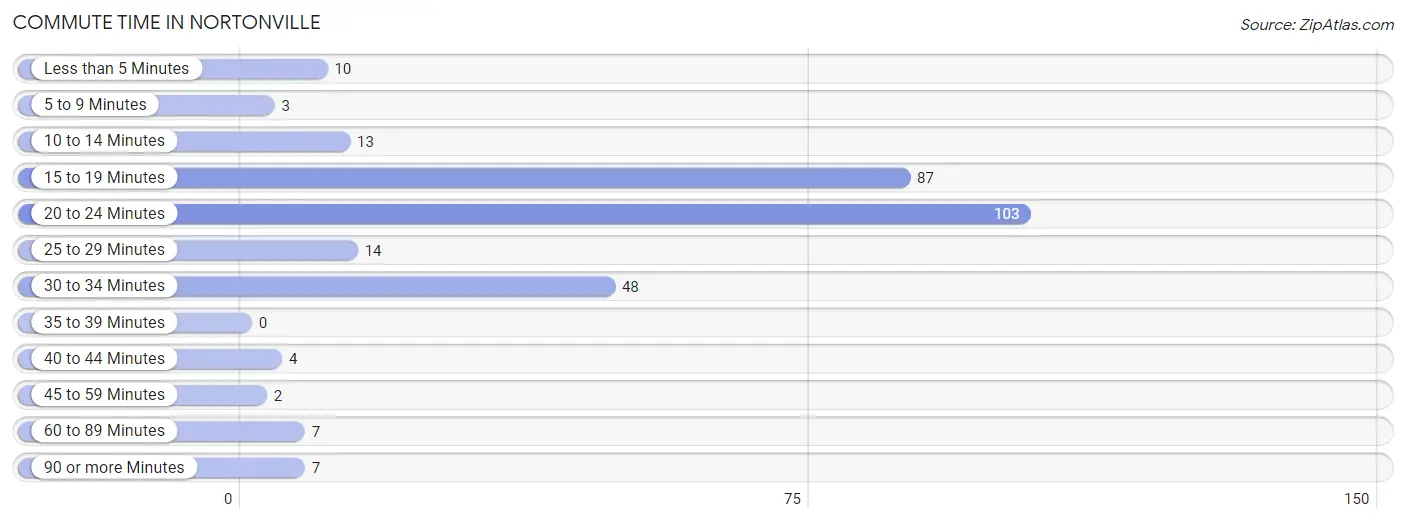
| Commute Time | # Commuters | % Commuters |
| Less than 5 Minutes | 10 | 3.4% |
| 5 to 9 Minutes | 3 | 1.0% |
| 10 to 14 Minutes | 13 | 4.4% |
| 15 to 19 Minutes | 87 | 29.2% |
| 20 to 24 Minutes | 103 | 34.6% |
| 25 to 29 Minutes | 14 | 4.7% |
| 30 to 34 Minutes | 48 | 16.1% |
| 35 to 39 Minutes | 0 | 0.0% |
| 40 to 44 Minutes | 4 | 1.3% |
| 45 to 59 Minutes | 2 | 0.7% |
| 60 to 89 Minutes | 7 | 2.4% |
| 90 or more Minutes | 7 | 2.4% |
Commute Time by Sex in Nortonville
The most common commute times in Nortonville are 20 to 24 minutes (52 commuters, 35.9%) for males and 15 to 19 minutes (56 commuters, 36.6%) for females.
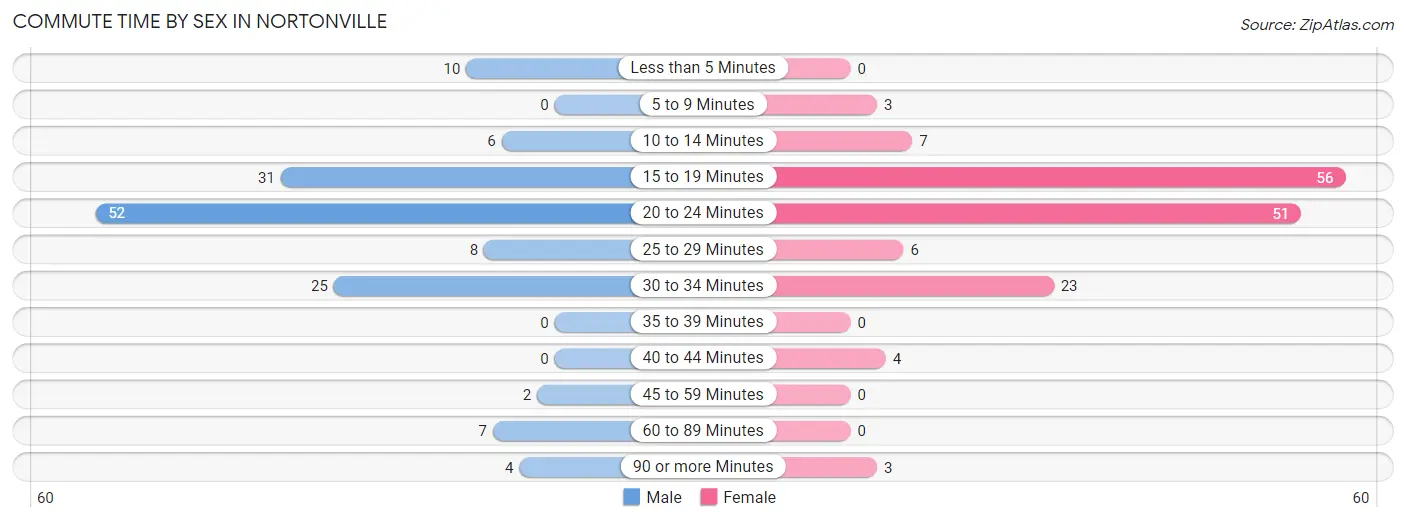
| Commute Time | Male | Female |
| Less than 5 Minutes | 10 (6.9%) | 0 (0.0%) |
| 5 to 9 Minutes | 0 (0.0%) | 3 (2.0%) |
| 10 to 14 Minutes | 6 (4.1%) | 7 (4.6%) |
| 15 to 19 Minutes | 31 (21.4%) | 56 (36.6%) |
| 20 to 24 Minutes | 52 (35.9%) | 51 (33.3%) |
| 25 to 29 Minutes | 8 (5.5%) | 6 (3.9%) |
| 30 to 34 Minutes | 25 (17.2%) | 23 (15.0%) |
| 35 to 39 Minutes | 0 (0.0%) | 0 (0.0%) |
| 40 to 44 Minutes | 0 (0.0%) | 4 (2.6%) |
| 45 to 59 Minutes | 2 (1.4%) | 0 (0.0%) |
| 60 to 89 Minutes | 7 (4.8%) | 0 (0.0%) |
| 90 or more Minutes | 4 (2.8%) | 3 (2.0%) |
Time of Departure to Work by Sex in Nortonville
The most frequent times of departure to work in Nortonville are 12:00 PM to 3:59 PM (49, 33.8%) for males and 7:30 AM to 7:59 AM (54, 35.3%) for females.
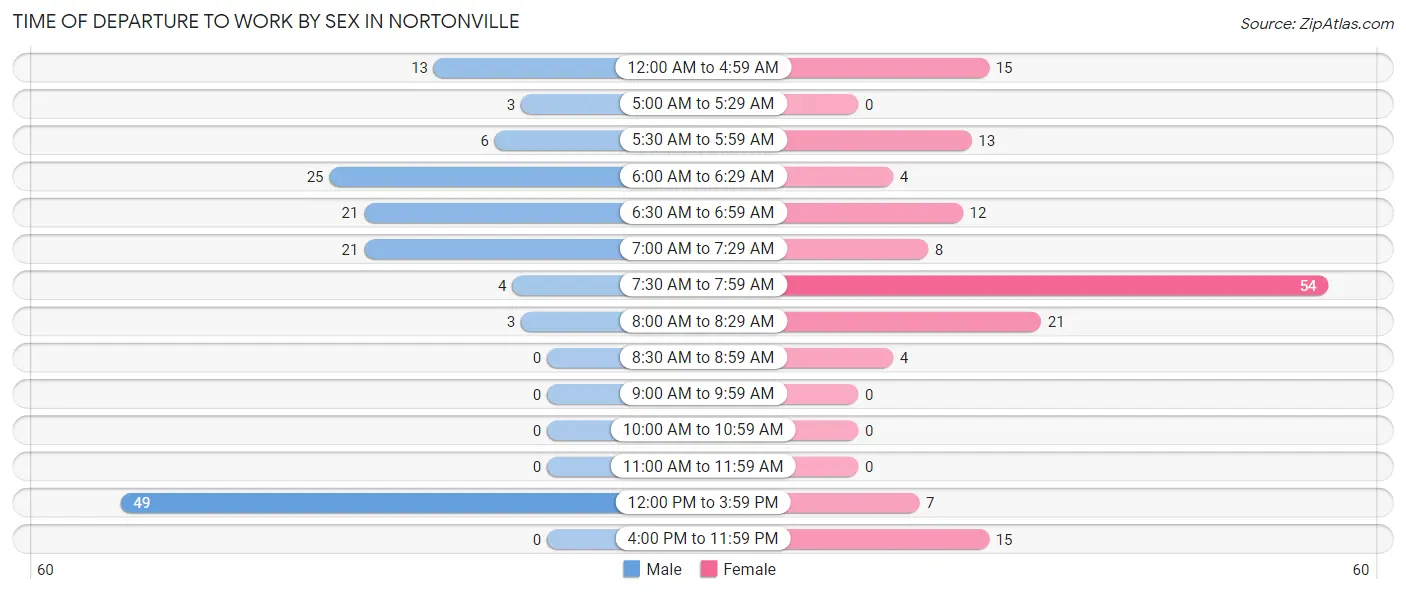
| Time of Departure | Male | Female |
| 12:00 AM to 4:59 AM | 13 (9.0%) | 15 (9.8%) |
| 5:00 AM to 5:29 AM | 3 (2.1%) | 0 (0.0%) |
| 5:30 AM to 5:59 AM | 6 (4.1%) | 13 (8.5%) |
| 6:00 AM to 6:29 AM | 25 (17.2%) | 4 (2.6%) |
| 6:30 AM to 6:59 AM | 21 (14.5%) | 12 (7.8%) |
| 7:00 AM to 7:29 AM | 21 (14.5%) | 8 (5.2%) |
| 7:30 AM to 7:59 AM | 4 (2.8%) | 54 (35.3%) |
| 8:00 AM to 8:29 AM | 3 (2.1%) | 21 (13.7%) |
| 8:30 AM to 8:59 AM | 0 (0.0%) | 4 (2.6%) |
| 9:00 AM to 9:59 AM | 0 (0.0%) | 0 (0.0%) |
| 10:00 AM to 10:59 AM | 0 (0.0%) | 0 (0.0%) |
| 11:00 AM to 11:59 AM | 0 (0.0%) | 0 (0.0%) |
| 12:00 PM to 3:59 PM | 49 (33.8%) | 7 (4.6%) |
| 4:00 PM to 11:59 PM | 0 (0.0%) | 15 (9.8%) |
| Total | 145 (100.0%) | 153 (100.0%) |
Housing Occupancy in Nortonville
Occupancy by Ownership in Nortonville
Of the total 381 dwellings in Nortonville, owner-occupied units account for 285 (74.8%), while renter-occupied units make up 96 (25.2%).
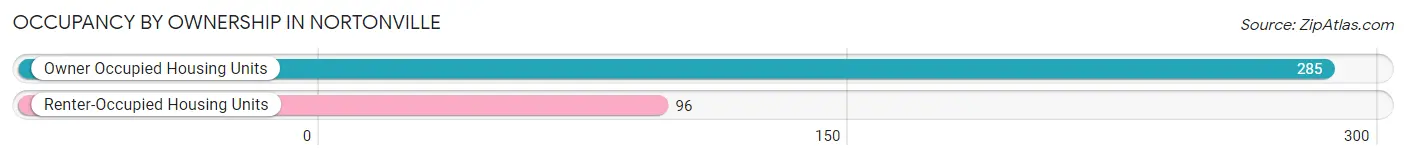
| Occupancy | # Housing Units | % Housing Units |
| Owner Occupied Housing Units | 285 | 74.8% |
| Renter-Occupied Housing Units | 96 | 25.2% |
| Total Occupied Housing Units | 381 | 100.0% |
Occupancy by Household Size in Nortonville
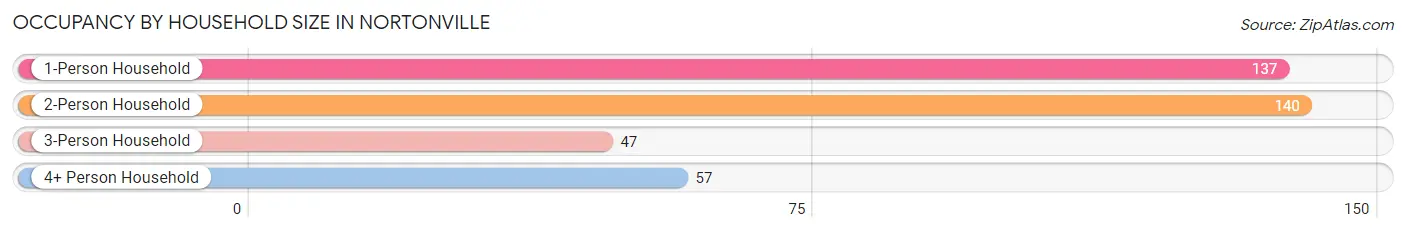
| Household Size | # Housing Units | % Housing Units |
| 1-Person Household | 137 | 36.0% |
| 2-Person Household | 140 | 36.7% |
| 3-Person Household | 47 | 12.3% |
| 4+ Person Household | 57 | 15.0% |
| Total Housing Units | 381 | 100.0% |
Occupancy by Ownership by Household Size in Nortonville
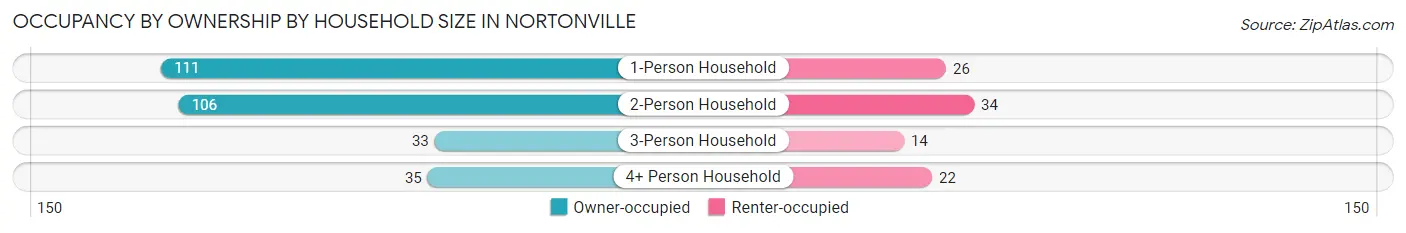
| Household Size | Owner-occupied | Renter-occupied |
| 1-Person Household | 111 (81.0%) | 26 (19.0%) |
| 2-Person Household | 106 (75.7%) | 34 (24.3%) |
| 3-Person Household | 33 (70.2%) | 14 (29.8%) |
| 4+ Person Household | 35 (61.4%) | 22 (38.6%) |
| Total Housing Units | 285 (74.8%) | 96 (25.2%) |
Occupancy by Educational Attainment in Nortonville
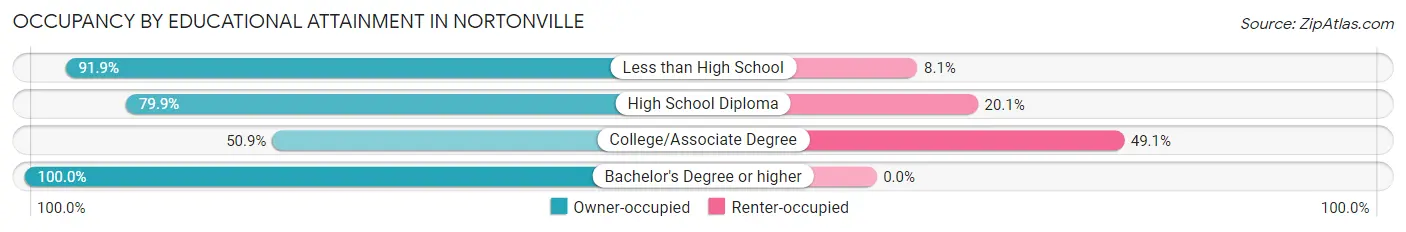
| Household Size | Owner-occupied | Renter-occupied |
| Less than High School | 34 (91.9%) | 3 (8.1%) |
| High School Diploma | 155 (79.9%) | 39 (20.1%) |
| College/Associate Degree | 56 (50.9%) | 54 (49.1%) |
| Bachelor's Degree or higher | 40 (100.0%) | 0 (0.0%) |
Occupancy by Age of Householder in Nortonville
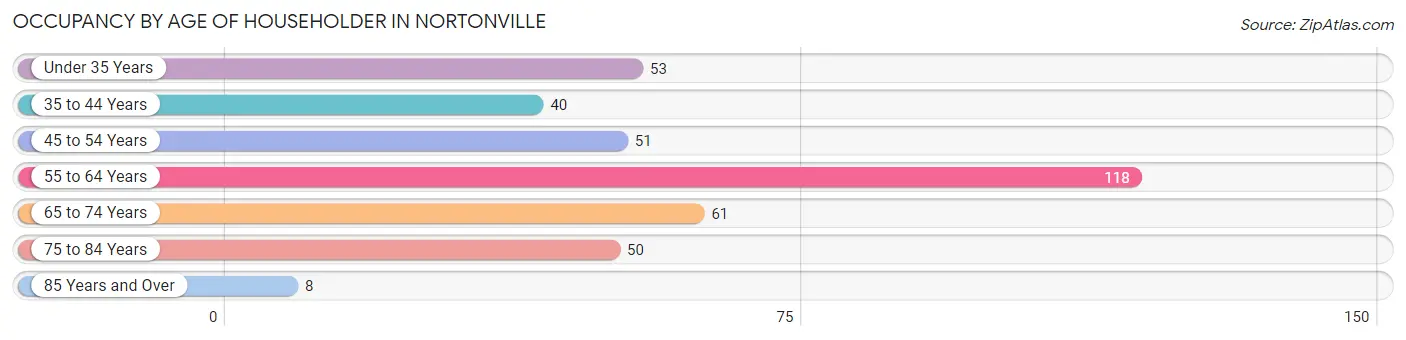
| Age Bracket | # Households | % Households |
| Under 35 Years | 53 | 13.9% |
| 35 to 44 Years | 40 | 10.5% |
| 45 to 54 Years | 51 | 13.4% |
| 55 to 64 Years | 118 | 31.0% |
| 65 to 74 Years | 61 | 16.0% |
| 75 to 84 Years | 50 | 13.1% |
| 85 Years and Over | 8 | 2.1% |
| Total | 381 | 100.0% |
Housing Finances in Nortonville
Median Income by Occupancy in Nortonville
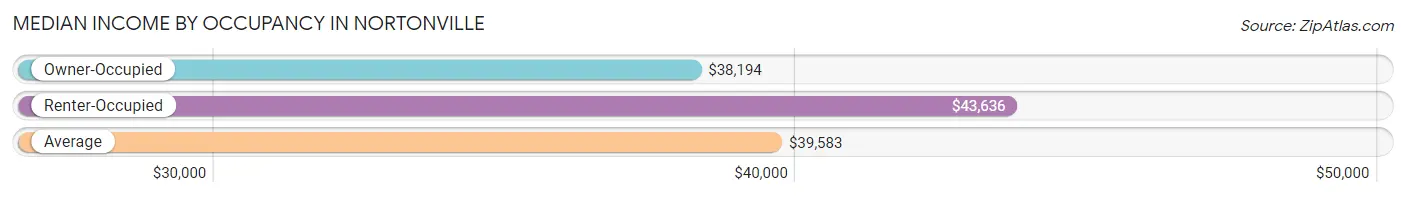
| Occupancy Type | # Households | Median Income |
| Owner-Occupied | 285 (74.8%) | $38,194 |
| Renter-Occupied | 96 (25.2%) | $43,636 |
| Average | 381 (100.0%) | $39,583 |
Occupancy by Householder Income Bracket in Nortonville
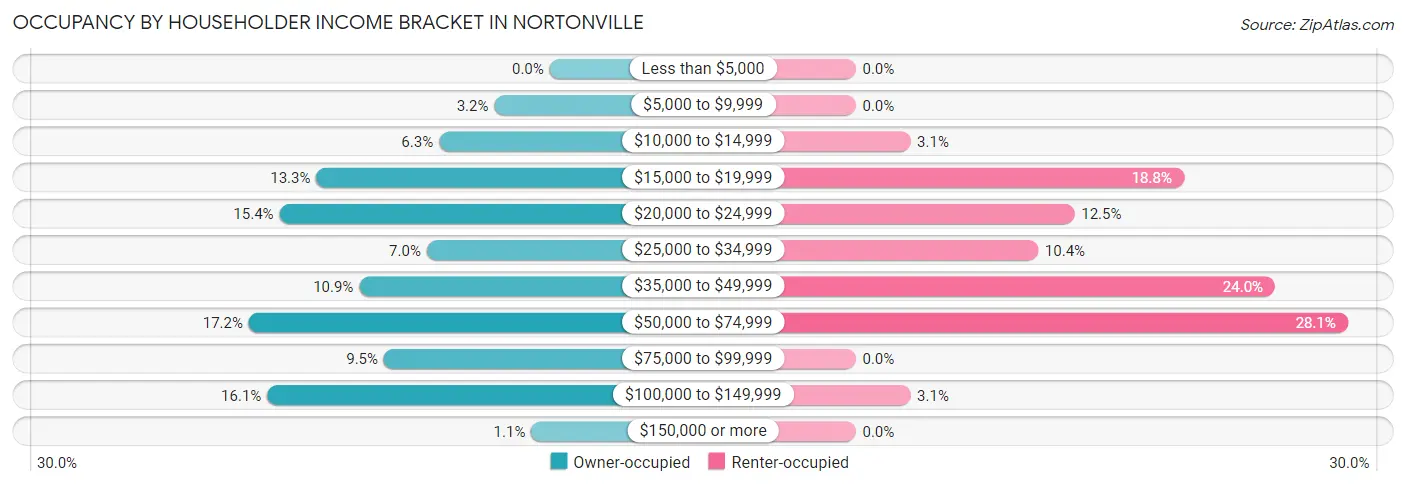
| Income Bracket | Owner-occupied | Renter-occupied |
| Less than $5,000 | 0 (0.0%) | 0 (0.0%) |
| $5,000 to $9,999 | 9 (3.2%) | 0 (0.0%) |
| $10,000 to $14,999 | 18 (6.3%) | 3 (3.1%) |
| $15,000 to $19,999 | 38 (13.3%) | 18 (18.8%) |
| $20,000 to $24,999 | 44 (15.4%) | 12 (12.5%) |
| $25,000 to $34,999 | 20 (7.0%) | 10 (10.4%) |
| $35,000 to $49,999 | 31 (10.9%) | 23 (24.0%) |
| $50,000 to $74,999 | 49 (17.2%) | 27 (28.1%) |
| $75,000 to $99,999 | 27 (9.5%) | 0 (0.0%) |
| $100,000 to $149,999 | 46 (16.1%) | 3 (3.1%) |
| $150,000 or more | 3 (1.1%) | 0 (0.0%) |
| Total | 285 (100.0%) | 96 (100.0%) |
Monthly Housing Cost Tiers in Nortonville
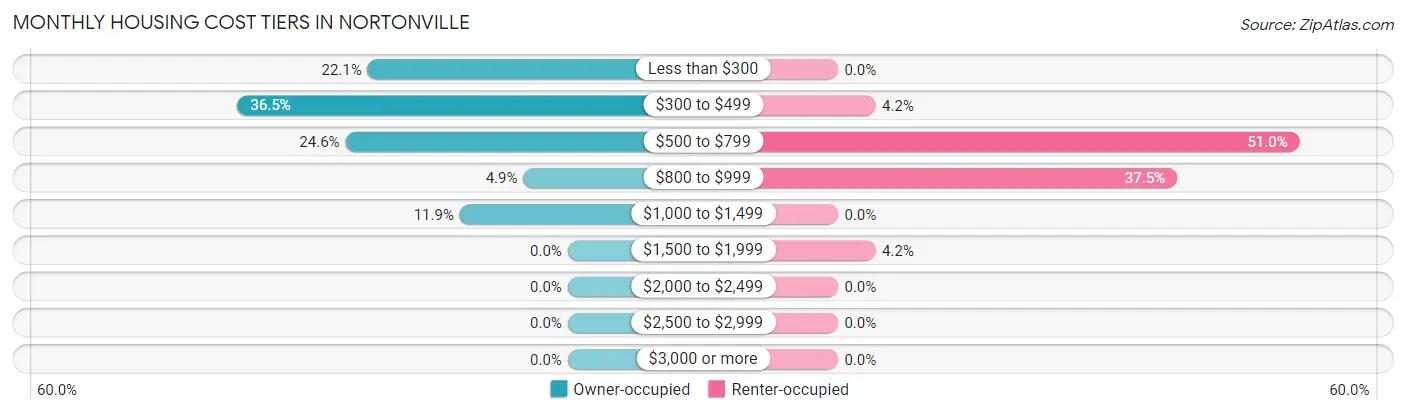
| Monthly Cost | Owner-occupied | Renter-occupied |
| Less than $300 | 63 (22.1%) | 0 (0.0%) |
| $300 to $499 | 104 (36.5%) | 4 (4.2%) |
| $500 to $799 | 70 (24.6%) | 49 (51.0%) |
| $800 to $999 | 14 (4.9%) | 36 (37.5%) |
| $1,000 to $1,499 | 34 (11.9%) | 0 (0.0%) |
| $1,500 to $1,999 | 0 (0.0%) | 4 (4.2%) |
| $2,000 to $2,499 | 0 (0.0%) | 0 (0.0%) |
| $2,500 to $2,999 | 0 (0.0%) | 0 (0.0%) |
| $3,000 or more | 0 (0.0%) | 0 (0.0%) |
| Total | 285 (100.0%) | 96 (100.0%) |
Physical Housing Characteristics in Nortonville
Housing Structures in Nortonville
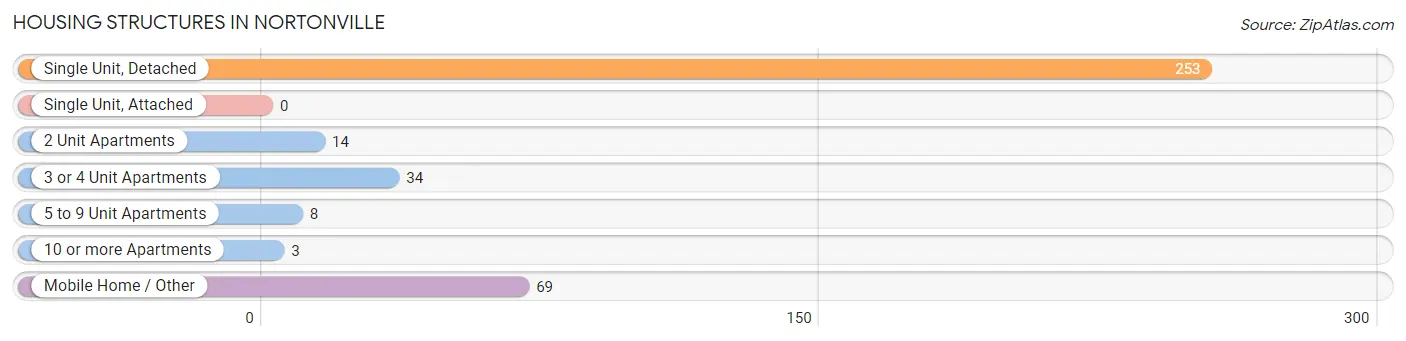
| Structure Type | # Housing Units | % Housing Units |
| Single Unit, Detached | 253 | 66.4% |
| Single Unit, Attached | 0 | 0.0% |
| 2 Unit Apartments | 14 | 3.7% |
| 3 or 4 Unit Apartments | 34 | 8.9% |
| 5 to 9 Unit Apartments | 8 | 2.1% |
| 10 or more Apartments | 3 | 0.8% |
| Mobile Home / Other | 69 | 18.1% |
| Total | 381 | 100.0% |
Housing Structures by Occupancy in Nortonville
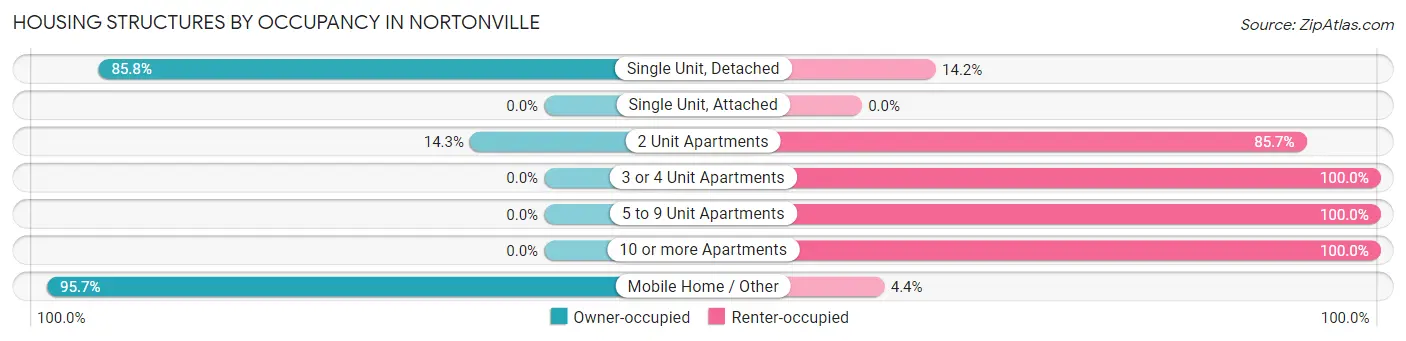
| Structure Type | Owner-occupied | Renter-occupied |
| Single Unit, Detached | 217 (85.8%) | 36 (14.2%) |
| Single Unit, Attached | 0 (0.0%) | 0 (0.0%) |
| 2 Unit Apartments | 2 (14.3%) | 12 (85.7%) |
| 3 or 4 Unit Apartments | 0 (0.0%) | 34 (100.0%) |
| 5 to 9 Unit Apartments | 0 (0.0%) | 8 (100.0%) |
| 10 or more Apartments | 0 (0.0%) | 3 (100.0%) |
| Mobile Home / Other | 66 (95.7%) | 3 (4.3%) |
| Total | 285 (74.8%) | 96 (25.2%) |
Housing Structures by Number of Rooms in Nortonville
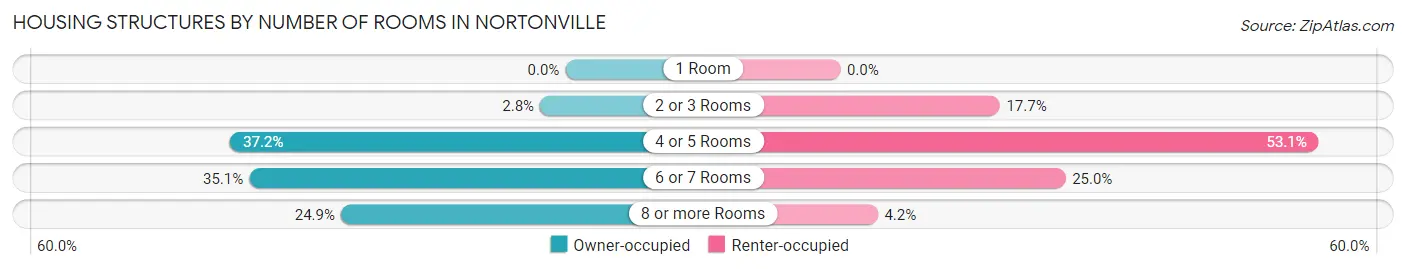
| Number of Rooms | Owner-occupied | Renter-occupied |
| 1 Room | 0 (0.0%) | 0 (0.0%) |
| 2 or 3 Rooms | 8 (2.8%) | 17 (17.7%) |
| 4 or 5 Rooms | 106 (37.2%) | 51 (53.1%) |
| 6 or 7 Rooms | 100 (35.1%) | 24 (25.0%) |
| 8 or more Rooms | 71 (24.9%) | 4 (4.2%) |
| Total | 285 (100.0%) | 96 (100.0%) |
Housing Structure by Heating Type in Nortonville
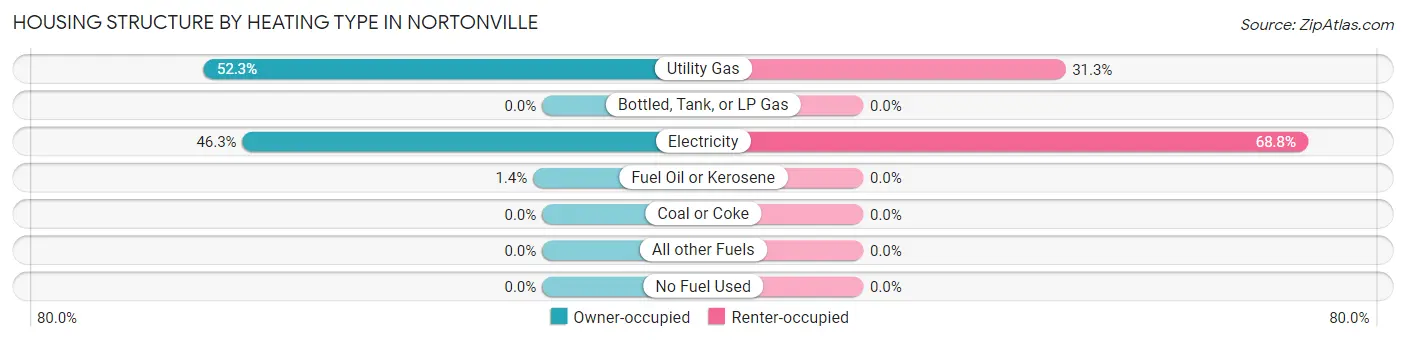
| Heating Type | Owner-occupied | Renter-occupied |
| Utility Gas | 149 (52.3%) | 30 (31.2%) |
| Bottled, Tank, or LP Gas | 0 (0.0%) | 0 (0.0%) |
| Electricity | 132 (46.3%) | 66 (68.8%) |
| Fuel Oil or Kerosene | 4 (1.4%) | 0 (0.0%) |
| Coal or Coke | 0 (0.0%) | 0 (0.0%) |
| All other Fuels | 0 (0.0%) | 0 (0.0%) |
| No Fuel Used | 0 (0.0%) | 0 (0.0%) |
| Total | 285 (100.0%) | 96 (100.0%) |
Household Vehicle Usage in Nortonville
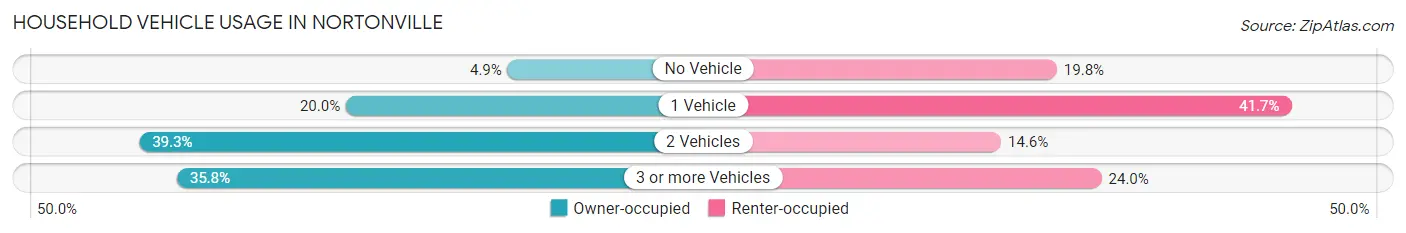
| Vehicles per Household | Owner-occupied | Renter-occupied |
| No Vehicle | 14 (4.9%) | 19 (19.8%) |
| 1 Vehicle | 57 (20.0%) | 40 (41.7%) |
| 2 Vehicles | 112 (39.3%) | 14 (14.6%) |
| 3 or more Vehicles | 102 (35.8%) | 23 (24.0%) |
| Total | 285 (100.0%) | 96 (100.0%) |
Real Estate & Mortgages in Nortonville
Real Estate and Mortgage Overview in Nortonville
| Characteristic | Without Mortgage | With Mortgage |
| Housing Units | 199 | 86 |
| Median Property Value | $56,900 | $70,000 |
| Median Household Income | $24,450 | $3 |
| Monthly Housing Costs | $342 | $0 |
| Real Estate Taxes | $425 | $0 |
Property Value by Mortgage Status in Nortonville
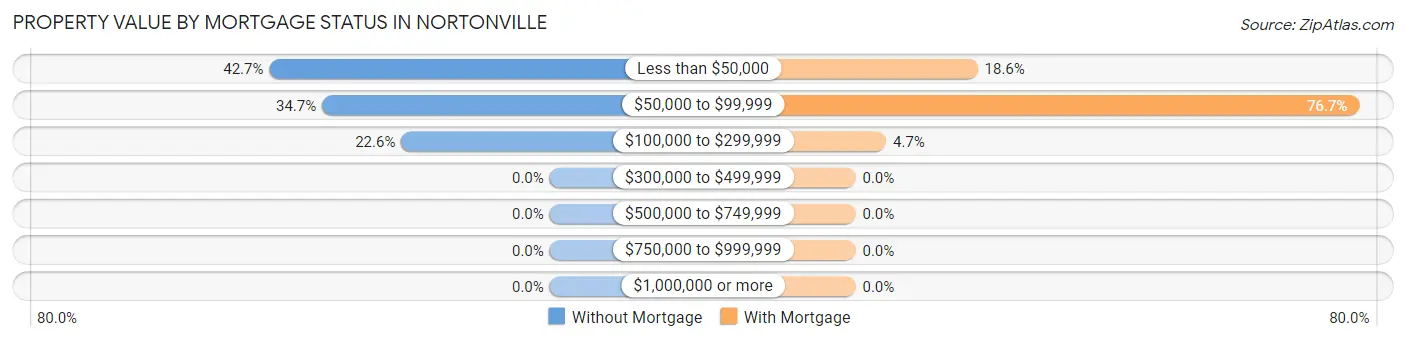
| Property Value | Without Mortgage | With Mortgage |
| Less than $50,000 | 85 (42.7%) | 16 (18.6%) |
| $50,000 to $99,999 | 69 (34.7%) | 66 (76.7%) |
| $100,000 to $299,999 | 45 (22.6%) | 4 (4.6%) |
| $300,000 to $499,999 | 0 (0.0%) | 0 (0.0%) |
| $500,000 to $749,999 | 0 (0.0%) | 0 (0.0%) |
| $750,000 to $999,999 | 0 (0.0%) | 0 (0.0%) |
| $1,000,000 or more | 0 (0.0%) | 0 (0.0%) |
| Total | 199 (100.0%) | 86 (100.0%) |
Household Income by Mortgage Status in Nortonville
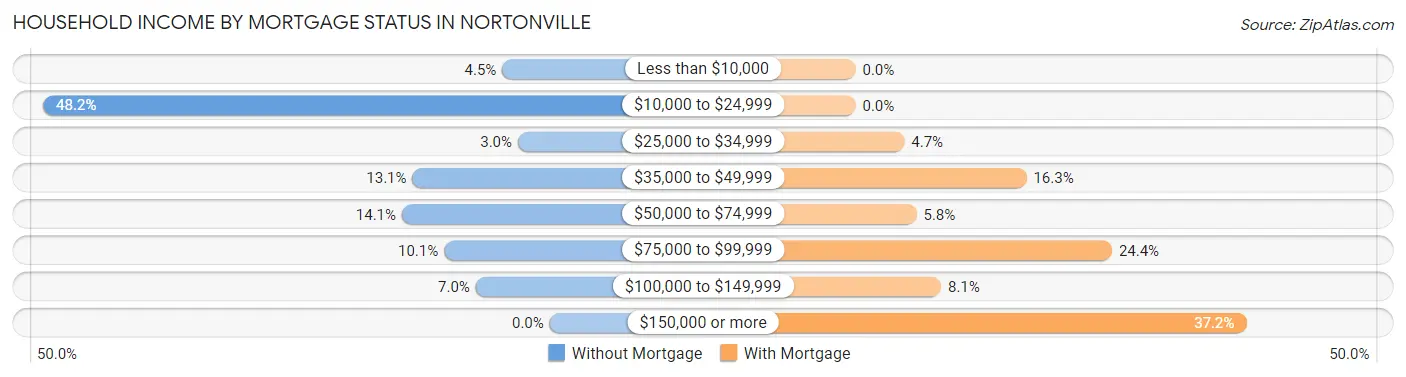
| Household Income | Without Mortgage | With Mortgage |
| Less than $10,000 | 9 (4.5%) | 0 (0.0%) |
| $10,000 to $24,999 | 96 (48.2%) | 0 (0.0%) |
| $25,000 to $34,999 | 6 (3.0%) | 4 (4.6%) |
| $35,000 to $49,999 | 26 (13.1%) | 14 (16.3%) |
| $50,000 to $74,999 | 28 (14.1%) | 5 (5.8%) |
| $75,000 to $99,999 | 20 (10.1%) | 21 (24.4%) |
| $100,000 to $149,999 | 14 (7.0%) | 7 (8.1%) |
| $150,000 or more | 0 (0.0%) | 32 (37.2%) |
| Total | 199 (100.0%) | 86 (100.0%) |
Property Value to Household Income Ratio in Nortonville
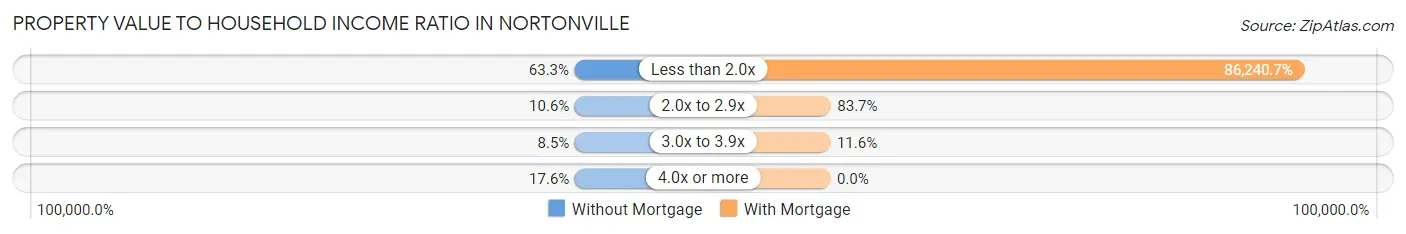
| Value-to-Income Ratio | Without Mortgage | With Mortgage |
| Less than 2.0x | 126 (63.3%) | 74,167 (86,240.7%) |
| 2.0x to 2.9x | 21 (10.5%) | 72 (83.7%) |
| 3.0x to 3.9x | 17 (8.5%) | 10 (11.6%) |
| 4.0x or more | 35 (17.6%) | 0 (0.0%) |
| Total | 199 (100.0%) | 86 (100.0%) |
Real Estate Taxes by Mortgage Status in Nortonville
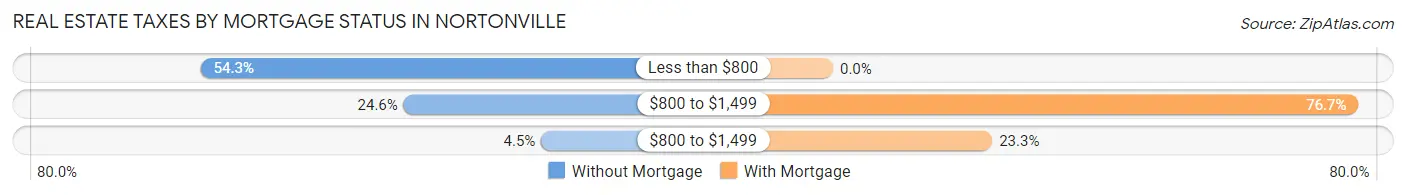
| Property Taxes | Without Mortgage | With Mortgage |
| Less than $800 | 108 (54.3%) | 0 (0.0%) |
| $800 to $1,499 | 49 (24.6%) | 66 (76.7%) |
| $800 to $1,499 | 9 (4.5%) | 20 (23.3%) |
| Total | 199 (100.0%) | 86 (100.0%) |
Health & Disability in Nortonville
Health Insurance Coverage by Age in Nortonville
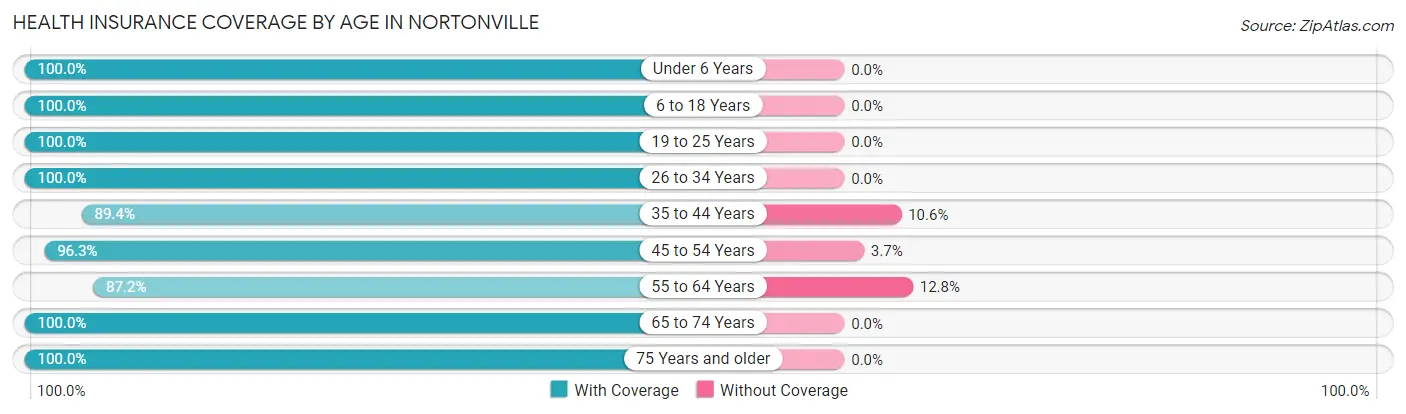
| Age Bracket | With Coverage | Without Coverage |
| Under 6 Years | 9 (100.0%) | 0 (0.0%) |
| 6 to 18 Years | 147 (100.0%) | 0 (0.0%) |
| 19 to 25 Years | 102 (100.0%) | 0 (0.0%) |
| 26 to 34 Years | 29 (100.0%) | 0 (0.0%) |
| 35 to 44 Years | 143 (89.4%) | 17 (10.6%) |
| 45 to 54 Years | 79 (96.3%) | 3 (3.7%) |
| 55 to 64 Years | 164 (87.2%) | 24 (12.8%) |
| 65 to 74 Years | 104 (100.0%) | 0 (0.0%) |
| 75 Years and older | 61 (100.0%) | 0 (0.0%) |
| Total | 838 (95.0%) | 44 (5.0%) |
Health Insurance Coverage by Citizenship Status in Nortonville
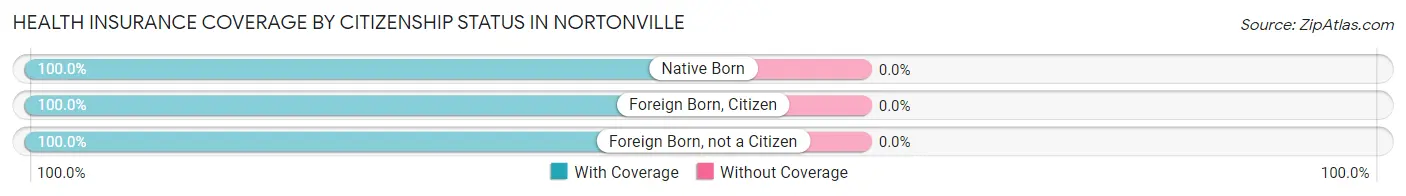
| Citizenship Status | With Coverage | Without Coverage |
| Native Born | 9 (100.0%) | 0 (0.0%) |
| Foreign Born, Citizen | 147 (100.0%) | 0 (0.0%) |
| Foreign Born, not a Citizen | 102 (100.0%) | 0 (0.0%) |
Health Insurance Coverage by Household Income in Nortonville
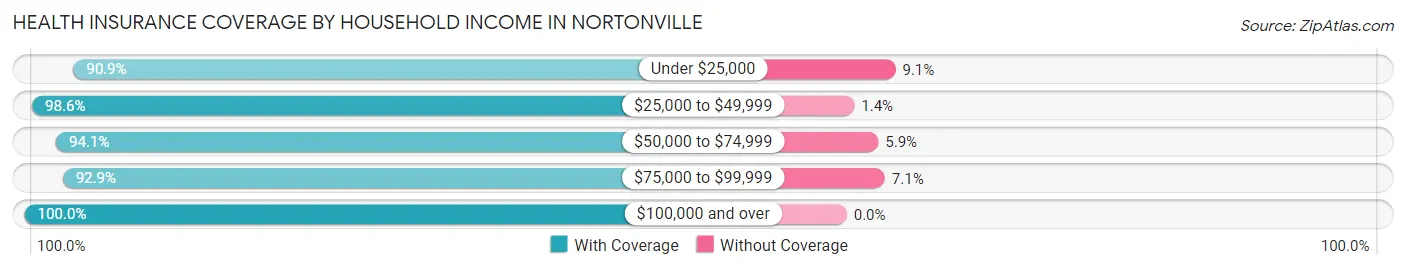
| Household Income | With Coverage | Without Coverage |
| Under $25,000 | 229 (90.9%) | 23 (9.1%) |
| $25,000 to $49,999 | 139 (98.6%) | 2 (1.4%) |
| $50,000 to $74,999 | 239 (94.1%) | 15 (5.9%) |
| $75,000 to $99,999 | 52 (92.9%) | 4 (7.1%) |
| $100,000 and over | 179 (100.0%) | 0 (0.0%) |
Public vs Private Health Insurance Coverage by Age in Nortonville
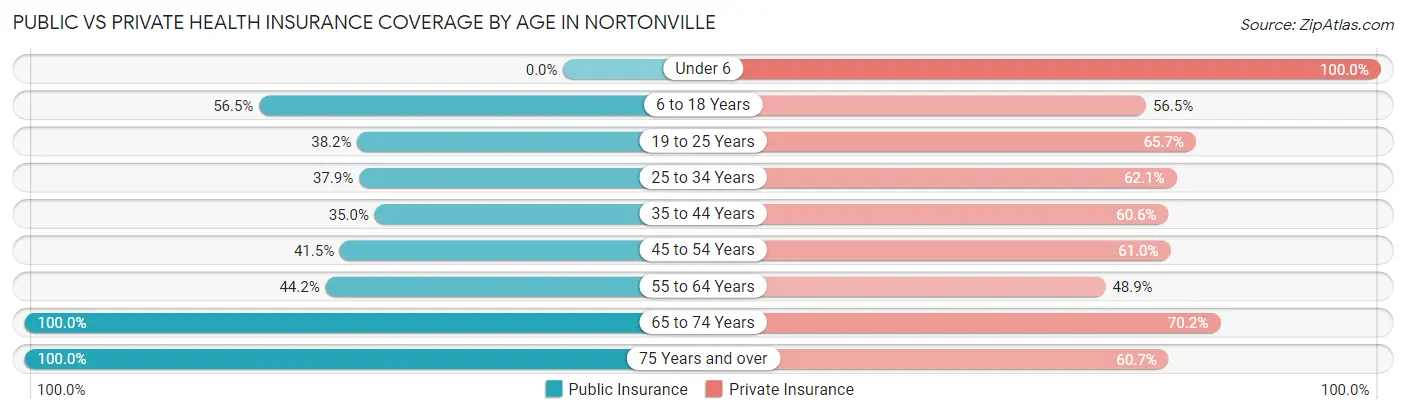
| Age Bracket | Public Insurance | Private Insurance |
| Under 6 | 0 (0.0%) | 9 (100.0%) |
| 6 to 18 Years | 83 (56.5%) | 83 (56.5%) |
| 19 to 25 Years | 39 (38.2%) | 67 (65.7%) |
| 25 to 34 Years | 11 (37.9%) | 18 (62.1%) |
| 35 to 44 Years | 56 (35.0%) | 97 (60.6%) |
| 45 to 54 Years | 34 (41.5%) | 50 (61.0%) |
| 55 to 64 Years | 83 (44.2%) | 92 (48.9%) |
| 65 to 74 Years | 104 (100.0%) | 73 (70.2%) |
| 75 Years and over | 61 (100.0%) | 37 (60.7%) |
| Total | 471 (53.4%) | 526 (59.6%) |
Disability Status by Sex by Age in Nortonville
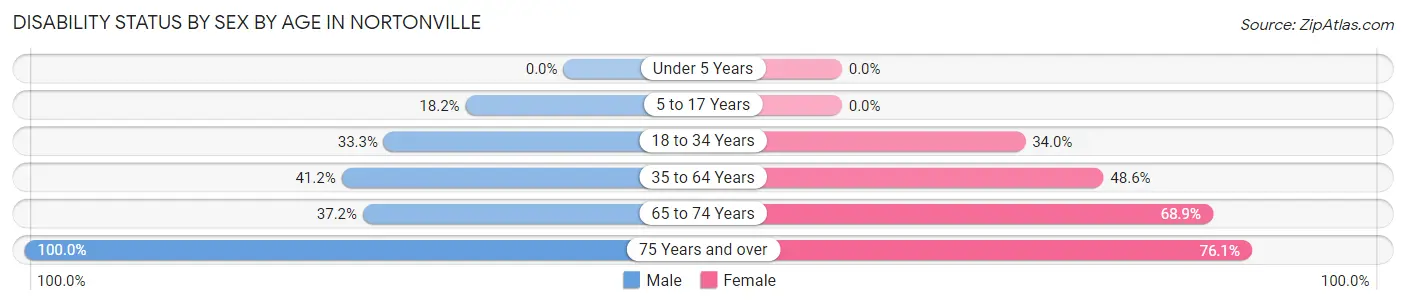
| Age Bracket | Male | Female |
| Under 5 Years | 0 (0.0%) | 0 (0.0%) |
| 5 to 17 Years | 12 (18.2%) | 0 (0.0%) |
| 18 to 34 Years | 28 (33.3%) | 16 (34.0%) |
| 35 to 64 Years | 77 (41.2%) | 118 (48.6%) |
| 65 to 74 Years | 16 (37.2%) | 42 (68.9%) |
| 75 Years and over | 15 (100.0%) | 35 (76.1%) |
Disability Class by Sex by Age in Nortonville
Disability Class: Hearing Difficulty
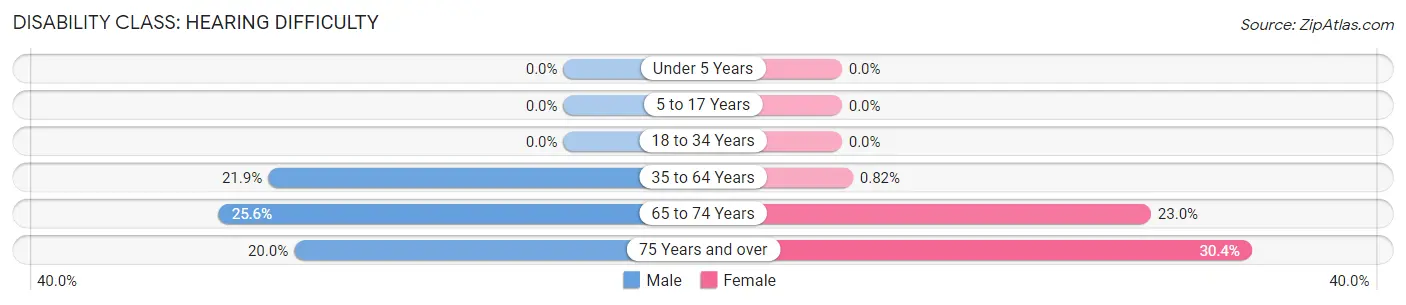
| Age Bracket | Male | Female |
| Under 5 Years | 0 (0.0%) | 0 (0.0%) |
| 5 to 17 Years | 0 (0.0%) | 0 (0.0%) |
| 18 to 34 Years | 0 (0.0%) | 0 (0.0%) |
| 35 to 64 Years | 41 (21.9%) | 2 (0.8%) |
| 65 to 74 Years | 11 (25.6%) | 14 (23.0%) |
| 75 Years and over | 3 (20.0%) | 14 (30.4%) |
Disability Class: Vision Difficulty
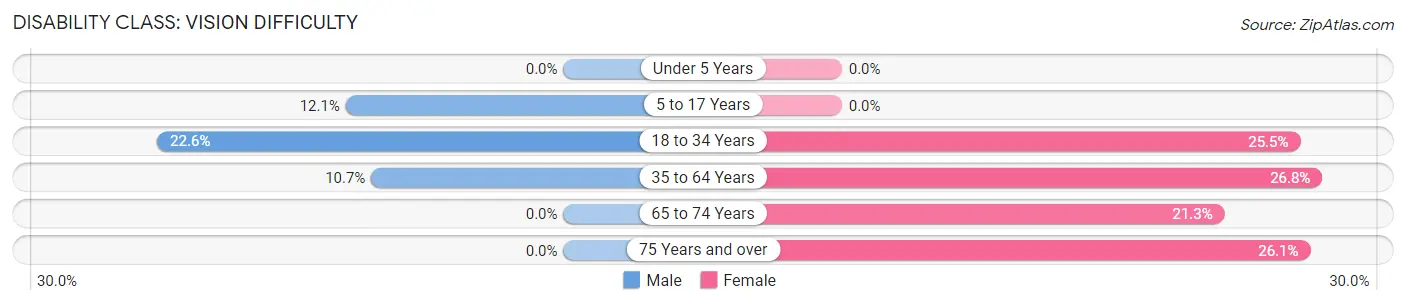
| Age Bracket | Male | Female |
| Under 5 Years | 0 (0.0%) | 0 (0.0%) |
| 5 to 17 Years | 8 (12.1%) | 0 (0.0%) |
| 18 to 34 Years | 19 (22.6%) | 12 (25.5%) |
| 35 to 64 Years | 20 (10.7%) | 65 (26.8%) |
| 65 to 74 Years | 0 (0.0%) | 13 (21.3%) |
| 75 Years and over | 0 (0.0%) | 12 (26.1%) |
Disability Class: Cognitive Difficulty
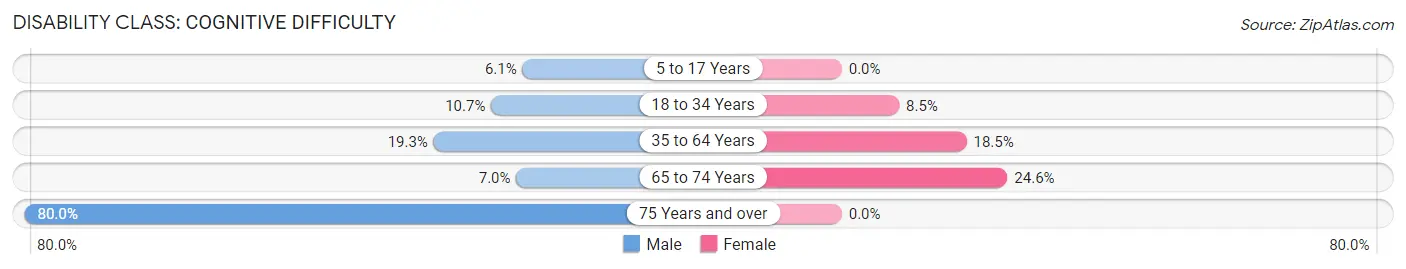
| Age Bracket | Male | Female |
| 5 to 17 Years | 4 (6.1%) | 0 (0.0%) |
| 18 to 34 Years | 9 (10.7%) | 4 (8.5%) |
| 35 to 64 Years | 36 (19.3%) | 45 (18.5%) |
| 65 to 74 Years | 3 (7.0%) | 15 (24.6%) |
| 75 Years and over | 12 (80.0%) | 0 (0.0%) |
Disability Class: Ambulatory Difficulty
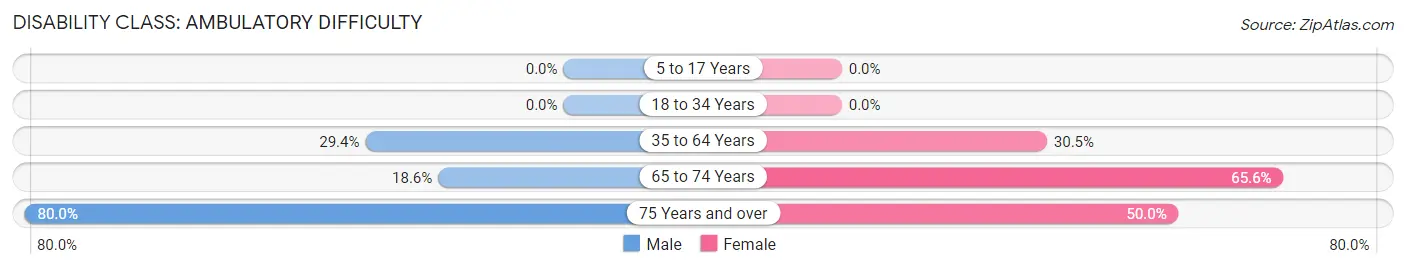
| Age Bracket | Male | Female |
| 5 to 17 Years | 0 (0.0%) | 0 (0.0%) |
| 18 to 34 Years | 0 (0.0%) | 0 (0.0%) |
| 35 to 64 Years | 55 (29.4%) | 74 (30.4%) |
| 65 to 74 Years | 8 (18.6%) | 40 (65.6%) |
| 75 Years and over | 12 (80.0%) | 23 (50.0%) |
Disability Class: Self-Care Difficulty
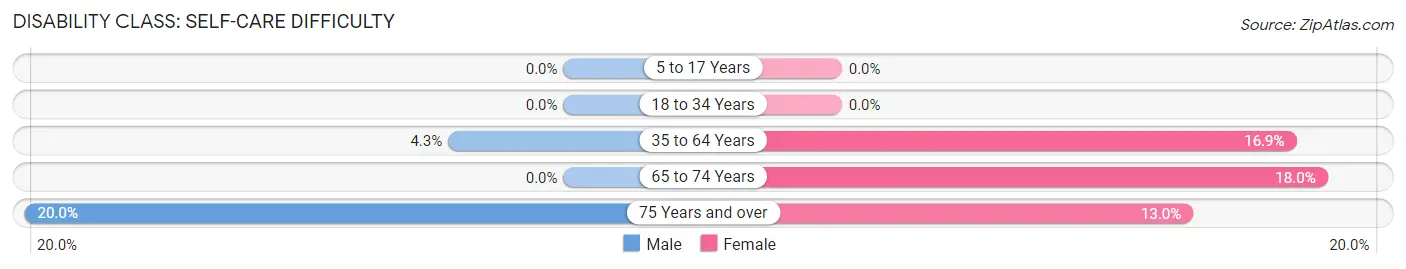
| Age Bracket | Male | Female |
| 5 to 17 Years | 0 (0.0%) | 0 (0.0%) |
| 18 to 34 Years | 0 (0.0%) | 0 (0.0%) |
| 35 to 64 Years | 8 (4.3%) | 41 (16.9%) |
| 65 to 74 Years | 0 (0.0%) | 11 (18.0%) |
| 75 Years and over | 3 (20.0%) | 6 (13.0%) |
Technology Access in Nortonville
Computing Device Access in Nortonville
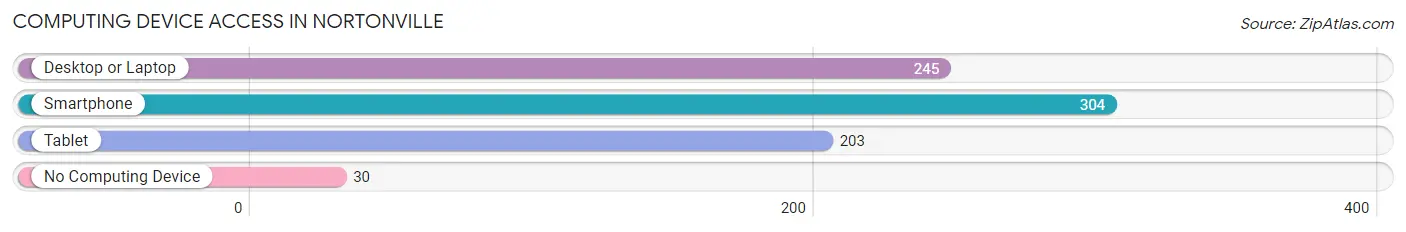
| Device Type | # Households | % Households |
| Desktop or Laptop | 245 | 64.3% |
| Smartphone | 304 | 79.8% |
| Tablet | 203 | 53.3% |
| No Computing Device | 30 | 7.9% |
| Total | 381 | 100.0% |
Internet Access in Nortonville
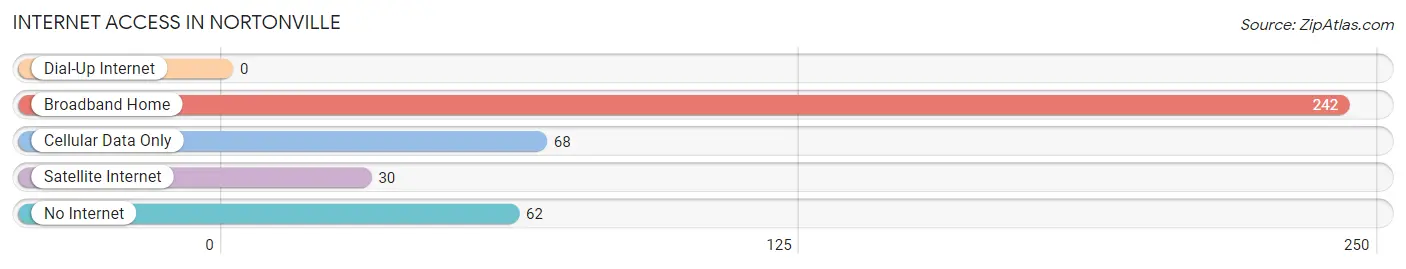
| Internet Type | # Households | % Households |
| Dial-Up Internet | 0 | 0.0% |
| Broadband Home | 242 | 63.5% |
| Cellular Data Only | 68 | 17.8% |
| Satellite Internet | 30 | 7.9% |
| No Internet | 62 | 16.3% |
| Total | 381 | 100.0% |
Nortonville Summary
Nortonville, Kentucky is a small town located in Hopkins County, Kentucky. It is situated on the banks of the Green River and is part of the Madisonville-Hopkins County Metropolitan Statistical Area. The town has a population of approximately 1,000 people and is known for its small-town charm and friendly atmosphere.
History
Nortonville was founded in 1854 by William Norton, a local farmer. The town was originally known as Nortonville Station, as it was a stop on the Louisville and Nashville Railroad. The town was officially incorporated in 1872 and was named after its founder.
In the late 19th century, Nortonville was a thriving community with a variety of businesses, including a hotel, a general store, a blacksmith shop, a livery stable, and a sawmill. The town also had a school, a post office, and a church.
In the early 20th century, Nortonville experienced a period of decline as the railroad industry declined and the town’s population decreased. However, the town was revitalized in the 1950s when the Green River Dam was built nearby. The dam provided jobs and economic growth to the area, and Nortonville experienced a period of growth and prosperity.
Geography
Nortonville is located in Hopkins County, Kentucky, on the banks of the Green River. The town is situated in the western part of the state, approximately 50 miles from the state capital of Frankfort. The town is surrounded by rolling hills and farmland, and is located near the Kentucky-Tennessee border.
The climate in Nortonville is humid subtropical, with hot summers and mild winters. The average annual temperature is around 60 degrees Fahrenheit, and the average annual precipitation is around 45 inches.
Economy
Nortonville’s economy is largely based on agriculture and tourism. The town is home to several farms, which produce a variety of crops, including corn, soybeans, and wheat. The town is also home to several tourist attractions, including the Green River Dam, which provides recreational opportunities such as fishing and boating.
The town is also home to several small businesses, including restaurants, shops, and a gas station. The town is served by the Hopkins County School District, which provides educational opportunities for the town’s children.
Demographics
As of the 2010 census, the population of Nortonville was 1,000 people. The racial makeup of the town was 97.2% White, 0.7% African American, 0.2% Native American, 0.2% Asian, 0.2% from other races, and 1.7% from two or more races. Hispanic or Latino of any race were 0.7% of the population.
The median household income in Nortonville was $35,000, and the median family income was $41,000. The per capita income in the town was $17,000. Approximately 15.2% of the population was below the poverty line.
Nortonville is a small town with a rich history and a friendly atmosphere. The town is home to a variety of businesses and attractions, and provides its residents with a variety of educational and recreational opportunities. The town’s economy is largely based on agriculture and tourism, and the town’s population is diverse and welcoming.
Common Questions
What is Per Capita Income in Nortonville?
Per Capita income in Nortonville is $23,354.
What is the Median Family Income in Nortonville?
Median Family Income in Nortonville is $52,446.
What is the Median Household income in Nortonville?
Median Household Income in Nortonville is $39,583.
What is Income or Wage Gap in Nortonville?
Income or Wage Gap in Nortonville is 45.6%.
Women in Nortonville earn 54.4 cents for every dollar earned by a man.
What is Inequality or Gini Index in Nortonville?
Inequality or Gini Index in Nortonville is 0.39.
What is the Total Population of Nortonville?
Total Population of Nortonville is 882.
What is the Total Male Population of Nortonville?
Total Male Population of Nortonville is 402.
What is the Total Female Population of Nortonville?
Total Female Population of Nortonville is 480.
What is the Ratio of Males per 100 Females in Nortonville?
There are 83.75 Males per 100 Females in Nortonville.
What is the Ratio of Females per 100 Males in Nortonville?
There are 119.40 Females per 100 Males in Nortonville.
What is the Median Population Age in Nortonville?
Median Population Age in Nortonville is 44.6 Years.
What is the Average Family Size in Nortonville
Average Family Size in Nortonville is 3.1 People.
What is the Average Household Size in Nortonville
Average Household Size in Nortonville is 2.3 People.
How Large is the Labor Force in Nortonville?
There are 358 People in the Labor Forcein in Nortonville.
What is the Percentage of People in the Labor Force in Nortonville?
46.8% of People are in the Labor Force in Nortonville.
What is the Unemployment Rate in Nortonville?
Unemployment Rate in Nortonville is 13.4%.