Greenup, KY Map & Demographics
Greenup Map
Greenup Overview
$23,044
PER CAPITA INCOME
$65,179
AVG FAMILY INCOME
$43,036
AVG HOUSEHOLD INCOME
18.9%
WAGE / INCOME GAP [ % ]
81.1¢/ $1
WAGE / INCOME GAP [ $ ]
$5,764
FAMILY INCOME DEFICIT
0.45
INEQUALITY / GINI INDEX
1,068
TOTAL POPULATION
504
MALE POPULATION
564
FEMALE POPULATION
89.36
MALES / 100 FEMALES
111.90
FEMALES / 100 MALES
46.4
MEDIAN AGE
2.9
AVG FAMILY SIZE
2.2
AVG HOUSEHOLD SIZE
430
LABOR FORCE [ PEOPLE ]
44.9%
PERCENT IN LABOR FORCE
7.4%
UNEMPLOYMENT RATE
Greenup Zip Codes
Greenup Area Codes
Income in Greenup
Income Overview in Greenup
Per Capita Income in Greenup is $23,044, while median incomes of families and households are $65,179 and $43,036 respectively.
| Characteristic | Number | Measure |
| Per Capita Income | 1,068 | $23,044 |
| Median Family Income | 261 | $65,179 |
| Mean Family Income | 261 | $73,762 |
| Median Household Income | 433 | $43,036 |
| Mean Household Income | 433 | $54,913 |
| Income Deficit | 261 | $5,764 |
| Wage / Income Gap (%) | 1,068 | 18.89% |
| Wage / Income Gap ($) | 1,068 | 81.11¢ per $1 |
| Gini / Inequality Index | 1,068 | 0.45 |
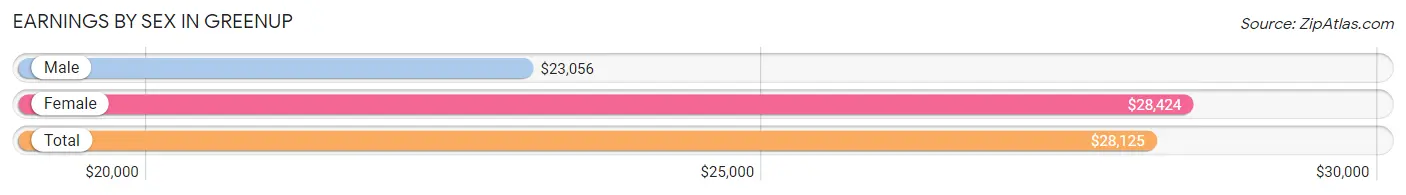
Earnings by Sex in Greenup
Average Earnings in Greenup are $28,125, $23,056 for men and $28,424 for women, a difference of 18.9%.
| Sex | Number | Average Earnings |
| Male | 240 (49.4%) | $23,056 |
| Female | 246 (50.6%) | $28,424 |
| Total | 486 (100.0%) | $28,125 |
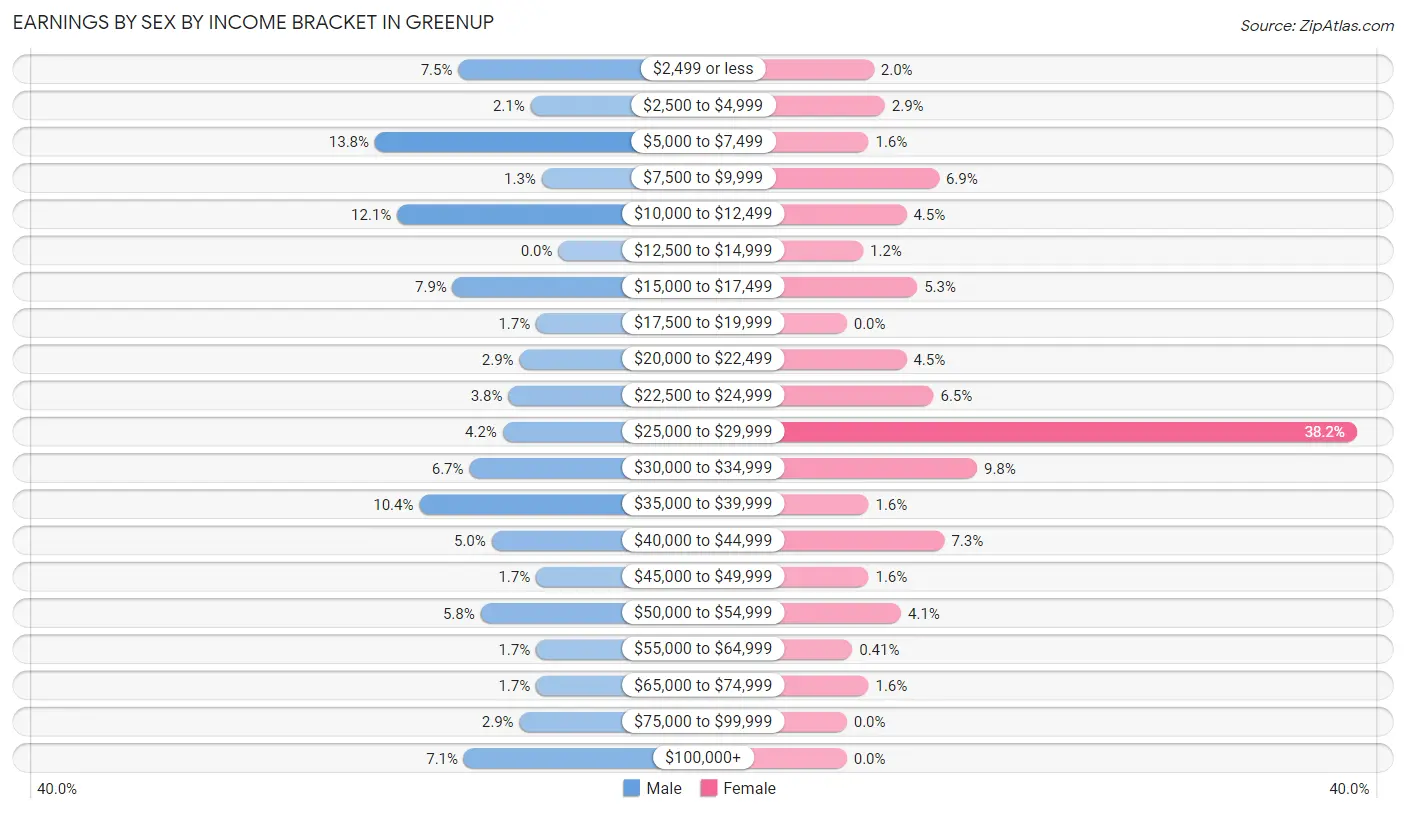
Earnings by Sex by Income Bracket in Greenup
The most common earnings brackets in Greenup are $5,000 to $7,499 for men (33 | 13.8%) and $25,000 to $29,999 for women (94 | 38.2%).
| Income | Male | Female |
| $2,499 or less | 18 (7.5%) | 5 (2.0%) |
| $2,500 to $4,999 | 5 (2.1%) | 7 (2.9%) |
| $5,000 to $7,499 | 33 (13.8%) | 4 (1.6%) |
| $7,500 to $9,999 | 3 (1.3%) | 17 (6.9%) |
| $10,000 to $12,499 | 29 (12.1%) | 11 (4.5%) |
| $12,500 to $14,999 | 0 (0.0%) | 3 (1.2%) |
| $15,000 to $17,499 | 19 (7.9%) | 13 (5.3%) |
| $17,500 to $19,999 | 4 (1.7%) | 0 (0.0%) |
| $20,000 to $22,499 | 7 (2.9%) | 11 (4.5%) |
| $22,500 to $24,999 | 9 (3.7%) | 16 (6.5%) |
| $25,000 to $29,999 | 10 (4.2%) | 94 (38.2%) |
| $30,000 to $34,999 | 16 (6.7%) | 24 (9.8%) |
| $35,000 to $39,999 | 25 (10.4%) | 4 (1.6%) |
| $40,000 to $44,999 | 12 (5.0%) | 18 (7.3%) |
| $45,000 to $49,999 | 4 (1.7%) | 4 (1.6%) |
| $50,000 to $54,999 | 14 (5.8%) | 10 (4.1%) |
| $55,000 to $64,999 | 4 (1.7%) | 1 (0.4%) |
| $65,000 to $74,999 | 4 (1.7%) | 4 (1.6%) |
| $75,000 to $99,999 | 7 (2.9%) | 0 (0.0%) |
| $100,000+ | 17 (7.1%) | 0 (0.0%) |
| Total | 240 (100.0%) | 246 (100.0%) |
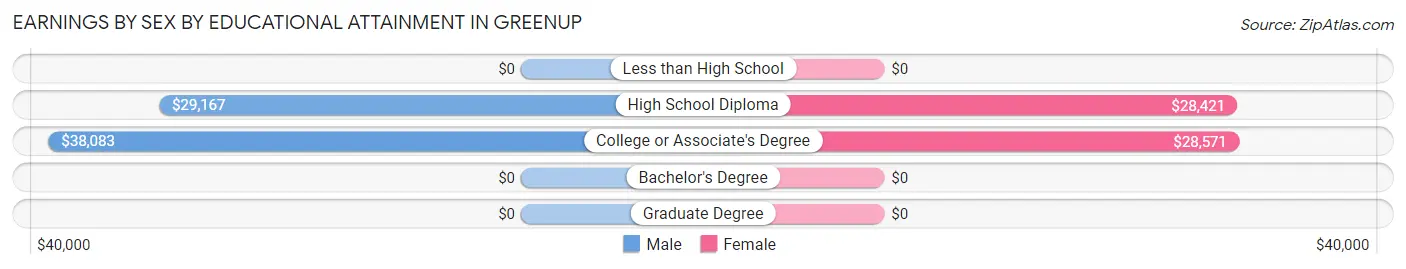
Earnings by Sex by Educational Attainment in Greenup
Average earnings in Greenup are $37,566 for men and $28,614 for women, a difference of 23.8%. Men with an educational attainment of college or associate's degree enjoy the highest average annual earnings of $38,083, while those with high school diploma education earn the least with $29,167. Women with an educational attainment of college or associate's degree earn the most with the average annual earnings of $28,571, while those with high school diploma education have the smallest earnings of $28,421.
| Educational Attainment | Male Income | Female Income |
| Less than High School | - | - |
| High School Diploma | $29,167 | $28,421 |
| College or Associate's Degree | $38,083 | $28,571 |
| Bachelor's Degree | - | - |
| Graduate Degree | - | - |
| Total | $37,566 | $28,614 |
Family Income in Greenup
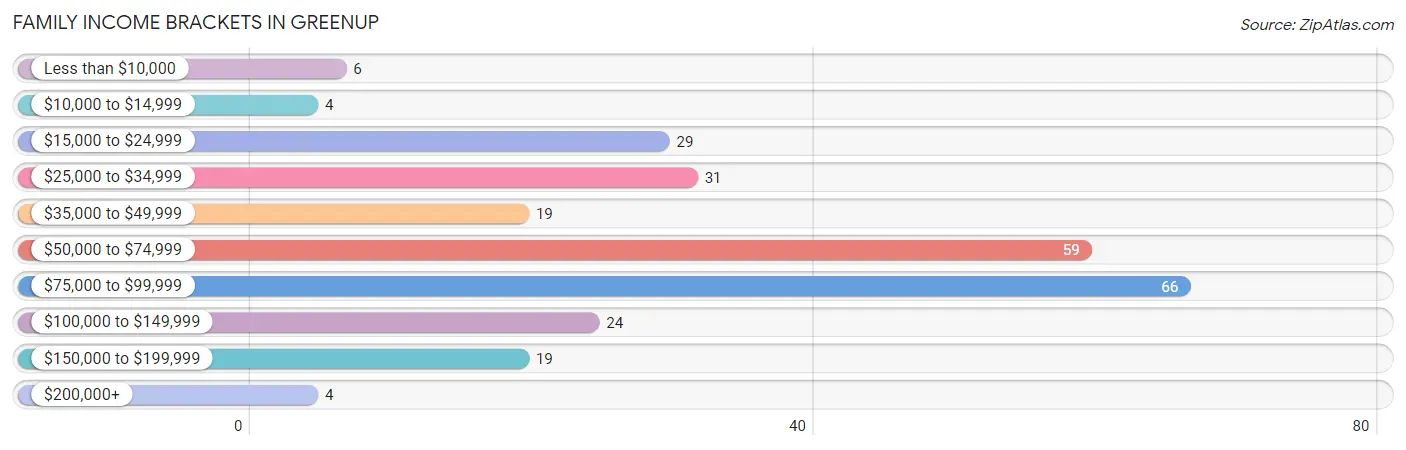
Family Income Brackets in Greenup
According to the Greenup family income data, there are 66 families falling into the $75,000 to $99,999 income range, which is the most common income bracket and makes up 25.3% of all families. Conversely, the $10,000 to $14,999 income bracket is the least frequent group with only 4 families (1.5%) belonging to this category.
| Income Bracket | # Families | % Families |
| Less than $10,000 | 6 | 2.3% |
| $10,000 to $14,999 | 4 | 1.5% |
| $15,000 to $24,999 | 29 | 11.1% |
| $25,000 to $34,999 | 31 | 11.9% |
| $35,000 to $49,999 | 19 | 7.3% |
| $50,000 to $74,999 | 59 | 22.6% |
| $75,000 to $99,999 | 66 | 25.3% |
| $100,000 to $149,999 | 24 | 9.2% |
| $150,000 to $199,999 | 19 | 7.3% |
| $200,000+ | 4 | 1.5% |
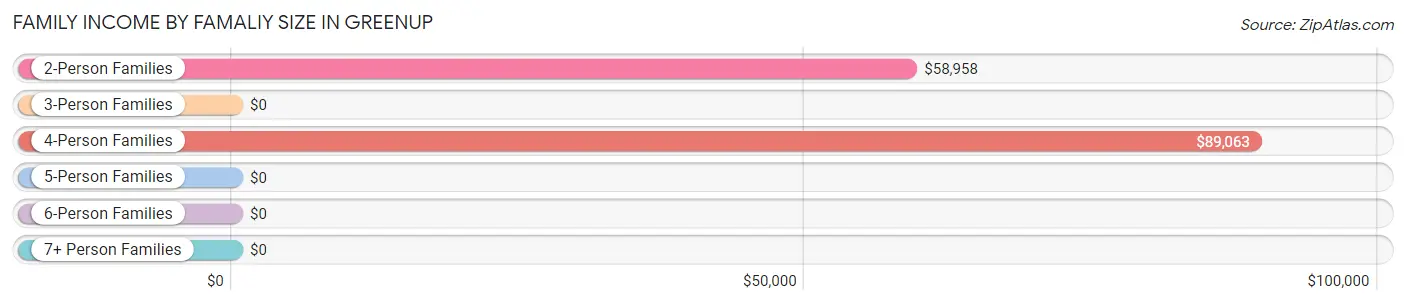
Family Income by Famaliy Size in Greenup
4-person families (49 | 18.8%) account for the highest median family income in Greenup with $89,063 per family, while 2-person families (151 | 57.9%) have the highest median income of $29,479 per family member.
| Income Bracket | # Families | Median Income |
| 2-Person Families | 151 (57.9%) | $58,958 |
| 3-Person Families | 50 (19.2%) | $0 |
| 4-Person Families | 49 (18.8%) | $89,063 |
| 5-Person Families | 4 (1.5%) | $0 |
| 6-Person Families | 0 (0.0%) | $0 |
| 7+ Person Families | 7 (2.7%) | $0 |
| Total | 261 (100.0%) | $65,179 |
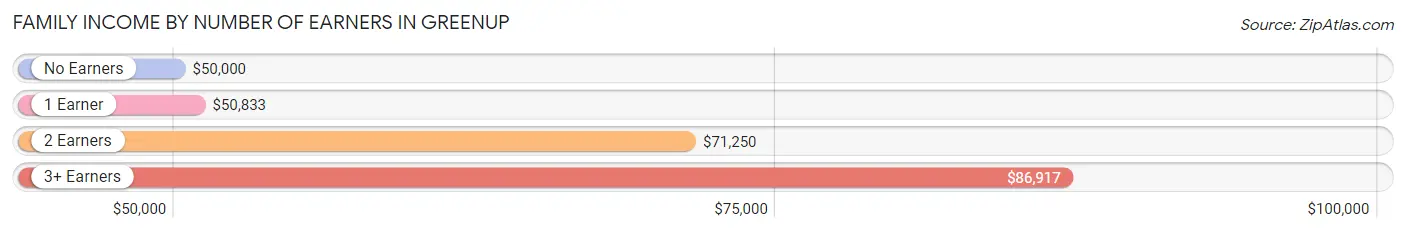
Family Income by Number of Earners in Greenup
The median family income in Greenup is $65,179, with families comprising 3+ earners (46) having the highest median family income of $86,917, while families with no earners (66) have the lowest median family income of $50,000, accounting for 17.6% and 25.3% of families, respectively.
| Number of Earners | # Families | Median Income |
| No Earners | 66 (25.3%) | $50,000 |
| 1 Earner | 96 (36.8%) | $50,833 |
| 2 Earners | 53 (20.3%) | $71,250 |
| 3+ Earners | 46 (17.6%) | $86,917 |
| Total | 261 (100.0%) | $65,179 |
Household Income in Greenup
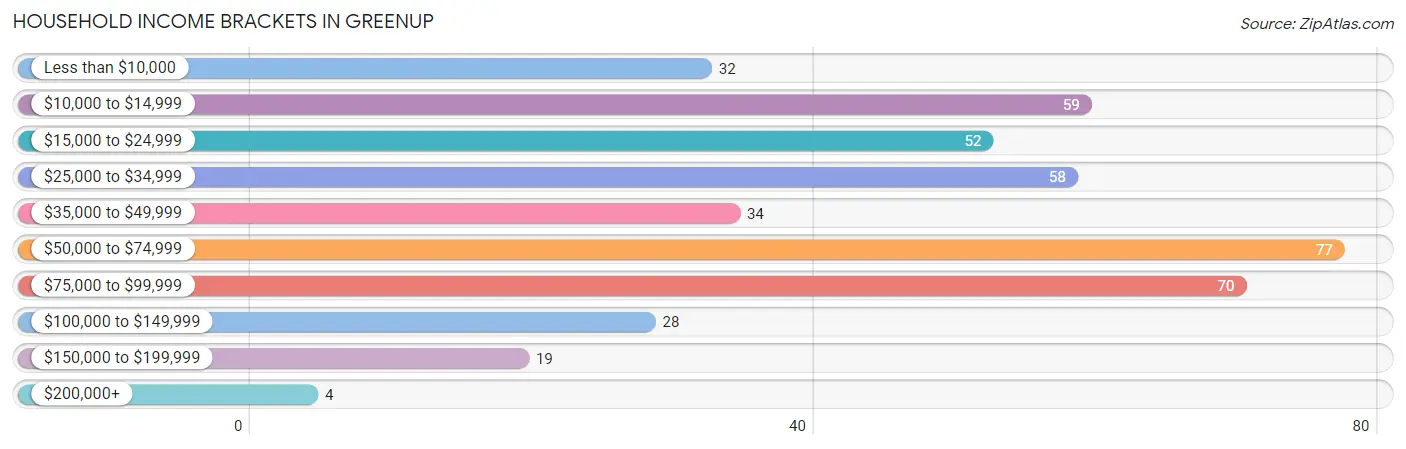
Household Income Brackets in Greenup
With 77 households falling in the category, the $50,000 to $74,999 income range is the most frequent in Greenup, accounting for 17.8% of all households. In contrast, only 4 households (0.9%) fall into the $200,000+ income bracket, making it the least populous group.
| Income Bracket | # Households | % Households |
| Less than $10,000 | 32 | 7.4% |
| $10,000 to $14,999 | 59 | 13.6% |
| $15,000 to $24,999 | 52 | 12.0% |
| $25,000 to $34,999 | 58 | 13.4% |
| $35,000 to $49,999 | 34 | 7.9% |
| $50,000 to $74,999 | 77 | 17.8% |
| $75,000 to $99,999 | 70 | 16.2% |
| $100,000 to $149,999 | 28 | 6.5% |
| $150,000 to $199,999 | 19 | 4.4% |
| $200,000+ | 4 | 0.9% |
Household Income by Householder Age in Greenup
The median household income in Greenup is $43,036, with the highest median household income of $58,958 found in the 25 to 44 years age bracket for the primary householder. A total of 61 households (14.1%) fall into this category. Meanwhile, the 15 to 24 years age bracket for the primary householder has the lowest median household income of $0, with 26 households (6.0%) in this group.
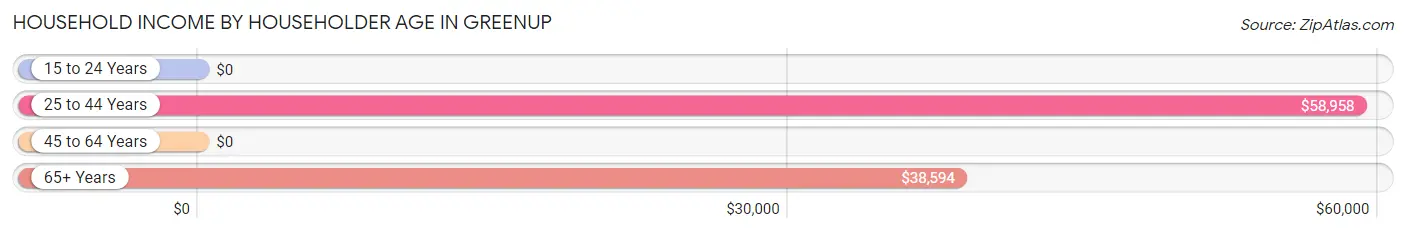
| Income Bracket | # Households | Median Income |
| 15 to 24 Years | 26 (6.0%) | $0 |
| 25 to 44 Years | 61 (14.1%) | $58,958 |
| 45 to 64 Years | 173 (40.0%) | $0 |
| 65+ Years | 173 (40.0%) | $38,594 |
| Total | 433 (100.0%) | $43,036 |
Poverty in Greenup
Income Below Poverty by Sex and Age in Greenup
With 27.5% poverty level for males and 23.4% for females among the residents of Greenup, under 5 year old males and 6 to 11 year old females are the most vulnerable to poverty, with 31 males (91.2%) and 14 females (100.0%) in their respective age groups living below the poverty level.
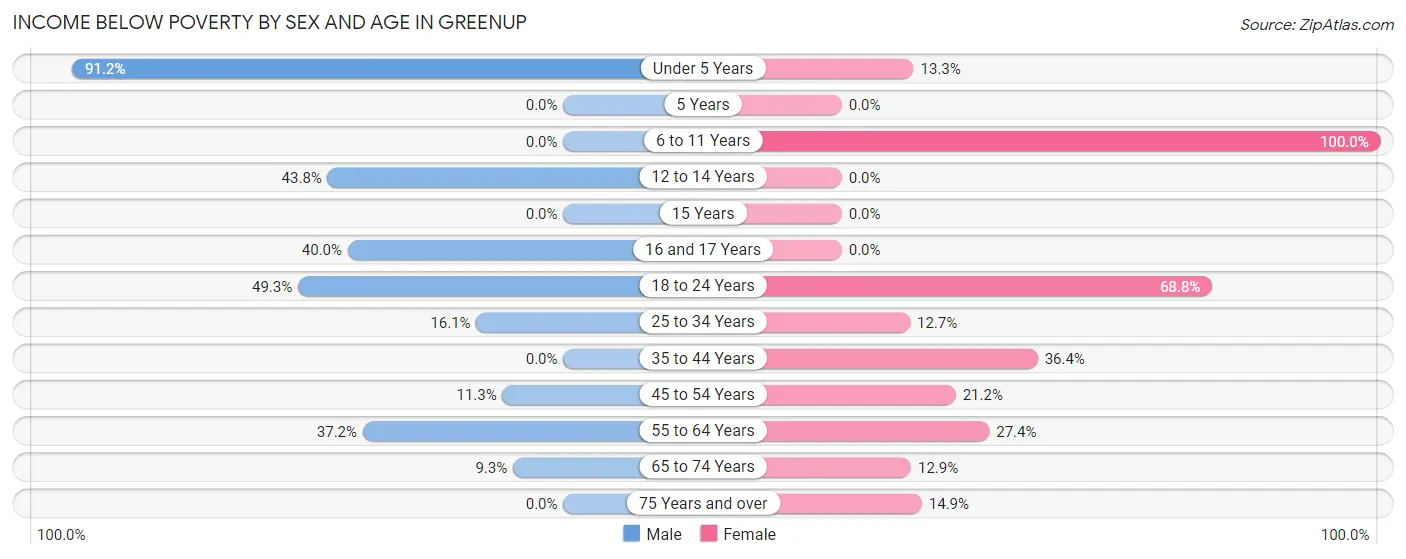
| Age Bracket | Male | Female |
| Under 5 Years | 31 (91.2%) | 2 (13.3%) |
| 5 Years | 0 (0.0%) | 0 (0.0%) |
| 6 to 11 Years | 0 (0.0%) | 14 (100.0%) |
| 12 to 14 Years | 7 (43.8%) | 0 (0.0%) |
| 15 Years | 0 (0.0%) | 0 (0.0%) |
| 16 and 17 Years | 6 (40.0%) | 0 (0.0%) |
| 18 to 24 Years | 33 (49.2%) | 22 (68.8%) |
| 25 to 34 Years | 5 (16.1%) | 10 (12.7%) |
| 35 to 44 Years | 0 (0.0%) | 12 (36.4%) |
| 45 to 54 Years | 7 (11.3%) | 22 (21.1%) |
| 55 to 64 Years | 16 (37.2%) | 23 (27.4%) |
| 65 to 74 Years | 7 (9.3%) | 9 (12.9%) |
| 75 Years and over | 0 (0.0%) | 11 (14.9%) |
| Total | 112 (27.5%) | 125 (23.4%) |
Income Above Poverty by Sex and Age in Greenup
According to the poverty statistics in Greenup, males aged 15 years and females aged 5 years are the age groups that are most secure financially, with 100.0% of males and 100.0% of females in these age groups living above the poverty line.
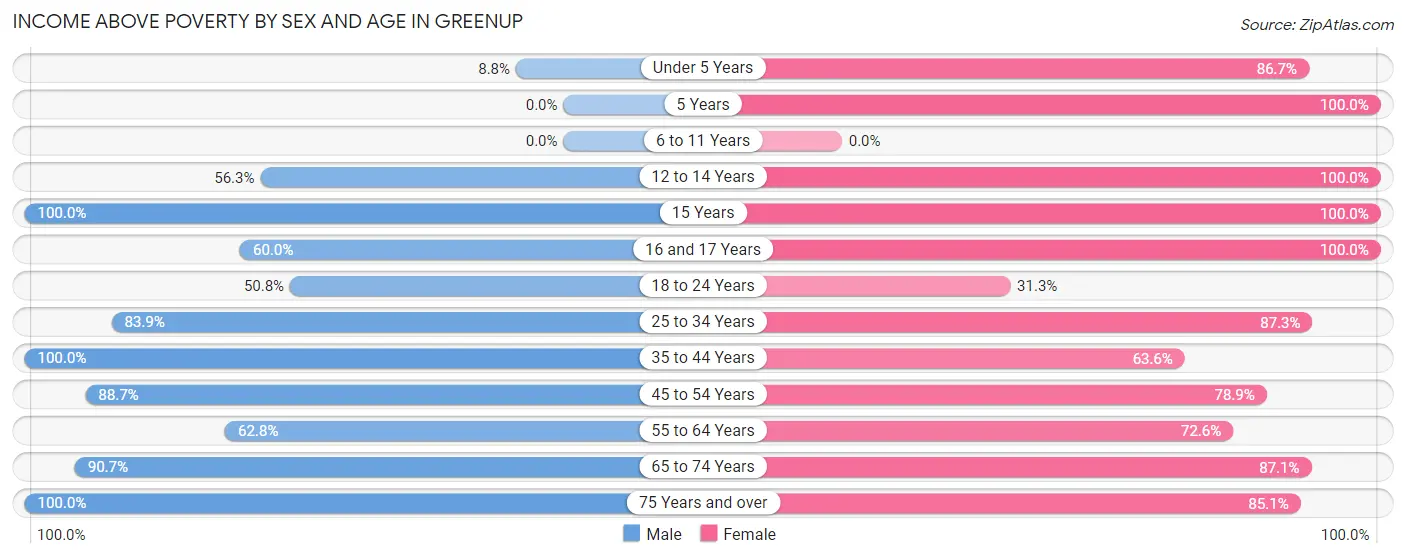
| Age Bracket | Male | Female |
| Under 5 Years | 3 (8.8%) | 13 (86.7%) |
| 5 Years | 0 (0.0%) | 6 (100.0%) |
| 6 to 11 Years | 0 (0.0%) | 0 (0.0%) |
| 12 to 14 Years | 9 (56.2%) | 3 (100.0%) |
| 15 Years | 8 (100.0%) | 15 (100.0%) |
| 16 and 17 Years | 9 (60.0%) | 5 (100.0%) |
| 18 to 24 Years | 34 (50.7%) | 10 (31.2%) |
| 25 to 34 Years | 26 (83.9%) | 69 (87.3%) |
| 35 to 44 Years | 37 (100.0%) | 21 (63.6%) |
| 45 to 54 Years | 55 (88.7%) | 82 (78.8%) |
| 55 to 64 Years | 27 (62.8%) | 61 (72.6%) |
| 65 to 74 Years | 68 (90.7%) | 61 (87.1%) |
| 75 Years and over | 20 (100.0%) | 63 (85.1%) |
| Total | 296 (72.6%) | 409 (76.6%) |
Income Below Poverty Among Married-Couple Families in Greenup
The poverty statistics for married-couple families in Greenup show that 10.7% or 21 of the total 197 families live below the poverty line. Families with 5 or more children have the highest poverty rate of 100.0%, comprising of 7 families. On the other hand, families with no children have the lowest poverty rate of 5.1%, which includes 7 families.
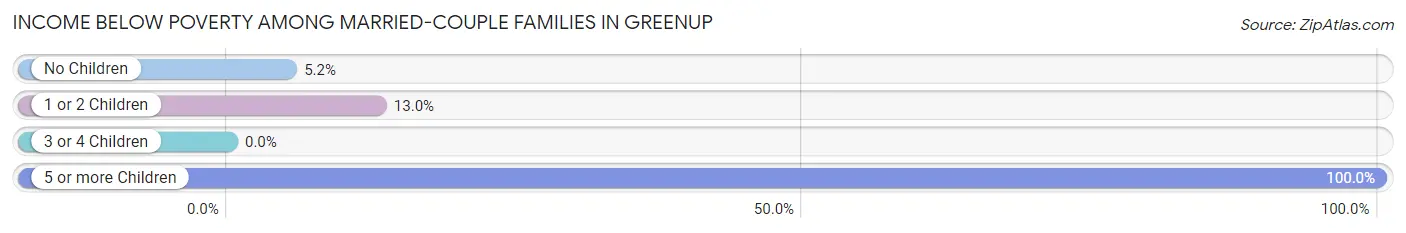
| Children | Above Poverty | Below Poverty |
| No Children | 129 (94.9%) | 7 (5.1%) |
| 1 or 2 Children | 47 (87.0%) | 7 (13.0%) |
| 3 or 4 Children | 0 (0.0%) | 0 (0.0%) |
| 5 or more Children | 0 (0.0%) | 7 (100.0%) |
| Total | 176 (89.3%) | 21 (10.7%) |
Income Below Poverty Among Single-Parent Households in Greenup
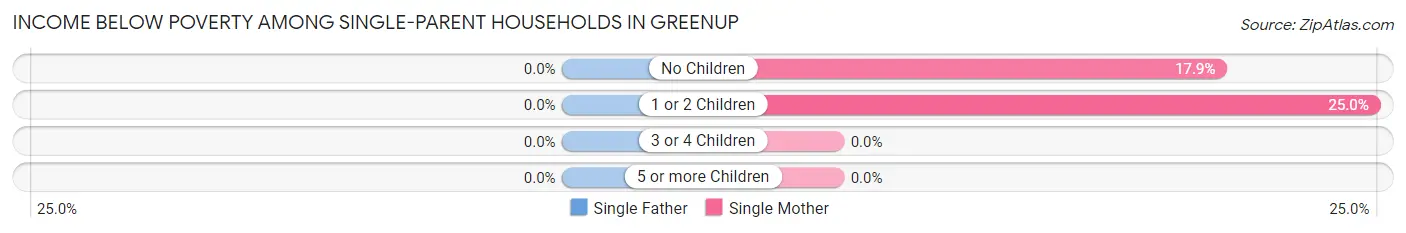
| Children | Single Father | Single Mother |
| No Children | 0 (0.0%) | 10 (17.9%) |
| 1 or 2 Children | 0 (0.0%) | 2 (25.0%) |
| 3 or 4 Children | 0 (0.0%) | 0 (0.0%) |
| 5 or more Children | 0 (0.0%) | 0 (0.0%) |
| Total | 0 (0.0%) | 12 (18.8%) |
Income Below Poverty Among Married-Couple vs Single-Parent Households in Greenup
The poverty data for Greenup shows that 21 of the married-couple family households (10.7%) and 12 of the single-parent households (18.8%) are living below the poverty level. Within the married-couple family households, those with 5 or more children have the highest poverty rate, with 7 households (100.0%) falling below the poverty line. Among the single-parent households, those with 1 or 2 children have the highest poverty rate, with 2 household (25.0%) living below poverty.
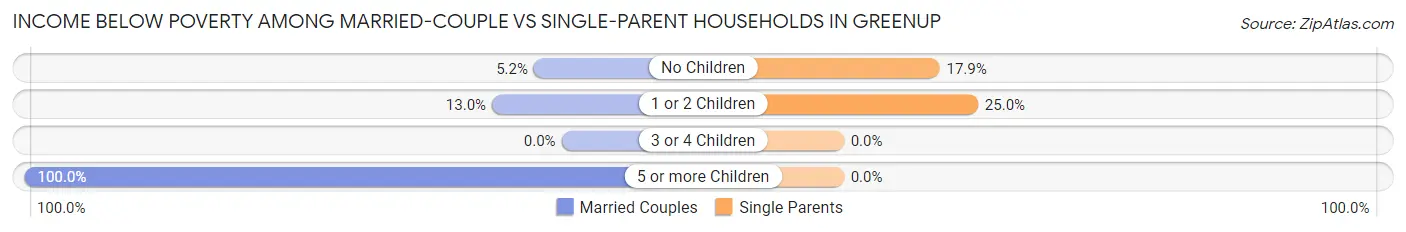
| Children | Married-Couple Families | Single-Parent Households |
| No Children | 7 (5.1%) | 10 (17.9%) |
| 1 or 2 Children | 7 (13.0%) | 2 (25.0%) |
| 3 or 4 Children | 0 (0.0%) | 0 (0.0%) |
| 5 or more Children | 7 (100.0%) | 0 (0.0%) |
| Total | 21 (10.7%) | 12 (18.8%) |
Race in Greenup
The most populous races in Greenup are White / Caucasian (949 | 88.9%), Black / African American (90 | 8.4%), and Hispanic or Latino (81 | 7.6%).
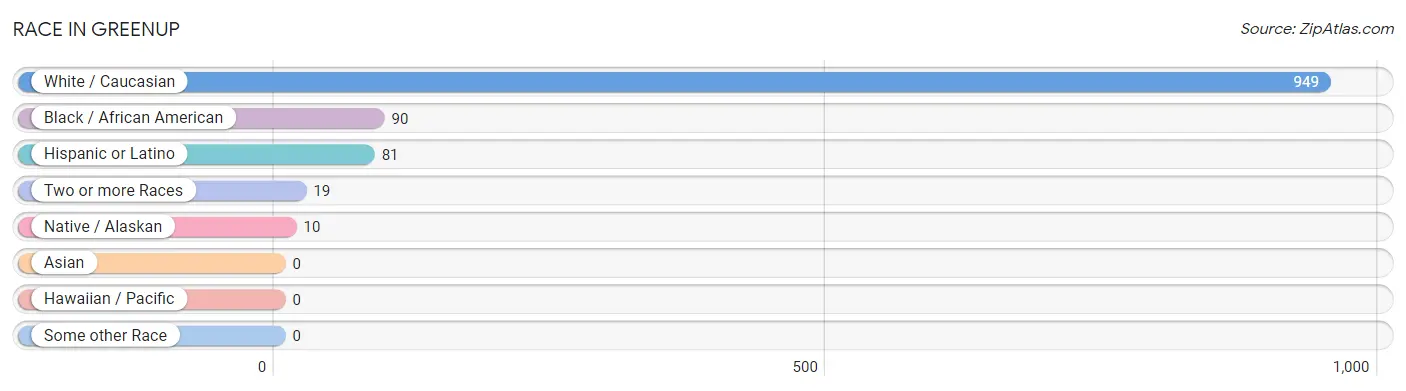
| Race | # Population | % Population |
| Asian | 0 | 0.0% |
| Black / African American | 90 | 8.4% |
| Hawaiian / Pacific | 0 | 0.0% |
| Hispanic or Latino | 81 | 7.6% |
| Native / Alaskan | 10 | 0.9% |
| White / Caucasian | 949 | 88.9% |
| Two or more Races | 19 | 1.8% |
| Some other Race | 0 | 0.0% |
| Total | 1,068 | 100.0% |
Ancestry in Greenup
The most populous ancestries reported in Greenup are English (298 | 27.9%), American (149 | 14.0%), Irish (105 | 9.8%), Mexican (81 | 7.6%), and German (46 | 4.3%), together accounting for 63.6% of all Greenup residents.
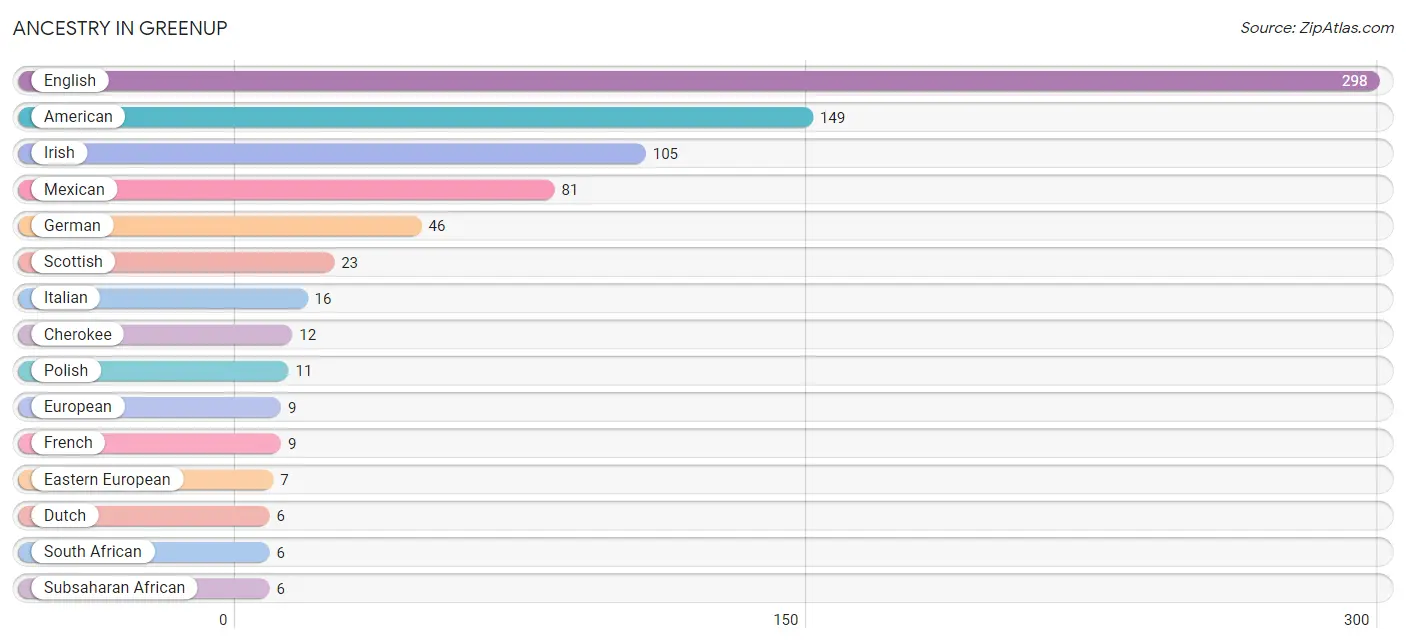
| Ancestry | # Population | % Population |
| American | 149 | 14.0% |
| Cherokee | 12 | 1.1% |
| Dutch | 6 | 0.6% |
| Eastern European | 7 | 0.7% |
| English | 298 | 27.9% |
| European | 9 | 0.8% |
| French | 9 | 0.8% |
| German | 46 | 4.3% |
| Irish | 105 | 9.8% |
| Italian | 16 | 1.5% |
| Mexican | 81 | 7.6% |
| Polish | 11 | 1.0% |
| Scottish | 23 | 2.1% |
| South African | 6 | 0.6% |
| Subsaharan African | 6 | 0.6% |
| Swedish | 4 | 0.4% |
| Welsh | 4 | 0.4% | View All 17 Rows |
Immigrants in Greenup
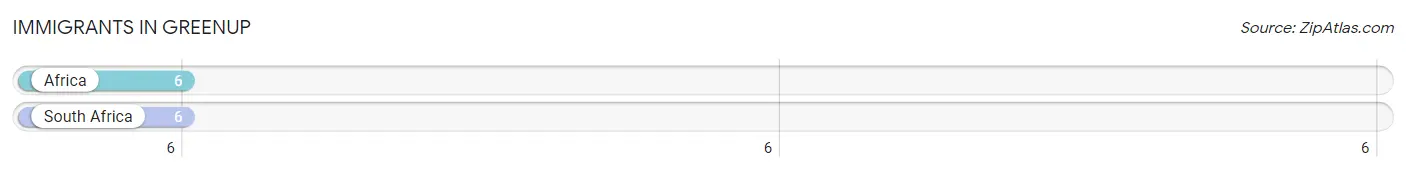
The most numerous immigrant groups reported in Greenup came from Africa (6 | 0.6%), and South Africa (6 | 0.6%), together accounting for 1.1% of all Greenup residents.
| Immigration Origin | # Population | % Population |
| Africa | 6 | 0.6% |
| South Africa | 6 | 0.6% | View All 2 Rows |
Sex and Age in Greenup
Sex and Age in Greenup
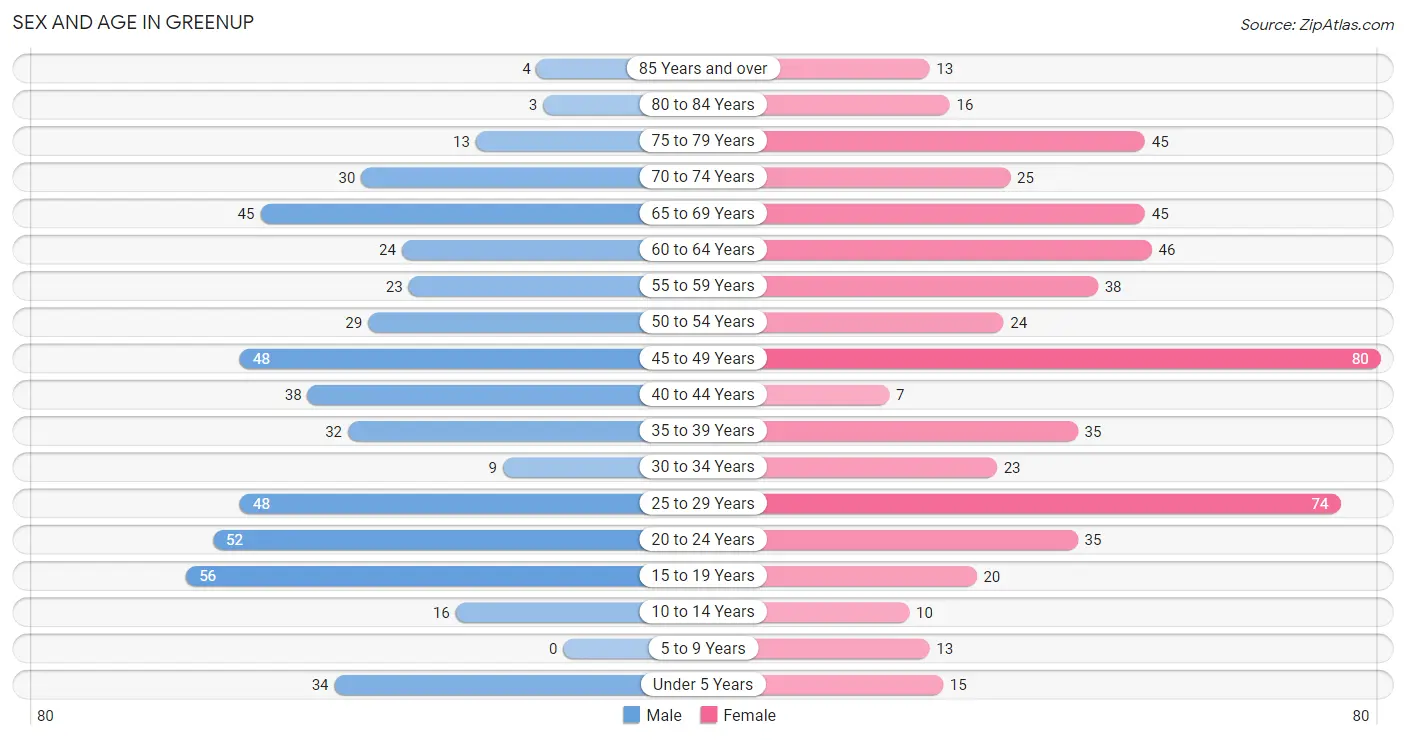
The most populous age groups in Greenup are 15 to 19 Years (56 | 11.1%) for men and 45 to 49 Years (80 | 14.2%) for women.
| Age Bracket | Male | Female |
| Under 5 Years | 34 (6.8%) | 15 (2.7%) |
| 5 to 9 Years | 0 (0.0%) | 13 (2.3%) |
| 10 to 14 Years | 16 (3.2%) | 10 (1.8%) |
| 15 to 19 Years | 56 (11.1%) | 20 (3.5%) |
| 20 to 24 Years | 52 (10.3%) | 35 (6.2%) |
| 25 to 29 Years | 48 (9.5%) | 74 (13.1%) |
| 30 to 34 Years | 9 (1.8%) | 23 (4.1%) |
| 35 to 39 Years | 32 (6.4%) | 35 (6.2%) |
| 40 to 44 Years | 38 (7.5%) | 7 (1.2%) |
| 45 to 49 Years | 48 (9.5%) | 80 (14.2%) |
| 50 to 54 Years | 29 (5.8%) | 24 (4.3%) |
| 55 to 59 Years | 23 (4.6%) | 38 (6.7%) |
| 60 to 64 Years | 24 (4.8%) | 46 (8.2%) |
| 65 to 69 Years | 45 (8.9%) | 45 (8.0%) |
| 70 to 74 Years | 30 (5.9%) | 25 (4.4%) |
| 75 to 79 Years | 13 (2.6%) | 45 (8.0%) |
| 80 to 84 Years | 3 (0.6%) | 16 (2.8%) |
| 85 Years and over | 4 (0.8%) | 13 (2.3%) |
| Total | 504 (100.0%) | 564 (100.0%) |
Families and Households in Greenup
Median Family Size in Greenup
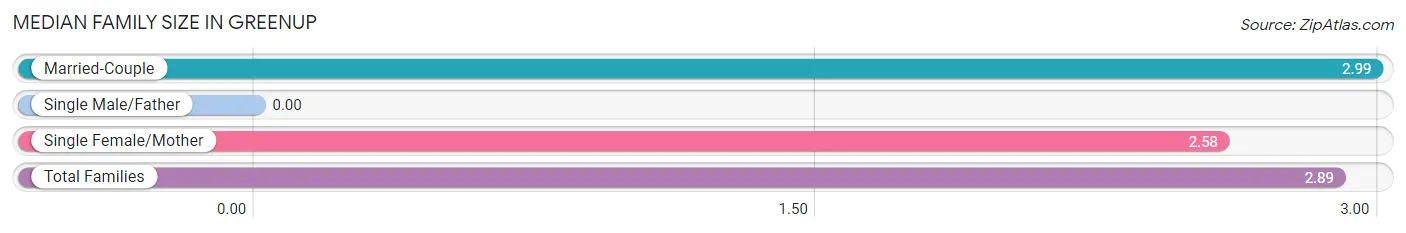
| Family Type | # Families | Family Size |
| Married-Couple | 197 (75.5%) | 2.99 |
| Single Male/Father | 0 (0.0%) | - |
| Single Female/Mother | 64 (24.5%) | 2.58 |
| Total Families | 261 (100.0%) | 2.89 |
Median Household Size in Greenup
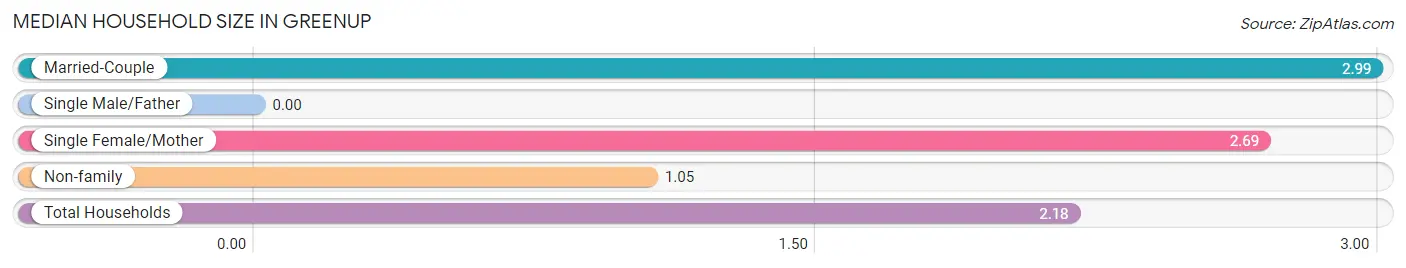
| Household Type | # Households | Household Size |
| Married-Couple | 197 (45.5%) | 2.99 |
| Single Male/Father | 0 (0.0%) | - |
| Single Female/Mother | 64 (14.8%) | 2.69 |
| Non-family | 172 (39.7%) | 1.05 |
| Total Households | 433 (100.0%) | 2.18 |
Household Size by Marriage Status in Greenup
Out of a total of 433 households in Greenup, 261 (60.3%) are family households, while 172 (39.7%) are nonfamily households. The most numerous type of family households are 2-person households, comprising 145, and the most common type of nonfamily households are 1-person households, comprising 161.
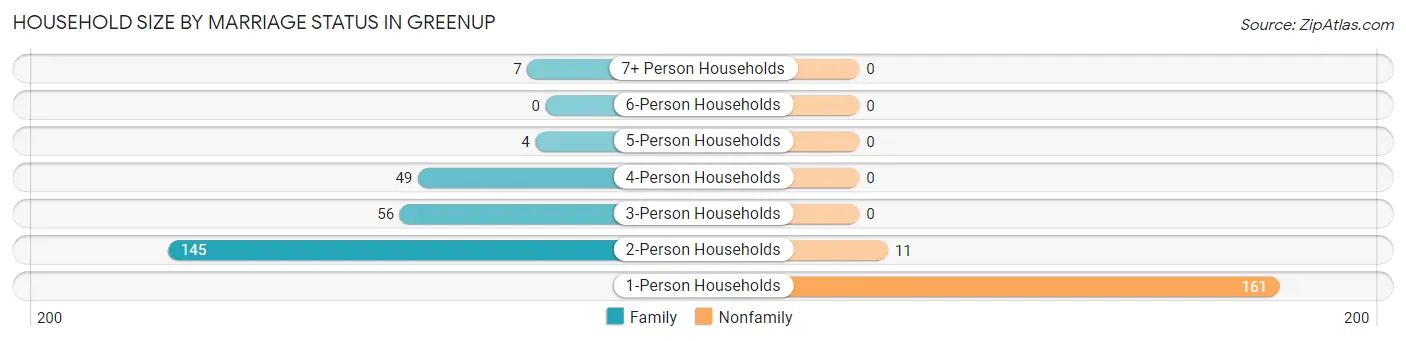
| Household Size | Family Households | Nonfamily Households |
| 1-Person Households | - | 161 (37.2%) |
| 2-Person Households | 145 (33.5%) | 11 (2.5%) |
| 3-Person Households | 56 (12.9%) | 0 (0.0%) |
| 4-Person Households | 49 (11.3%) | 0 (0.0%) |
| 5-Person Households | 4 (0.9%) | 0 (0.0%) |
| 6-Person Households | 0 (0.0%) | 0 (0.0%) |
| 7+ Person Households | 7 (1.6%) | 0 (0.0%) |
| Total | 261 (60.3%) | 172 (39.7%) |
Female Fertility in Greenup
Fertility by Age in Greenup
Average fertility rate in Greenup is 40.0 births per 1,000 women. Women in the age bracket of 20 to 34 years have the highest fertility rate with 83.0 births per 1,000 women. Women in the age bracket of 20 to 34 years acount for 100.0% of all women with births.
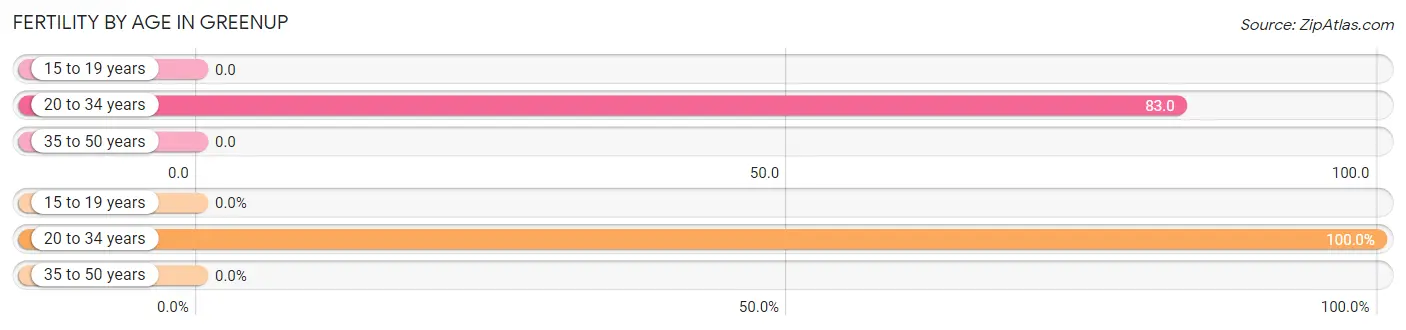
| Age Bracket | Women with Births | Births / 1,000 Women |
| 15 to 19 years | 0 (0.0%) | 0.0 |
| 20 to 34 years | 11 (100.0%) | 83.0 |
| 35 to 50 years | 0 (0.0%) | 0.0 |
| Total | 11 (100.0%) | 40.0 |
Fertility by Age by Marriage Status in Greenup
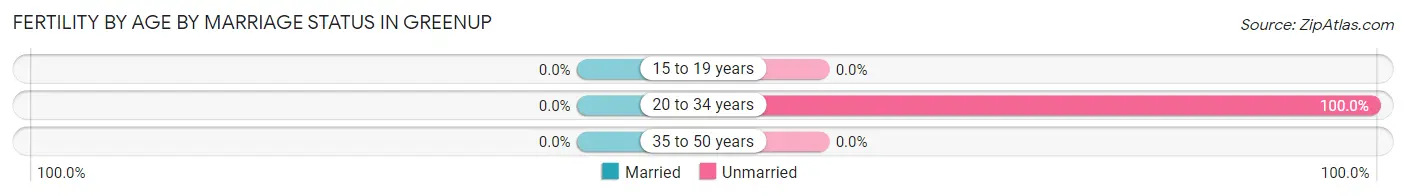
| Age Bracket | Married | Unmarried |
| 15 to 19 years | 0 (0.0%) | 0 (0.0%) |
| 20 to 34 years | 0 (0.0%) | 11 (100.0%) |
| 35 to 50 years | 0 (0.0%) | 0 (0.0%) |
| Total | 0 (0.0%) | 11 (100.0%) |
Fertility by Education in Greenup
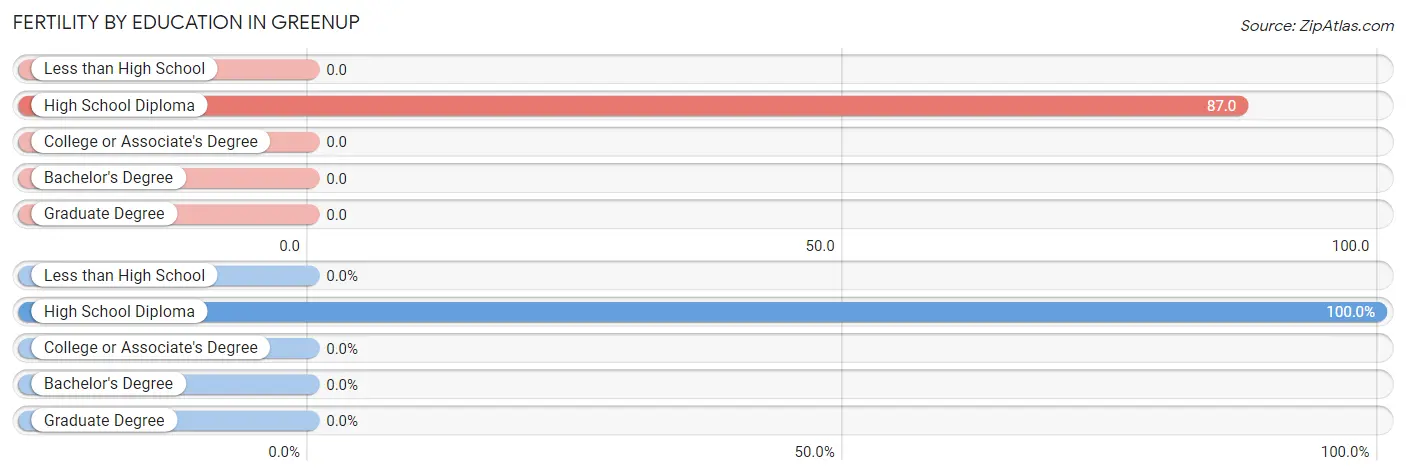
| Educational Attainment | Women with Births | Births / 1,000 Women |
| Less than High School | 0 (0.0%) | 0.0 |
| High School Diploma | 11 (100.0%) | 87.0 |
| College or Associate's Degree | 0 (0.0%) | 0.0 |
| Bachelor's Degree | 0 (0.0%) | 0.0 |
| Graduate Degree | 0 (0.0%) | 0.0 |
| Total | 11 (100.0%) | 40.0 |
Fertility by Education by Marriage Status in Greenup
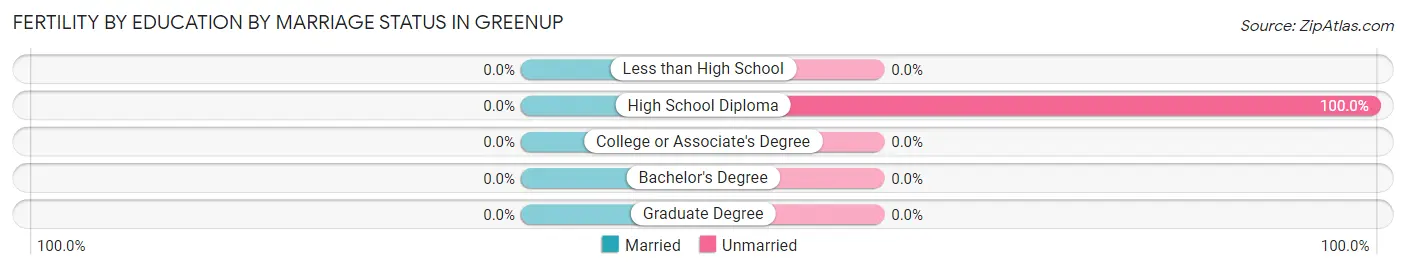
| Educational Attainment | Married | Unmarried |
| Less than High School | 0 (0.0%) | 0 (0.0%) |
| High School Diploma | 0 (0.0%) | 11 (100.0%) |
| College or Associate's Degree | 0 (0.0%) | 0 (0.0%) |
| Bachelor's Degree | 0 (0.0%) | 0 (0.0%) |
| Graduate Degree | 0 (0.0%) | 0 (0.0%) |
| Total | 0 (0.0%) | 11 (100.0%) |
Employment Characteristics in Greenup
Employment by Class of Employer in Greenup
Among the 384 employed individuals in Greenup, private company employees (278 | 72.4%), state government employees (46 | 12.0%), and local government employees (28 | 7.3%) make up the most common classes of employment.
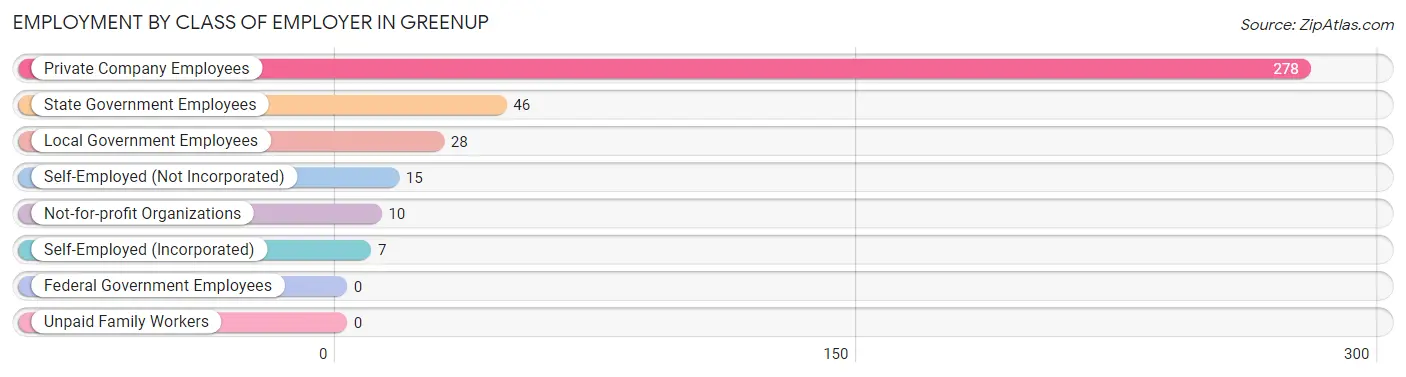
| Employer Class | # Employees | % Employees |
| Private Company Employees | 278 | 72.4% |
| Self-Employed (Incorporated) | 7 | 1.8% |
| Self-Employed (Not Incorporated) | 15 | 3.9% |
| Not-for-profit Organizations | 10 | 2.6% |
| Local Government Employees | 28 | 7.3% |
| State Government Employees | 46 | 12.0% |
| Federal Government Employees | 0 | 0.0% |
| Unpaid Family Workers | 0 | 0.0% |
| Total | 384 | 100.0% |
Employment Status by Age in Greenup
According to the labor force statistics for Greenup, out of the total population over 16 years of age (957), 44.9% or 430 individuals are in the labor force, with 7.4% or 32 of them unemployed. The age group with the highest labor force participation rate is 16 to 19 years, with 79.2% or 42 individuals in the labor force. Within the labor force, the 55 to 59 years age range has the highest percentage of unemployed individuals, with 31.0% or 9 of them being unemployed.
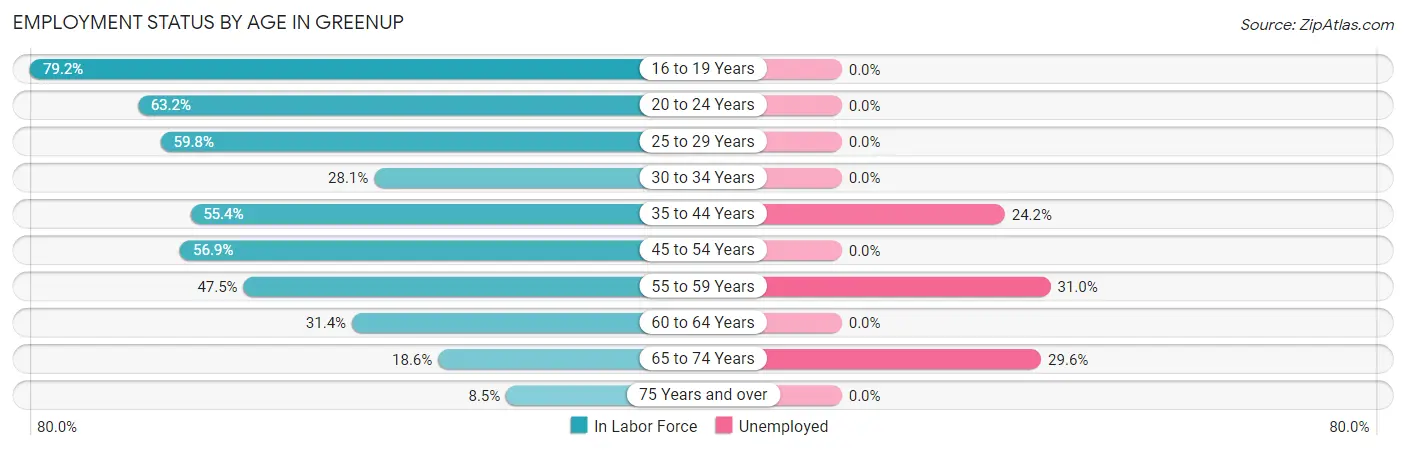
| Age Bracket | In Labor Force | Unemployed |
| 16 to 19 Years | 42 (79.2%) | 0 (0.0%) |
| 20 to 24 Years | 55 (63.2%) | 0 (0.0%) |
| 25 to 29 Years | 73 (59.8%) | 0 (0.0%) |
| 30 to 34 Years | 9 (28.1%) | 0 (0.0%) |
| 35 to 44 Years | 62 (55.4%) | 15 (24.2%) |
| 45 to 54 Years | 103 (56.9%) | 0 (0.0%) |
| 55 to 59 Years | 29 (47.5%) | 9 (31.0%) |
| 60 to 64 Years | 22 (31.4%) | 0 (0.0%) |
| 65 to 74 Years | 27 (18.6%) | 8 (29.6%) |
| 75 Years and over | 8 (8.5%) | 0 (0.0%) |
| Total | 430 (44.9%) | 32 (7.4%) |
Employment Status by Educational Attainment in Greenup
According to labor force statistics for Greenup, 51.6% of individuals (298) out of the total population between 25 and 64 years of age (578) are in the labor force, with 8.1% or 24 of them being unemployed. The group with the highest labor force participation rate are those with the educational attainment of bachelor's degree or higher, with 68.4% or 26 individuals in the labor force. Within the labor force, individuals with bachelor's degree or higher education have the highest percentage of unemployment, with 15.4% or 4 of them being unemployed.
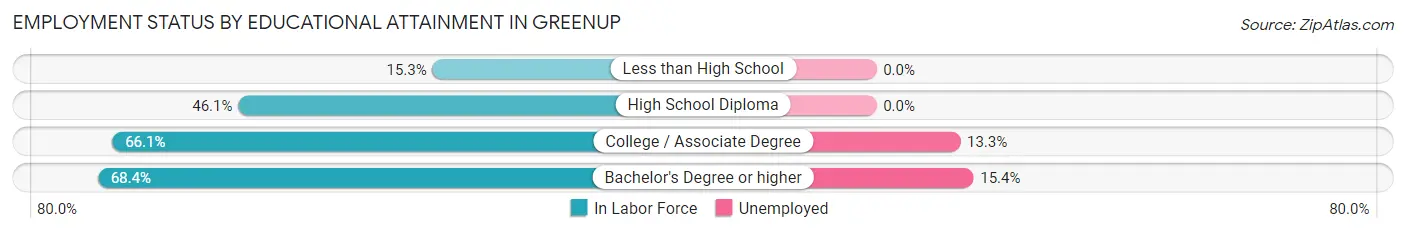
| Educational Attainment | In Labor Force | Unemployed |
| Less than High School | 11 (15.3%) | 0 (0.0%) |
| High School Diploma | 111 (46.1%) | 0 (0.0%) |
| College / Associate Degree | 150 (66.1%) | 30 (13.3%) |
| Bachelor's Degree or higher | 26 (68.4%) | 6 (15.4%) |
| Total | 298 (51.6%) | 47 (8.1%) |
Employment Occupations by Sex in Greenup
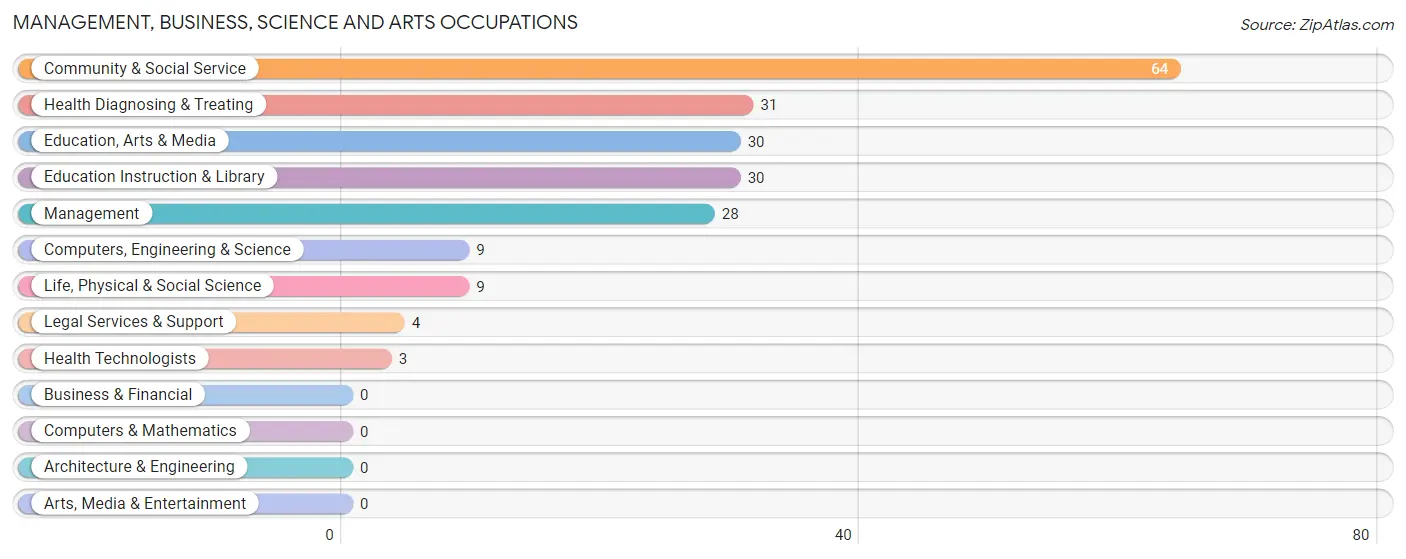
Management, Business, Science and Arts Occupations
The most common Management, Business, Science and Arts occupations in Greenup are Community & Social Service (64 | 16.1%), Health Diagnosing & Treating (31 | 7.8%), Education, Arts & Media (30 | 7.5%), Education Instruction & Library (30 | 7.5%), and Management (28 | 7.0%).
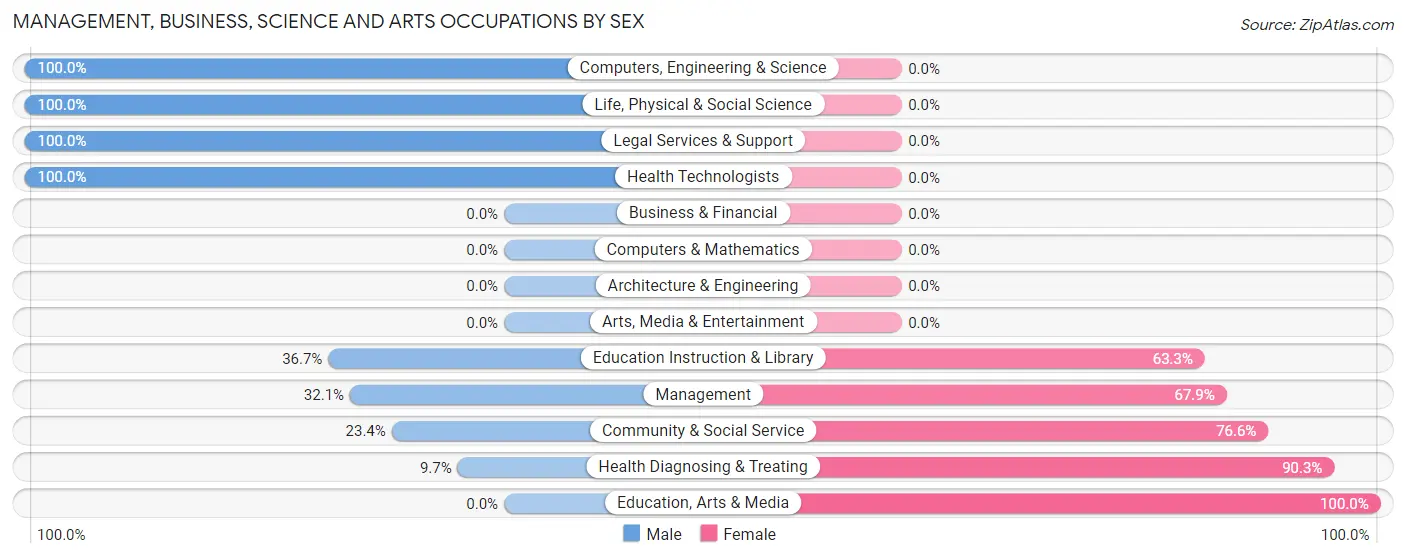
Management, Business, Science and Arts Occupations by Sex
Within the Management, Business, Science and Arts occupations in Greenup, the most male-oriented occupations are Computers, Engineering & Science (100.0%), Life, Physical & Social Science (100.0%), and Legal Services & Support (100.0%), while the most female-oriented occupations are Education, Arts & Media (100.0%), Health Diagnosing & Treating (90.3%), and Community & Social Service (76.6%).
| Occupation | Male | Female |
| Management | 9 (32.1%) | 19 (67.9%) |
| Business & Financial | 0 (0.0%) | 0 (0.0%) |
| Computers, Engineering & Science | 9 (100.0%) | 0 (0.0%) |
| Computers & Mathematics | 0 (0.0%) | 0 (0.0%) |
| Architecture & Engineering | 0 (0.0%) | 0 (0.0%) |
| Life, Physical & Social Science | 9 (100.0%) | 0 (0.0%) |
| Community & Social Service | 15 (23.4%) | 49 (76.6%) |
| Education, Arts & Media | 0 (0.0%) | 30 (100.0%) |
| Legal Services & Support | 4 (100.0%) | 0 (0.0%) |
| Education Instruction & Library | 11 (36.7%) | 19 (63.3%) |
| Arts, Media & Entertainment | 0 (0.0%) | 0 (0.0%) |
| Health Diagnosing & Treating | 3 (9.7%) | 28 (90.3%) |
| Health Technologists | 3 (100.0%) | 0 (0.0%) |
| Total (Category) | 36 (27.3%) | 96 (72.7%) |
| Total (Overall) | 185 (46.5%) | 213 (53.5%) |
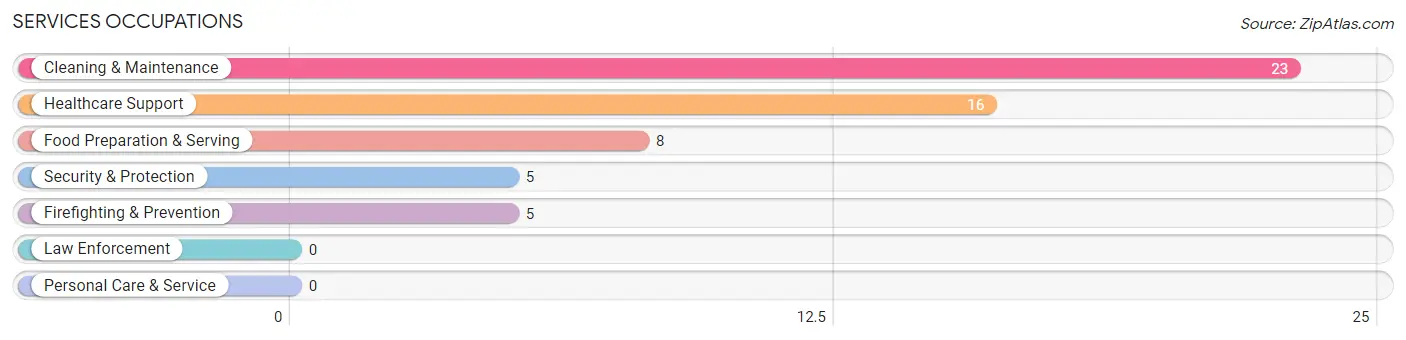
Services Occupations
The most common Services occupations in Greenup are Cleaning & Maintenance (23 | 5.8%), Healthcare Support (16 | 4.0%), Food Preparation & Serving (8 | 2.0%), Security & Protection (5 | 1.3%), and Firefighting & Prevention (5 | 1.3%).
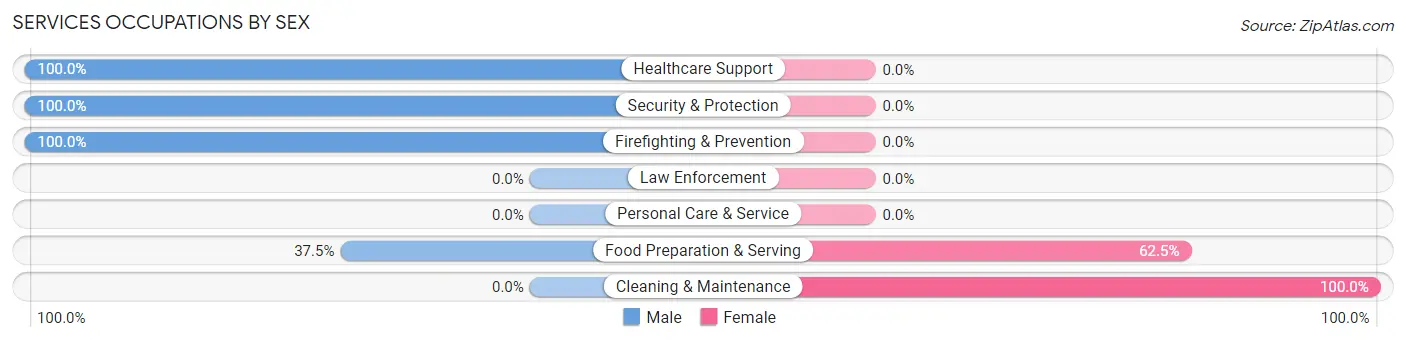
Services Occupations by Sex
Within the Services occupations in Greenup, the most male-oriented occupations are Healthcare Support (100.0%), Security & Protection (100.0%), and Firefighting & Prevention (100.0%), while the most female-oriented occupations are Cleaning & Maintenance (100.0%), and Food Preparation & Serving (62.5%).
| Occupation | Male | Female |
| Healthcare Support | 16 (100.0%) | 0 (0.0%) |
| Security & Protection | 5 (100.0%) | 0 (0.0%) |
| Firefighting & Prevention | 5 (100.0%) | 0 (0.0%) |
| Law Enforcement | 0 (0.0%) | 0 (0.0%) |
| Food Preparation & Serving | 3 (37.5%) | 5 (62.5%) |
| Cleaning & Maintenance | 0 (0.0%) | 23 (100.0%) |
| Personal Care & Service | 0 (0.0%) | 0 (0.0%) |
| Total (Category) | 24 (46.2%) | 28 (53.8%) |
| Total (Overall) | 185 (46.5%) | 213 (53.5%) |
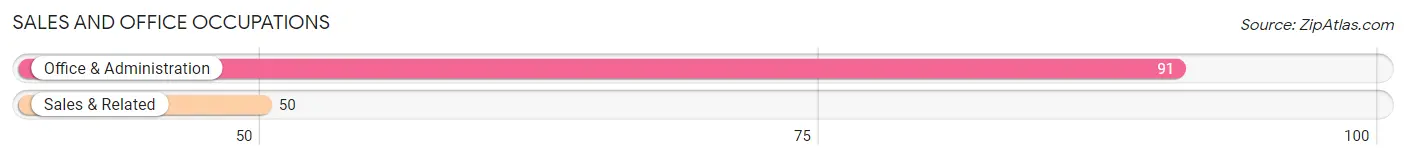
Sales and Office Occupations
The most common Sales and Office occupations in Greenup are Office & Administration (91 | 22.9%), and Sales & Related (50 | 12.6%).
Sales and Office Occupations by Sex
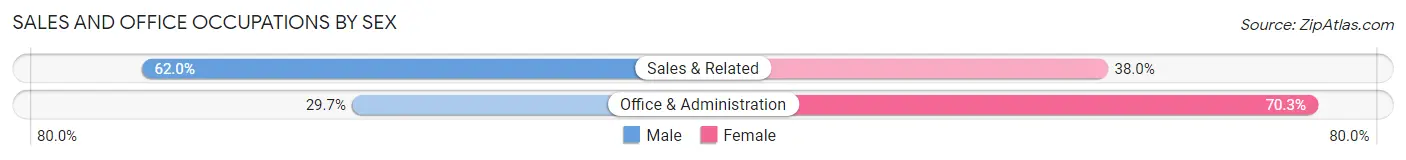
| Occupation | Male | Female |
| Sales & Related | 31 (62.0%) | 19 (38.0%) |
| Office & Administration | 27 (29.7%) | 64 (70.3%) |
| Total (Category) | 58 (41.1%) | 83 (58.9%) |
| Total (Overall) | 185 (46.5%) | 213 (53.5%) |
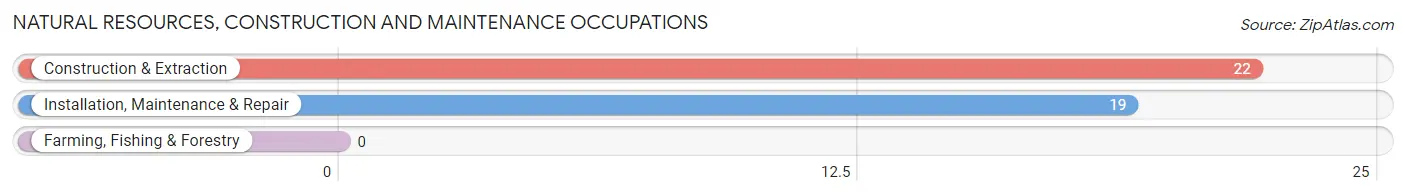
Natural Resources, Construction and Maintenance Occupations
The most common Natural Resources, Construction and Maintenance occupations in Greenup are Construction & Extraction (22 | 5.5%), and Installation, Maintenance & Repair (19 | 4.8%).
Natural Resources, Construction and Maintenance Occupations by Sex
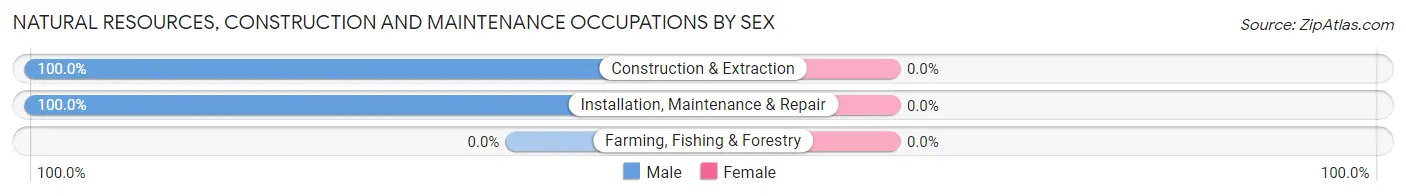
| Occupation | Male | Female |
| Farming, Fishing & Forestry | 0 (0.0%) | 0 (0.0%) |
| Construction & Extraction | 22 (100.0%) | 0 (0.0%) |
| Installation, Maintenance & Repair | 19 (100.0%) | 0 (0.0%) |
| Total (Category) | 41 (100.0%) | 0 (0.0%) |
| Total (Overall) | 185 (46.5%) | 213 (53.5%) |
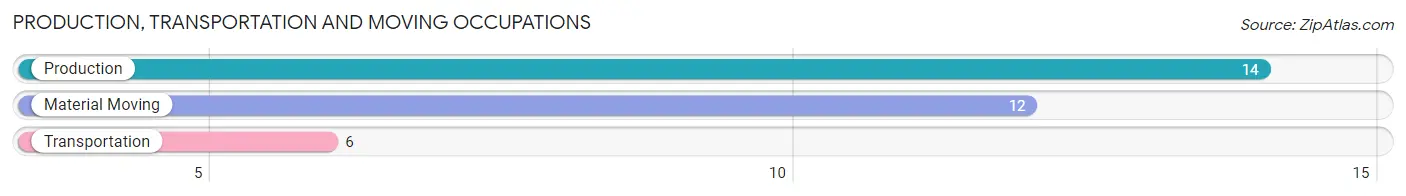
Production, Transportation and Moving Occupations
The most common Production, Transportation and Moving occupations in Greenup are Production (14 | 3.5%), Material Moving (12 | 3.0%), and Transportation (6 | 1.5%).
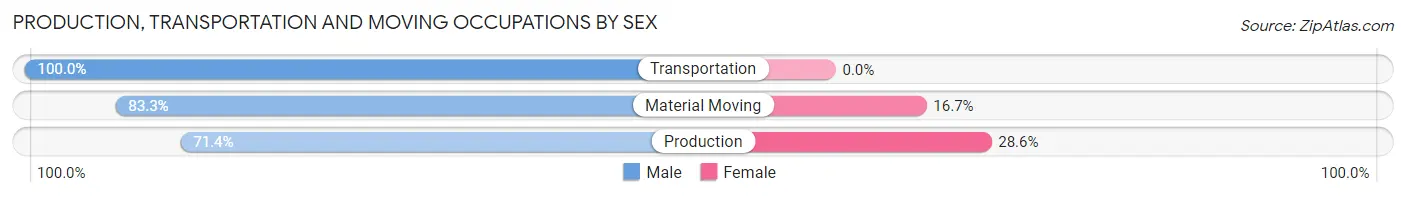
Production, Transportation and Moving Occupations by Sex
| Occupation | Male | Female |
| Production | 10 (71.4%) | 4 (28.6%) |
| Transportation | 6 (100.0%) | 0 (0.0%) |
| Material Moving | 10 (83.3%) | 2 (16.7%) |
| Total (Category) | 26 (81.2%) | 6 (18.8%) |
| Total (Overall) | 185 (46.5%) | 213 (53.5%) |
Employment Industries by Sex in Greenup
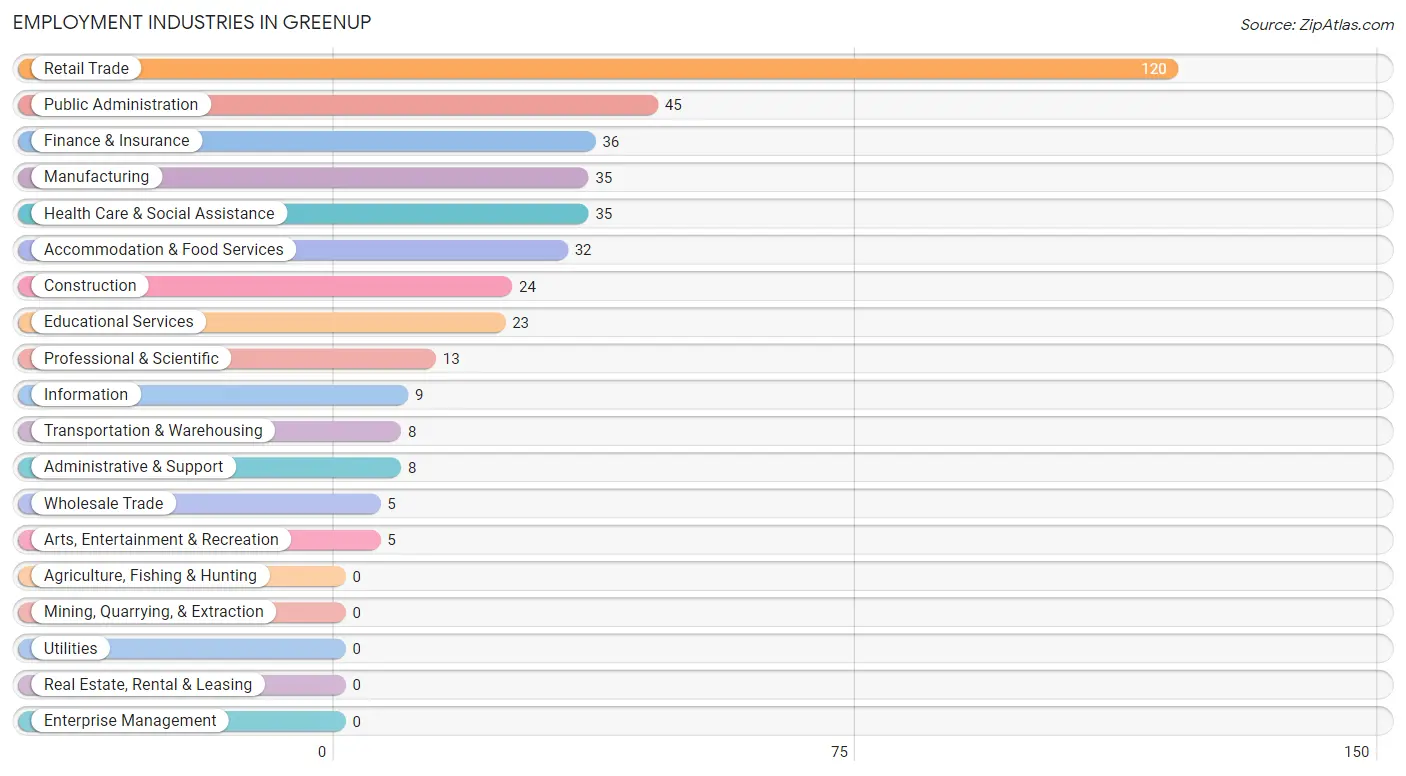
Employment Industries in Greenup
The major employment industries in Greenup include Retail Trade (120 | 30.1%), Public Administration (45 | 11.3%), Finance & Insurance (36 | 9.0%), Manufacturing (35 | 8.8%), and Health Care & Social Assistance (35 | 8.8%).
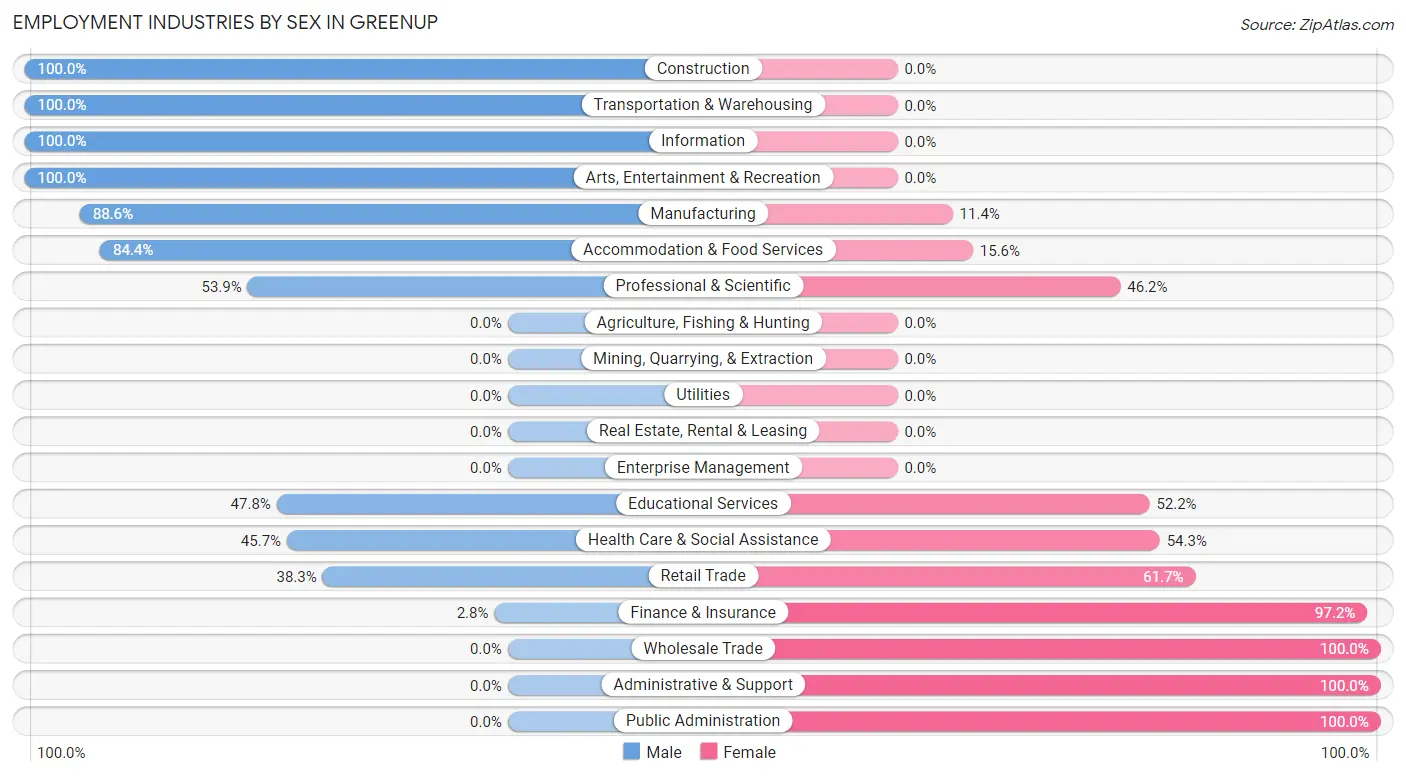
Employment Industries by Sex in Greenup
The Greenup industries that see more men than women are Construction (100.0%), Transportation & Warehousing (100.0%), and Information (100.0%), whereas the industries that tend to have a higher number of women are Wholesale Trade (100.0%), Administrative & Support (100.0%), and Public Administration (100.0%).
| Industry | Male | Female |
| Agriculture, Fishing & Hunting | 0 (0.0%) | 0 (0.0%) |
| Mining, Quarrying, & Extraction | 0 (0.0%) | 0 (0.0%) |
| Construction | 24 (100.0%) | 0 (0.0%) |
| Manufacturing | 31 (88.6%) | 4 (11.4%) |
| Wholesale Trade | 0 (0.0%) | 5 (100.0%) |
| Retail Trade | 46 (38.3%) | 74 (61.7%) |
| Transportation & Warehousing | 8 (100.0%) | 0 (0.0%) |
| Utilities | 0 (0.0%) | 0 (0.0%) |
| Information | 9 (100.0%) | 0 (0.0%) |
| Finance & Insurance | 1 (2.8%) | 35 (97.2%) |
| Real Estate, Rental & Leasing | 0 (0.0%) | 0 (0.0%) |
| Professional & Scientific | 7 (53.8%) | 6 (46.2%) |
| Enterprise Management | 0 (0.0%) | 0 (0.0%) |
| Administrative & Support | 0 (0.0%) | 8 (100.0%) |
| Educational Services | 11 (47.8%) | 12 (52.2%) |
| Health Care & Social Assistance | 16 (45.7%) | 19 (54.3%) |
| Arts, Entertainment & Recreation | 5 (100.0%) | 0 (0.0%) |
| Accommodation & Food Services | 27 (84.4%) | 5 (15.6%) |
| Public Administration | 0 (0.0%) | 45 (100.0%) |
| Total | 185 (46.5%) | 213 (53.5%) |
Education in Greenup
School Enrollment in Greenup
The most common levels of schooling among the 108 students in Greenup are high school (54 | 50.0%), college / undergraduate (25 | 23.2%), and elementary school (14 | 13.0%).
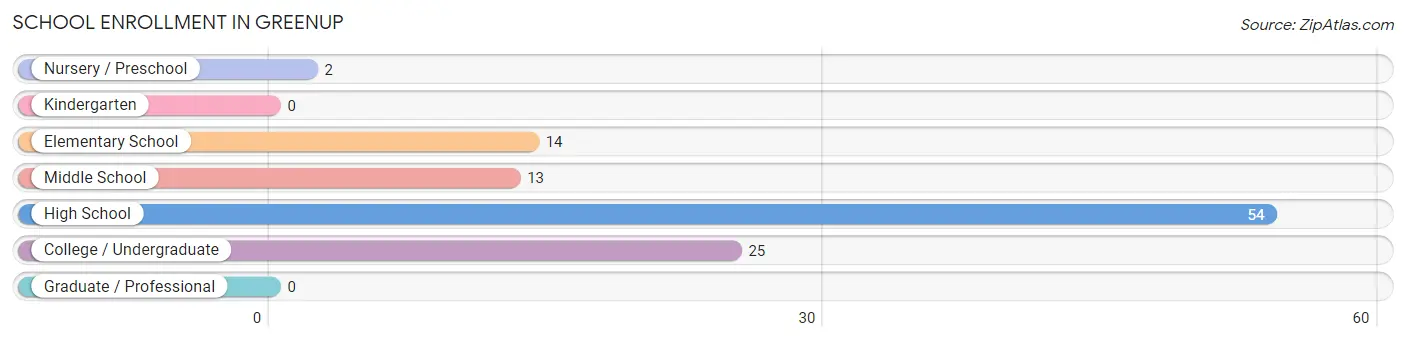
| School Level | # Students | % Students |
| Nursery / Preschool | 2 | 1.8% |
| Kindergarten | 0 | 0.0% |
| Elementary School | 14 | 13.0% |
| Middle School | 13 | 12.0% |
| High School | 54 | 50.0% |
| College / Undergraduate | 25 | 23.2% |
| Graduate / Professional | 0 | 0.0% |
| Total | 108 | 100.0% |
School Enrollment by Age by Funding Source in Greenup
Out of a total of 108 students who are enrolled in schools in Greenup, 11 (10.2%) attend a private institution, while the remaining 97 (89.8%) are enrolled in public schools. The age group of 20 to 24 year olds has the highest likelihood of being enrolled in private schools, with 11 (44.0% in the age bracket) enrolled. Conversely, the age group of 3 to 4 year olds has the lowest likelihood of being enrolled in a private school, with 2 (100.0% in the age bracket) attending a public institution.
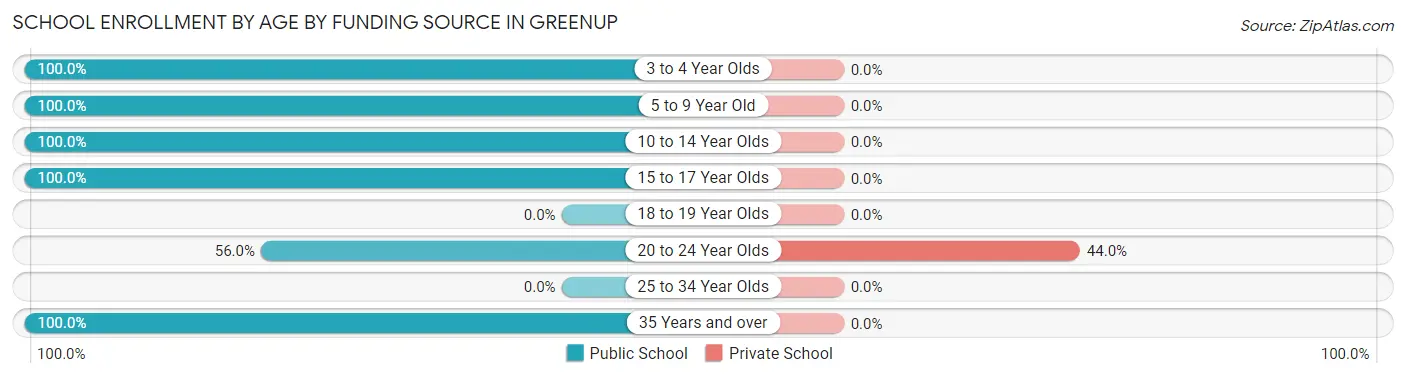
| Age Bracket | Public School | Private School |
| 3 to 4 Year Olds | 2 (100.0%) | 0 (0.0%) |
| 5 to 9 Year Old | 7 (100.0%) | 0 (0.0%) |
| 10 to 14 Year Olds | 26 (100.0%) | 0 (0.0%) |
| 15 to 17 Year Olds | 43 (100.0%) | 0 (0.0%) |
| 18 to 19 Year Olds | 0 (0.0%) | 0 (0.0%) |
| 20 to 24 Year Olds | 14 (56.0%) | 11 (44.0%) |
| 25 to 34 Year Olds | 0 (0.0%) | 0 (0.0%) |
| 35 Years and over | 5 (100.0%) | 0 (0.0%) |
| Total | 97 (89.8%) | 11 (10.2%) |
Educational Attainment by Field of Study in Greenup
Education (26 | 29.2%), business (25 | 28.1%), arts & humanities (16 | 18.0%), science & technology (10 | 11.2%), and communications (8 | 9.0%) are the most common fields of study among 89 individuals in Greenup who have obtained a bachelor's degree or higher.
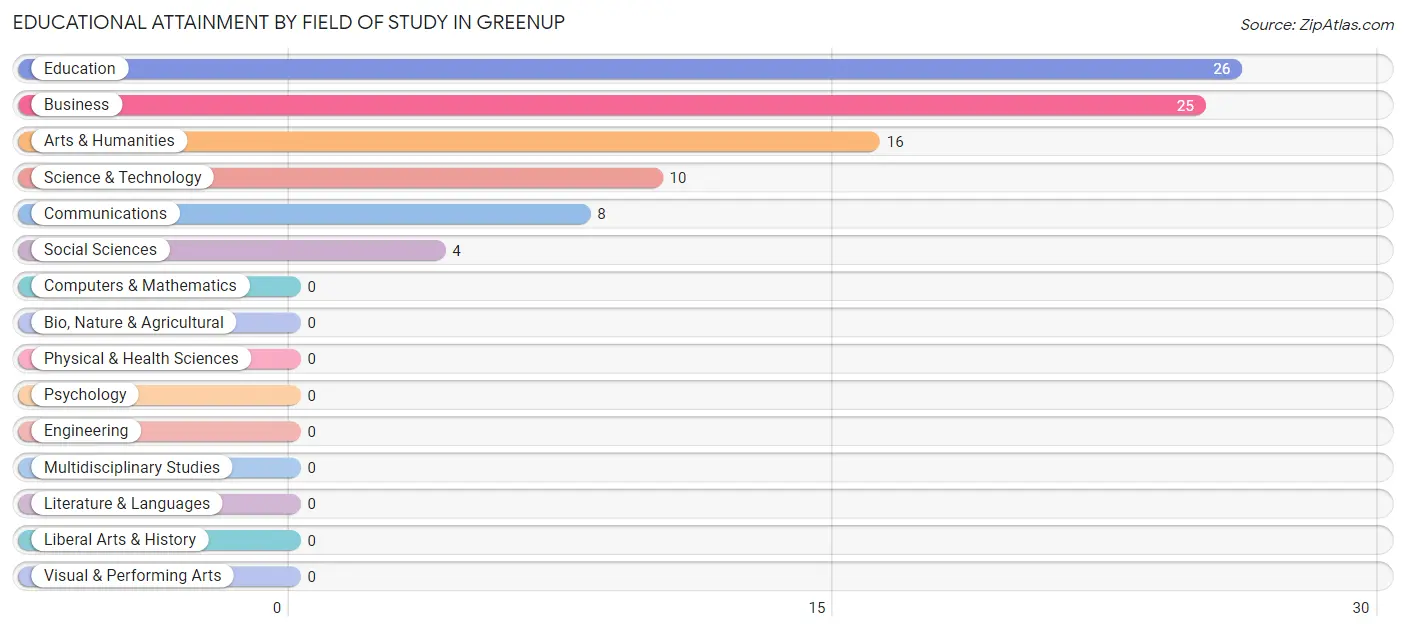
| Field of Study | # Graduates | % Graduates |
| Computers & Mathematics | 0 | 0.0% |
| Bio, Nature & Agricultural | 0 | 0.0% |
| Physical & Health Sciences | 0 | 0.0% |
| Psychology | 0 | 0.0% |
| Social Sciences | 4 | 4.5% |
| Engineering | 0 | 0.0% |
| Multidisciplinary Studies | 0 | 0.0% |
| Science & Technology | 10 | 11.2% |
| Business | 25 | 28.1% |
| Education | 26 | 29.2% |
| Literature & Languages | 0 | 0.0% |
| Liberal Arts & History | 0 | 0.0% |
| Visual & Performing Arts | 0 | 0.0% |
| Communications | 8 | 9.0% |
| Arts & Humanities | 16 | 18.0% |
| Total | 89 | 100.0% |
Transportation & Commute in Greenup
Vehicle Availability by Sex in Greenup
The most prevalent vehicle ownership categories in Greenup are males with 2 vehicles (53, accounting for 29.1%) and females with 2 vehicles (132, making up 26.2%).
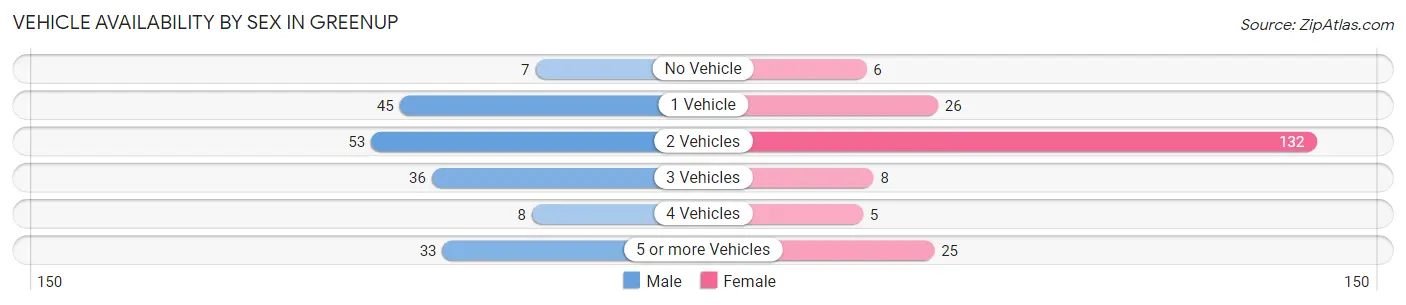
| Vehicles Available | Male | Female |
| No Vehicle | 7 (3.8%) | 6 (3.0%) |
| 1 Vehicle | 45 (24.7%) | 26 (12.9%) |
| 2 Vehicles | 53 (29.1%) | 132 (65.3%) |
| 3 Vehicles | 36 (19.8%) | 8 (4.0%) |
| 4 Vehicles | 8 (4.4%) | 5 (2.5%) |
| 5 or more Vehicles | 33 (18.1%) | 25 (12.4%) |
| Total | 182 (100.0%) | 202 (100.0%) |
Commute Time in Greenup
The most frequently occuring commute durations in Greenup are 25 to 29 minutes (88 commuters, 23.2%), 5 to 9 minutes (79 commuters, 20.8%), and 15 to 19 minutes (65 commuters, 17.1%).
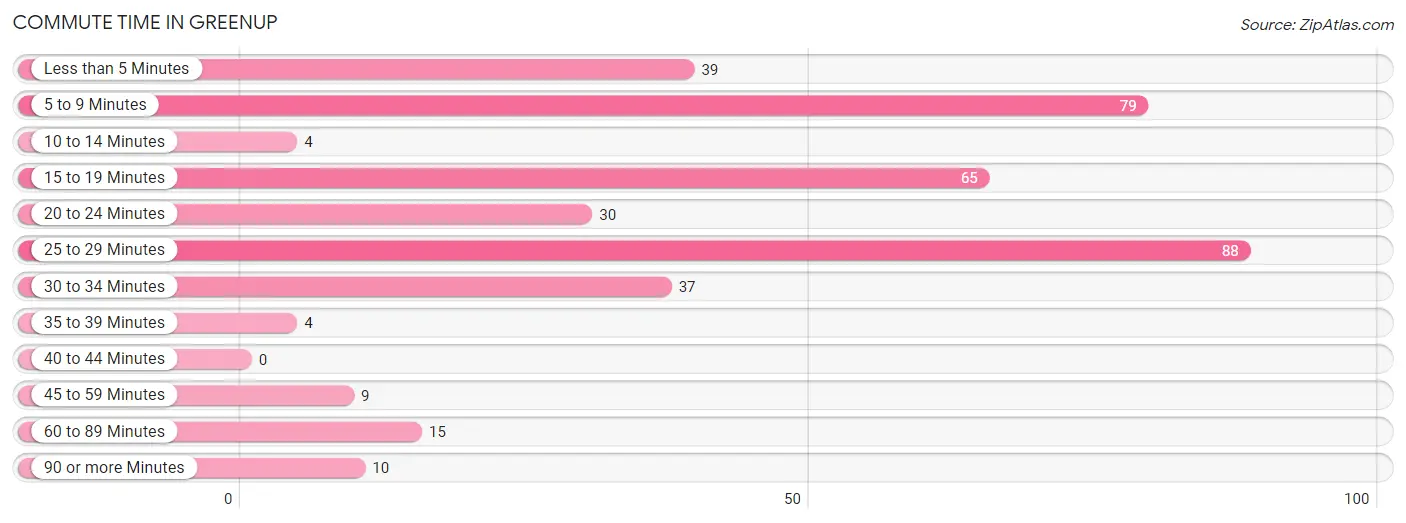
| Commute Time | # Commuters | % Commuters |
| Less than 5 Minutes | 39 | 10.3% |
| 5 to 9 Minutes | 79 | 20.8% |
| 10 to 14 Minutes | 4 | 1.1% |
| 15 to 19 Minutes | 65 | 17.1% |
| 20 to 24 Minutes | 30 | 7.9% |
| 25 to 29 Minutes | 88 | 23.2% |
| 30 to 34 Minutes | 37 | 9.7% |
| 35 to 39 Minutes | 4 | 1.1% |
| 40 to 44 Minutes | 0 | 0.0% |
| 45 to 59 Minutes | 9 | 2.4% |
| 60 to 89 Minutes | 15 | 4.0% |
| 90 or more Minutes | 10 | 2.6% |
Commute Time by Sex in Greenup
The most common commute times in Greenup are 5 to 9 minutes (56 commuters, 30.8%) for males and 25 to 29 minutes (77 commuters, 38.9%) for females.
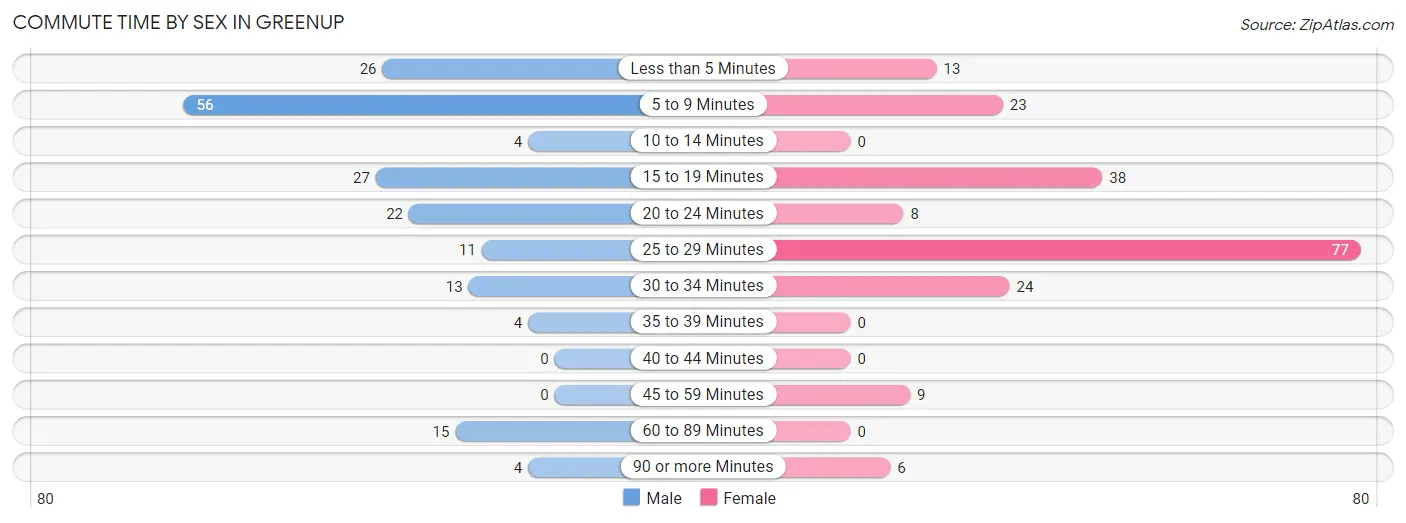
| Commute Time | Male | Female |
| Less than 5 Minutes | 26 (14.3%) | 13 (6.6%) |
| 5 to 9 Minutes | 56 (30.8%) | 23 (11.6%) |
| 10 to 14 Minutes | 4 (2.2%) | 0 (0.0%) |
| 15 to 19 Minutes | 27 (14.8%) | 38 (19.2%) |
| 20 to 24 Minutes | 22 (12.1%) | 8 (4.0%) |
| 25 to 29 Minutes | 11 (6.0%) | 77 (38.9%) |
| 30 to 34 Minutes | 13 (7.1%) | 24 (12.1%) |
| 35 to 39 Minutes | 4 (2.2%) | 0 (0.0%) |
| 40 to 44 Minutes | 0 (0.0%) | 0 (0.0%) |
| 45 to 59 Minutes | 0 (0.0%) | 9 (4.5%) |
| 60 to 89 Minutes | 15 (8.2%) | 0 (0.0%) |
| 90 or more Minutes | 4 (2.2%) | 6 (3.0%) |
Time of Departure to Work by Sex in Greenup
The most frequent times of departure to work in Greenup are 8:00 AM to 8:29 AM (41, 22.5%) for males and 7:00 AM to 7:29 AM (76, 38.4%) for females.
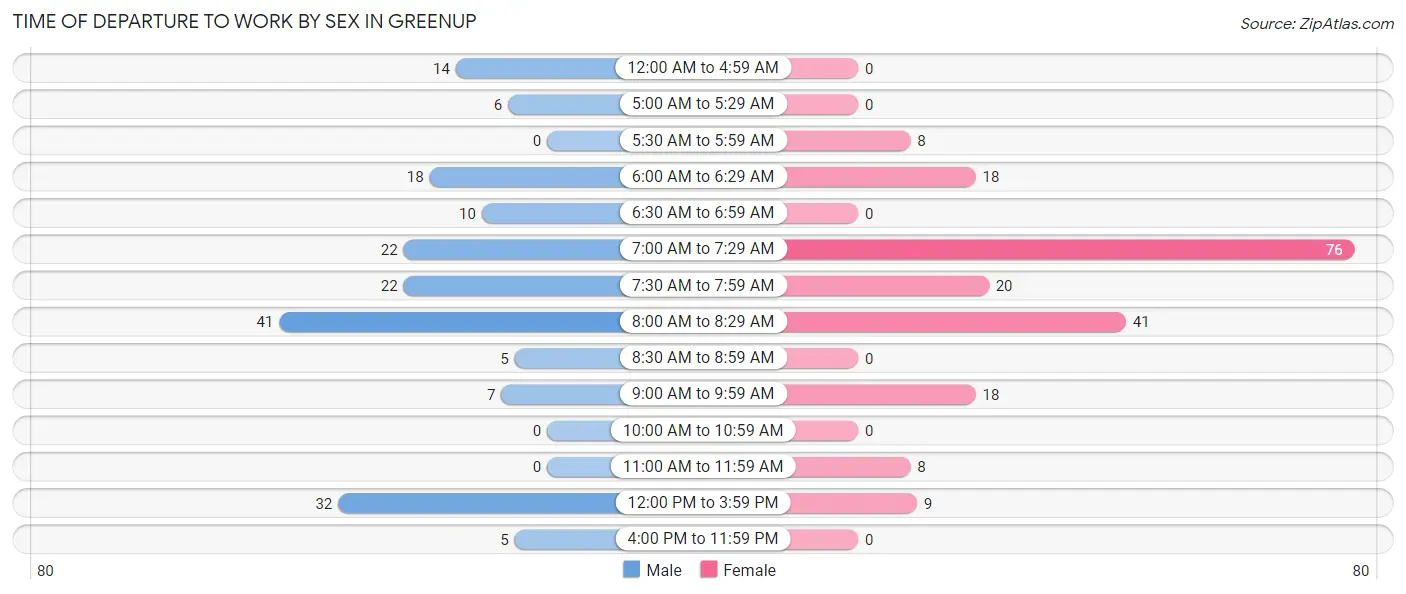
| Time of Departure | Male | Female |
| 12:00 AM to 4:59 AM | 14 (7.7%) | 0 (0.0%) |
| 5:00 AM to 5:29 AM | 6 (3.3%) | 0 (0.0%) |
| 5:30 AM to 5:59 AM | 0 (0.0%) | 8 (4.0%) |
| 6:00 AM to 6:29 AM | 18 (9.9%) | 18 (9.1%) |
| 6:30 AM to 6:59 AM | 10 (5.5%) | 0 (0.0%) |
| 7:00 AM to 7:29 AM | 22 (12.1%) | 76 (38.4%) |
| 7:30 AM to 7:59 AM | 22 (12.1%) | 20 (10.1%) |
| 8:00 AM to 8:29 AM | 41 (22.5%) | 41 (20.7%) |
| 8:30 AM to 8:59 AM | 5 (2.8%) | 0 (0.0%) |
| 9:00 AM to 9:59 AM | 7 (3.8%) | 18 (9.1%) |
| 10:00 AM to 10:59 AM | 0 (0.0%) | 0 (0.0%) |
| 11:00 AM to 11:59 AM | 0 (0.0%) | 8 (4.0%) |
| 12:00 PM to 3:59 PM | 32 (17.6%) | 9 (4.5%) |
| 4:00 PM to 11:59 PM | 5 (2.8%) | 0 (0.0%) |
| Total | 182 (100.0%) | 198 (100.0%) |
Housing Occupancy in Greenup
Occupancy by Ownership in Greenup
Of the total 433 dwellings in Greenup, owner-occupied units account for 275 (63.5%), while renter-occupied units make up 158 (36.5%).
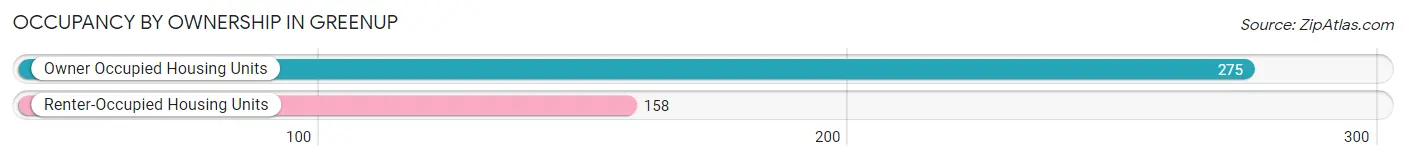
| Occupancy | # Housing Units | % Housing Units |
| Owner Occupied Housing Units | 275 | 63.5% |
| Renter-Occupied Housing Units | 158 | 36.5% |
| Total Occupied Housing Units | 433 | 100.0% |
Occupancy by Household Size in Greenup
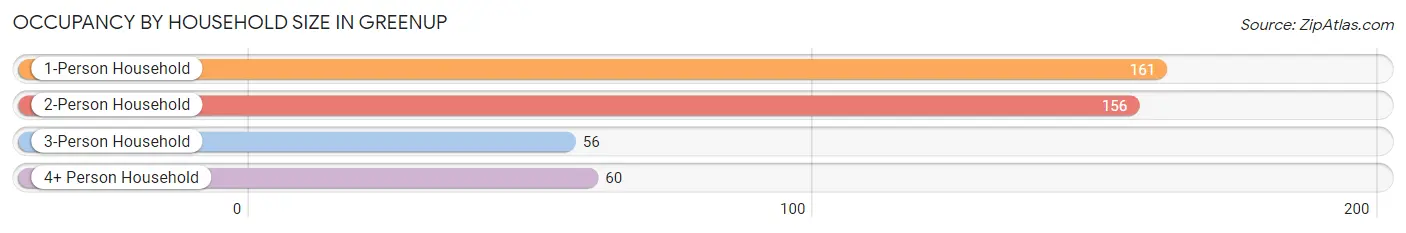
| Household Size | # Housing Units | % Housing Units |
| 1-Person Household | 161 | 37.2% |
| 2-Person Household | 156 | 36.0% |
| 3-Person Household | 56 | 12.9% |
| 4+ Person Household | 60 | 13.9% |
| Total Housing Units | 433 | 100.0% |
Occupancy by Ownership by Household Size in Greenup
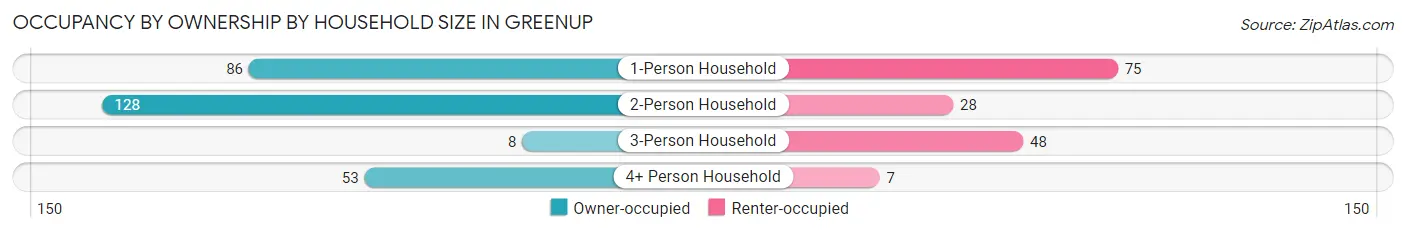
| Household Size | Owner-occupied | Renter-occupied |
| 1-Person Household | 86 (53.4%) | 75 (46.6%) |
| 2-Person Household | 128 (82.1%) | 28 (17.9%) |
| 3-Person Household | 8 (14.3%) | 48 (85.7%) |
| 4+ Person Household | 53 (88.3%) | 7 (11.7%) |
| Total Housing Units | 275 (63.5%) | 158 (36.5%) |
Occupancy by Educational Attainment in Greenup
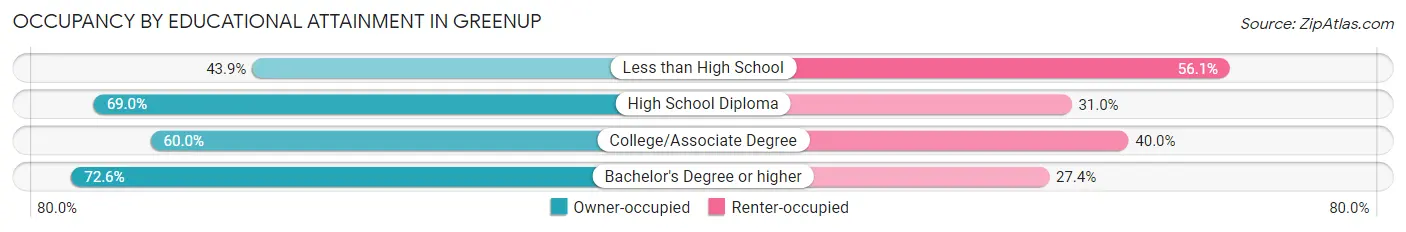
| Household Size | Owner-occupied | Renter-occupied |
| Less than High School | 18 (43.9%) | 23 (56.1%) |
| High School Diploma | 107 (69.0%) | 48 (31.0%) |
| College/Associate Degree | 105 (60.0%) | 70 (40.0%) |
| Bachelor's Degree or higher | 45 (72.6%) | 17 (27.4%) |
Occupancy by Age of Householder in Greenup
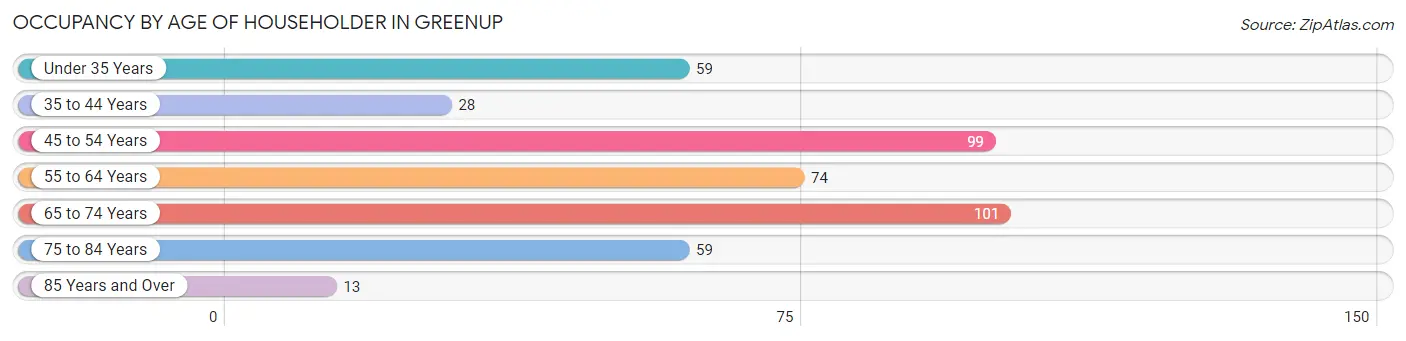
| Age Bracket | # Households | % Households |
| Under 35 Years | 59 | 13.6% |
| 35 to 44 Years | 28 | 6.5% |
| 45 to 54 Years | 99 | 22.9% |
| 55 to 64 Years | 74 | 17.1% |
| 65 to 74 Years | 101 | 23.3% |
| 75 to 84 Years | 59 | 13.6% |
| 85 Years and Over | 13 | 3.0% |
| Total | 433 | 100.0% |
Housing Finances in Greenup
Median Income by Occupancy in Greenup
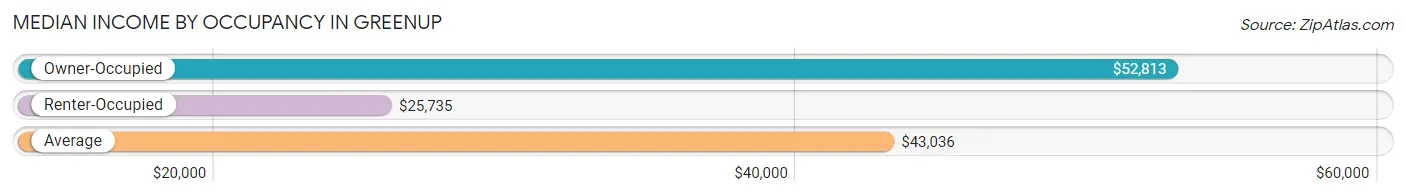
| Occupancy Type | # Households | Median Income |
| Owner-Occupied | 275 (63.5%) | $52,813 |
| Renter-Occupied | 158 (36.5%) | $25,735 |
| Average | 433 (100.0%) | $43,036 |
Occupancy by Householder Income Bracket in Greenup
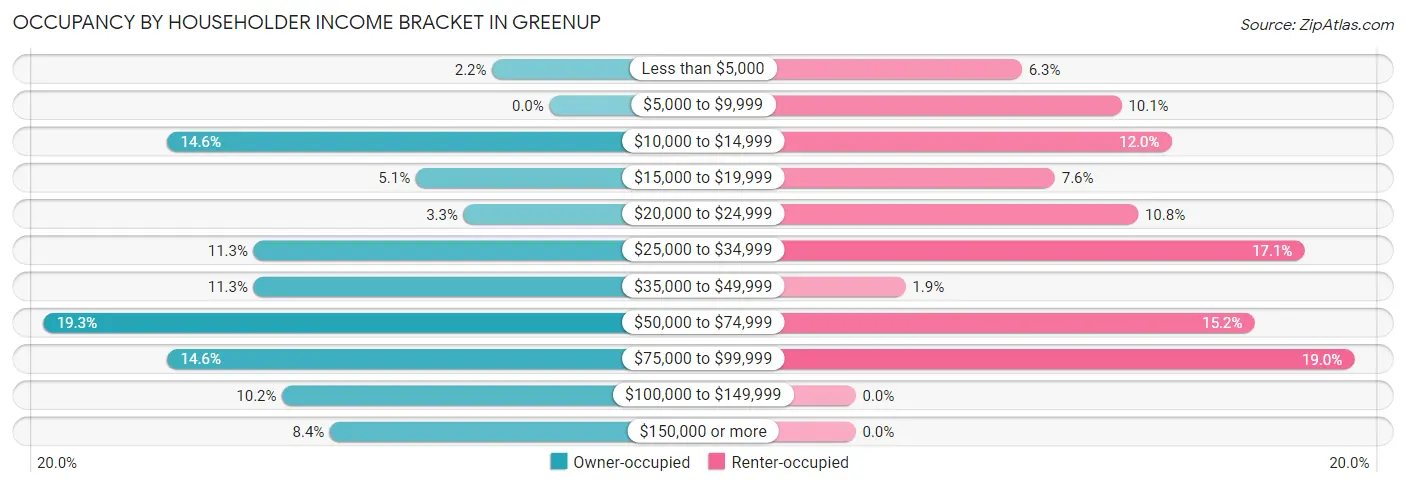
| Income Bracket | Owner-occupied | Renter-occupied |
| Less than $5,000 | 6 (2.2%) | 10 (6.3%) |
| $5,000 to $9,999 | 0 (0.0%) | 16 (10.1%) |
| $10,000 to $14,999 | 40 (14.5%) | 19 (12.0%) |
| $15,000 to $19,999 | 14 (5.1%) | 12 (7.6%) |
| $20,000 to $24,999 | 9 (3.3%) | 17 (10.8%) |
| $25,000 to $34,999 | 31 (11.3%) | 27 (17.1%) |
| $35,000 to $49,999 | 31 (11.3%) | 3 (1.9%) |
| $50,000 to $74,999 | 53 (19.3%) | 24 (15.2%) |
| $75,000 to $99,999 | 40 (14.5%) | 30 (19.0%) |
| $100,000 to $149,999 | 28 (10.2%) | 0 (0.0%) |
| $150,000 or more | 23 (8.4%) | 0 (0.0%) |
| Total | 275 (100.0%) | 158 (100.0%) |
Monthly Housing Cost Tiers in Greenup
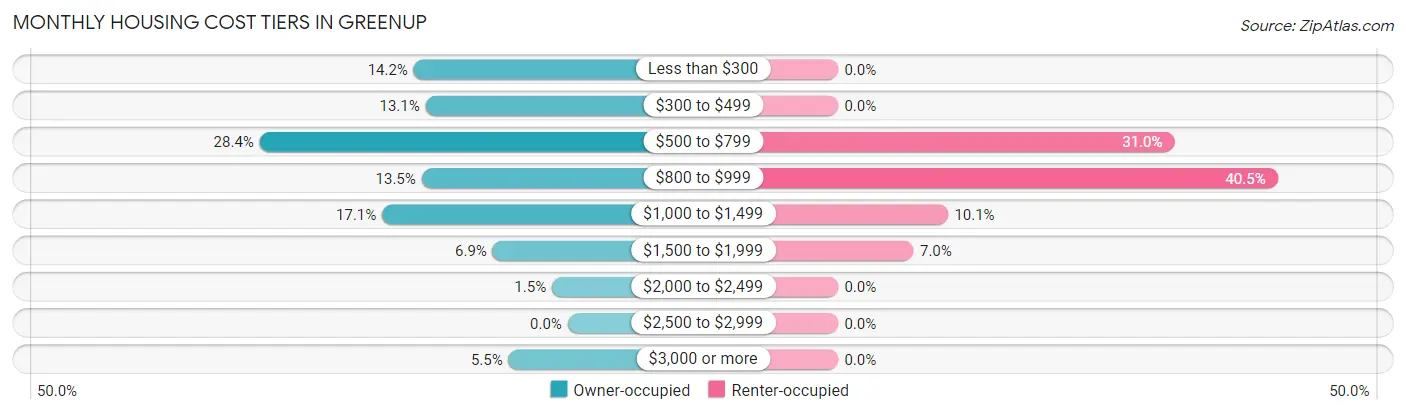
| Monthly Cost | Owner-occupied | Renter-occupied |
| Less than $300 | 39 (14.2%) | 0 (0.0%) |
| $300 to $499 | 36 (13.1%) | 0 (0.0%) |
| $500 to $799 | 78 (28.4%) | 49 (31.0%) |
| $800 to $999 | 37 (13.5%) | 64 (40.5%) |
| $1,000 to $1,499 | 47 (17.1%) | 16 (10.1%) |
| $1,500 to $1,999 | 19 (6.9%) | 11 (7.0%) |
| $2,000 to $2,499 | 4 (1.5%) | 0 (0.0%) |
| $2,500 to $2,999 | 0 (0.0%) | 0 (0.0%) |
| $3,000 or more | 15 (5.4%) | 0 (0.0%) |
| Total | 275 (100.0%) | 158 (100.0%) |
Physical Housing Characteristics in Greenup
Housing Structures in Greenup
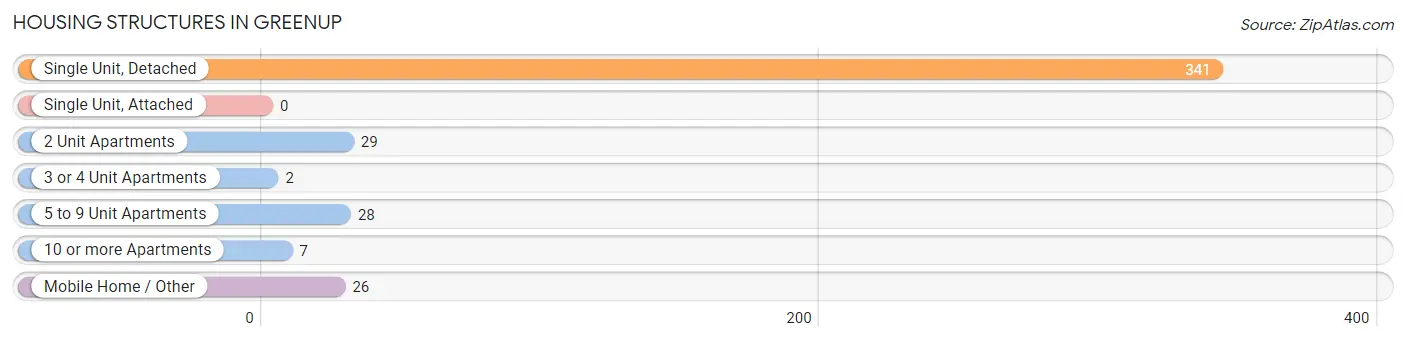
| Structure Type | # Housing Units | % Housing Units |
| Single Unit, Detached | 341 | 78.7% |
| Single Unit, Attached | 0 | 0.0% |
| 2 Unit Apartments | 29 | 6.7% |
| 3 or 4 Unit Apartments | 2 | 0.5% |
| 5 to 9 Unit Apartments | 28 | 6.5% |
| 10 or more Apartments | 7 | 1.6% |
| Mobile Home / Other | 26 | 6.0% |
| Total | 433 | 100.0% |
Housing Structures by Occupancy in Greenup
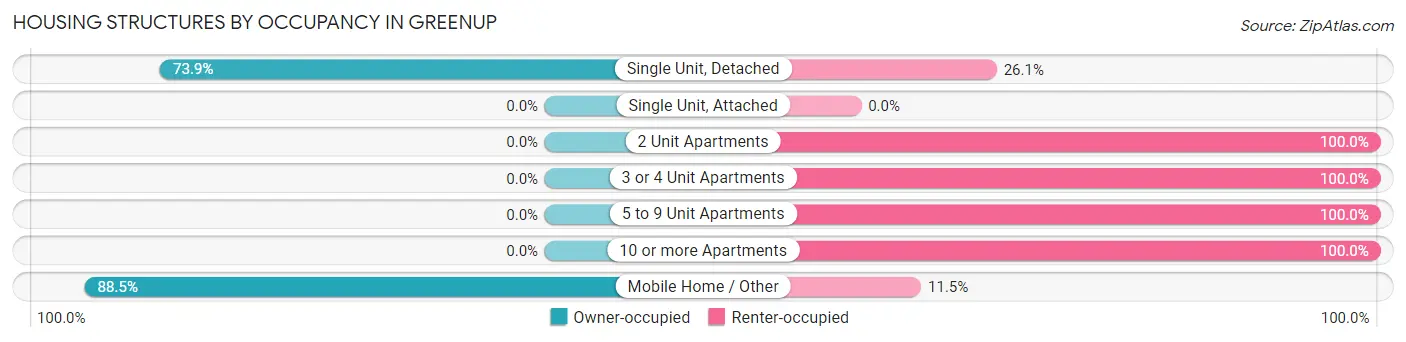
| Structure Type | Owner-occupied | Renter-occupied |
| Single Unit, Detached | 252 (73.9%) | 89 (26.1%) |
| Single Unit, Attached | 0 (0.0%) | 0 (0.0%) |
| 2 Unit Apartments | 0 (0.0%) | 29 (100.0%) |
| 3 or 4 Unit Apartments | 0 (0.0%) | 2 (100.0%) |
| 5 to 9 Unit Apartments | 0 (0.0%) | 28 (100.0%) |
| 10 or more Apartments | 0 (0.0%) | 7 (100.0%) |
| Mobile Home / Other | 23 (88.5%) | 3 (11.5%) |
| Total | 275 (63.5%) | 158 (36.5%) |
Housing Structures by Number of Rooms in Greenup
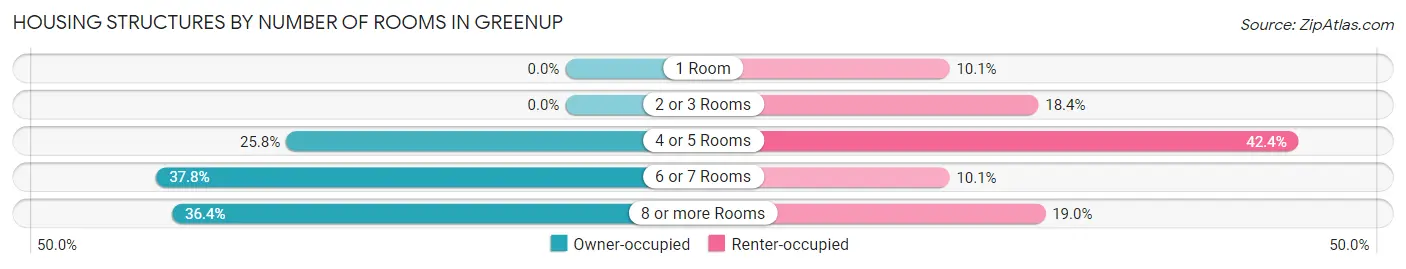
| Number of Rooms | Owner-occupied | Renter-occupied |
| 1 Room | 0 (0.0%) | 16 (10.1%) |
| 2 or 3 Rooms | 0 (0.0%) | 29 (18.3%) |
| 4 or 5 Rooms | 71 (25.8%) | 67 (42.4%) |
| 6 or 7 Rooms | 104 (37.8%) | 16 (10.1%) |
| 8 or more Rooms | 100 (36.4%) | 30 (19.0%) |
| Total | 275 (100.0%) | 158 (100.0%) |
Housing Structure by Heating Type in Greenup
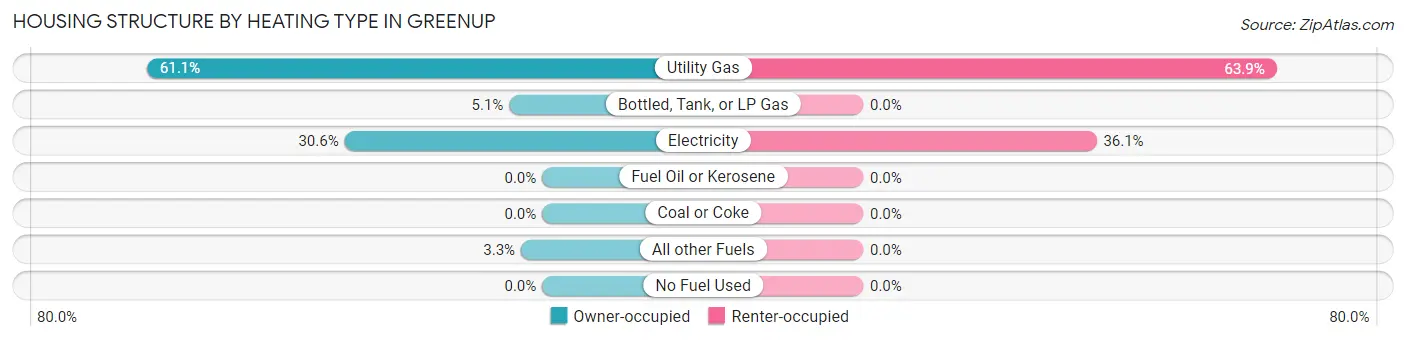
| Heating Type | Owner-occupied | Renter-occupied |
| Utility Gas | 168 (61.1%) | 101 (63.9%) |
| Bottled, Tank, or LP Gas | 14 (5.1%) | 0 (0.0%) |
| Electricity | 84 (30.5%) | 57 (36.1%) |
| Fuel Oil or Kerosene | 0 (0.0%) | 0 (0.0%) |
| Coal or Coke | 0 (0.0%) | 0 (0.0%) |
| All other Fuels | 9 (3.3%) | 0 (0.0%) |
| No Fuel Used | 0 (0.0%) | 0 (0.0%) |
| Total | 275 (100.0%) | 158 (100.0%) |
Household Vehicle Usage in Greenup
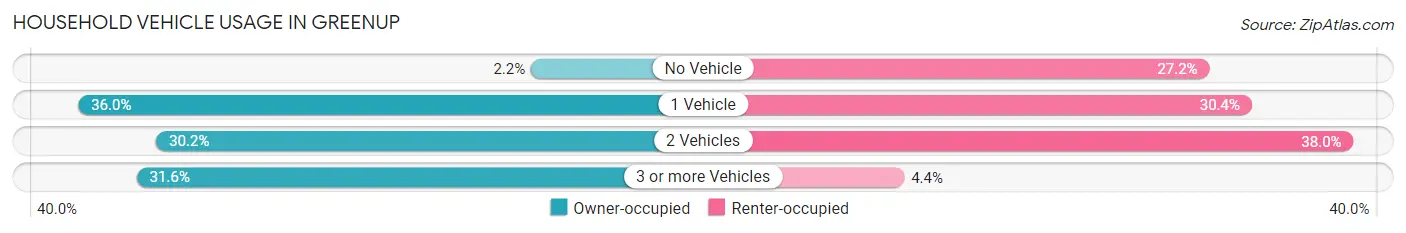
| Vehicles per Household | Owner-occupied | Renter-occupied |
| No Vehicle | 6 (2.2%) | 43 (27.2%) |
| 1 Vehicle | 99 (36.0%) | 48 (30.4%) |
| 2 Vehicles | 83 (30.2%) | 60 (38.0%) |
| 3 or more Vehicles | 87 (31.6%) | 7 (4.4%) |
| Total | 275 (100.0%) | 158 (100.0%) |
Real Estate & Mortgages in Greenup
Real Estate and Mortgage Overview in Greenup
| Characteristic | Without Mortgage | With Mortgage |
| Housing Units | 141 | 134 |
| Median Property Value | $83,100 | $134,400 |
| Median Household Income | $56,250 | $11 |
| Monthly Housing Costs | $494 | $15 |
| Real Estate Taxes | $667 | $8 |
Property Value by Mortgage Status in Greenup
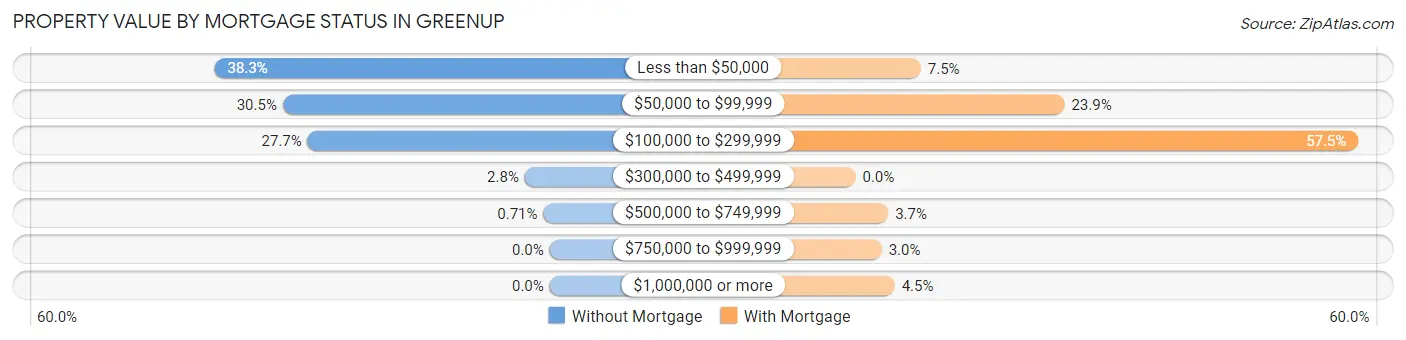
| Property Value | Without Mortgage | With Mortgage |
| Less than $50,000 | 54 (38.3%) | 10 (7.5%) |
| $50,000 to $99,999 | 43 (30.5%) | 32 (23.9%) |
| $100,000 to $299,999 | 39 (27.7%) | 77 (57.5%) |
| $300,000 to $499,999 | 4 (2.8%) | 0 (0.0%) |
| $500,000 to $749,999 | 1 (0.7%) | 5 (3.7%) |
| $750,000 to $999,999 | 0 (0.0%) | 4 (3.0%) |
| $1,000,000 or more | 0 (0.0%) | 6 (4.5%) |
| Total | 141 (100.0%) | 134 (100.0%) |
Household Income by Mortgage Status in Greenup
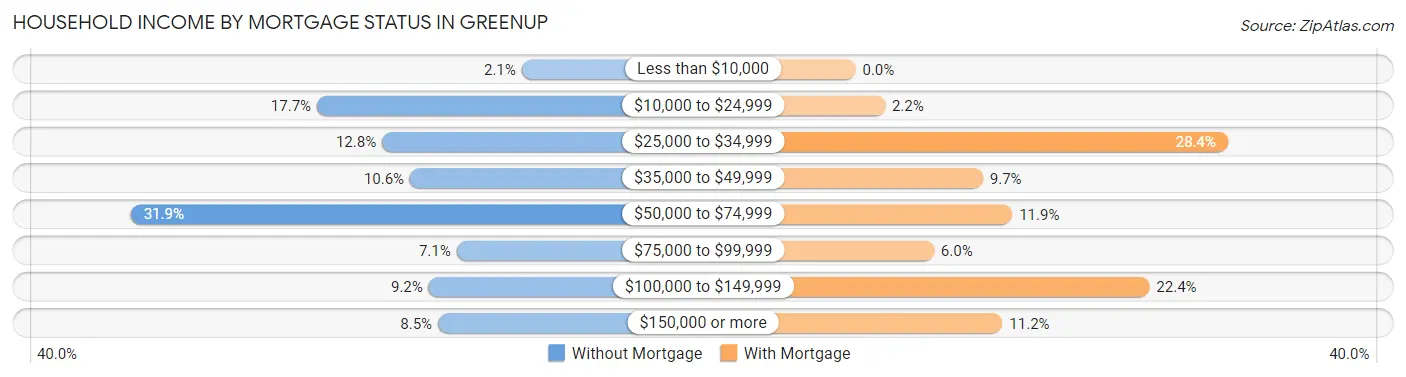
| Household Income | Without Mortgage | With Mortgage |
| Less than $10,000 | 3 (2.1%) | 0 (0.0%) |
| $10,000 to $24,999 | 25 (17.7%) | 3 (2.2%) |
| $25,000 to $34,999 | 18 (12.8%) | 38 (28.4%) |
| $35,000 to $49,999 | 15 (10.6%) | 13 (9.7%) |
| $50,000 to $74,999 | 45 (31.9%) | 16 (11.9%) |
| $75,000 to $99,999 | 10 (7.1%) | 8 (6.0%) |
| $100,000 to $149,999 | 13 (9.2%) | 30 (22.4%) |
| $150,000 or more | 12 (8.5%) | 15 (11.2%) |
| Total | 141 (100.0%) | 134 (100.0%) |
Property Value to Household Income Ratio in Greenup
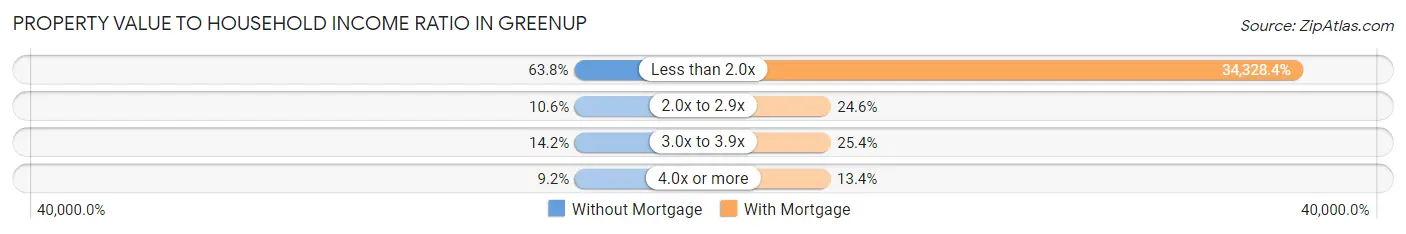
| Value-to-Income Ratio | Without Mortgage | With Mortgage |
| Less than 2.0x | 90 (63.8%) | 46,000 (34,328.4%) |
| 2.0x to 2.9x | 15 (10.6%) | 33 (24.6%) |
| 3.0x to 3.9x | 20 (14.2%) | 34 (25.4%) |
| 4.0x or more | 13 (9.2%) | 18 (13.4%) |
| Total | 141 (100.0%) | 134 (100.0%) |
Real Estate Taxes by Mortgage Status in Greenup
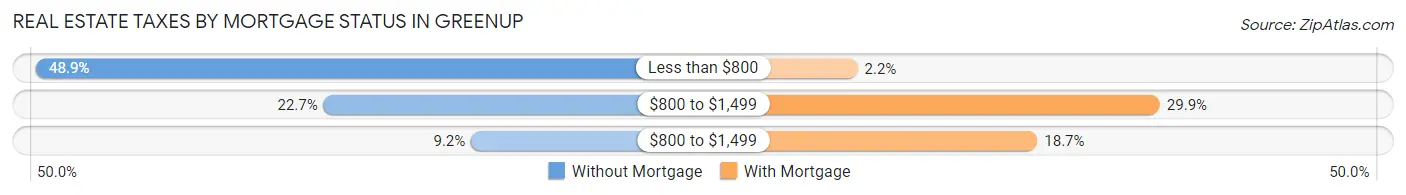
| Property Taxes | Without Mortgage | With Mortgage |
| Less than $800 | 69 (48.9%) | 3 (2.2%) |
| $800 to $1,499 | 32 (22.7%) | 40 (29.8%) |
| $800 to $1,499 | 13 (9.2%) | 25 (18.7%) |
| Total | 141 (100.0%) | 134 (100.0%) |
Health & Disability in Greenup
Health Insurance Coverage by Age in Greenup
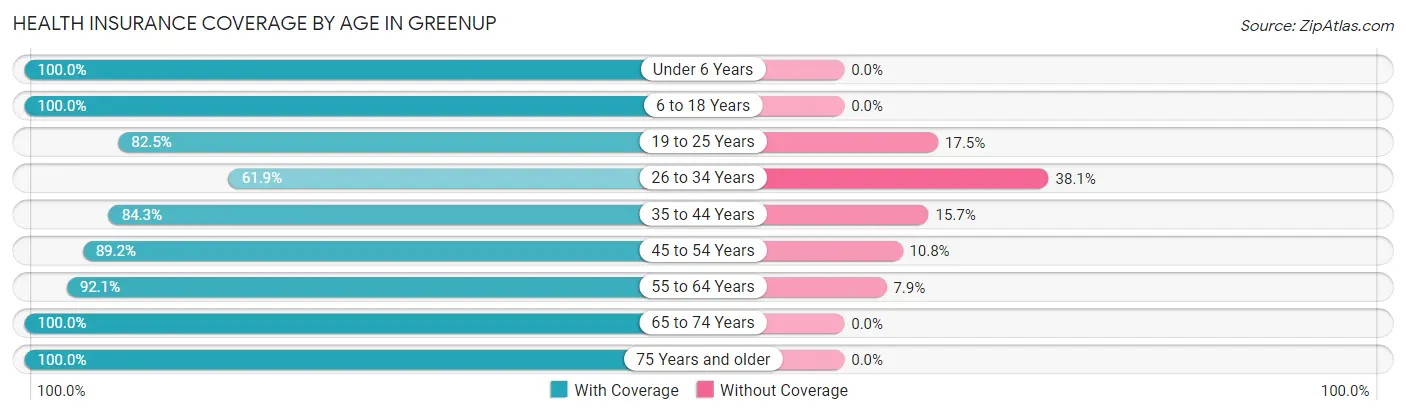
| Age Bracket | With Coverage | Without Coverage |
| Under 6 Years | 55 (100.0%) | 0 (0.0%) |
| 6 to 18 Years | 100 (100.0%) | 0 (0.0%) |
| 19 to 25 Years | 66 (82.5%) | 14 (17.5%) |
| 26 to 34 Years | 65 (61.9%) | 40 (38.1%) |
| 35 to 44 Years | 59 (84.3%) | 11 (15.7%) |
| 45 to 54 Years | 148 (89.2%) | 18 (10.8%) |
| 55 to 64 Years | 117 (92.1%) | 10 (7.9%) |
| 65 to 74 Years | 145 (100.0%) | 0 (0.0%) |
| 75 Years and older | 94 (100.0%) | 0 (0.0%) |
| Total | 849 (90.1%) | 93 (9.9%) |
Health Insurance Coverage by Citizenship Status in Greenup
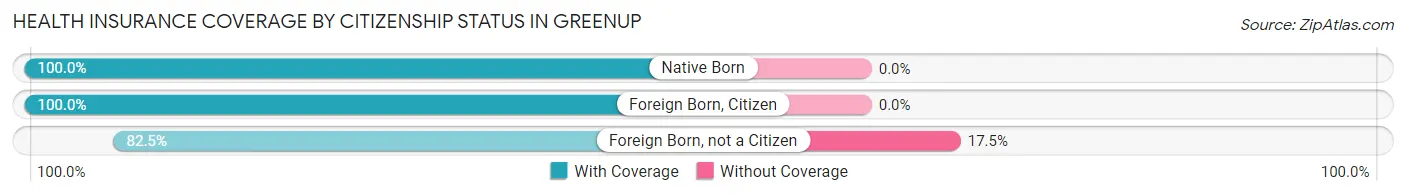
| Citizenship Status | With Coverage | Without Coverage |
| Native Born | 55 (100.0%) | 0 (0.0%) |
| Foreign Born, Citizen | 100 (100.0%) | 0 (0.0%) |
| Foreign Born, not a Citizen | 66 (82.5%) | 14 (17.5%) |
Health Insurance Coverage by Household Income in Greenup
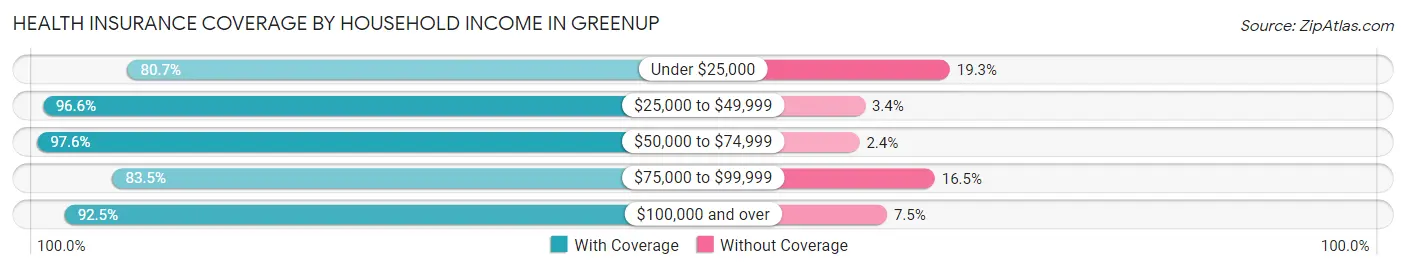
| Household Income | With Coverage | Without Coverage |
| Under $25,000 | 163 (80.7%) | 39 (19.3%) |
| $25,000 to $49,999 | 142 (96.6%) | 5 (3.4%) |
| $50,000 to $74,999 | 247 (97.6%) | 6 (2.4%) |
| $75,000 to $99,999 | 162 (83.5%) | 32 (16.5%) |
| $100,000 and over | 135 (92.5%) | 11 (7.5%) |
Public vs Private Health Insurance Coverage by Age in Greenup
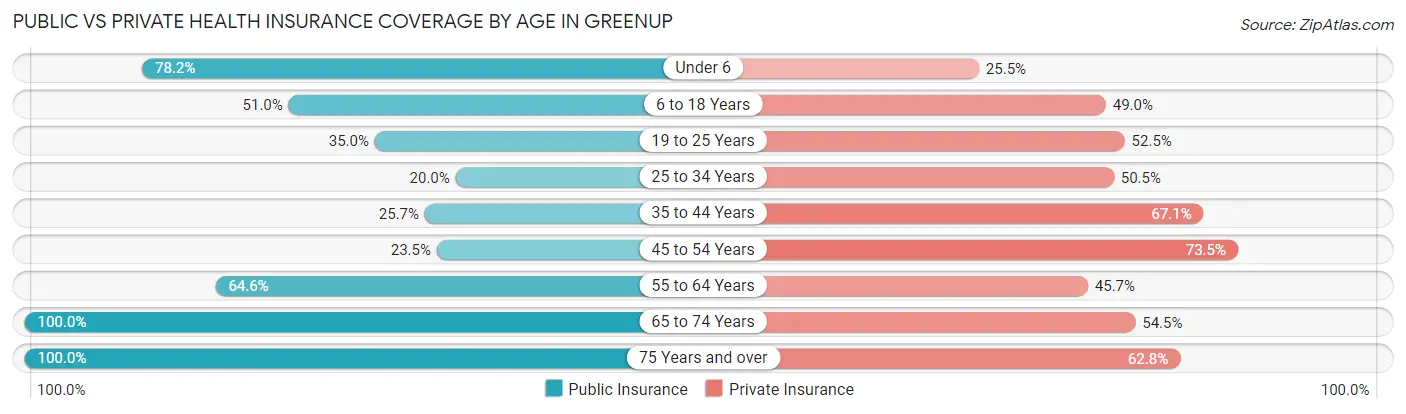
| Age Bracket | Public Insurance | Private Insurance |
| Under 6 | 43 (78.2%) | 14 (25.5%) |
| 6 to 18 Years | 51 (51.0%) | 49 (49.0%) |
| 19 to 25 Years | 28 (35.0%) | 42 (52.5%) |
| 25 to 34 Years | 21 (20.0%) | 53 (50.5%) |
| 35 to 44 Years | 18 (25.7%) | 47 (67.1%) |
| 45 to 54 Years | 39 (23.5%) | 122 (73.5%) |
| 55 to 64 Years | 82 (64.6%) | 58 (45.7%) |
| 65 to 74 Years | 145 (100.0%) | 79 (54.5%) |
| 75 Years and over | 94 (100.0%) | 59 (62.8%) |
| Total | 521 (55.3%) | 523 (55.5%) |
Disability Status by Sex by Age in Greenup
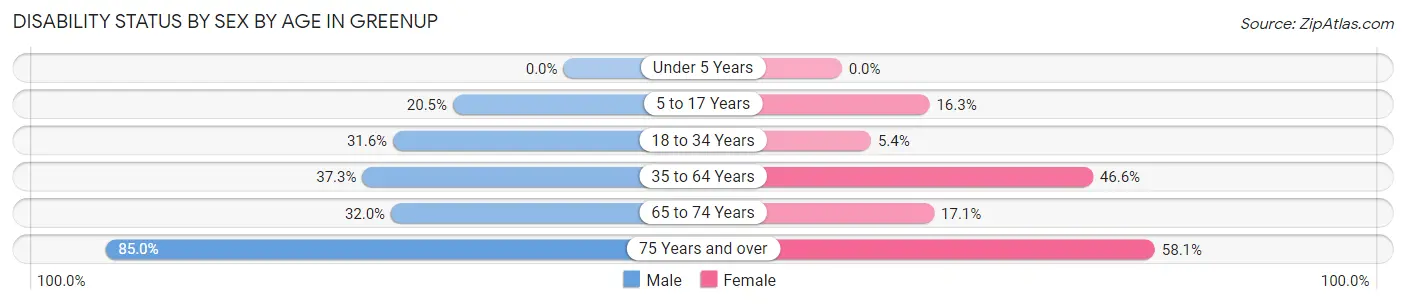
| Age Bracket | Male | Female |
| Under 5 Years | 0 (0.0%) | 0 (0.0%) |
| 5 to 17 Years | 8 (20.5%) | 7 (16.3%) |
| 18 to 34 Years | 31 (31.6%) | 6 (5.4%) |
| 35 to 64 Years | 53 (37.3%) | 103 (46.6%) |
| 65 to 74 Years | 24 (32.0%) | 12 (17.1%) |
| 75 Years and over | 17 (85.0%) | 43 (58.1%) |
Disability Class by Sex by Age in Greenup
Disability Class: Hearing Difficulty
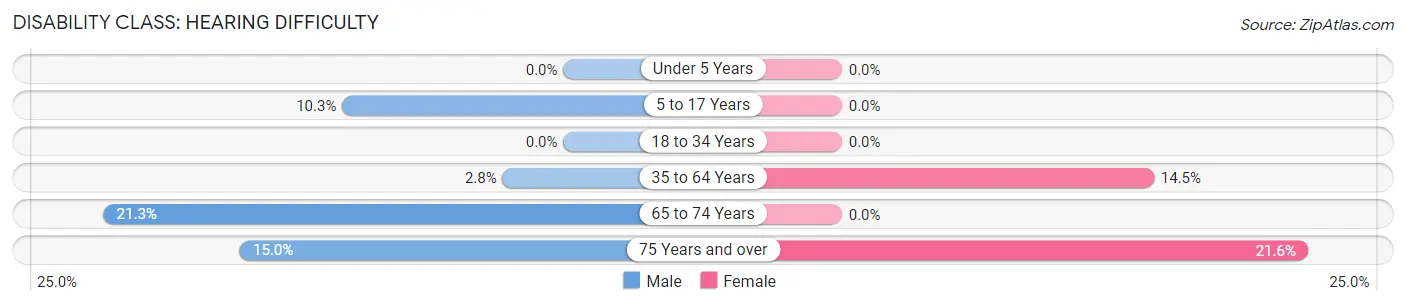
| Age Bracket | Male | Female |
| Under 5 Years | 0 (0.0%) | 0 (0.0%) |
| 5 to 17 Years | 4 (10.3%) | 0 (0.0%) |
| 18 to 34 Years | 0 (0.0%) | 0 (0.0%) |
| 35 to 64 Years | 4 (2.8%) | 32 (14.5%) |
| 65 to 74 Years | 16 (21.3%) | 0 (0.0%) |
| 75 Years and over | 3 (15.0%) | 16 (21.6%) |
Disability Class: Vision Difficulty
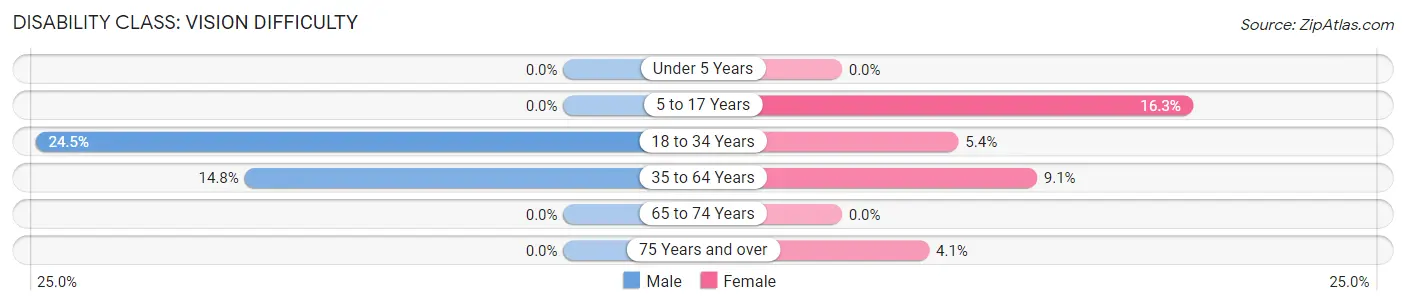
| Age Bracket | Male | Female |
| Under 5 Years | 0 (0.0%) | 0 (0.0%) |
| 5 to 17 Years | 0 (0.0%) | 7 (16.3%) |
| 18 to 34 Years | 24 (24.5%) | 6 (5.4%) |
| 35 to 64 Years | 21 (14.8%) | 20 (9.0%) |
| 65 to 74 Years | 0 (0.0%) | 0 (0.0%) |
| 75 Years and over | 0 (0.0%) | 3 (4.1%) |
Disability Class: Cognitive Difficulty
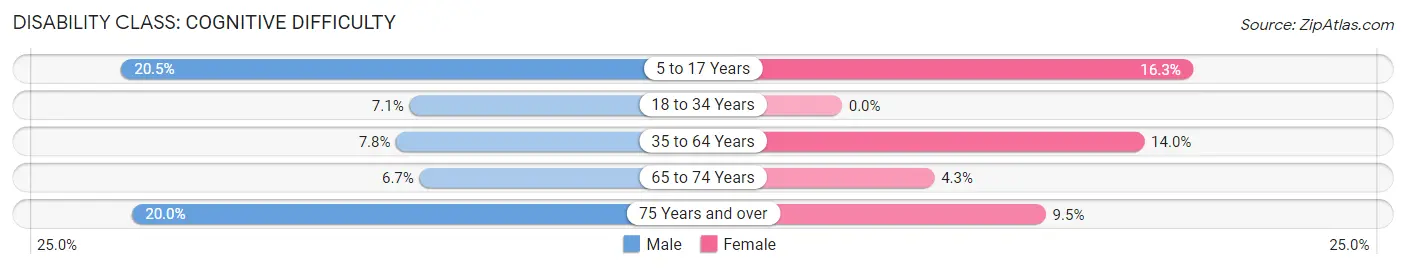
| Age Bracket | Male | Female |
| 5 to 17 Years | 8 (20.5%) | 7 (16.3%) |
| 18 to 34 Years | 7 (7.1%) | 0 (0.0%) |
| 35 to 64 Years | 11 (7.7%) | 31 (14.0%) |
| 65 to 74 Years | 5 (6.7%) | 3 (4.3%) |
| 75 Years and over | 4 (20.0%) | 7 (9.5%) |
Disability Class: Ambulatory Difficulty
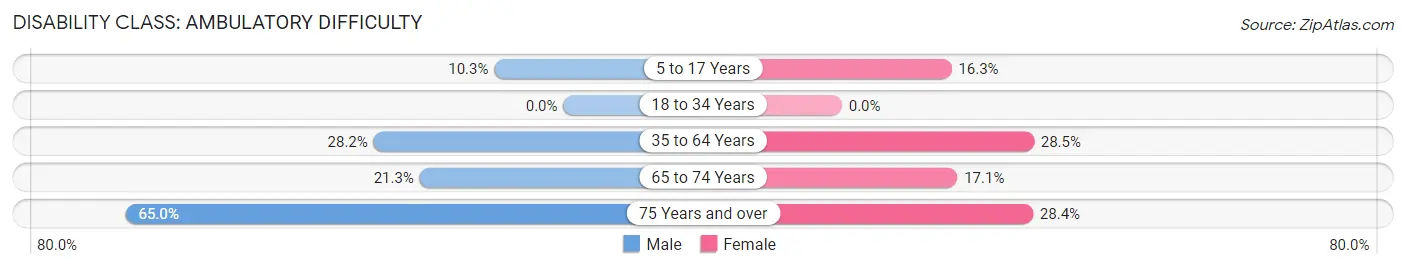
| Age Bracket | Male | Female |
| 5 to 17 Years | 4 (10.3%) | 7 (16.3%) |
| 18 to 34 Years | 0 (0.0%) | 0 (0.0%) |
| 35 to 64 Years | 40 (28.2%) | 63 (28.5%) |
| 65 to 74 Years | 16 (21.3%) | 12 (17.1%) |
| 75 Years and over | 13 (65.0%) | 21 (28.4%) |
Disability Class: Self-Care Difficulty
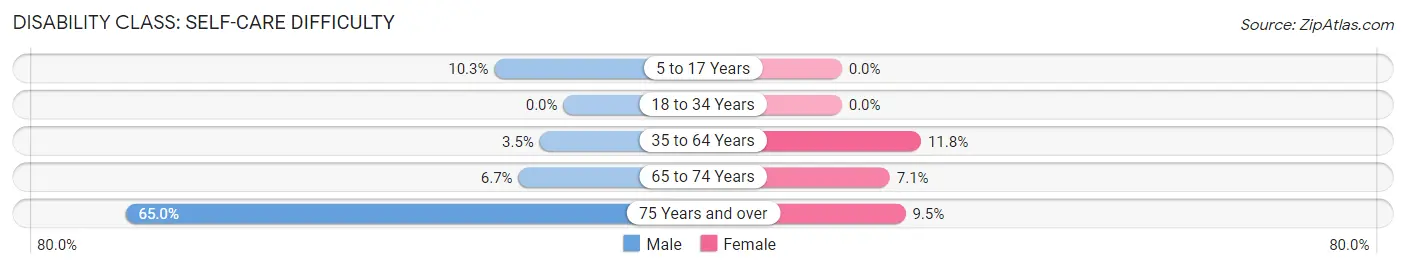
| Age Bracket | Male | Female |
| 5 to 17 Years | 4 (10.3%) | 0 (0.0%) |
| 18 to 34 Years | 0 (0.0%) | 0 (0.0%) |
| 35 to 64 Years | 5 (3.5%) | 26 (11.8%) |
| 65 to 74 Years | 5 (6.7%) | 5 (7.1%) |
| 75 Years and over | 13 (65.0%) | 7 (9.5%) |
Technology Access in Greenup
Computing Device Access in Greenup
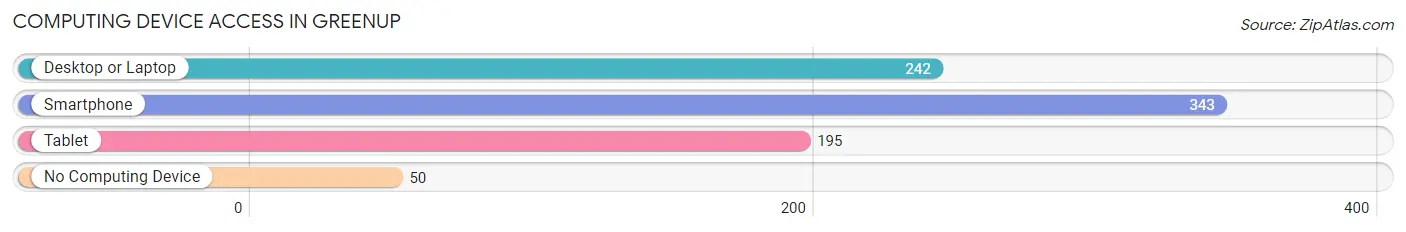
| Device Type | # Households | % Households |
| Desktop or Laptop | 242 | 55.9% |
| Smartphone | 343 | 79.2% |
| Tablet | 195 | 45.0% |
| No Computing Device | 50 | 11.6% |
| Total | 433 | 100.0% |
Internet Access in Greenup
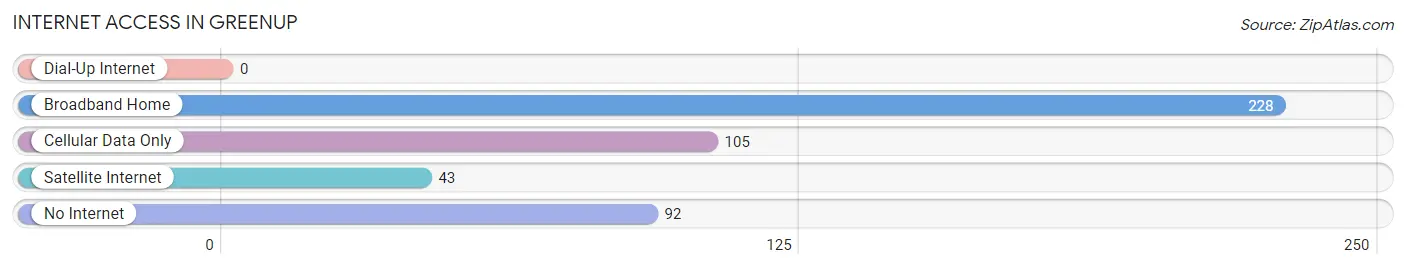
| Internet Type | # Households | % Households |
| Dial-Up Internet | 0 | 0.0% |
| Broadband Home | 228 | 52.7% |
| Cellular Data Only | 105 | 24.2% |
| Satellite Internet | 43 | 9.9% |
| No Internet | 92 | 21.2% |
| Total | 433 | 100.0% |
Greenup Summary
Greenup, Kentucky is a small city located in the northeastern corner of the state, along the Ohio River. It is the county seat of Greenup County and is part of the Huntington-Ashland, WV-KY-OH Metropolitan Statistical Area. The city has a population of 2,919 as of the 2010 census, and is the largest city in the county.
History
Greenup was founded in 1803 by Colonel John Greenup, a Revolutionary War veteran. The city was originally known as Greenupsburg, and was the first county seat of Greenup County. The city was incorporated in 1811, and the name was changed to Greenup in 1836.
Greenup was an important port city during the 19th century, and was a major stop on the Underground Railroad. The city was also a major center of the iron industry, and was home to several iron furnaces.
Geography
Greenup is located at 38°30'N 82°45'W (38.50, -82.75). The city is situated along the Ohio River, and is bordered by the cities of Russell and Flatwoods to the north, and the towns of South Shore and Worthington to the south.
The city has a total area of 2.2 square miles, all of which is land. The terrain is mostly flat, with some rolling hills in the northern part of the city.
Economy
Greenup's economy is largely based on manufacturing and services. The city is home to several manufacturing plants, including a steel mill, a paper mill, and a plastics plant. The city also has a number of retail stores, restaurants, and other businesses.
The city is also home to a number of government offices, including the Greenup County Courthouse, the Greenup County Sheriff's Office, and the Greenup County Health Department.
Demographics
As of the 2010 census, Greenup had a population of 2,919. The racial makeup of the city was 95.2% White, 1.7% African American, 0.3% Native American, 0.3% Asian, 0.1% Pacific Islander, 0.7% from other races, and 1.7% from two or more races. Hispanic or Latino of any race were 1.7% of the population.
The median income for a household in the city was $30,938, and the median income for a family was $37,917. The per capita income for the city was $17,845. About 17.2% of families and 20.2% of the population were below the poverty line, including 28.2% of those under age 18 and 11.2% of those age 65 or over.
Common Questions
What is Per Capita Income in Greenup?
Per Capita income in Greenup is $23,044.
What is the Median Family Income in Greenup?
Median Family Income in Greenup is $65,179.
What is the Median Household income in Greenup?
Median Household Income in Greenup is $43,036.
What is Income or Wage Gap in Greenup?
Income or Wage Gap in Greenup is 18.9%.
Women in Greenup earn 81.1 cents for every dollar earned by a man.
What is Family Income Deficit in Greenup?
Family Income Deficit in Greenup is $5,764.
Families that are below poverty line in Greenup earn $5,764 less on average than the poverty threshold level.
What is Inequality or Gini Index in Greenup?
Inequality or Gini Index in Greenup is 0.45.
What is the Total Population of Greenup?
Total Population of Greenup is 1,068.
What is the Total Male Population of Greenup?
Total Male Population of Greenup is 504.
What is the Total Female Population of Greenup?
Total Female Population of Greenup is 564.
What is the Ratio of Males per 100 Females in Greenup?
There are 89.36 Males per 100 Females in Greenup.
What is the Ratio of Females per 100 Males in Greenup?
There are 111.90 Females per 100 Males in Greenup.
What is the Median Population Age in Greenup?
Median Population Age in Greenup is 46.4 Years.
What is the Average Family Size in Greenup
Average Family Size in Greenup is 2.9 People.
What is the Average Household Size in Greenup
Average Household Size in Greenup is 2.2 People.
How Large is the Labor Force in Greenup?
There are 430 People in the Labor Forcein in Greenup.
What is the Percentage of People in the Labor Force in Greenup?
44.9% of People are in the Labor Force in Greenup.
What is the Unemployment Rate in Greenup?
Unemployment Rate in Greenup is 7.4%.