Brooksville, KY Map & Demographics
Brooksville Map
Brooksville Overview
$19,037
PER CAPITA INCOME
$58,807
AVG FAMILY INCOME
$50,000
AVG HOUSEHOLD INCOME
63.1%
WAGE / INCOME GAP [ % ]
36.9¢/ $1
WAGE / INCOME GAP [ $ ]
0.45
INEQUALITY / GINI INDEX
764
TOTAL POPULATION
322
MALE POPULATION
442
FEMALE POPULATION
72.85
MALES / 100 FEMALES
137.27
FEMALES / 100 MALES
29.4
MEDIAN AGE
3.3
AVG FAMILY SIZE
2.8
AVG HOUSEHOLD SIZE
270
LABOR FORCE [ PEOPLE ]
53.6%
PERCENT IN LABOR FORCE
2.2%
UNEMPLOYMENT RATE
Brooksville Zip Codes
Brooksville Area Codes
Income in Brooksville
Income Overview in Brooksville
Per Capita Income in Brooksville is $19,037, while median incomes of families and households are $58,807 and $50,000 respectively.
| Characteristic | Number | Measure |
| Per Capita Income | 764 | $19,037 |
| Median Family Income | 186 | $58,807 |
| Mean Family Income | 186 | $71,529 |
| Median Household Income | 276 | $50,000 |
| Mean Household Income | 276 | $57,563 |
| Income Deficit | 186 | $0 |
| Wage / Income Gap (%) | 764 | 63.09% |
| Wage / Income Gap ($) | 764 | 36.91¢ per $1 |
| Gini / Inequality Index | 764 | 0.45 |
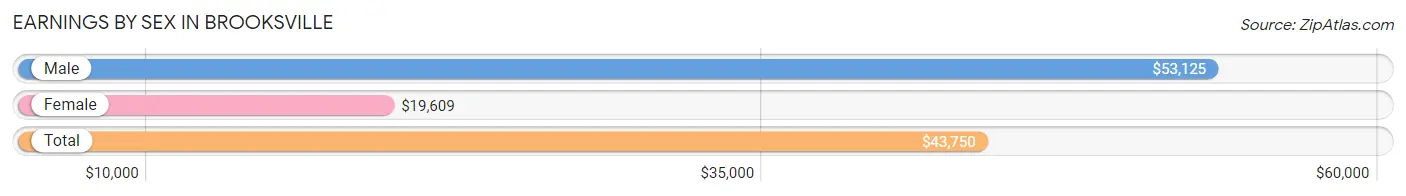
Earnings by Sex in Brooksville
Average Earnings in Brooksville are $43,750, $53,125 for men and $19,609 for women, a difference of 63.1%.
| Sex | Number | Average Earnings |
| Male | 148 (52.7%) | $53,125 |
| Female | 133 (47.3%) | $19,609 |
| Total | 281 (100.0%) | $43,750 |
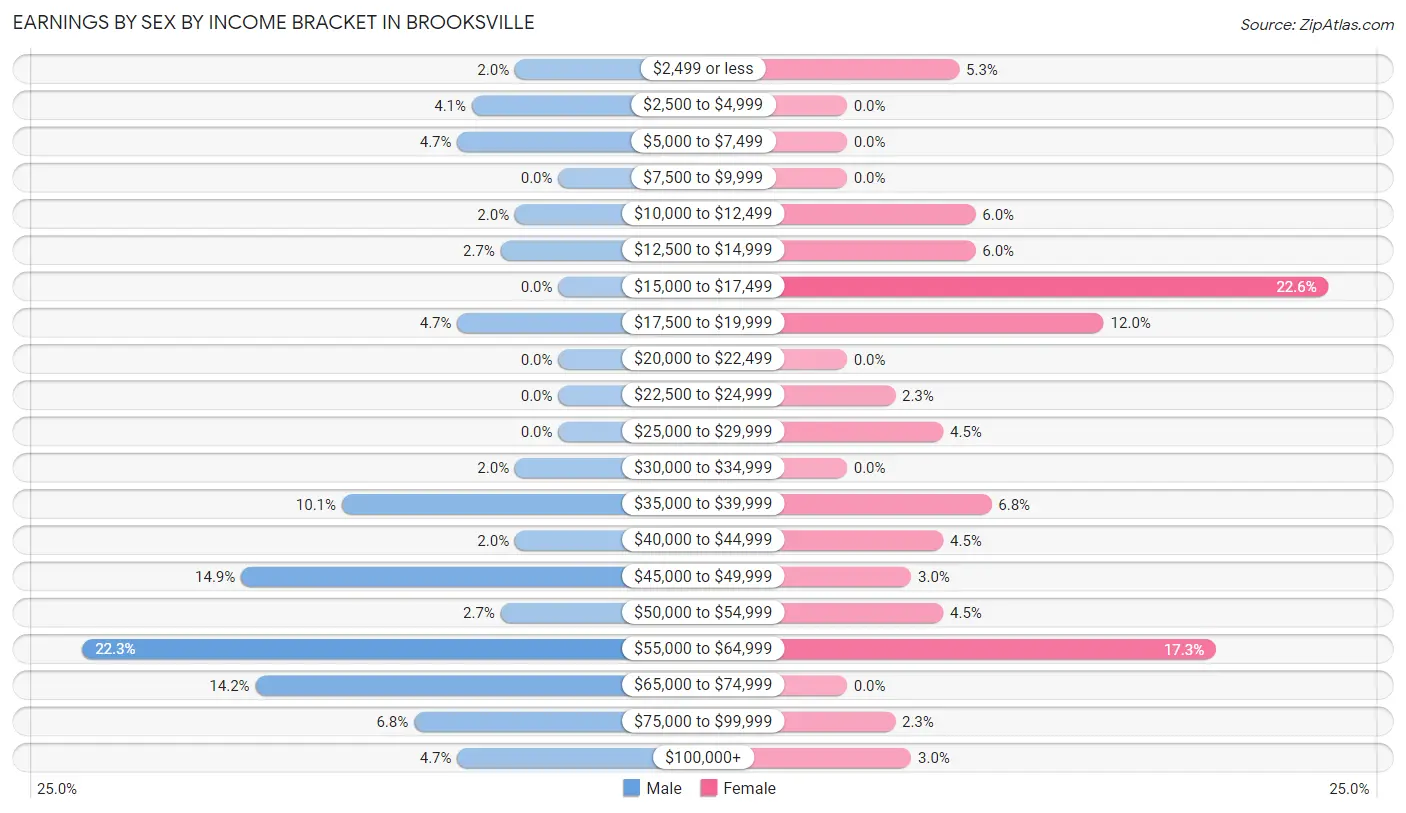
Earnings by Sex by Income Bracket in Brooksville
The most common earnings brackets in Brooksville are $55,000 to $64,999 for men (33 | 22.3%) and $15,000 to $17,499 for women (30 | 22.6%).
| Income | Male | Female |
| $2,499 or less | 3 (2.0%) | 7 (5.3%) |
| $2,500 to $4,999 | 6 (4.1%) | 0 (0.0%) |
| $5,000 to $7,499 | 7 (4.7%) | 0 (0.0%) |
| $7,500 to $9,999 | 0 (0.0%) | 0 (0.0%) |
| $10,000 to $12,499 | 3 (2.0%) | 8 (6.0%) |
| $12,500 to $14,999 | 4 (2.7%) | 8 (6.0%) |
| $15,000 to $17,499 | 0 (0.0%) | 30 (22.6%) |
| $17,500 to $19,999 | 7 (4.7%) | 16 (12.0%) |
| $20,000 to $22,499 | 0 (0.0%) | 0 (0.0%) |
| $22,500 to $24,999 | 0 (0.0%) | 3 (2.3%) |
| $25,000 to $29,999 | 0 (0.0%) | 6 (4.5%) |
| $30,000 to $34,999 | 3 (2.0%) | 0 (0.0%) |
| $35,000 to $39,999 | 15 (10.1%) | 9 (6.8%) |
| $40,000 to $44,999 | 3 (2.0%) | 6 (4.5%) |
| $45,000 to $49,999 | 22 (14.9%) | 4 (3.0%) |
| $50,000 to $54,999 | 4 (2.7%) | 6 (4.5%) |
| $55,000 to $64,999 | 33 (22.3%) | 23 (17.3%) |
| $65,000 to $74,999 | 21 (14.2%) | 0 (0.0%) |
| $75,000 to $99,999 | 10 (6.8%) | 3 (2.3%) |
| $100,000+ | 7 (4.7%) | 4 (3.0%) |
| Total | 148 (100.0%) | 133 (100.0%) |
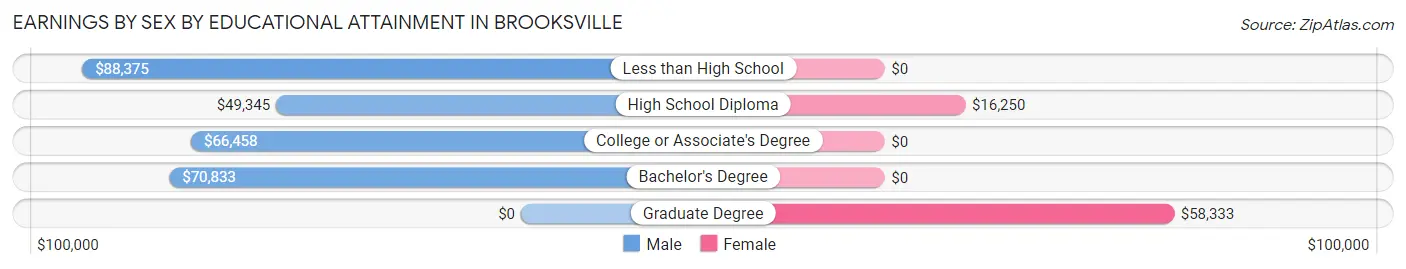
Earnings by Sex by Educational Attainment in Brooksville
Average earnings in Brooksville are $56,964 for men and $19,609 for women, a difference of 65.6%. Men with an educational attainment of less than high school enjoy the highest average annual earnings of $88,375, while those with high school diploma education earn the least with $49,345. Women with an educational attainment of graduate degree earn the most with the average annual earnings of $58,333, while those with high school diploma education have the smallest earnings of $16,250.
| Educational Attainment | Male Income | Female Income |
| Less than High School | $88,375 | $0 |
| High School Diploma | $49,345 | $16,250 |
| College or Associate's Degree | $66,458 | $0 |
| Bachelor's Degree | $70,833 | $0 |
| Graduate Degree | - | - |
| Total | $56,964 | $19,609 |
Family Income in Brooksville
Family Income Brackets in Brooksville
According to the Brooksville family income data, there are 49 families falling into the $50,000 to $74,999 income range, which is the most common income bracket and makes up 26.3% of all families.
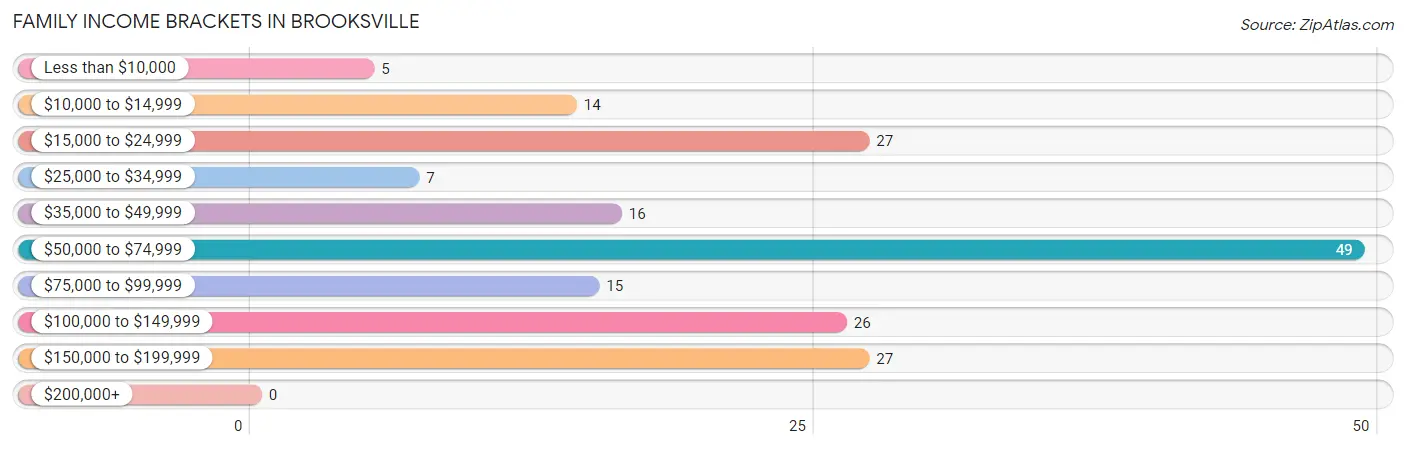
| Income Bracket | # Families | % Families |
| Less than $10,000 | 5 | 2.7% |
| $10,000 to $14,999 | 14 | 7.5% |
| $15,000 to $24,999 | 27 | 14.5% |
| $25,000 to $34,999 | 7 | 3.8% |
| $35,000 to $49,999 | 16 | 8.6% |
| $50,000 to $74,999 | 49 | 26.3% |
| $75,000 to $99,999 | 15 | 8.1% |
| $100,000 to $149,999 | 26 | 14.0% |
| $150,000 to $199,999 | 27 | 14.5% |
| $200,000+ | 0 | 0.0% |
Family Income by Famaliy Size in Brooksville
4-person families (24 | 12.9%) account for the highest median family income in Brooksville with $153,125 per family, while 3-person families (22 | 11.8%) have the highest median income of $49,167 per family member.
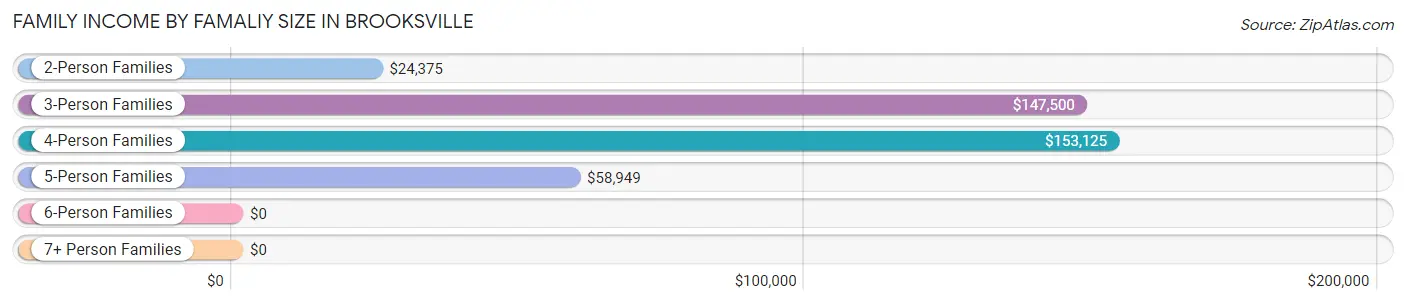
| Income Bracket | # Families | Median Income |
| 2-Person Families | 69 (37.1%) | $24,375 |
| 3-Person Families | 22 (11.8%) | $147,500 |
| 4-Person Families | 24 (12.9%) | $153,125 |
| 5-Person Families | 55 (29.6%) | $58,949 |
| 6-Person Families | 0 (0.0%) | $0 |
| 7+ Person Families | 16 (8.6%) | $0 |
| Total | 186 (100.0%) | $58,807 |
Family Income by Number of Earners in Brooksville
The median family income in Brooksville is $58,807, with families comprising 3+ earners (36) having the highest median family income of $153,906, while families with no earners (38) have the lowest median family income of $19,000, accounting for 19.4% and 20.4% of families, respectively.
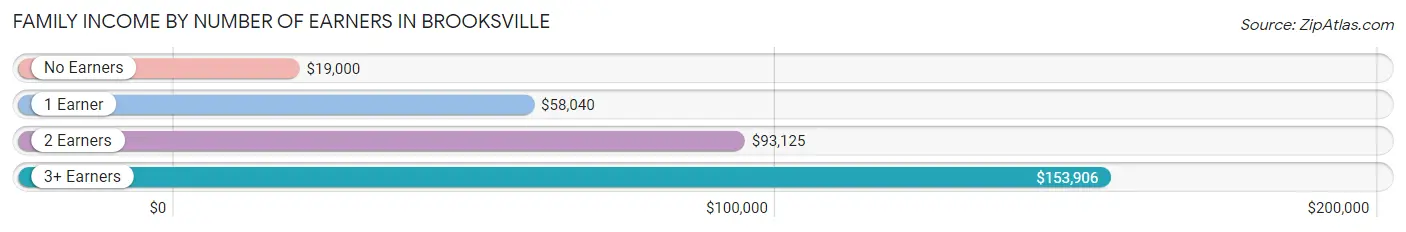
| Number of Earners | # Families | Median Income |
| No Earners | 38 (20.4%) | $19,000 |
| 1 Earner | 77 (41.4%) | $58,040 |
| 2 Earners | 35 (18.8%) | $93,125 |
| 3+ Earners | 36 (19.4%) | $153,906 |
| Total | 186 (100.0%) | $58,807 |
Household Income in Brooksville
Household Income Brackets in Brooksville
With 66 households falling in the category, the $50,000 to $74,999 income range is the most frequent in Brooksville, accounting for 23.9% of all households.
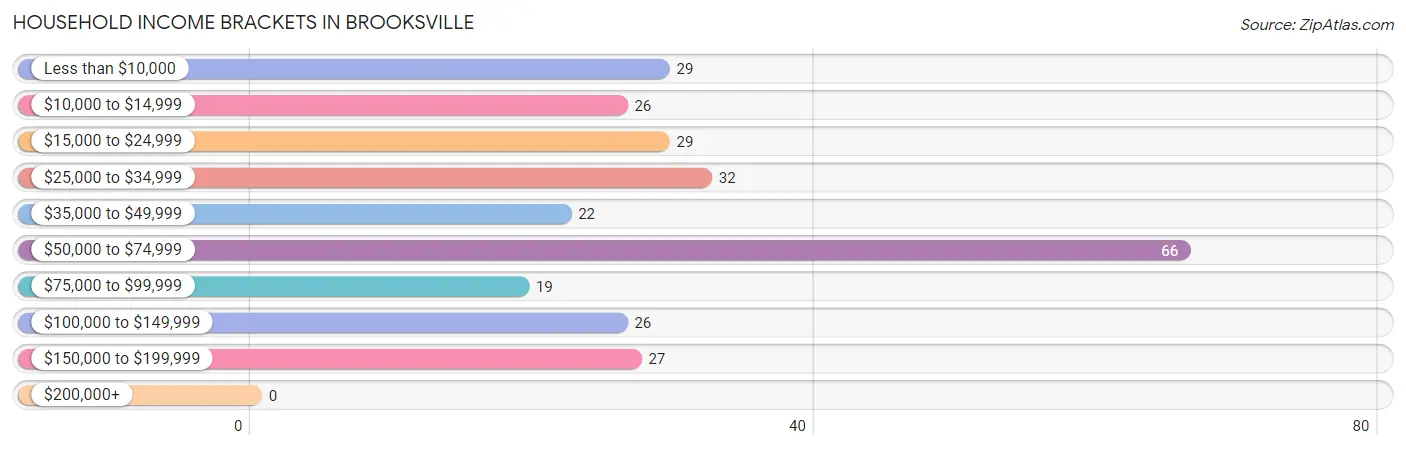
| Income Bracket | # Households | % Households |
| Less than $10,000 | 29 | 10.5% |
| $10,000 to $14,999 | 26 | 9.4% |
| $15,000 to $24,999 | 29 | 10.5% |
| $25,000 to $34,999 | 32 | 11.6% |
| $35,000 to $49,999 | 22 | 8.0% |
| $50,000 to $74,999 | 66 | 23.9% |
| $75,000 to $99,999 | 19 | 6.9% |
| $100,000 to $149,999 | 26 | 9.4% |
| $150,000 to $199,999 | 27 | 9.8% |
| $200,000+ | 0 | 0.0% |
Household Income by Householder Age in Brooksville
The median household income in Brooksville is $50,000, with the highest median household income of $122,917 found in the 25 to 44 years age bracket for the primary householder. A total of 91 households (33.0%) fall into this category. Meanwhile, the 15 to 24 years age bracket for the primary householder has the lowest median household income of $0, with 44 households (15.9%) in this group.
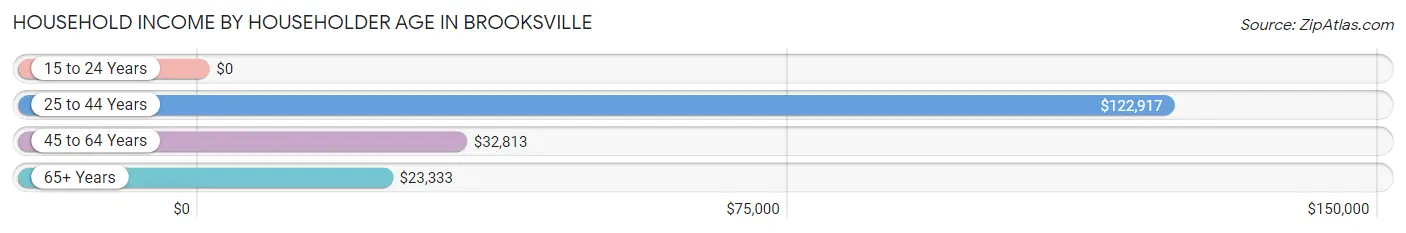
| Income Bracket | # Households | Median Income |
| 15 to 24 Years | 44 (15.9%) | $0 |
| 25 to 44 Years | 91 (33.0%) | $122,917 |
| 45 to 64 Years | 57 (20.6%) | $32,813 |
| 65+ Years | 84 (30.4%) | $23,333 |
| Total | 276 (100.0%) | $50,000 |
Poverty in Brooksville
Income Below Poverty by Sex and Age in Brooksville
With 24.2% poverty level for males and 24.9% for females among the residents of Brooksville, 16 and 17 year old males and 15 year old females are the most vulnerable to poverty, with 8 males (100.0%) and 17 females (100.0%) in their respective age groups living below the poverty level.
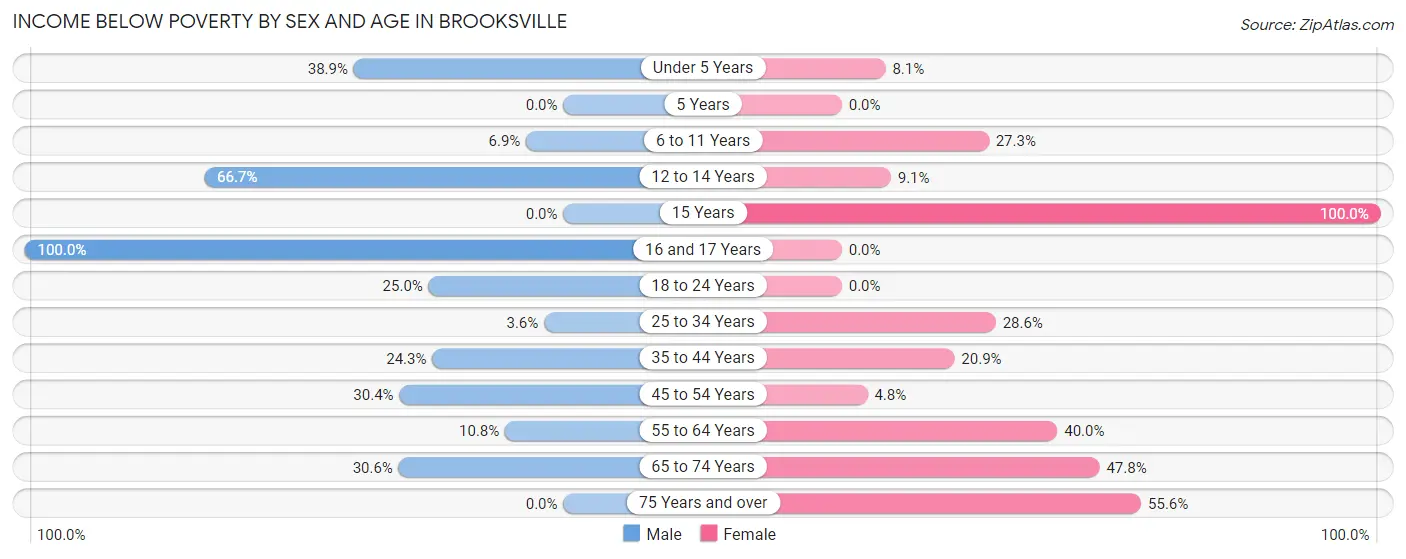
| Age Bracket | Male | Female |
| Under 5 Years | 7 (38.9%) | 6 (8.1%) |
| 5 Years | 0 (0.0%) | 0 (0.0%) |
| 6 to 11 Years | 2 (6.9%) | 9 (27.3%) |
| 12 to 14 Years | 22 (66.7%) | 3 (9.1%) |
| 15 Years | 0 (0.0%) | 17 (100.0%) |
| 16 and 17 Years | 8 (100.0%) | 0 (0.0%) |
| 18 to 24 Years | 6 (25.0%) | 0 (0.0%) |
| 25 to 34 Years | 2 (3.6%) | 8 (28.6%) |
| 35 to 44 Years | 9 (24.3%) | 14 (20.9%) |
| 45 to 54 Years | 7 (30.4%) | 1 (4.8%) |
| 55 to 64 Years | 4 (10.8%) | 16 (40.0%) |
| 65 to 74 Years | 11 (30.6%) | 22 (47.8%) |
| 75 Years and over | 0 (0.0%) | 10 (55.6%) |
| Total | 78 (24.2%) | 106 (24.9%) |
Income Above Poverty by Sex and Age in Brooksville
According to the poverty statistics in Brooksville, males aged 5 years and females aged 16 and 17 years are the age groups that are most secure financially, with 100.0% of males and 100.0% of females in these age groups living above the poverty line.
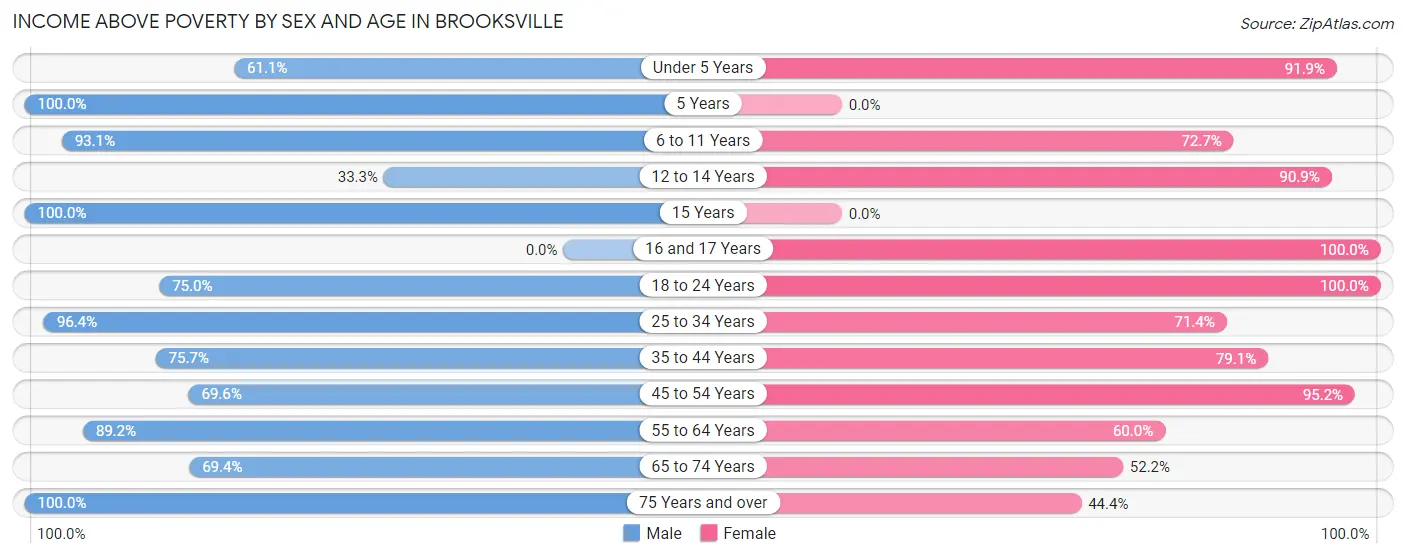
| Age Bracket | Male | Female |
| Under 5 Years | 11 (61.1%) | 68 (91.9%) |
| 5 Years | 3 (100.0%) | 0 (0.0%) |
| 6 to 11 Years | 27 (93.1%) | 24 (72.7%) |
| 12 to 14 Years | 11 (33.3%) | 30 (90.9%) |
| 15 Years | 4 (100.0%) | 0 (0.0%) |
| 16 and 17 Years | 0 (0.0%) | 5 (100.0%) |
| 18 to 24 Years | 18 (75.0%) | 44 (100.0%) |
| 25 to 34 Years | 54 (96.4%) | 20 (71.4%) |
| 35 to 44 Years | 28 (75.7%) | 53 (79.1%) |
| 45 to 54 Years | 16 (69.6%) | 20 (95.2%) |
| 55 to 64 Years | 33 (89.2%) | 24 (60.0%) |
| 65 to 74 Years | 25 (69.4%) | 24 (52.2%) |
| 75 Years and over | 14 (100.0%) | 8 (44.4%) |
| Total | 244 (75.8%) | 320 (75.1%) |
Income Below Poverty Among Married-Couple Families in Brooksville
The poverty statistics for married-couple families in Brooksville show that 10.6% or 14 of the total 132 families live below the poverty line. Families with 5 or more children have the highest poverty rate of 100.0%, comprising of 5 families. On the other hand, families with 1 or 2 children have the lowest poverty rate of 0.0%, which includes 0 families.
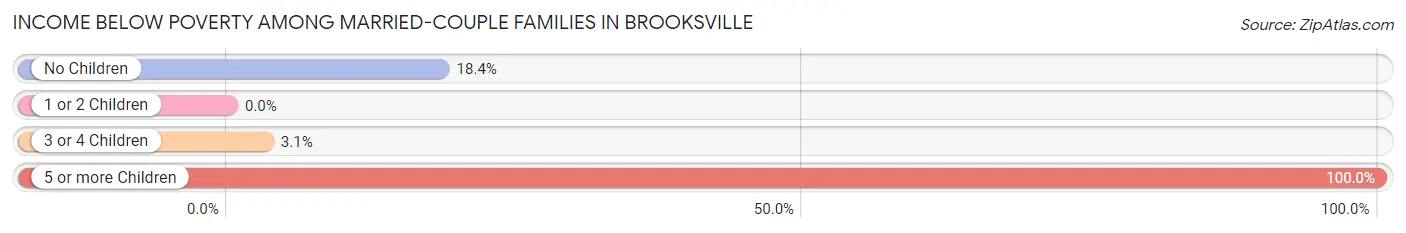
| Children | Above Poverty | Below Poverty |
| No Children | 31 (81.6%) | 7 (18.4%) |
| 1 or 2 Children | 25 (100.0%) | 0 (0.0%) |
| 3 or 4 Children | 62 (96.9%) | 2 (3.1%) |
| 5 or more Children | 0 (0.0%) | 5 (100.0%) |
| Total | 118 (89.4%) | 14 (10.6%) |
Income Below Poverty Among Single-Parent Households in Brooksville
According to the poverty data in Brooksville, 13.3% or 2 single-father households and 53.8% or 21 single-mother households are living below the poverty line. Among single-father households, those with 1 or 2 children have the highest poverty rate, with 2 households (40.0%) experiencing poverty. Likewise, among single-mother households, those with 3 or 4 children have the highest poverty rate, with 5 households (100.0%) falling below the poverty line.
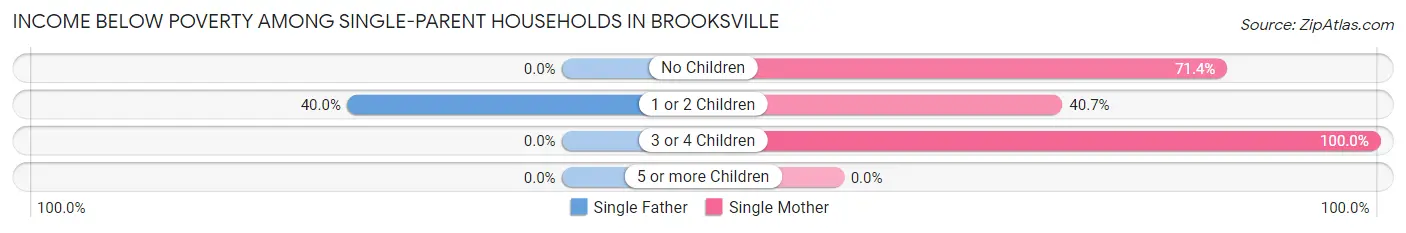
| Children | Single Father | Single Mother |
| No Children | 0 (0.0%) | 5 (71.4%) |
| 1 or 2 Children | 2 (40.0%) | 11 (40.7%) |
| 3 or 4 Children | 0 (0.0%) | 5 (100.0%) |
| 5 or more Children | 0 (0.0%) | 0 (0.0%) |
| Total | 2 (13.3%) | 21 (53.8%) |
Income Below Poverty Among Married-Couple vs Single-Parent Households in Brooksville
The poverty data for Brooksville shows that 14 of the married-couple family households (10.6%) and 23 of the single-parent households (42.6%) are living below the poverty level. Within the married-couple family households, those with 5 or more children have the highest poverty rate, with 5 households (100.0%) falling below the poverty line. Among the single-parent households, those with 3 or 4 children have the highest poverty rate, with 5 household (100.0%) living below poverty.
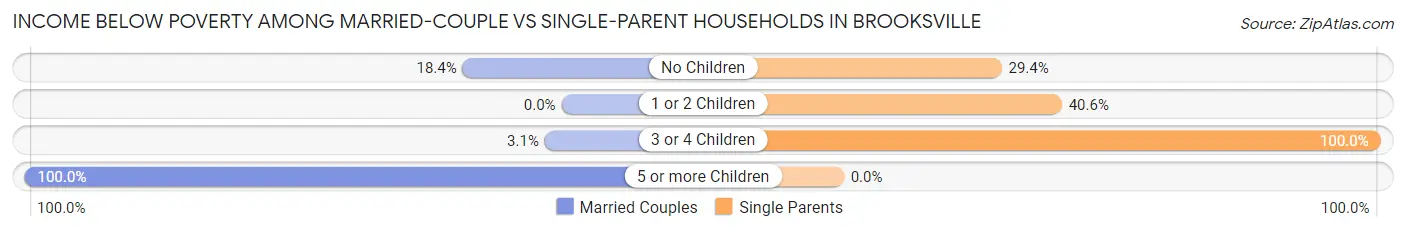
| Children | Married-Couple Families | Single-Parent Households |
| No Children | 7 (18.4%) | 5 (29.4%) |
| 1 or 2 Children | 0 (0.0%) | 13 (40.6%) |
| 3 or 4 Children | 2 (3.1%) | 5 (100.0%) |
| 5 or more Children | 5 (100.0%) | 0 (0.0%) |
| Total | 14 (10.6%) | 23 (42.6%) |
Race in Brooksville
The most populous races in Brooksville are White / Caucasian (739 | 96.7%), Asian (14 | 1.8%), and Two or more Races (10 | 1.3%).
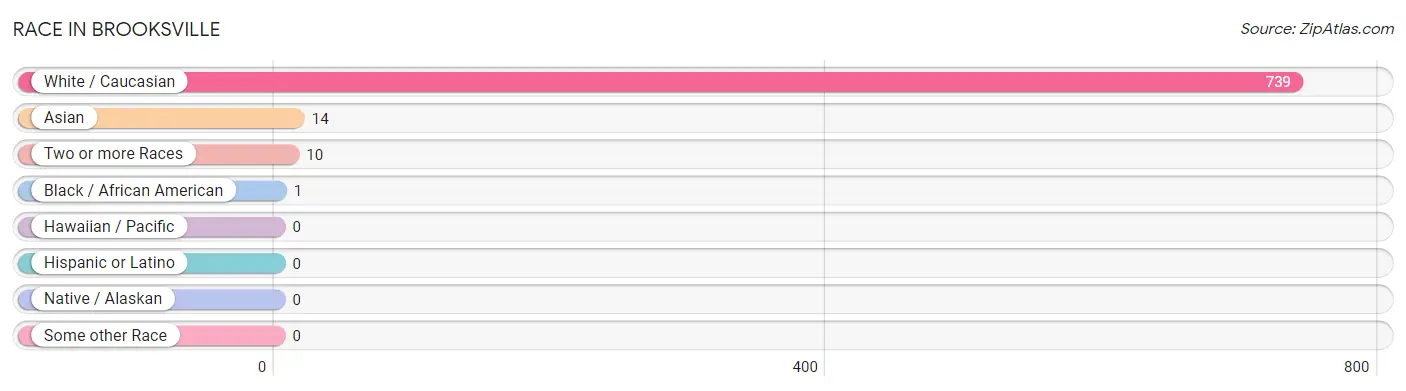
| Race | # Population | % Population |
| Asian | 14 | 1.8% |
| Black / African American | 1 | 0.1% |
| Hawaiian / Pacific | 0 | 0.0% |
| Hispanic or Latino | 0 | 0.0% |
| Native / Alaskan | 0 | 0.0% |
| White / Caucasian | 739 | 96.7% |
| Two or more Races | 10 | 1.3% |
| Some other Race | 0 | 0.0% |
| Total | 764 | 100.0% |
Ancestry in Brooksville
The most populous ancestries reported in Brooksville are American (204 | 26.7%), German (166 | 21.7%), English (83 | 10.9%), Irish (41 | 5.4%), and British (14 | 1.8%), together accounting for 66.5% of all Brooksville residents.
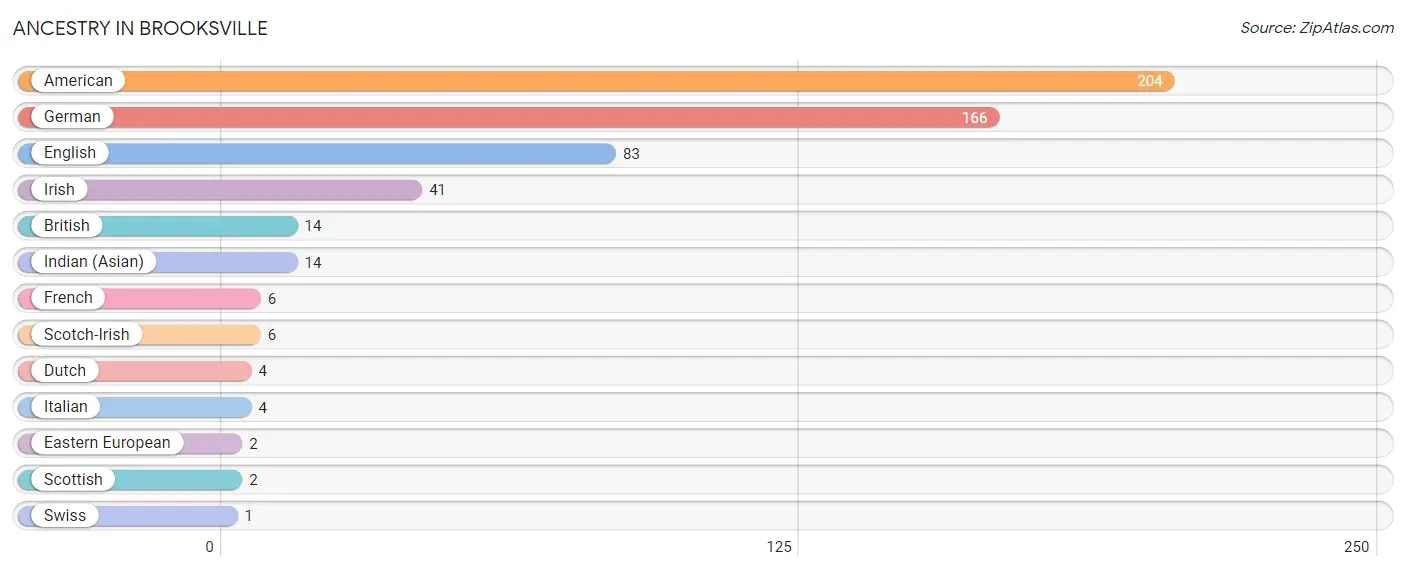
| Ancestry | # Population | % Population |
| American | 204 | 26.7% |
| British | 14 | 1.8% |
| Dutch | 4 | 0.5% |
| Eastern European | 2 | 0.3% |
| English | 83 | 10.9% |
| French | 6 | 0.8% |
| German | 166 | 21.7% |
| Indian (Asian) | 14 | 1.8% |
| Irish | 41 | 5.4% |
| Italian | 4 | 0.5% |
| Scotch-Irish | 6 | 0.8% |
| Scottish | 2 | 0.3% |
| Swiss | 1 | 0.1% | View All 13 Rows |
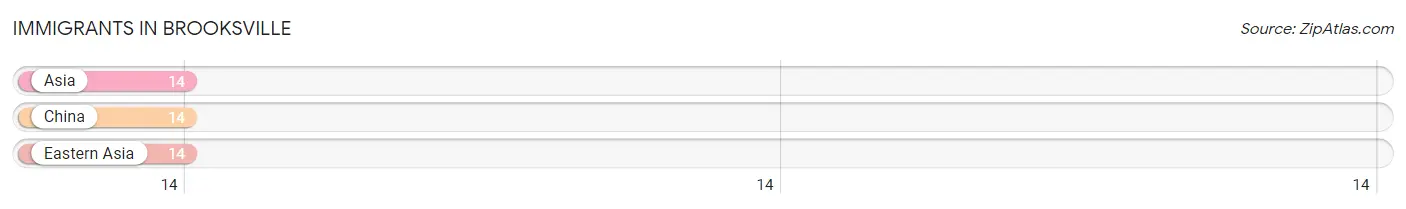
Immigrants in Brooksville
The most numerous immigrant groups reported in Brooksville came from Asia (14 | 1.8%), China (14 | 1.8%), and Eastern Asia (14 | 1.8%), together accounting for 5.5% of all Brooksville residents.
| Immigration Origin | # Population | % Population |
| Asia | 14 | 1.8% |
| China | 14 | 1.8% |
| Eastern Asia | 14 | 1.8% | View All 3 Rows |
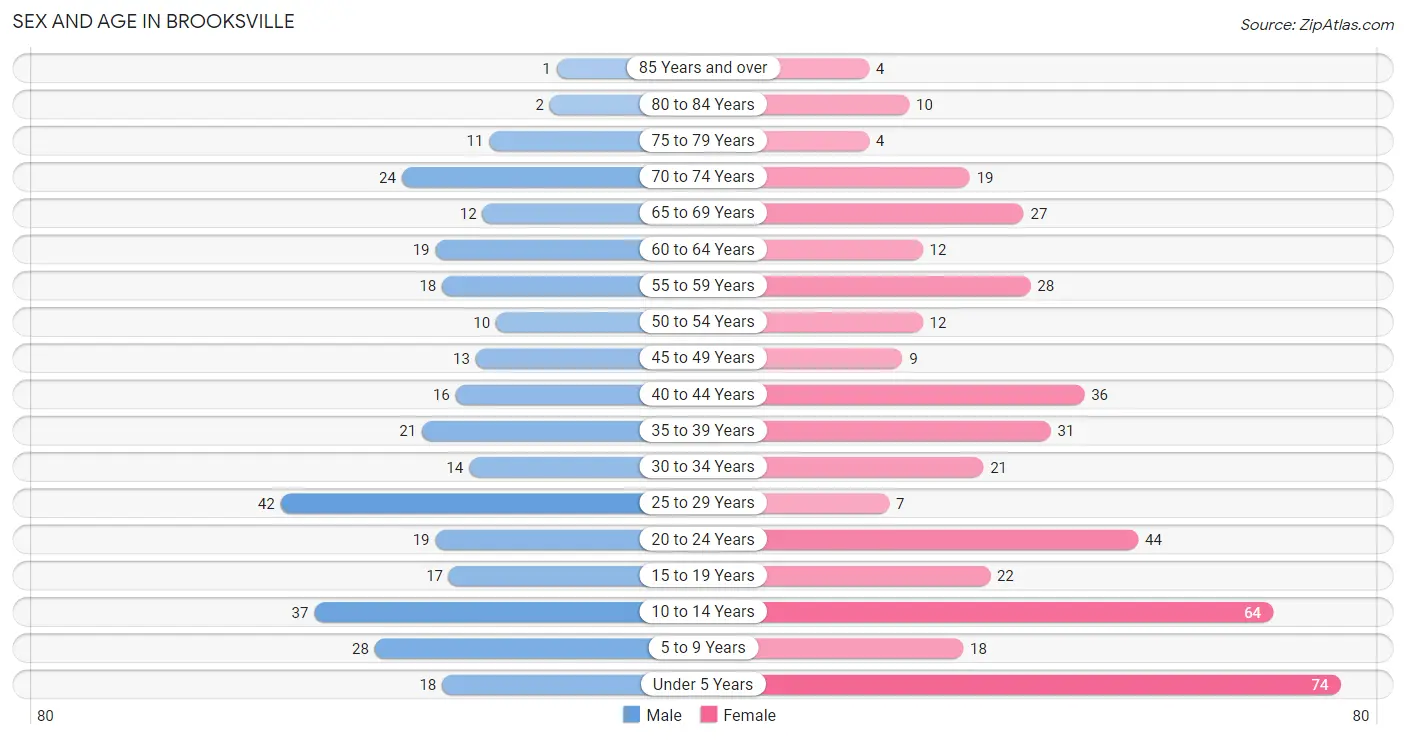
Sex and Age in Brooksville
Sex and Age in Brooksville
The most populous age groups in Brooksville are 25 to 29 Years (42 | 13.0%) for men and Under 5 Years (74 | 16.7%) for women.
| Age Bracket | Male | Female |
| Under 5 Years | 18 (5.6%) | 74 (16.7%) |
| 5 to 9 Years | 28 (8.7%) | 18 (4.1%) |
| 10 to 14 Years | 37 (11.5%) | 64 (14.5%) |
| 15 to 19 Years | 17 (5.3%) | 22 (5.0%) |
| 20 to 24 Years | 19 (5.9%) | 44 (10.0%) |
| 25 to 29 Years | 42 (13.0%) | 7 (1.6%) |
| 30 to 34 Years | 14 (4.3%) | 21 (4.8%) |
| 35 to 39 Years | 21 (6.5%) | 31 (7.0%) |
| 40 to 44 Years | 16 (5.0%) | 36 (8.1%) |
| 45 to 49 Years | 13 (4.0%) | 9 (2.0%) |
| 50 to 54 Years | 10 (3.1%) | 12 (2.7%) |
| 55 to 59 Years | 18 (5.6%) | 28 (6.3%) |
| 60 to 64 Years | 19 (5.9%) | 12 (2.7%) |
| 65 to 69 Years | 12 (3.7%) | 27 (6.1%) |
| 70 to 74 Years | 24 (7.4%) | 19 (4.3%) |
| 75 to 79 Years | 11 (3.4%) | 4 (0.9%) |
| 80 to 84 Years | 2 (0.6%) | 10 (2.3%) |
| 85 Years and over | 1 (0.3%) | 4 (0.9%) |
| Total | 322 (100.0%) | 442 (100.0%) |
Families and Households in Brooksville
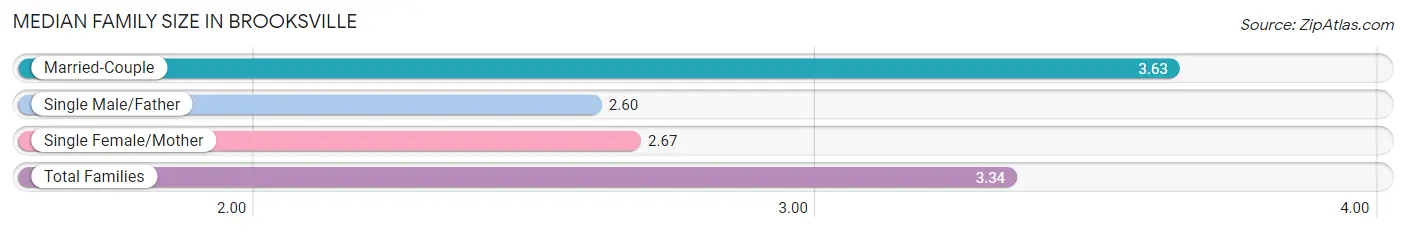
Median Family Size in Brooksville
The median family size in Brooksville is 3.34 persons per family, with married-couple families (132 | 71.0%) accounting for the largest median family size of 3.63 persons per family. On the other hand, single male/father families (15 | 8.1%) represent the smallest median family size with 2.60 persons per family.
| Family Type | # Families | Family Size |
| Married-Couple | 132 (71.0%) | 3.63 |
| Single Male/Father | 15 (8.1%) | 2.60 |
| Single Female/Mother | 39 (21.0%) | 2.67 |
| Total Families | 186 (100.0%) | 3.34 |
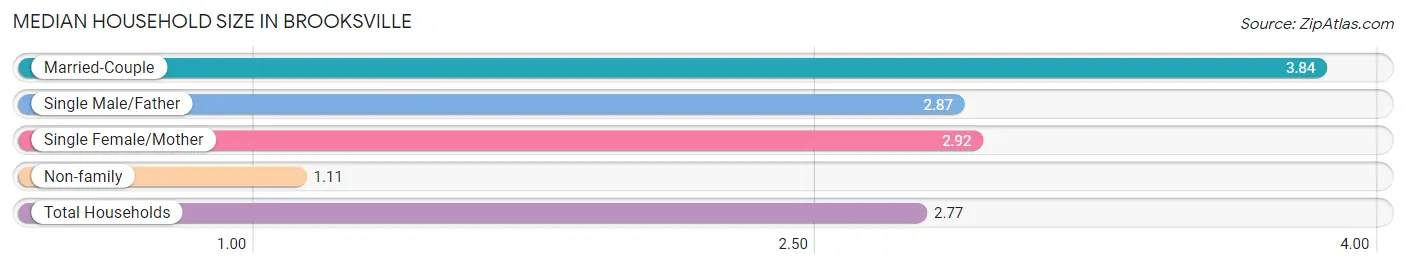
Median Household Size in Brooksville
The median household size in Brooksville is 2.77 persons per household, with married-couple households (132 | 47.8%) accounting for the largest median household size of 3.84 persons per household. non-family households (90 | 32.6%) represent the smallest median household size with 1.11 persons per household.
| Household Type | # Households | Household Size |
| Married-Couple | 132 (47.8%) | 3.84 |
| Single Male/Father | 15 (5.4%) | 2.87 |
| Single Female/Mother | 39 (14.1%) | 2.92 |
| Non-family | 90 (32.6%) | 1.11 |
| Total Households | 276 (100.0%) | 2.77 |
Household Size by Marriage Status in Brooksville
Out of a total of 276 households in Brooksville, 186 (67.4%) are family households, while 90 (32.6%) are nonfamily households. The most numerous type of family households are 2-person households, comprising 61, and the most common type of nonfamily households are 1-person households, comprising 77.
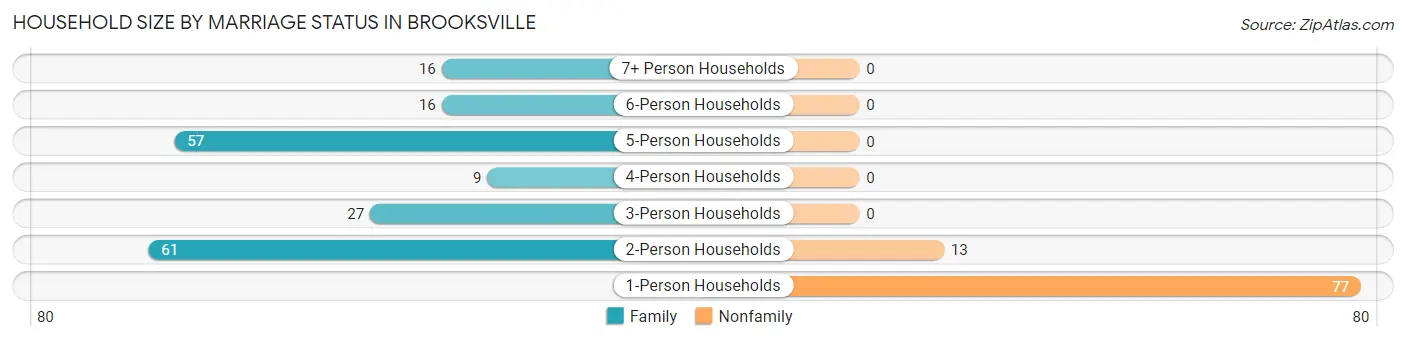
| Household Size | Family Households | Nonfamily Households |
| 1-Person Households | - | 77 (27.9%) |
| 2-Person Households | 61 (22.1%) | 13 (4.7%) |
| 3-Person Households | 27 (9.8%) | 0 (0.0%) |
| 4-Person Households | 9 (3.3%) | 0 (0.0%) |
| 5-Person Households | 57 (20.6%) | 0 (0.0%) |
| 6-Person Households | 16 (5.8%) | 0 (0.0%) |
| 7+ Person Households | 16 (5.8%) | 0 (0.0%) |
| Total | 186 (67.4%) | 90 (32.6%) |
Female Fertility in Brooksville
Fertility by Age in Brooksville
Average fertility rate in Brooksville is 6.0 births per 1,000 women. Women in the age bracket of 35 to 50 years have the highest fertility rate with 13.0 births per 1,000 women. Women in the age bracket of 35 to 50 years acount for 100.0% of all women with births.
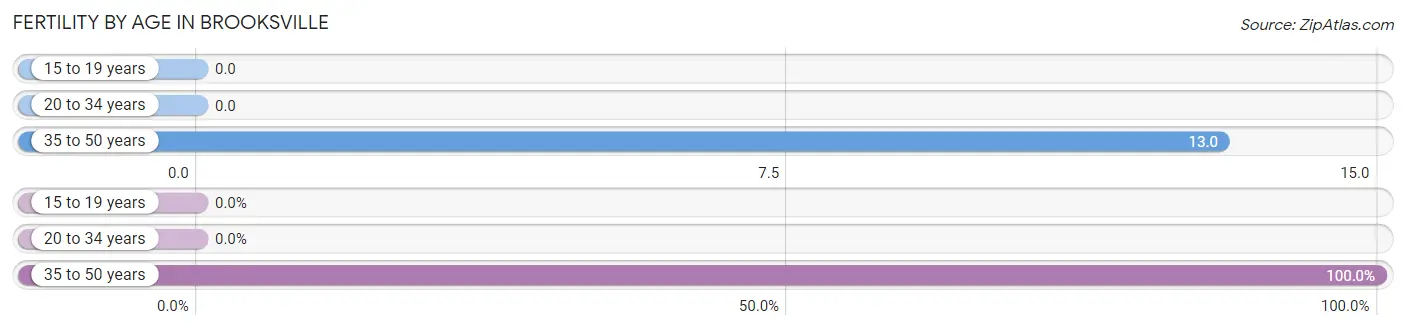
| Age Bracket | Women with Births | Births / 1,000 Women |
| 15 to 19 years | 0 (0.0%) | 0.0 |
| 20 to 34 years | 0 (0.0%) | 0.0 |
| 35 to 50 years | 1 (100.0%) | 13.0 |
| Total | 1 (100.0%) | 6.0 |
Fertility by Age by Marriage Status in Brooksville
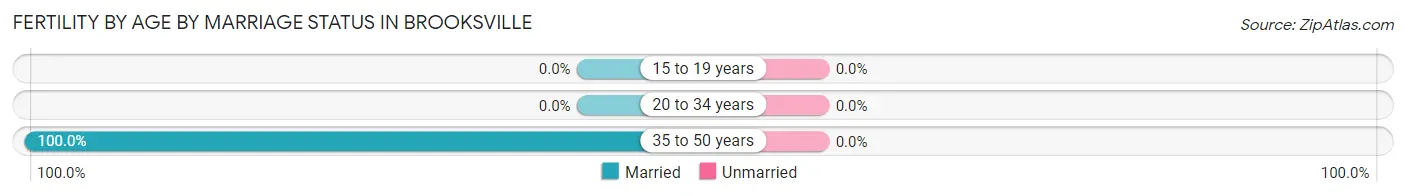
| Age Bracket | Married | Unmarried |
| 15 to 19 years | 0 (0.0%) | 0 (0.0%) |
| 20 to 34 years | 0 (0.0%) | 0 (0.0%) |
| 35 to 50 years | 1 (100.0%) | 0 (0.0%) |
| Total | 1 (100.0%) | 0 (0.0%) |
Fertility by Education in Brooksville
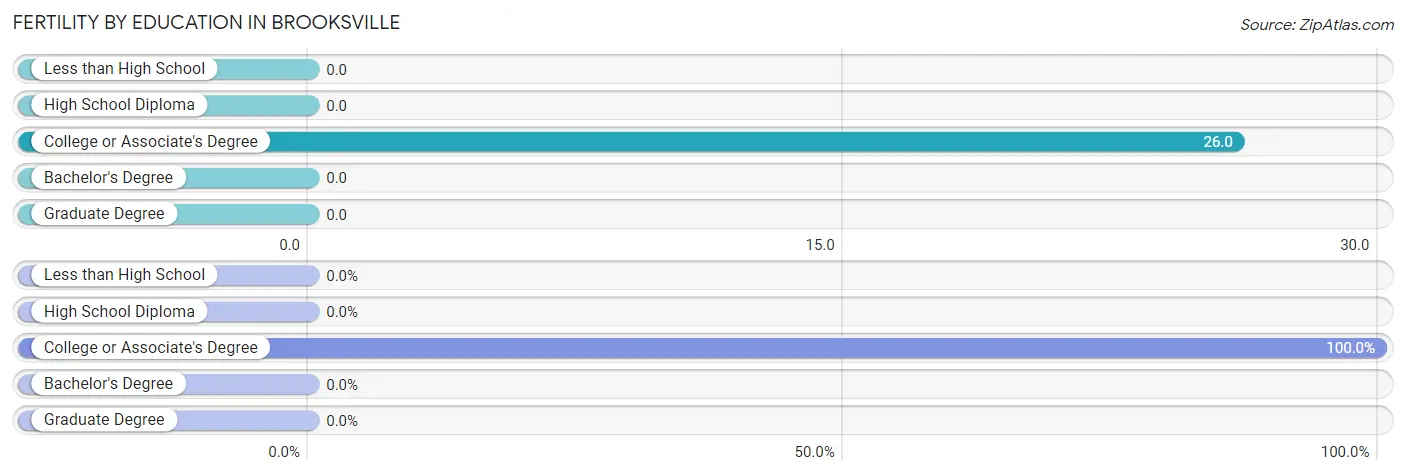
| Educational Attainment | Women with Births | Births / 1,000 Women |
| Less than High School | 0 (0.0%) | 0.0 |
| High School Diploma | 0 (0.0%) | 0.0 |
| College or Associate's Degree | 1 (100.0%) | 26.0 |
| Bachelor's Degree | 0 (0.0%) | 0.0 |
| Graduate Degree | 0 (0.0%) | 0.0 |
| Total | 1 (100.0%) | 6.0 |
Fertility by Education by Marriage Status in Brooksville
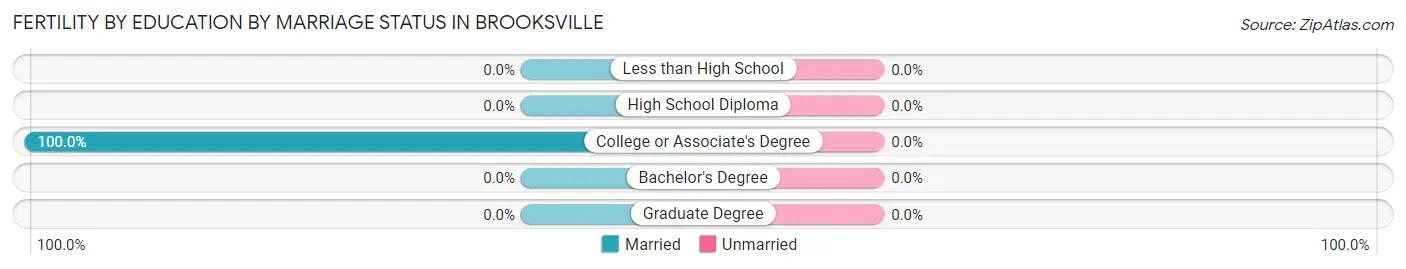
| Educational Attainment | Married | Unmarried |
| Less than High School | 0 (0.0%) | 0 (0.0%) |
| High School Diploma | 0 (0.0%) | 0 (0.0%) |
| College or Associate's Degree | 1 (100.0%) | 0 (0.0%) |
| Bachelor's Degree | 0 (0.0%) | 0 (0.0%) |
| Graduate Degree | 0 (0.0%) | 0 (0.0%) |
| Total | 1 (100.0%) | 0 (0.0%) |
Employment Characteristics in Brooksville
Employment by Class of Employer in Brooksville
Among the 252 employed individuals in Brooksville, private company employees (173 | 68.6%), local government employees (20 | 7.9%), and state government employees (20 | 7.9%) make up the most common classes of employment.
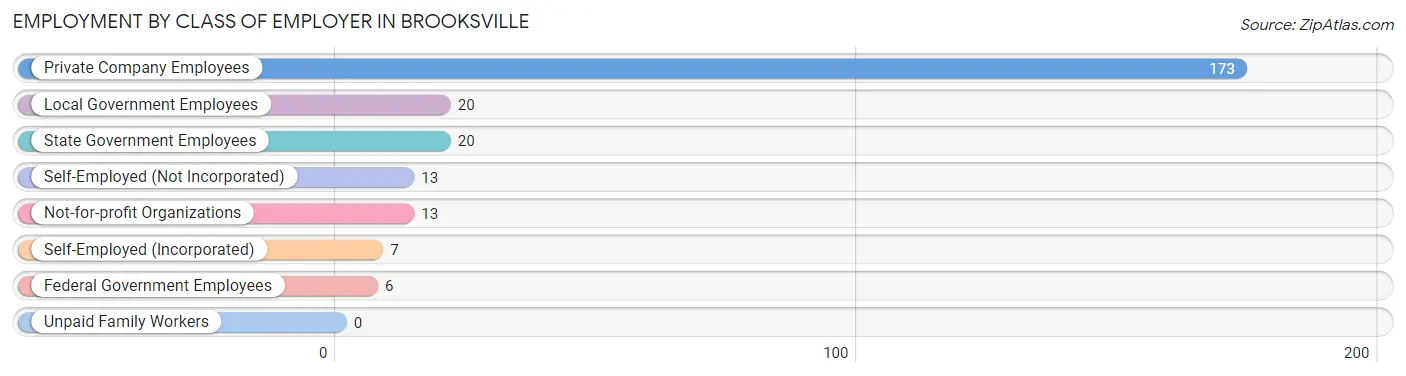
| Employer Class | # Employees | % Employees |
| Private Company Employees | 173 | 68.6% |
| Self-Employed (Incorporated) | 7 | 2.8% |
| Self-Employed (Not Incorporated) | 13 | 5.2% |
| Not-for-profit Organizations | 13 | 5.2% |
| Local Government Employees | 20 | 7.9% |
| State Government Employees | 20 | 7.9% |
| Federal Government Employees | 6 | 2.4% |
| Unpaid Family Workers | 0 | 0.0% |
| Total | 252 | 100.0% |
Employment Status by Age in Brooksville
According to the labor force statistics for Brooksville, out of the total population over 16 years of age (504), 53.6% or 270 individuals are in the labor force, with 2.2% or 6 of them unemployed. The age group with the highest labor force participation rate is 25 to 29 years, with 100.0% or 49 individuals in the labor force. Within the labor force, the 16 to 19 years age range has the highest percentage of unemployed individuals, with 100.0% or 4 of them being unemployed.
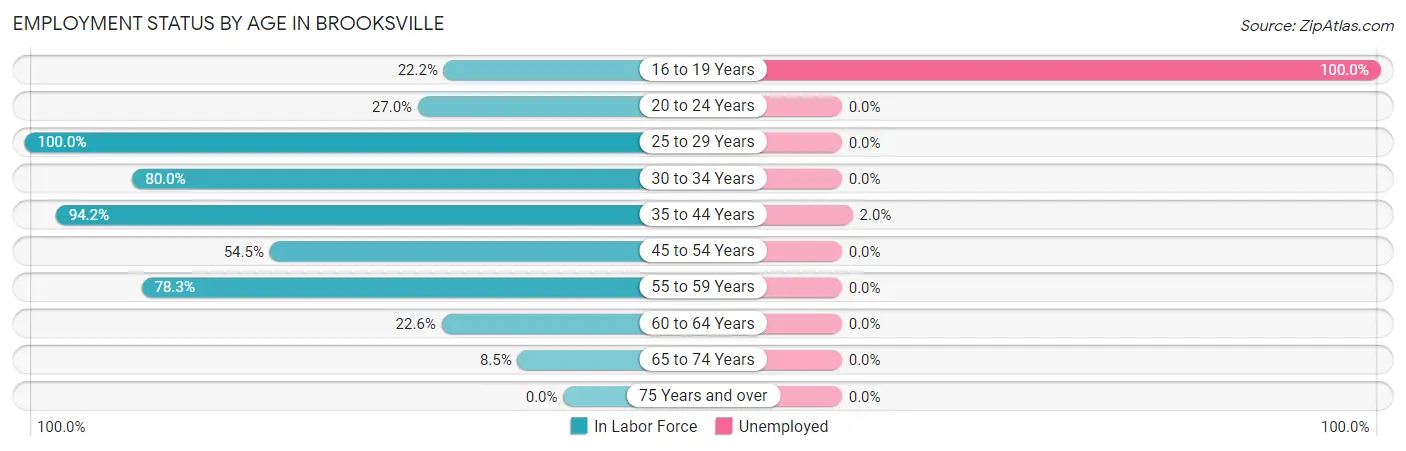
| Age Bracket | In Labor Force | Unemployed |
| 16 to 19 Years | 4 (22.2%) | 4 (100.0%) |
| 20 to 24 Years | 17 (27.0%) | 0 (0.0%) |
| 25 to 29 Years | 49 (100.0%) | 0 (0.0%) |
| 30 to 34 Years | 28 (80.0%) | 0 (0.0%) |
| 35 to 44 Years | 98 (94.2%) | 2 (2.0%) |
| 45 to 54 Years | 24 (54.5%) | 0 (0.0%) |
| 55 to 59 Years | 36 (78.3%) | 0 (0.0%) |
| 60 to 64 Years | 7 (22.6%) | 0 (0.0%) |
| 65 to 74 Years | 7 (8.5%) | 0 (0.0%) |
| 75 Years and over | 0 (0.0%) | 0 (0.0%) |
| Total | 270 (53.6%) | 6 (2.2%) |
Employment Status by Educational Attainment in Brooksville
According to labor force statistics for Brooksville, 78.3% of individuals (242) out of the total population between 25 and 64 years of age (309) are in the labor force, with 0.8% or 2 of them being unemployed. The group with the highest labor force participation rate are those with the educational attainment of bachelor's degree or higher, with 95.8% or 46 individuals in the labor force. Within the labor force, individuals with high school diploma education have the highest percentage of unemployment, with 1.7% or 2 of them being unemployed.
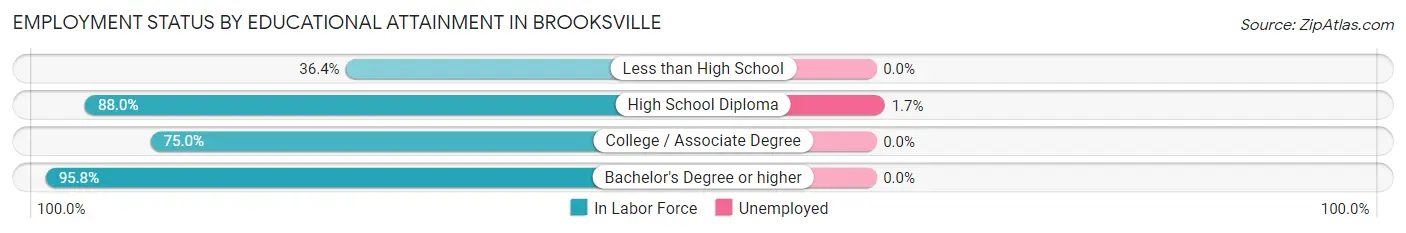
| Educational Attainment | In Labor Force | Unemployed |
| Less than High School | 16 (36.4%) | 0 (0.0%) |
| High School Diploma | 117 (88.0%) | 2 (1.7%) |
| College / Associate Degree | 63 (75.0%) | 0 (0.0%) |
| Bachelor's Degree or higher | 46 (95.8%) | 0 (0.0%) |
| Total | 242 (78.3%) | 2 (0.8%) |
Employment Occupations by Sex in Brooksville
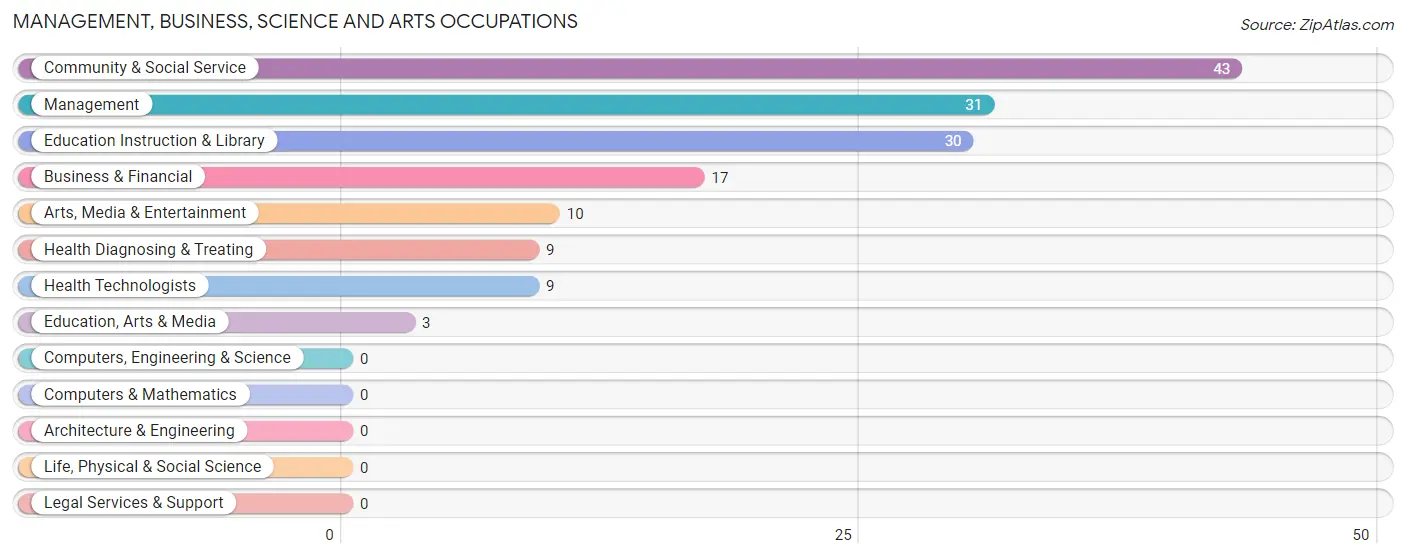
Management, Business, Science and Arts Occupations
The most common Management, Business, Science and Arts occupations in Brooksville are Community & Social Service (43 | 16.3%), Management (31 | 11.7%), Education Instruction & Library (30 | 11.4%), Business & Financial (17 | 6.4%), and Arts, Media & Entertainment (10 | 3.8%).
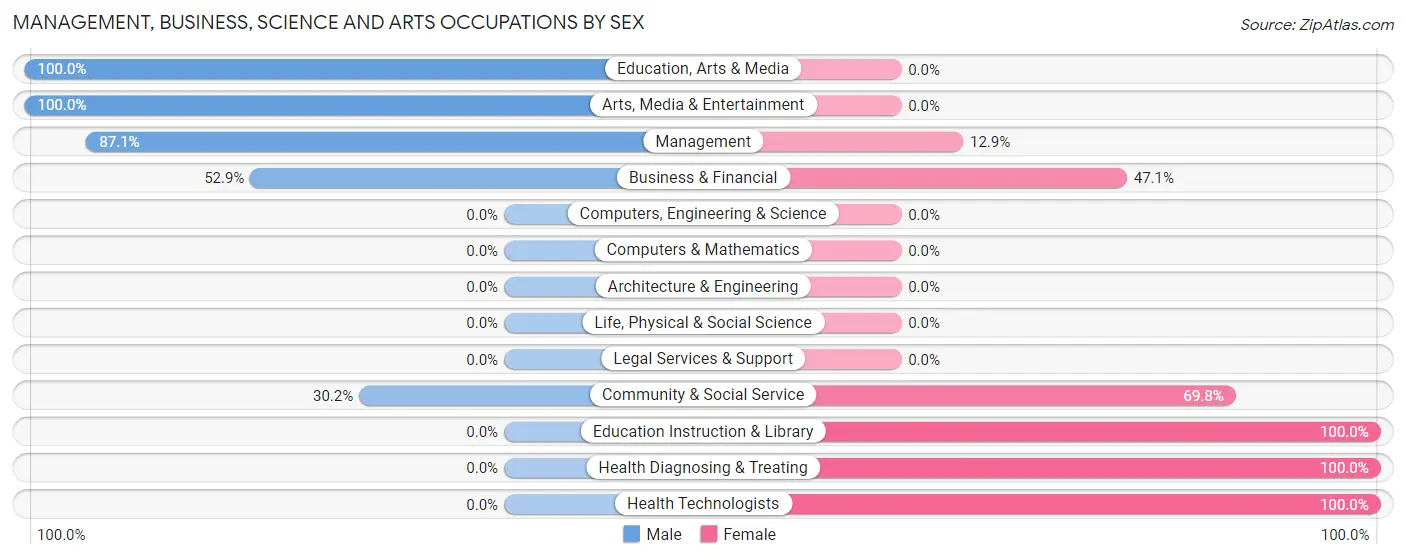
Management, Business, Science and Arts Occupations by Sex
Within the Management, Business, Science and Arts occupations in Brooksville, the most male-oriented occupations are Education, Arts & Media (100.0%), Arts, Media & Entertainment (100.0%), and Management (87.1%), while the most female-oriented occupations are Education Instruction & Library (100.0%), Health Diagnosing & Treating (100.0%), and Health Technologists (100.0%).
| Occupation | Male | Female |
| Management | 27 (87.1%) | 4 (12.9%) |
| Business & Financial | 9 (52.9%) | 8 (47.1%) |
| Computers, Engineering & Science | 0 (0.0%) | 0 (0.0%) |
| Computers & Mathematics | 0 (0.0%) | 0 (0.0%) |
| Architecture & Engineering | 0 (0.0%) | 0 (0.0%) |
| Life, Physical & Social Science | 0 (0.0%) | 0 (0.0%) |
| Community & Social Service | 13 (30.2%) | 30 (69.8%) |
| Education, Arts & Media | 3 (100.0%) | 0 (0.0%) |
| Legal Services & Support | 0 (0.0%) | 0 (0.0%) |
| Education Instruction & Library | 0 (0.0%) | 30 (100.0%) |
| Arts, Media & Entertainment | 10 (100.0%) | 0 (0.0%) |
| Health Diagnosing & Treating | 0 (0.0%) | 9 (100.0%) |
| Health Technologists | 0 (0.0%) | 9 (100.0%) |
| Total (Category) | 49 (49.0%) | 51 (51.0%) |
| Total (Overall) | 138 (52.3%) | 126 (47.7%) |
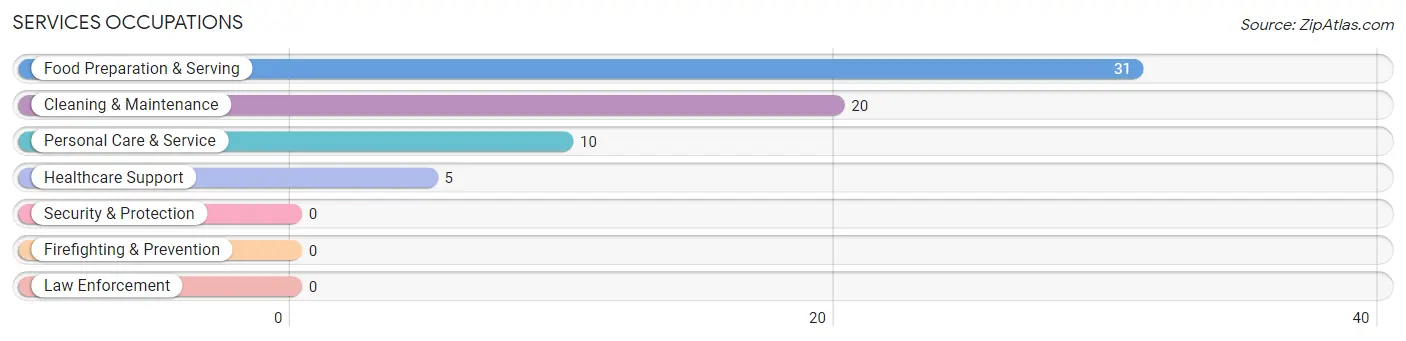
Services Occupations
The most common Services occupations in Brooksville are Food Preparation & Serving (31 | 11.7%), Cleaning & Maintenance (20 | 7.6%), Personal Care & Service (10 | 3.8%), and Healthcare Support (5 | 1.9%).
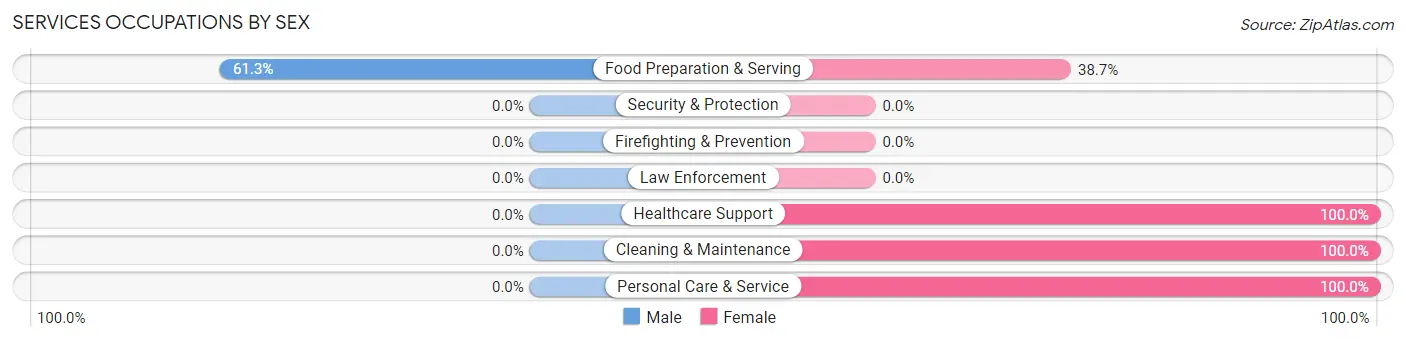
Services Occupations by Sex
| Occupation | Male | Female |
| Healthcare Support | 0 (0.0%) | 5 (100.0%) |
| Security & Protection | 0 (0.0%) | 0 (0.0%) |
| Firefighting & Prevention | 0 (0.0%) | 0 (0.0%) |
| Law Enforcement | 0 (0.0%) | 0 (0.0%) |
| Food Preparation & Serving | 19 (61.3%) | 12 (38.7%) |
| Cleaning & Maintenance | 0 (0.0%) | 20 (100.0%) |
| Personal Care & Service | 0 (0.0%) | 10 (100.0%) |
| Total (Category) | 19 (28.8%) | 47 (71.2%) |
| Total (Overall) | 138 (52.3%) | 126 (47.7%) |
Sales and Office Occupations
The most common Sales and Office occupations in Brooksville are Sales & Related (19 | 7.2%), and Office & Administration (18 | 6.8%).
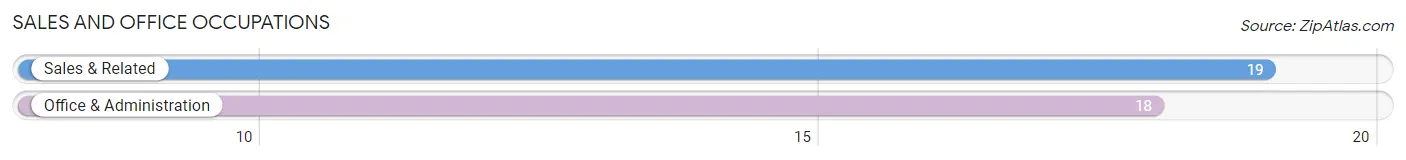
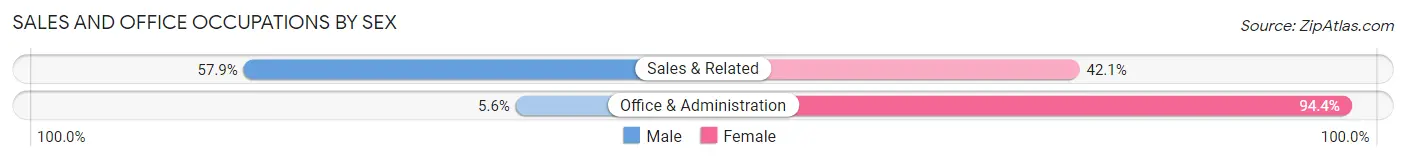
Sales and Office Occupations by Sex
| Occupation | Male | Female |
| Sales & Related | 11 (57.9%) | 8 (42.1%) |
| Office & Administration | 1 (5.6%) | 17 (94.4%) |
| Total (Category) | 12 (32.4%) | 25 (67.6%) |
| Total (Overall) | 138 (52.3%) | 126 (47.7%) |
Natural Resources, Construction and Maintenance Occupations
The most common Natural Resources, Construction and Maintenance occupations in Brooksville are , and Construction & Extraction (6 | 2.3%).
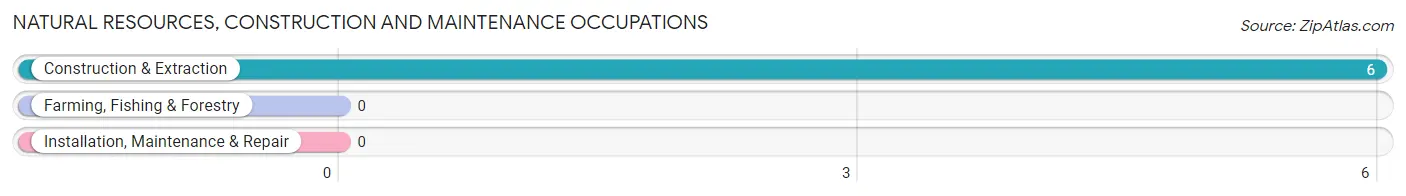
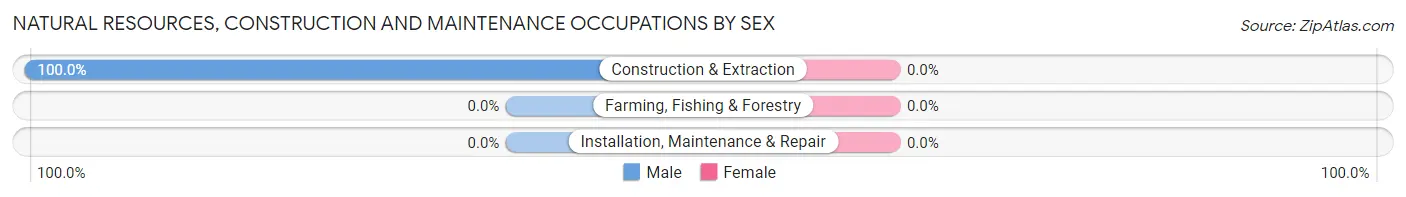
Natural Resources, Construction and Maintenance Occupations by Sex
| Occupation | Male | Female |
| Farming, Fishing & Forestry | 0 (0.0%) | 0 (0.0%) |
| Construction & Extraction | 6 (100.0%) | 0 (0.0%) |
| Installation, Maintenance & Repair | 0 (0.0%) | 0 (0.0%) |
| Total (Category) | 6 (100.0%) | 0 (0.0%) |
| Total (Overall) | 138 (52.3%) | 126 (47.7%) |
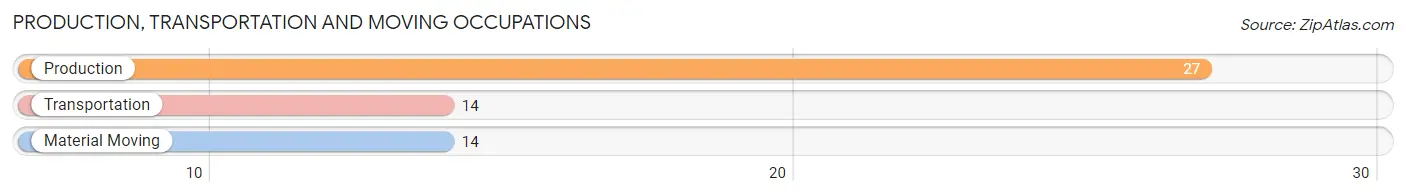
Production, Transportation and Moving Occupations
The most common Production, Transportation and Moving occupations in Brooksville are Production (27 | 10.2%), Transportation (14 | 5.3%), and Material Moving (14 | 5.3%).
Production, Transportation and Moving Occupations by Sex
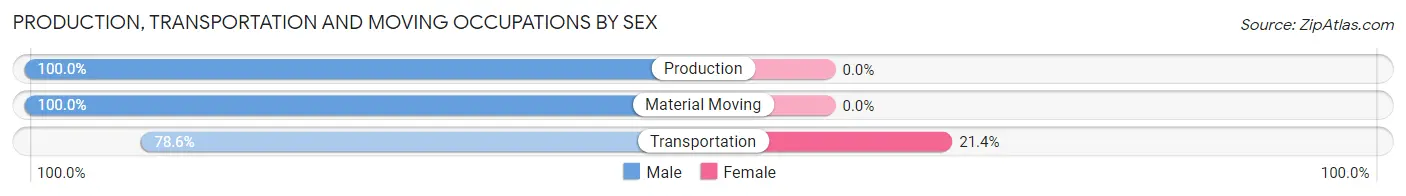
| Occupation | Male | Female |
| Production | 27 (100.0%) | 0 (0.0%) |
| Transportation | 11 (78.6%) | 3 (21.4%) |
| Material Moving | 14 (100.0%) | 0 (0.0%) |
| Total (Category) | 52 (94.6%) | 3 (5.4%) |
| Total (Overall) | 138 (52.3%) | 126 (47.7%) |
Employment Industries by Sex in Brooksville
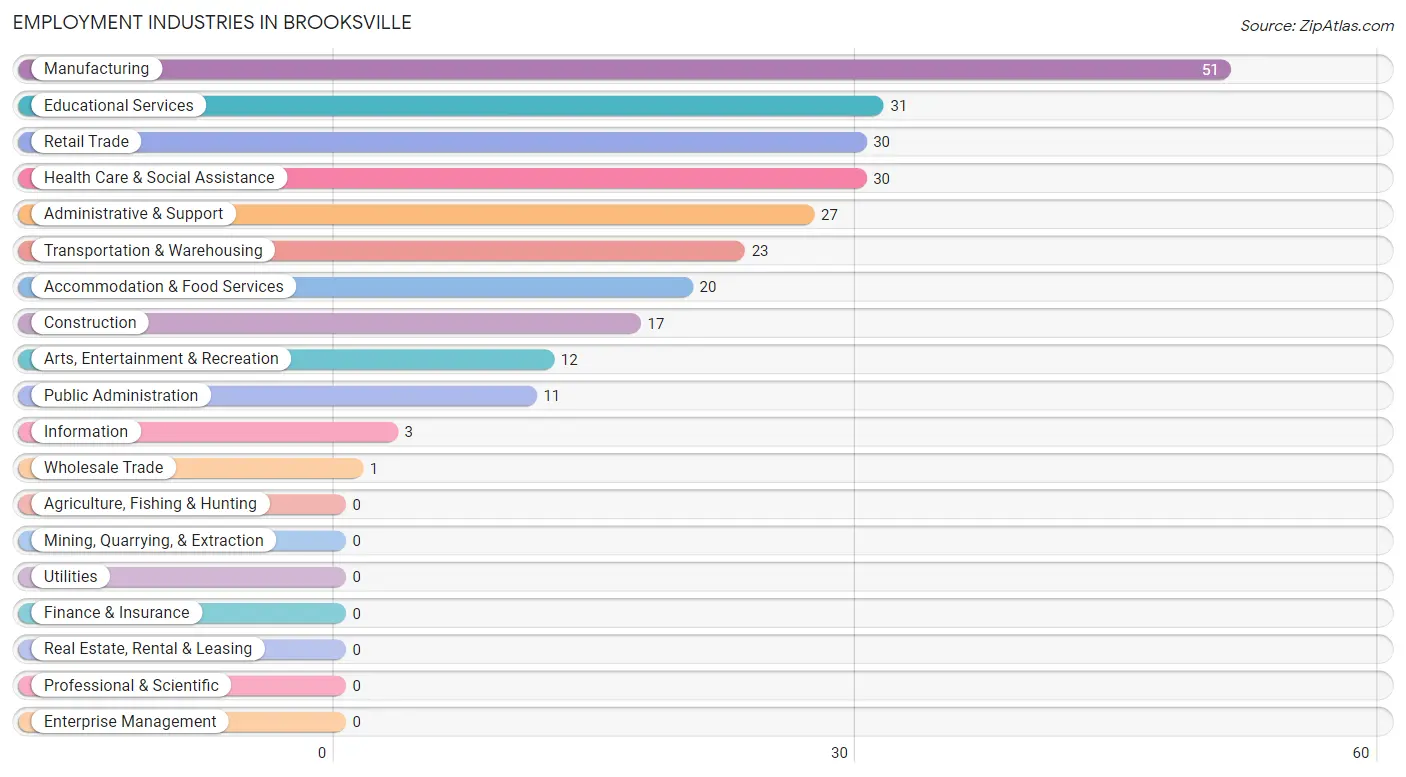
Employment Industries in Brooksville
The major employment industries in Brooksville include Manufacturing (51 | 19.3%), Educational Services (31 | 11.7%), Retail Trade (30 | 11.4%), Health Care & Social Assistance (30 | 11.4%), and Administrative & Support (27 | 10.2%).
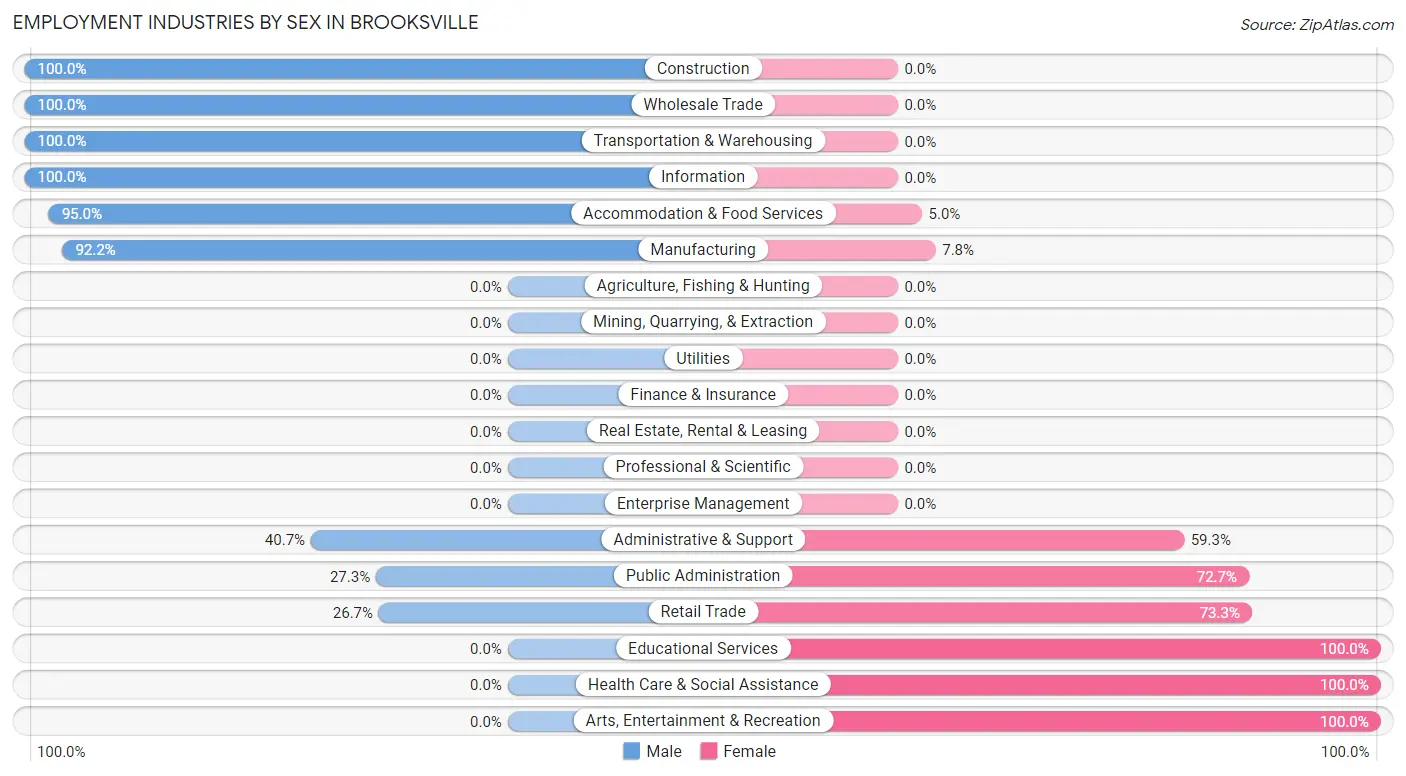
Employment Industries by Sex in Brooksville
The Brooksville industries that see more men than women are Construction (100.0%), Wholesale Trade (100.0%), and Transportation & Warehousing (100.0%), whereas the industries that tend to have a higher number of women are Educational Services (100.0%), Health Care & Social Assistance (100.0%), and Arts, Entertainment & Recreation (100.0%).
| Industry | Male | Female |
| Agriculture, Fishing & Hunting | 0 (0.0%) | 0 (0.0%) |
| Mining, Quarrying, & Extraction | 0 (0.0%) | 0 (0.0%) |
| Construction | 17 (100.0%) | 0 (0.0%) |
| Manufacturing | 47 (92.2%) | 4 (7.8%) |
| Wholesale Trade | 1 (100.0%) | 0 (0.0%) |
| Retail Trade | 8 (26.7%) | 22 (73.3%) |
| Transportation & Warehousing | 23 (100.0%) | 0 (0.0%) |
| Utilities | 0 (0.0%) | 0 (0.0%) |
| Information | 3 (100.0%) | 0 (0.0%) |
| Finance & Insurance | 0 (0.0%) | 0 (0.0%) |
| Real Estate, Rental & Leasing | 0 (0.0%) | 0 (0.0%) |
| Professional & Scientific | 0 (0.0%) | 0 (0.0%) |
| Enterprise Management | 0 (0.0%) | 0 (0.0%) |
| Administrative & Support | 11 (40.7%) | 16 (59.3%) |
| Educational Services | 0 (0.0%) | 31 (100.0%) |
| Health Care & Social Assistance | 0 (0.0%) | 30 (100.0%) |
| Arts, Entertainment & Recreation | 0 (0.0%) | 12 (100.0%) |
| Accommodation & Food Services | 19 (95.0%) | 1 (5.0%) |
| Public Administration | 3 (27.3%) | 8 (72.7%) |
| Total | 138 (52.3%) | 126 (47.7%) |
Education in Brooksville
School Enrollment in Brooksville
The most common levels of schooling among the 199 students in Brooksville are middle school (80 | 40.2%), high school (52 | 26.1%), and elementary school (41 | 20.6%).
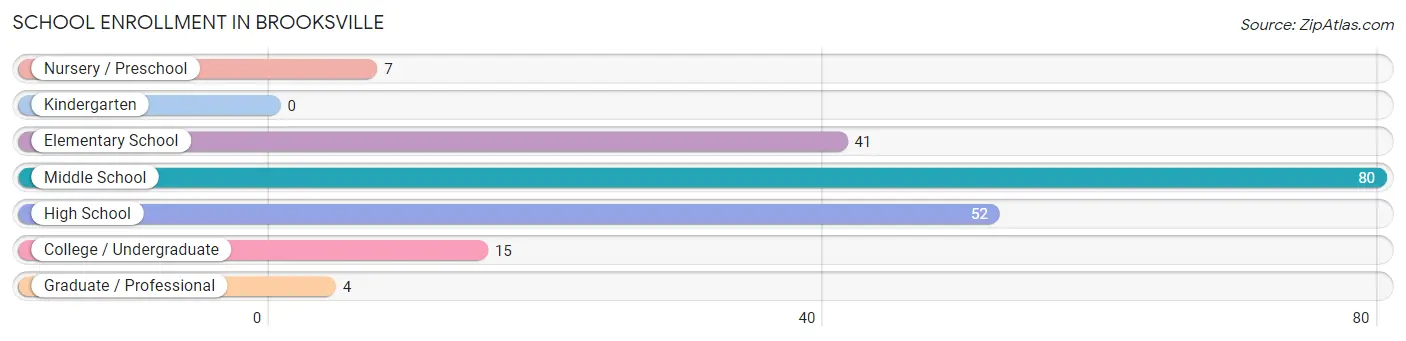
| School Level | # Students | % Students |
| Nursery / Preschool | 7 | 3.5% |
| Kindergarten | 0 | 0.0% |
| Elementary School | 41 | 20.6% |
| Middle School | 80 | 40.2% |
| High School | 52 | 26.1% |
| College / Undergraduate | 15 | 7.5% |
| Graduate / Professional | 4 | 2.0% |
| Total | 199 | 100.0% |
School Enrollment by Age by Funding Source in Brooksville
Out of a total of 199 students who are enrolled in schools in Brooksville, 4 (2.0%) attend a private institution, while the remaining 195 (98.0%) are enrolled in public schools. The age group of 5 to 9 year old has the highest likelihood of being enrolled in private schools, with 3 (6.8% in the age bracket) enrolled. Conversely, the age group of 3 to 4 year olds has the lowest likelihood of being enrolled in a private school, with 4 (100.0% in the age bracket) attending a public institution.
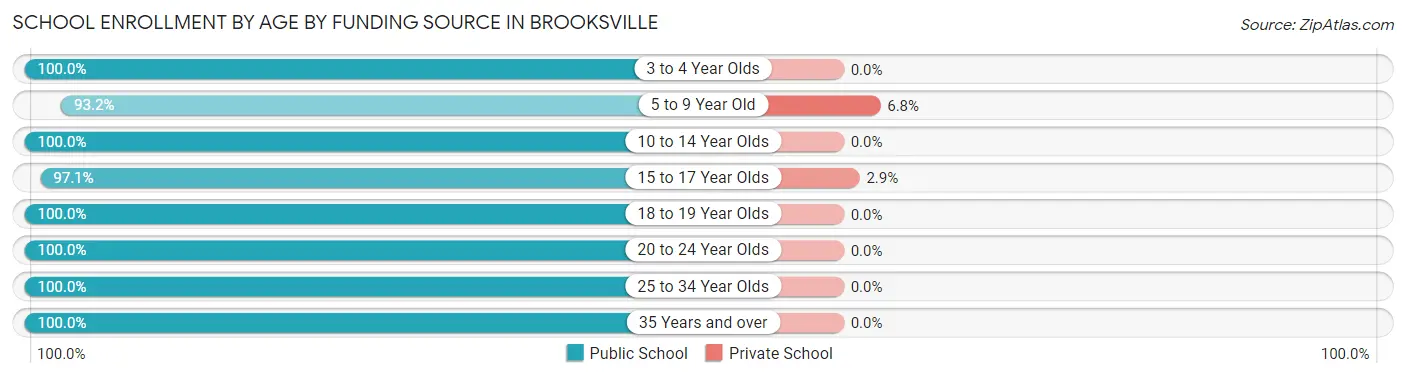
| Age Bracket | Public School | Private School |
| 3 to 4 Year Olds | 4 (100.0%) | 0 (0.0%) |
| 5 to 9 Year Old | 41 (93.2%) | 3 (6.8%) |
| 10 to 14 Year Olds | 98 (100.0%) | 0 (0.0%) |
| 15 to 17 Year Olds | 33 (97.1%) | 1 (2.9%) |
| 18 to 19 Year Olds | 5 (100.0%) | 0 (0.0%) |
| 20 to 24 Year Olds | 7 (100.0%) | 0 (0.0%) |
| 25 to 34 Year Olds | 3 (100.0%) | 0 (0.0%) |
| 35 Years and over | 4 (100.0%) | 0 (0.0%) |
| Total | 195 (98.0%) | 4 (2.0%) |
Educational Attainment by Field of Study in Brooksville
Education (28 | 35.9%), business (11 | 14.1%), psychology (8 | 10.3%), science & technology (7 | 9.0%), and social sciences (5 | 6.4%) are the most common fields of study among 78 individuals in Brooksville who have obtained a bachelor's degree or higher.
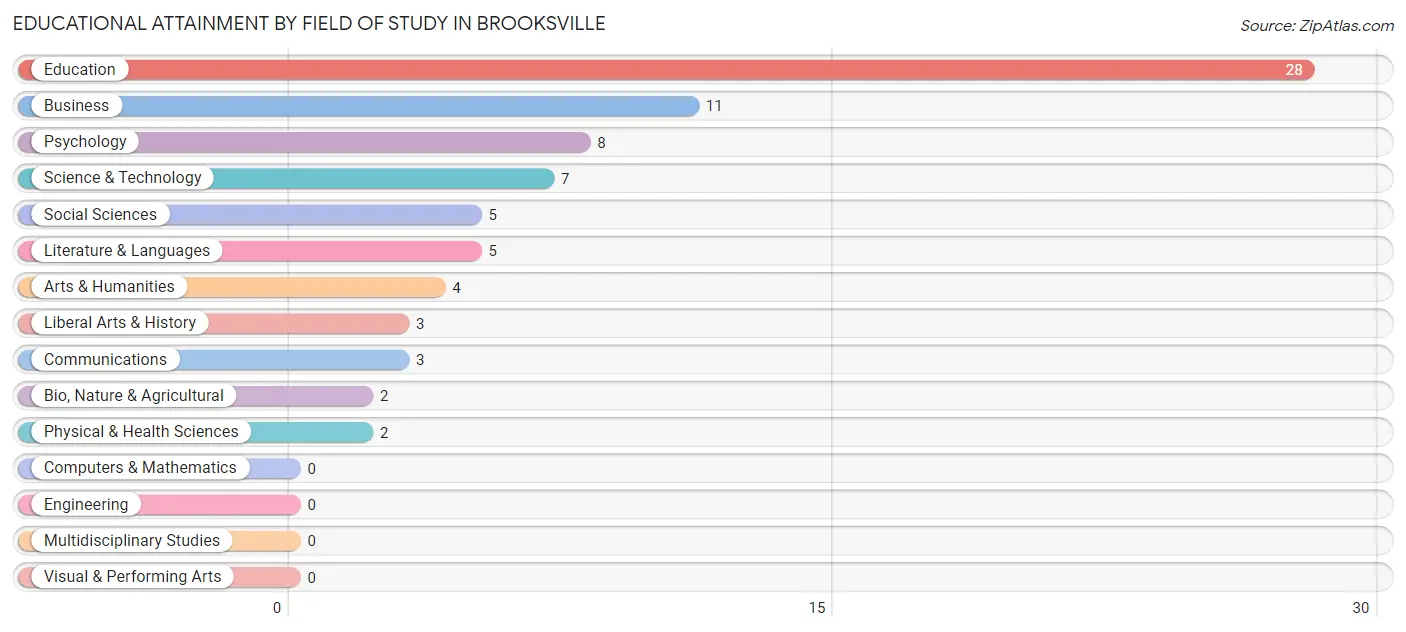
| Field of Study | # Graduates | % Graduates |
| Computers & Mathematics | 0 | 0.0% |
| Bio, Nature & Agricultural | 2 | 2.6% |
| Physical & Health Sciences | 2 | 2.6% |
| Psychology | 8 | 10.3% |
| Social Sciences | 5 | 6.4% |
| Engineering | 0 | 0.0% |
| Multidisciplinary Studies | 0 | 0.0% |
| Science & Technology | 7 | 9.0% |
| Business | 11 | 14.1% |
| Education | 28 | 35.9% |
| Literature & Languages | 5 | 6.4% |
| Liberal Arts & History | 3 | 3.8% |
| Visual & Performing Arts | 0 | 0.0% |
| Communications | 3 | 3.8% |
| Arts & Humanities | 4 | 5.1% |
| Total | 78 | 100.0% |
Transportation & Commute in Brooksville
Vehicle Availability by Sex in Brooksville
The most prevalent vehicle ownership categories in Brooksville are males with 1 vehicle (40, accounting for 29.0%) and females with 1 vehicle (24, making up 35.1%).
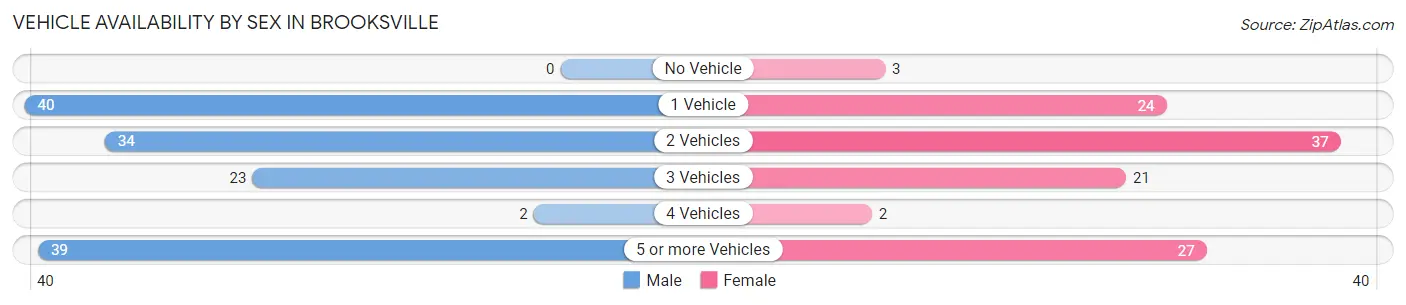
| Vehicles Available | Male | Female |
| No Vehicle | 0 (0.0%) | 3 (2.6%) |
| 1 Vehicle | 40 (29.0%) | 24 (21.0%) |
| 2 Vehicles | 34 (24.6%) | 37 (32.5%) |
| 3 Vehicles | 23 (16.7%) | 21 (18.4%) |
| 4 Vehicles | 2 (1.5%) | 2 (1.8%) |
| 5 or more Vehicles | 39 (28.3%) | 27 (23.7%) |
| Total | 138 (100.0%) | 114 (100.0%) |
Commute Time in Brooksville
The most frequently occuring commute durations in Brooksville are 60 to 89 minutes (44 commuters, 17.7%), 5 to 9 minutes (34 commuters, 13.7%), and less than 5 minutes (32 commuters, 12.9%).
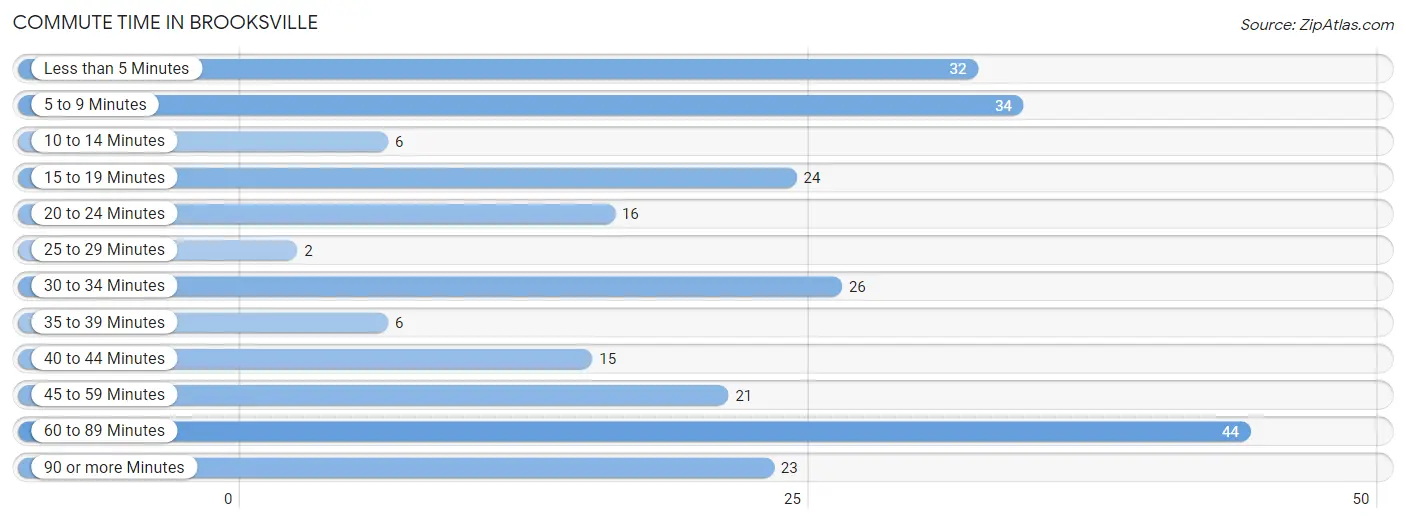
| Commute Time | # Commuters | % Commuters |
| Less than 5 Minutes | 32 | 12.9% |
| 5 to 9 Minutes | 34 | 13.7% |
| 10 to 14 Minutes | 6 | 2.4% |
| 15 to 19 Minutes | 24 | 9.6% |
| 20 to 24 Minutes | 16 | 6.4% |
| 25 to 29 Minutes | 2 | 0.8% |
| 30 to 34 Minutes | 26 | 10.4% |
| 35 to 39 Minutes | 6 | 2.4% |
| 40 to 44 Minutes | 15 | 6.0% |
| 45 to 59 Minutes | 21 | 8.4% |
| 60 to 89 Minutes | 44 | 17.7% |
| 90 or more Minutes | 23 | 9.2% |
Commute Time by Sex in Brooksville
The most common commute times in Brooksville are 60 to 89 minutes (26 commuters, 19.3%) for males and 5 to 9 minutes (28 commuters, 24.6%) for females.
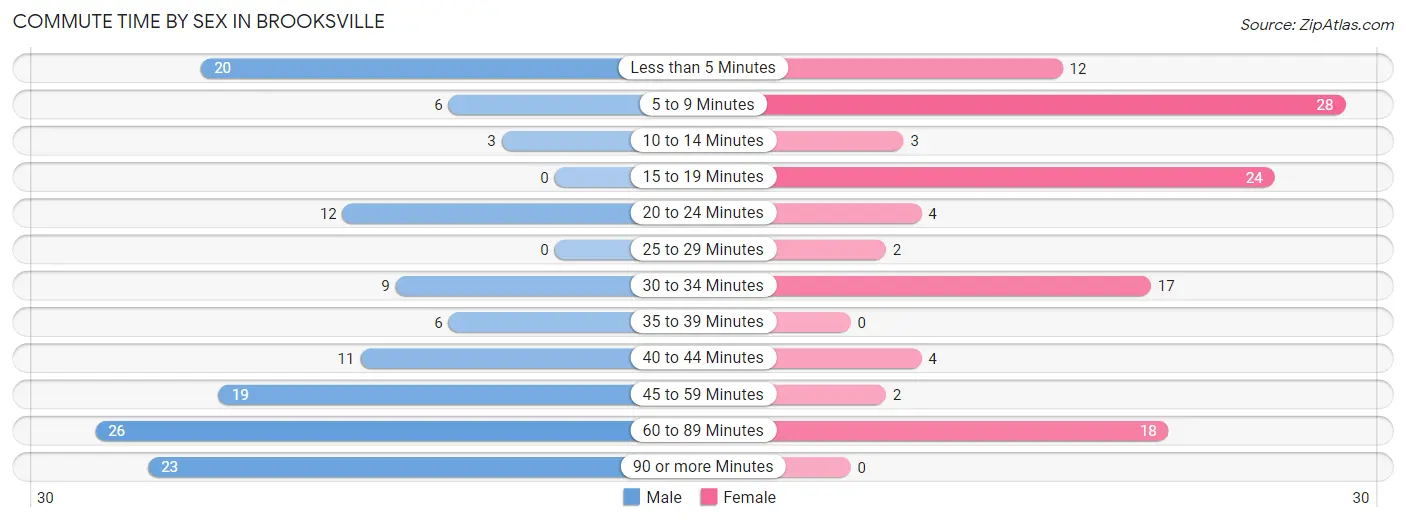
| Commute Time | Male | Female |
| Less than 5 Minutes | 20 (14.8%) | 12 (10.5%) |
| 5 to 9 Minutes | 6 (4.4%) | 28 (24.6%) |
| 10 to 14 Minutes | 3 (2.2%) | 3 (2.6%) |
| 15 to 19 Minutes | 0 (0.0%) | 24 (21.0%) |
| 20 to 24 Minutes | 12 (8.9%) | 4 (3.5%) |
| 25 to 29 Minutes | 0 (0.0%) | 2 (1.8%) |
| 30 to 34 Minutes | 9 (6.7%) | 17 (14.9%) |
| 35 to 39 Minutes | 6 (4.4%) | 0 (0.0%) |
| 40 to 44 Minutes | 11 (8.2%) | 4 (3.5%) |
| 45 to 59 Minutes | 19 (14.1%) | 2 (1.8%) |
| 60 to 89 Minutes | 26 (19.3%) | 18 (15.8%) |
| 90 or more Minutes | 23 (17.0%) | 0 (0.0%) |
Time of Departure to Work by Sex in Brooksville
The most frequent times of departure to work in Brooksville are 7:00 AM to 7:29 AM (36, 26.7%) for males and 7:00 AM to 7:29 AM (39, 34.2%) for females.
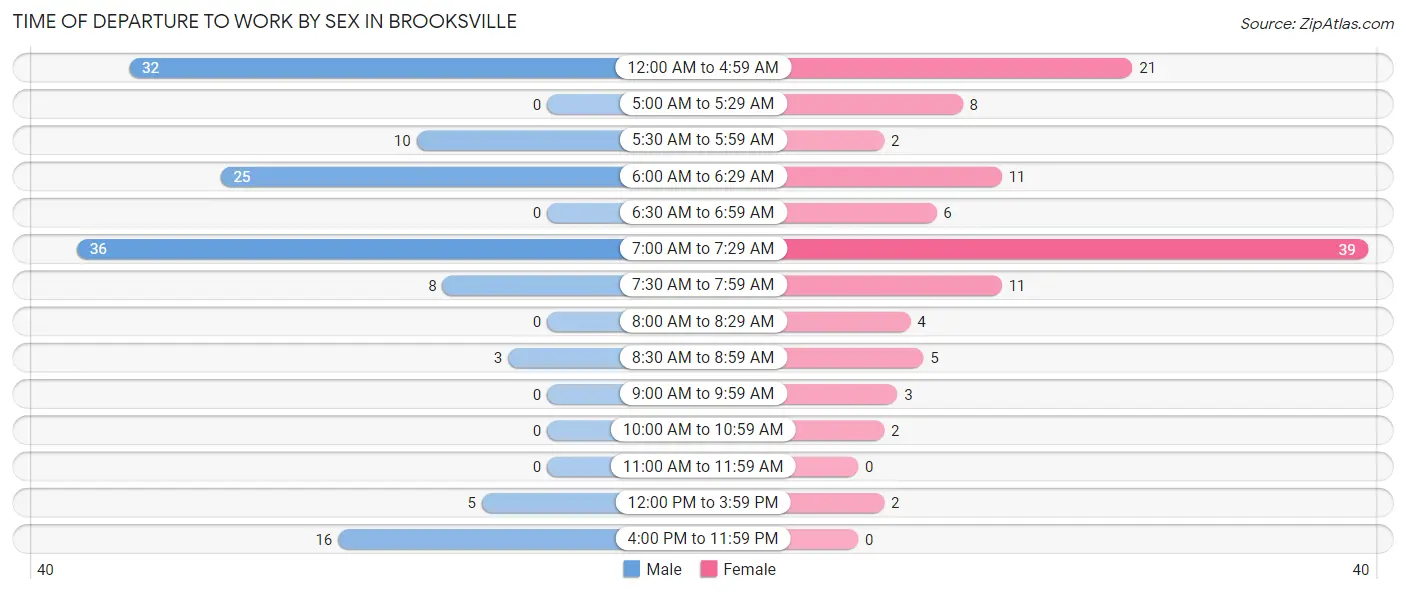
| Time of Departure | Male | Female |
| 12:00 AM to 4:59 AM | 32 (23.7%) | 21 (18.4%) |
| 5:00 AM to 5:29 AM | 0 (0.0%) | 8 (7.0%) |
| 5:30 AM to 5:59 AM | 10 (7.4%) | 2 (1.8%) |
| 6:00 AM to 6:29 AM | 25 (18.5%) | 11 (9.7%) |
| 6:30 AM to 6:59 AM | 0 (0.0%) | 6 (5.3%) |
| 7:00 AM to 7:29 AM | 36 (26.7%) | 39 (34.2%) |
| 7:30 AM to 7:59 AM | 8 (5.9%) | 11 (9.7%) |
| 8:00 AM to 8:29 AM | 0 (0.0%) | 4 (3.5%) |
| 8:30 AM to 8:59 AM | 3 (2.2%) | 5 (4.4%) |
| 9:00 AM to 9:59 AM | 0 (0.0%) | 3 (2.6%) |
| 10:00 AM to 10:59 AM | 0 (0.0%) | 2 (1.8%) |
| 11:00 AM to 11:59 AM | 0 (0.0%) | 0 (0.0%) |
| 12:00 PM to 3:59 PM | 5 (3.7%) | 2 (1.8%) |
| 4:00 PM to 11:59 PM | 16 (11.8%) | 0 (0.0%) |
| Total | 135 (100.0%) | 114 (100.0%) |
Housing Occupancy in Brooksville
Occupancy by Ownership in Brooksville
Of the total 276 dwellings in Brooksville, owner-occupied units account for 217 (78.6%), while renter-occupied units make up 59 (21.4%).
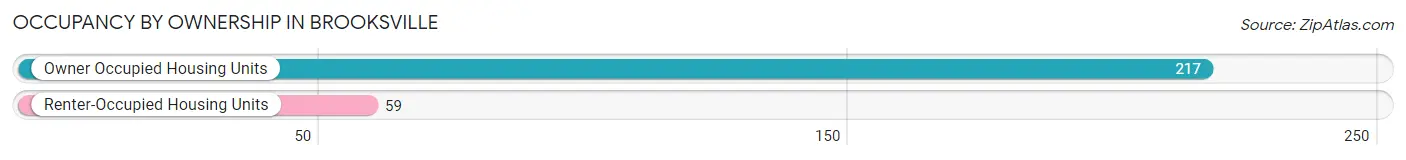
| Occupancy | # Housing Units | % Housing Units |
| Owner Occupied Housing Units | 217 | 78.6% |
| Renter-Occupied Housing Units | 59 | 21.4% |
| Total Occupied Housing Units | 276 | 100.0% |
Occupancy by Household Size in Brooksville
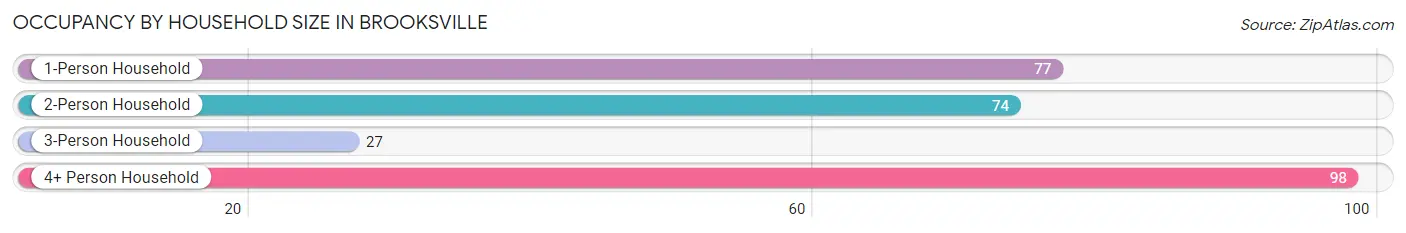
| Household Size | # Housing Units | % Housing Units |
| 1-Person Household | 77 | 27.9% |
| 2-Person Household | 74 | 26.8% |
| 3-Person Household | 27 | 9.8% |
| 4+ Person Household | 98 | 35.5% |
| Total Housing Units | 276 | 100.0% |
Occupancy by Ownership by Household Size in Brooksville
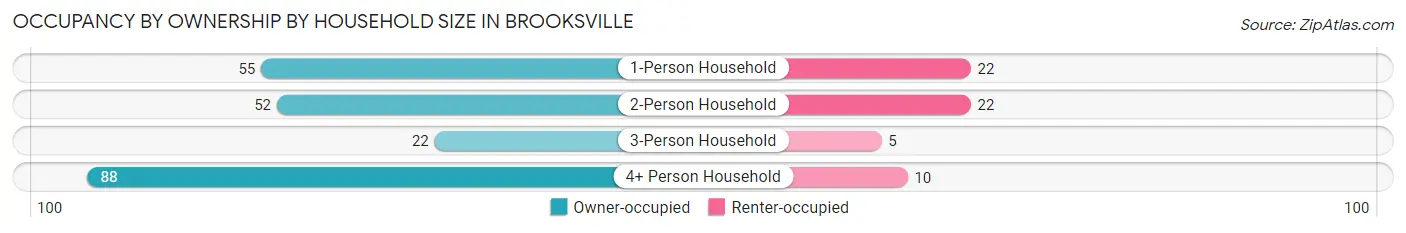
| Household Size | Owner-occupied | Renter-occupied |
| 1-Person Household | 55 (71.4%) | 22 (28.6%) |
| 2-Person Household | 52 (70.3%) | 22 (29.7%) |
| 3-Person Household | 22 (81.5%) | 5 (18.5%) |
| 4+ Person Household | 88 (89.8%) | 10 (10.2%) |
| Total Housing Units | 217 (78.6%) | 59 (21.4%) |
Occupancy by Educational Attainment in Brooksville
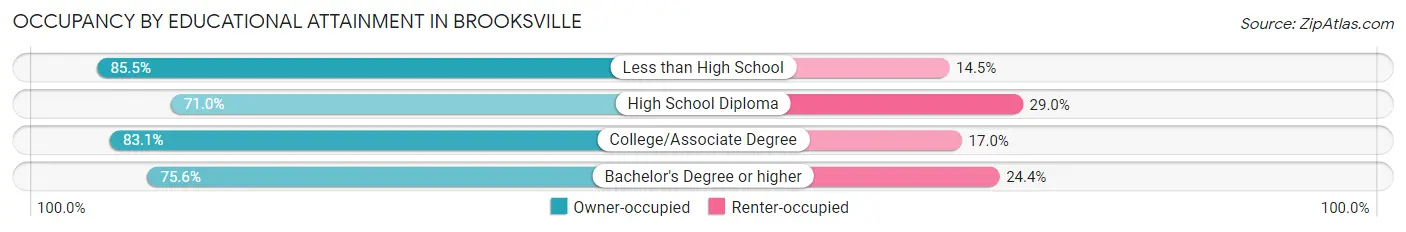
| Household Size | Owner-occupied | Renter-occupied |
| Less than High School | 71 (85.5%) | 12 (14.5%) |
| High School Diploma | 66 (71.0%) | 27 (29.0%) |
| College/Associate Degree | 49 (83.1%) | 10 (17.0%) |
| Bachelor's Degree or higher | 31 (75.6%) | 10 (24.4%) |
Occupancy by Age of Householder in Brooksville
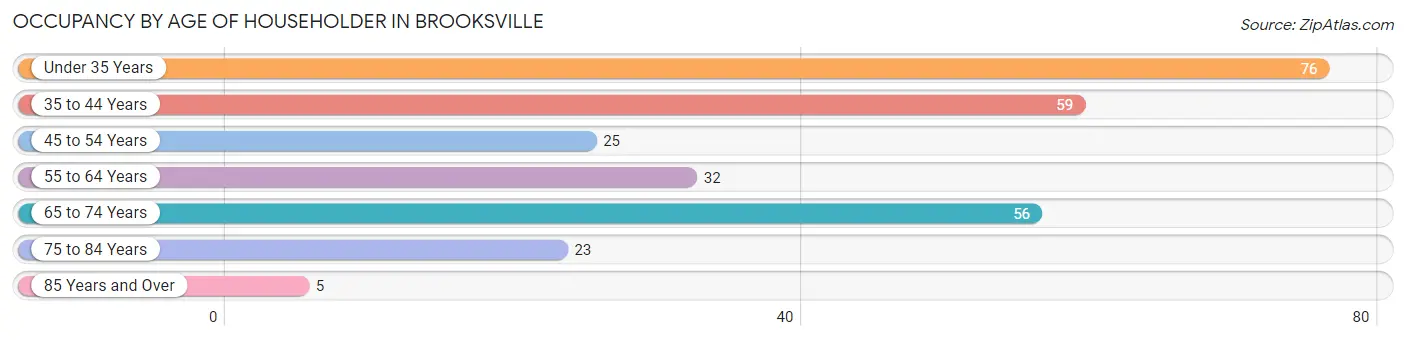
| Age Bracket | # Households | % Households |
| Under 35 Years | 76 | 27.5% |
| 35 to 44 Years | 59 | 21.4% |
| 45 to 54 Years | 25 | 9.1% |
| 55 to 64 Years | 32 | 11.6% |
| 65 to 74 Years | 56 | 20.3% |
| 75 to 84 Years | 23 | 8.3% |
| 85 Years and Over | 5 | 1.8% |
| Total | 276 | 100.0% |
Housing Finances in Brooksville
Median Income by Occupancy in Brooksville
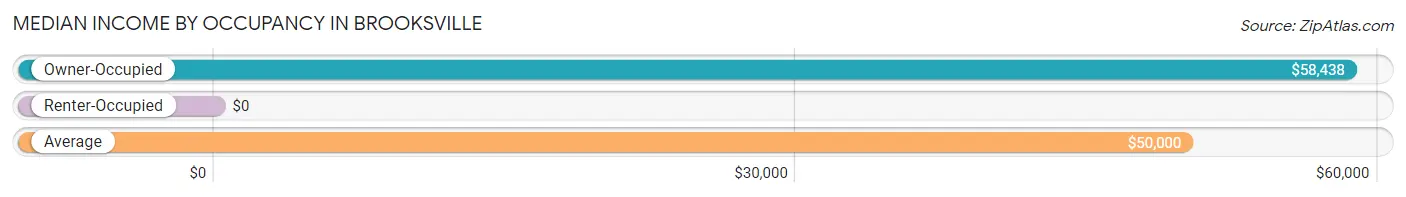
| Occupancy Type | # Households | Median Income |
| Owner-Occupied | 217 (78.6%) | $58,438 |
| Renter-Occupied | 59 (21.4%) | $0 |
| Average | 276 (100.0%) | $50,000 |
Occupancy by Householder Income Bracket in Brooksville
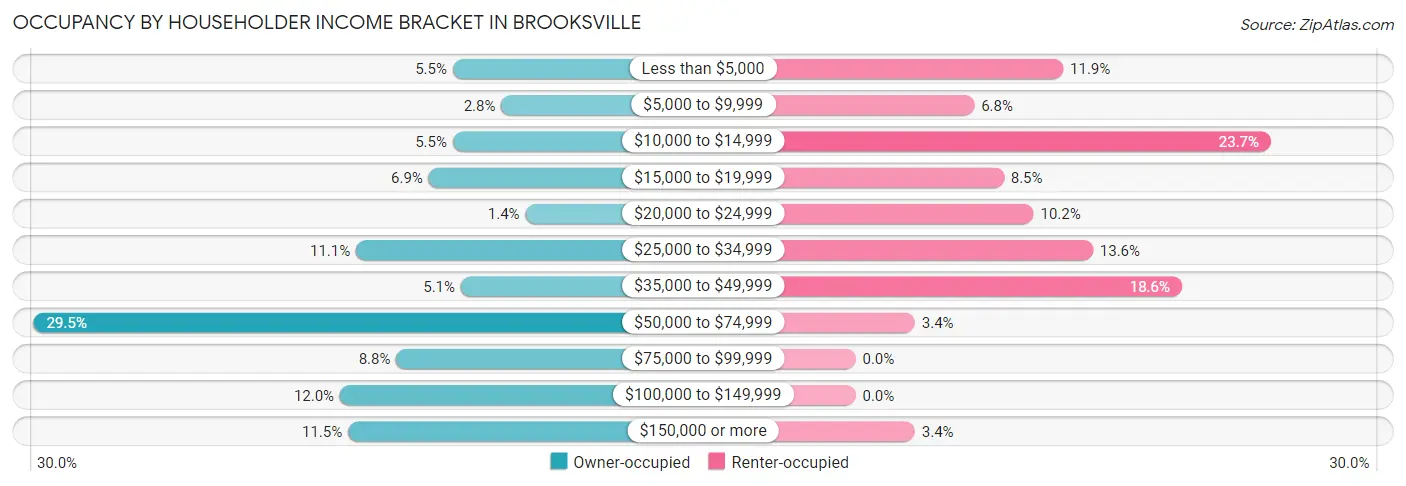
| Income Bracket | Owner-occupied | Renter-occupied |
| Less than $5,000 | 12 (5.5%) | 7 (11.9%) |
| $5,000 to $9,999 | 6 (2.8%) | 4 (6.8%) |
| $10,000 to $14,999 | 12 (5.5%) | 14 (23.7%) |
| $15,000 to $19,999 | 15 (6.9%) | 5 (8.5%) |
| $20,000 to $24,999 | 3 (1.4%) | 6 (10.2%) |
| $25,000 to $34,999 | 24 (11.1%) | 8 (13.6%) |
| $35,000 to $49,999 | 11 (5.1%) | 11 (18.6%) |
| $50,000 to $74,999 | 64 (29.5%) | 2 (3.4%) |
| $75,000 to $99,999 | 19 (8.8%) | 0 (0.0%) |
| $100,000 to $149,999 | 26 (12.0%) | 0 (0.0%) |
| $150,000 or more | 25 (11.5%) | 2 (3.4%) |
| Total | 217 (100.0%) | 59 (100.0%) |
Monthly Housing Cost Tiers in Brooksville
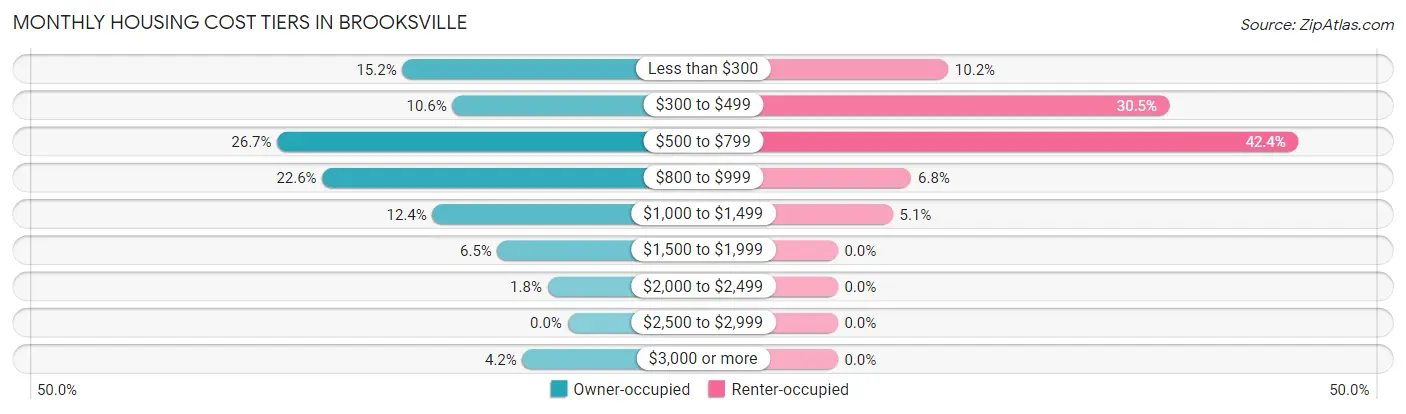
| Monthly Cost | Owner-occupied | Renter-occupied |
| Less than $300 | 33 (15.2%) | 6 (10.2%) |
| $300 to $499 | 23 (10.6%) | 18 (30.5%) |
| $500 to $799 | 58 (26.7%) | 25 (42.4%) |
| $800 to $999 | 49 (22.6%) | 4 (6.8%) |
| $1,000 to $1,499 | 27 (12.4%) | 3 (5.1%) |
| $1,500 to $1,999 | 14 (6.5%) | 0 (0.0%) |
| $2,000 to $2,499 | 4 (1.8%) | 0 (0.0%) |
| $2,500 to $2,999 | 0 (0.0%) | 0 (0.0%) |
| $3,000 or more | 9 (4.2%) | 0 (0.0%) |
| Total | 217 (100.0%) | 59 (100.0%) |
Physical Housing Characteristics in Brooksville
Housing Structures in Brooksville
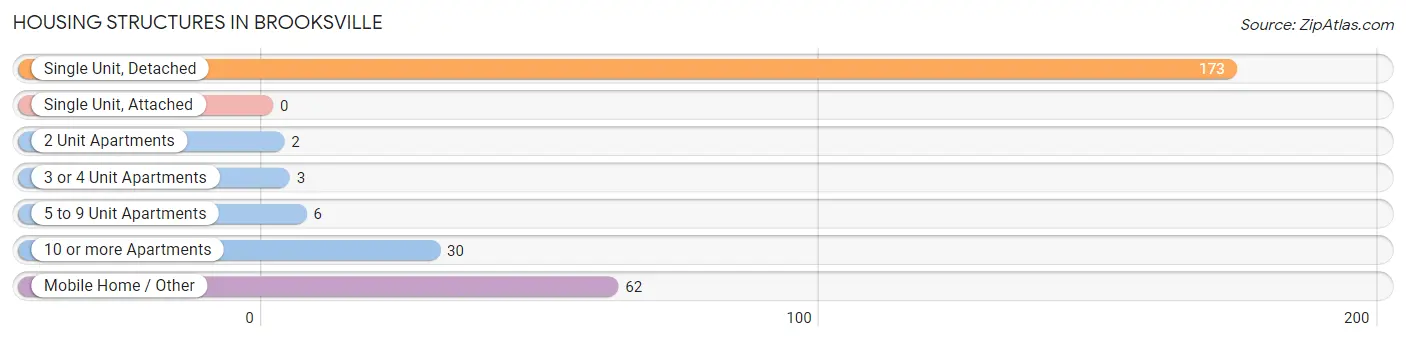
| Structure Type | # Housing Units | % Housing Units |
| Single Unit, Detached | 173 | 62.7% |
| Single Unit, Attached | 0 | 0.0% |
| 2 Unit Apartments | 2 | 0.7% |
| 3 or 4 Unit Apartments | 3 | 1.1% |
| 5 to 9 Unit Apartments | 6 | 2.2% |
| 10 or more Apartments | 30 | 10.9% |
| Mobile Home / Other | 62 | 22.5% |
| Total | 276 | 100.0% |
Housing Structures by Occupancy in Brooksville
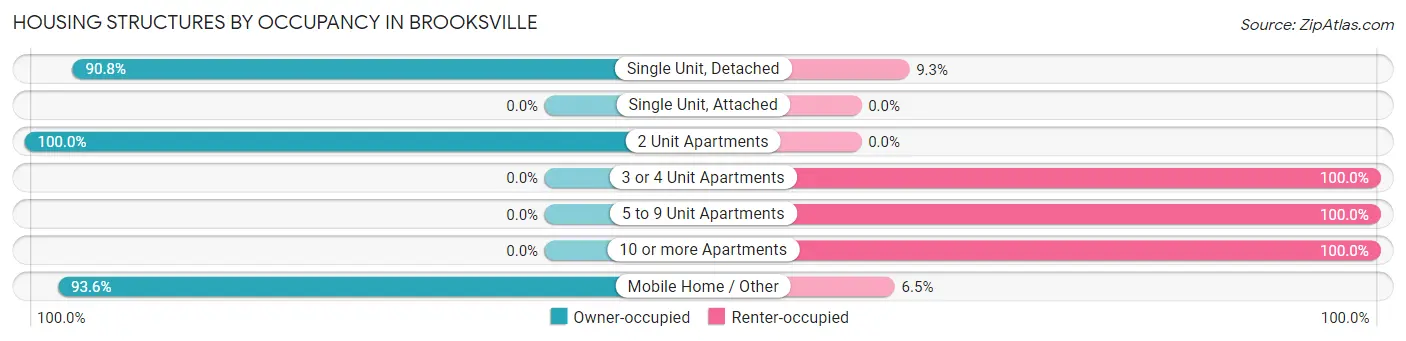
| Structure Type | Owner-occupied | Renter-occupied |
| Single Unit, Detached | 157 (90.7%) | 16 (9.2%) |
| Single Unit, Attached | 0 (0.0%) | 0 (0.0%) |
| 2 Unit Apartments | 2 (100.0%) | 0 (0.0%) |
| 3 or 4 Unit Apartments | 0 (0.0%) | 3 (100.0%) |
| 5 to 9 Unit Apartments | 0 (0.0%) | 6 (100.0%) |
| 10 or more Apartments | 0 (0.0%) | 30 (100.0%) |
| Mobile Home / Other | 58 (93.5%) | 4 (6.5%) |
| Total | 217 (78.6%) | 59 (21.4%) |
Housing Structures by Number of Rooms in Brooksville
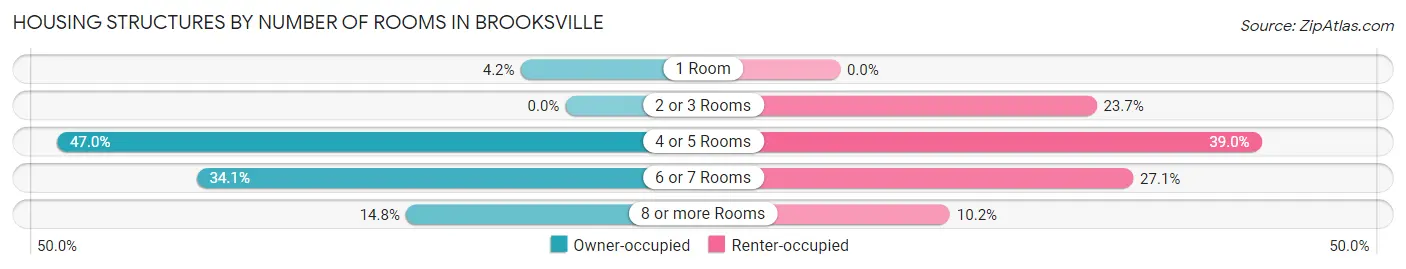
| Number of Rooms | Owner-occupied | Renter-occupied |
| 1 Room | 9 (4.2%) | 0 (0.0%) |
| 2 or 3 Rooms | 0 (0.0%) | 14 (23.7%) |
| 4 or 5 Rooms | 102 (47.0%) | 23 (39.0%) |
| 6 or 7 Rooms | 74 (34.1%) | 16 (27.1%) |
| 8 or more Rooms | 32 (14.7%) | 6 (10.2%) |
| Total | 217 (100.0%) | 59 (100.0%) |
Housing Structure by Heating Type in Brooksville
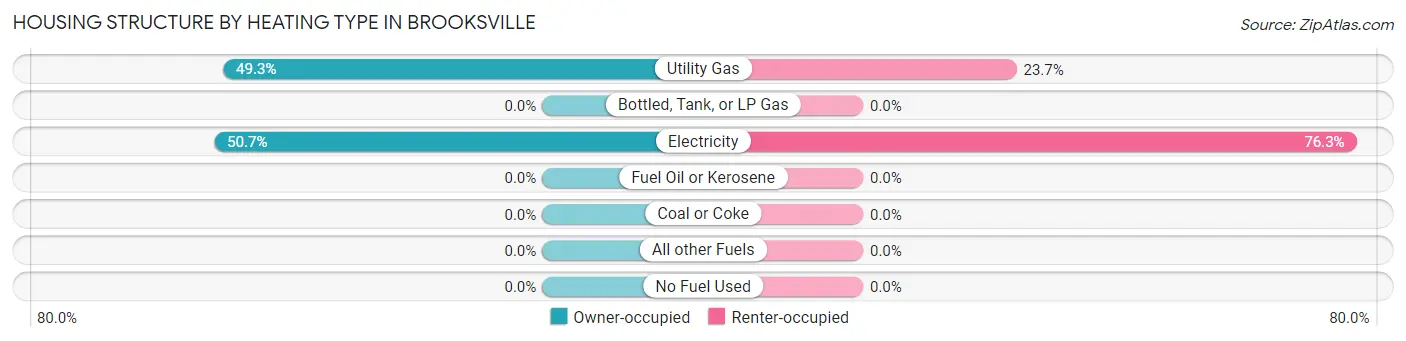
| Heating Type | Owner-occupied | Renter-occupied |
| Utility Gas | 107 (49.3%) | 14 (23.7%) |
| Bottled, Tank, or LP Gas | 0 (0.0%) | 0 (0.0%) |
| Electricity | 110 (50.7%) | 45 (76.3%) |
| Fuel Oil or Kerosene | 0 (0.0%) | 0 (0.0%) |
| Coal or Coke | 0 (0.0%) | 0 (0.0%) |
| All other Fuels | 0 (0.0%) | 0 (0.0%) |
| No Fuel Used | 0 (0.0%) | 0 (0.0%) |
| Total | 217 (100.0%) | 59 (100.0%) |
Household Vehicle Usage in Brooksville
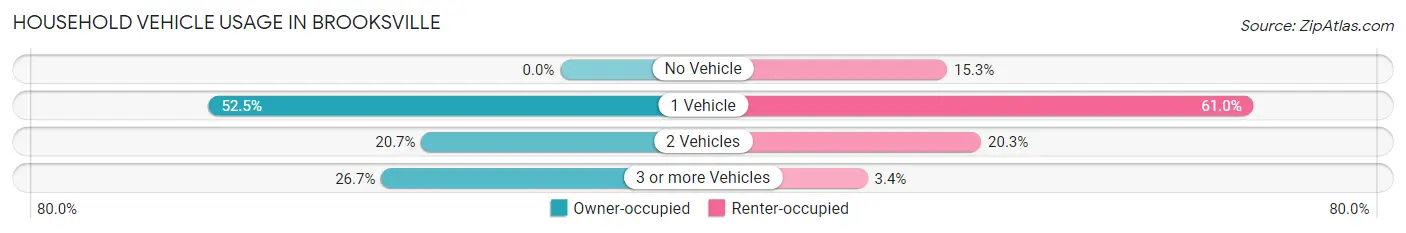
| Vehicles per Household | Owner-occupied | Renter-occupied |
| No Vehicle | 0 (0.0%) | 9 (15.2%) |
| 1 Vehicle | 114 (52.5%) | 36 (61.0%) |
| 2 Vehicles | 45 (20.7%) | 12 (20.3%) |
| 3 or more Vehicles | 58 (26.7%) | 2 (3.4%) |
| Total | 217 (100.0%) | 59 (100.0%) |
Real Estate & Mortgages in Brooksville
Real Estate and Mortgage Overview in Brooksville
| Characteristic | Without Mortgage | With Mortgage |
| Housing Units | 84 | 133 |
| Median Property Value | $53,800 | $88,200 |
| Median Household Income | - | - |
| Monthly Housing Costs | $377 | $9 |
| Real Estate Taxes | $464 | $4 |
Property Value by Mortgage Status in Brooksville
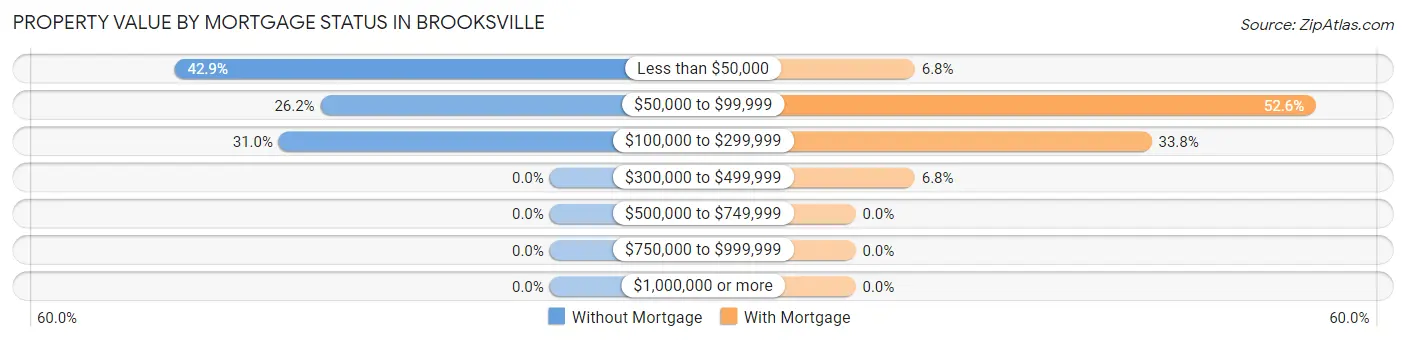
| Property Value | Without Mortgage | With Mortgage |
| Less than $50,000 | 36 (42.9%) | 9 (6.8%) |
| $50,000 to $99,999 | 22 (26.2%) | 70 (52.6%) |
| $100,000 to $299,999 | 26 (30.9%) | 45 (33.8%) |
| $300,000 to $499,999 | 0 (0.0%) | 9 (6.8%) |
| $500,000 to $749,999 | 0 (0.0%) | 0 (0.0%) |
| $750,000 to $999,999 | 0 (0.0%) | 0 (0.0%) |
| $1,000,000 or more | 0 (0.0%) | 0 (0.0%) |
| Total | 84 (100.0%) | 133 (100.0%) |
Household Income by Mortgage Status in Brooksville
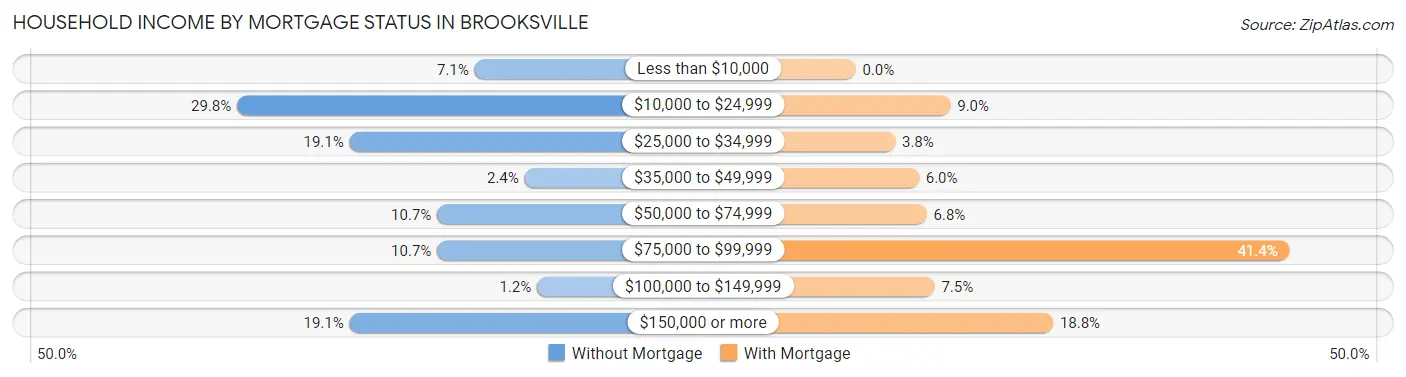
| Household Income | Without Mortgage | With Mortgage |
| Less than $10,000 | 6 (7.1%) | 0 (0.0%) |
| $10,000 to $24,999 | 25 (29.8%) | 12 (9.0%) |
| $25,000 to $34,999 | 16 (19.1%) | 5 (3.8%) |
| $35,000 to $49,999 | 2 (2.4%) | 8 (6.0%) |
| $50,000 to $74,999 | 9 (10.7%) | 9 (6.8%) |
| $75,000 to $99,999 | 9 (10.7%) | 55 (41.3%) |
| $100,000 to $149,999 | 1 (1.2%) | 10 (7.5%) |
| $150,000 or more | 16 (19.1%) | 25 (18.8%) |
| Total | 84 (100.0%) | 133 (100.0%) |
Property Value to Household Income Ratio in Brooksville
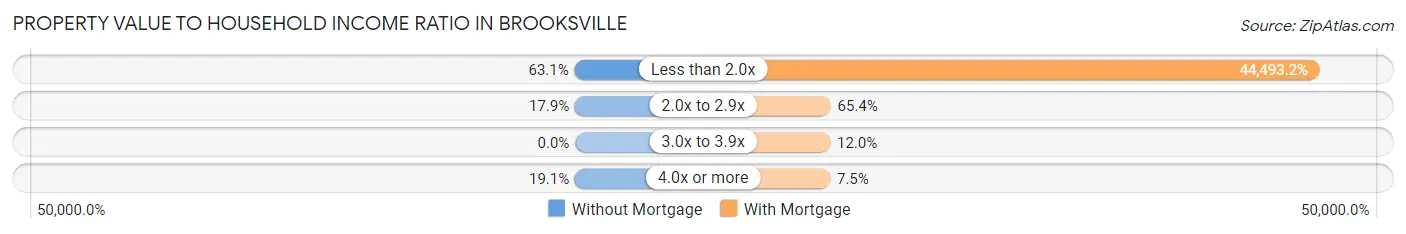
| Value-to-Income Ratio | Without Mortgage | With Mortgage |
| Less than 2.0x | 53 (63.1%) | 59,176 (44,493.2%) |
| 2.0x to 2.9x | 15 (17.9%) | 87 (65.4%) |
| 3.0x to 3.9x | 0 (0.0%) | 16 (12.0%) |
| 4.0x or more | 16 (19.1%) | 10 (7.5%) |
| Total | 84 (100.0%) | 133 (100.0%) |
Real Estate Taxes by Mortgage Status in Brooksville
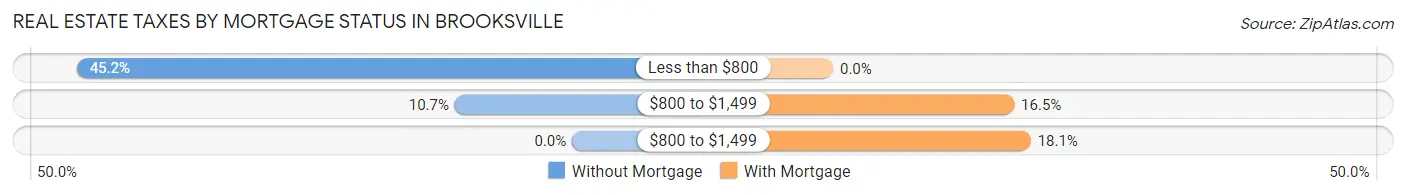
| Property Taxes | Without Mortgage | With Mortgage |
| Less than $800 | 38 (45.2%) | 0 (0.0%) |
| $800 to $1,499 | 9 (10.7%) | 22 (16.5%) |
| $800 to $1,499 | 0 (0.0%) | 24 (18.0%) |
| Total | 84 (100.0%) | 133 (100.0%) |
Health & Disability in Brooksville
Health Insurance Coverage by Age in Brooksville
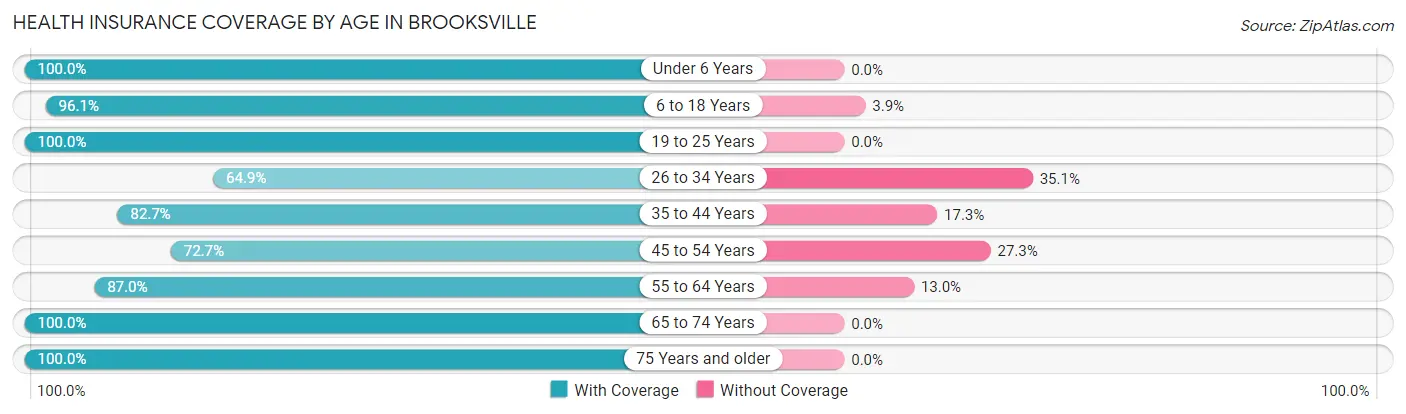
| Age Bracket | With Coverage | Without Coverage |
| Under 6 Years | 95 (100.0%) | 0 (0.0%) |
| 6 to 18 Years | 171 (96.1%) | 7 (3.9%) |
| 19 to 25 Years | 78 (100.0%) | 0 (0.0%) |
| 26 to 34 Years | 48 (64.9%) | 26 (35.1%) |
| 35 to 44 Years | 86 (82.7%) | 18 (17.3%) |
| 45 to 54 Years | 32 (72.7%) | 12 (27.3%) |
| 55 to 64 Years | 67 (87.0%) | 10 (13.0%) |
| 65 to 74 Years | 82 (100.0%) | 0 (0.0%) |
| 75 Years and older | 32 (100.0%) | 0 (0.0%) |
| Total | 691 (90.4%) | 73 (9.6%) |
Health Insurance Coverage by Citizenship Status in Brooksville
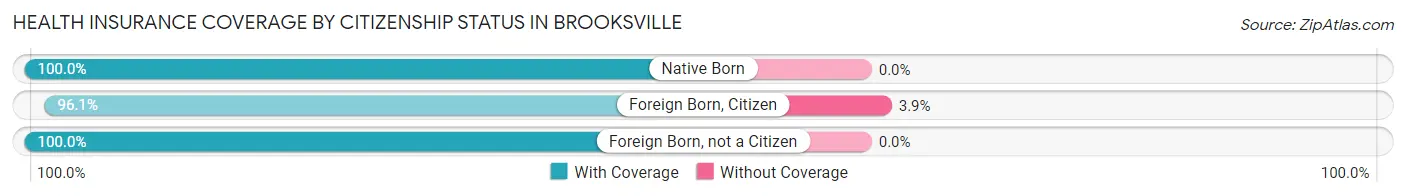
| Citizenship Status | With Coverage | Without Coverage |
| Native Born | 95 (100.0%) | 0 (0.0%) |
| Foreign Born, Citizen | 171 (96.1%) | 7 (3.9%) |
| Foreign Born, not a Citizen | 78 (100.0%) | 0 (0.0%) |
Health Insurance Coverage by Household Income in Brooksville
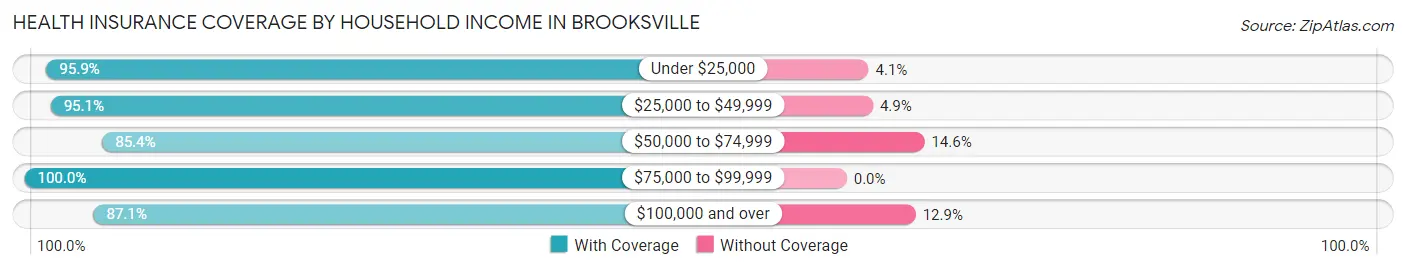
| Household Income | With Coverage | Without Coverage |
| Under $25,000 | 164 (95.9%) | 7 (4.1%) |
| $25,000 to $49,999 | 97 (95.1%) | 5 (4.9%) |
| $50,000 to $74,999 | 176 (85.4%) | 30 (14.6%) |
| $75,000 to $99,999 | 45 (100.0%) | 0 (0.0%) |
| $100,000 and over | 209 (87.1%) | 31 (12.9%) |
Public vs Private Health Insurance Coverage by Age in Brooksville
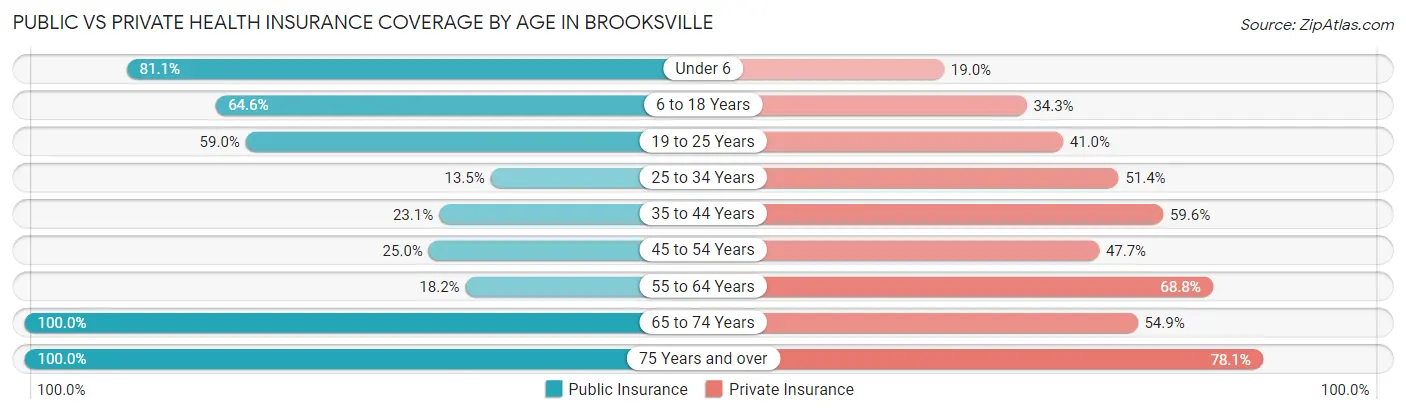
| Age Bracket | Public Insurance | Private Insurance |
| Under 6 | 77 (81.0%) | 18 (19.0%) |
| 6 to 18 Years | 115 (64.6%) | 61 (34.3%) |
| 19 to 25 Years | 46 (59.0%) | 32 (41.0%) |
| 25 to 34 Years | 10 (13.5%) | 38 (51.3%) |
| 35 to 44 Years | 24 (23.1%) | 62 (59.6%) |
| 45 to 54 Years | 11 (25.0%) | 21 (47.7%) |
| 55 to 64 Years | 14 (18.2%) | 53 (68.8%) |
| 65 to 74 Years | 82 (100.0%) | 45 (54.9%) |
| 75 Years and over | 32 (100.0%) | 25 (78.1%) |
| Total | 411 (53.8%) | 355 (46.5%) |
Disability Status by Sex by Age in Brooksville
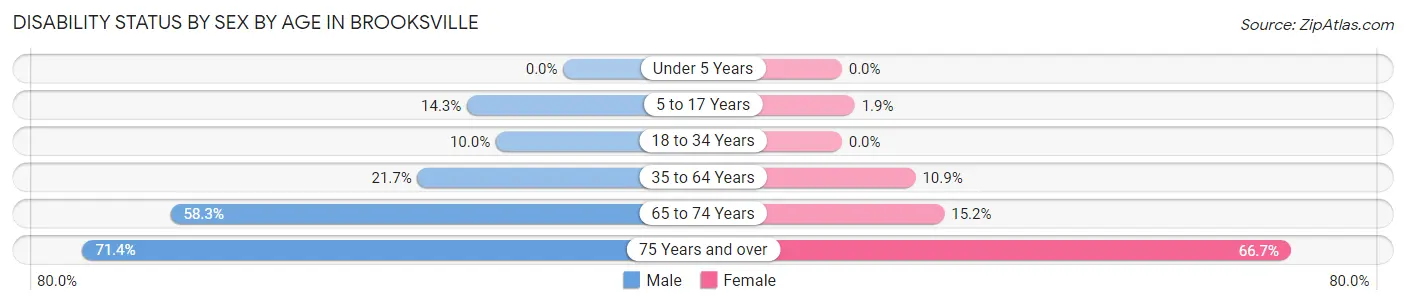
| Age Bracket | Male | Female |
| Under 5 Years | 0 (0.0%) | 0 (0.0%) |
| 5 to 17 Years | 11 (14.3%) | 2 (1.9%) |
| 18 to 34 Years | 8 (10.0%) | 0 (0.0%) |
| 35 to 64 Years | 21 (21.6%) | 14 (10.9%) |
| 65 to 74 Years | 21 (58.3%) | 7 (15.2%) |
| 75 Years and over | 10 (71.4%) | 12 (66.7%) |
Disability Class by Sex by Age in Brooksville
Disability Class: Hearing Difficulty
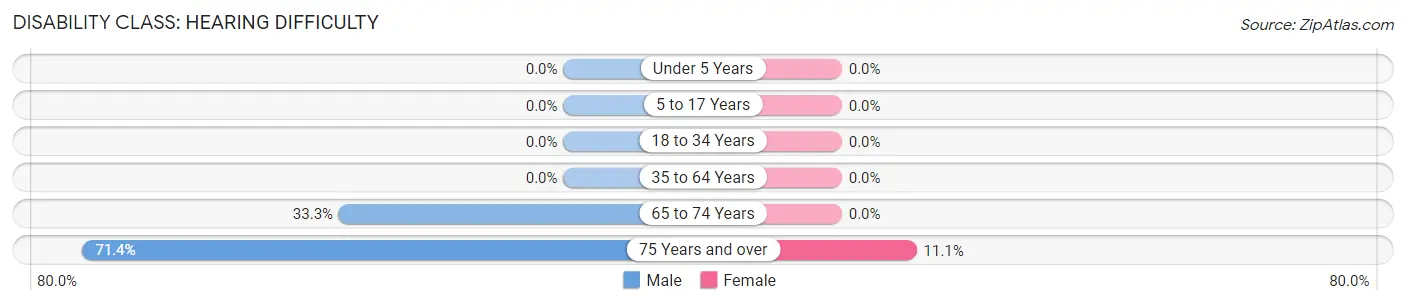
| Age Bracket | Male | Female |
| Under 5 Years | 0 (0.0%) | 0 (0.0%) |
| 5 to 17 Years | 0 (0.0%) | 0 (0.0%) |
| 18 to 34 Years | 0 (0.0%) | 0 (0.0%) |
| 35 to 64 Years | 0 (0.0%) | 0 (0.0%) |
| 65 to 74 Years | 12 (33.3%) | 0 (0.0%) |
| 75 Years and over | 10 (71.4%) | 2 (11.1%) |
Disability Class: Vision Difficulty
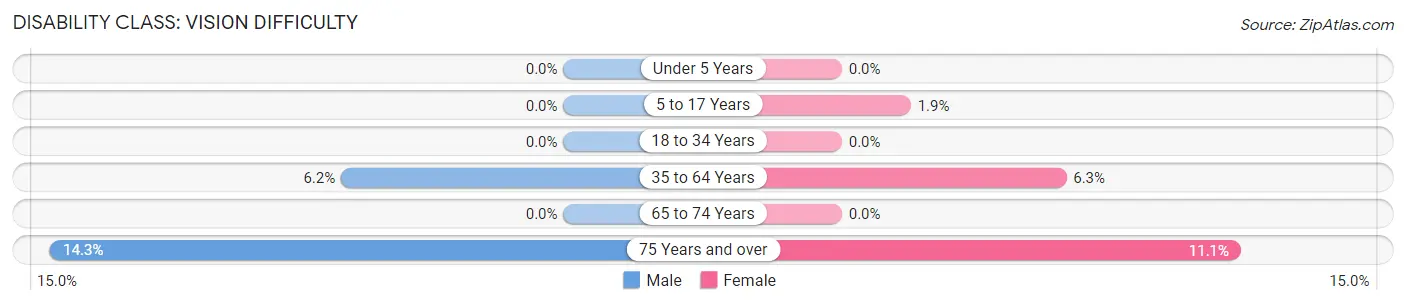
| Age Bracket | Male | Female |
| Under 5 Years | 0 (0.0%) | 0 (0.0%) |
| 5 to 17 Years | 0 (0.0%) | 2 (1.9%) |
| 18 to 34 Years | 0 (0.0%) | 0 (0.0%) |
| 35 to 64 Years | 6 (6.2%) | 8 (6.2%) |
| 65 to 74 Years | 0 (0.0%) | 0 (0.0%) |
| 75 Years and over | 2 (14.3%) | 2 (11.1%) |
Disability Class: Cognitive Difficulty

| Age Bracket | Male | Female |
| 5 to 17 Years | 8 (10.4%) | 0 (0.0%) |
| 18 to 34 Years | 2 (2.5%) | 0 (0.0%) |
| 35 to 64 Years | 12 (12.4%) | 4 (3.1%) |
| 65 to 74 Years | 0 (0.0%) | 0 (0.0%) |
| 75 Years and over | 0 (0.0%) | 0 (0.0%) |
Disability Class: Ambulatory Difficulty
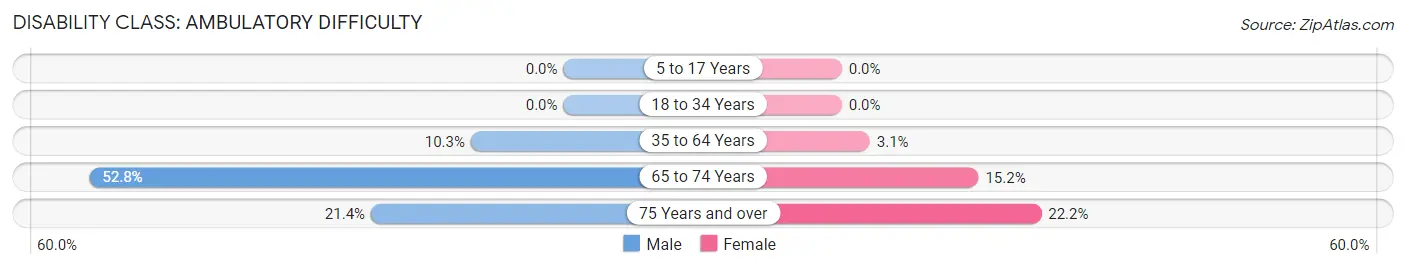
| Age Bracket | Male | Female |
| 5 to 17 Years | 0 (0.0%) | 0 (0.0%) |
| 18 to 34 Years | 0 (0.0%) | 0 (0.0%) |
| 35 to 64 Years | 10 (10.3%) | 4 (3.1%) |
| 65 to 74 Years | 19 (52.8%) | 7 (15.2%) |
| 75 Years and over | 3 (21.4%) | 4 (22.2%) |
Disability Class: Self-Care Difficulty
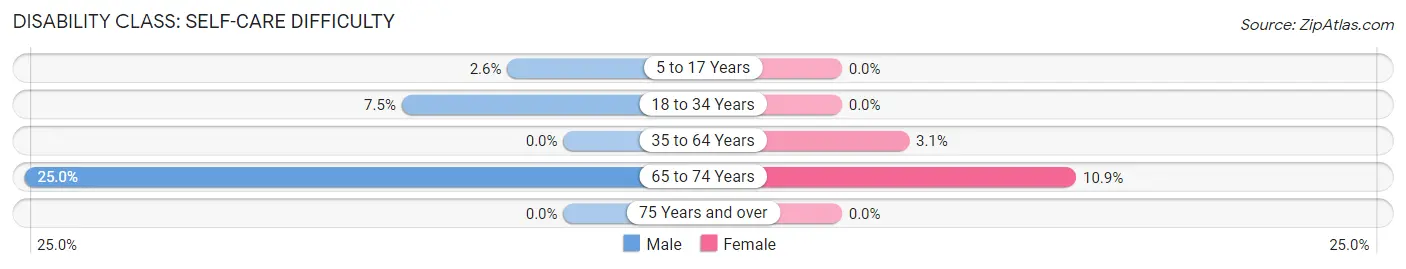
| Age Bracket | Male | Female |
| 5 to 17 Years | 2 (2.6%) | 0 (0.0%) |
| 18 to 34 Years | 6 (7.5%) | 0 (0.0%) |
| 35 to 64 Years | 0 (0.0%) | 4 (3.1%) |
| 65 to 74 Years | 9 (25.0%) | 5 (10.9%) |
| 75 Years and over | 0 (0.0%) | 0 (0.0%) |
Technology Access in Brooksville
Computing Device Access in Brooksville
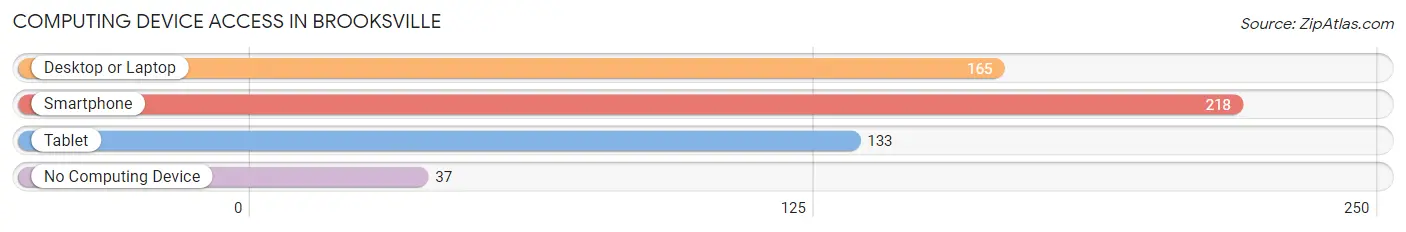
| Device Type | # Households | % Households |
| Desktop or Laptop | 165 | 59.8% |
| Smartphone | 218 | 79.0% |
| Tablet | 133 | 48.2% |
| No Computing Device | 37 | 13.4% |
| Total | 276 | 100.0% |
Internet Access in Brooksville
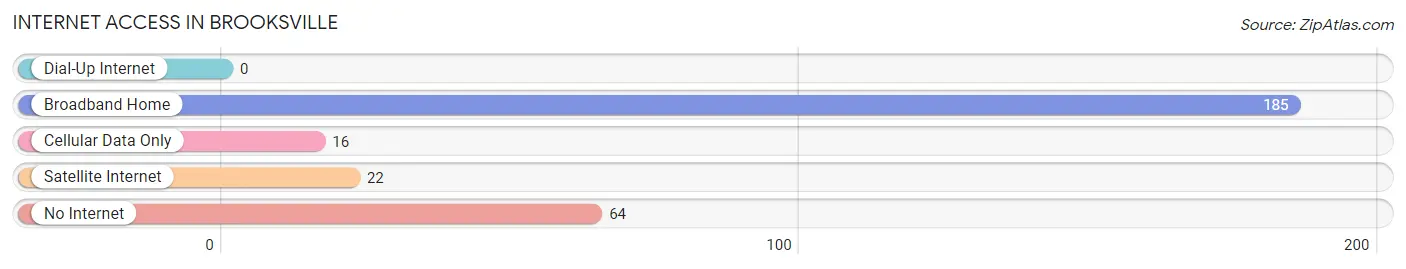
| Internet Type | # Households | % Households |
| Dial-Up Internet | 0 | 0.0% |
| Broadband Home | 185 | 67.0% |
| Cellular Data Only | 16 | 5.8% |
| Satellite Internet | 22 | 8.0% |
| No Internet | 64 | 23.2% |
| Total | 276 | 100.0% |
Brooksville Summary
Brooksville is a small city located in Bracken County, Kentucky, United States. It is situated on the banks of the Ohio River, approximately 25 miles east of Cincinnati, Ohio. The population was 1,717 at the 2010 census.
History
The area that is now Brooksville was first settled in the late 1700s by a group of settlers from Pennsylvania. The town was originally known as "Crossroads" due to its location at the intersection of two major roads. In 1817, the town was renamed "Brooksville" in honor of a local landowner, William Brooks.
The town was incorporated in 1820 and quickly became a thriving river port. The Ohio River was a major transportation route for goods and people, and Brooksville was a popular stop for steamboats. The town also had a number of businesses, including a sawmill, gristmill, and a distillery.
In the mid-1800s, the town was a major stop on the Underground Railroad. Slaves escaping from the South would stop in Brooksville before continuing their journey to freedom in the North.
Geography
Brooksville is located at 38°45'25" North, 84°0'25" West (38.756944, -84.006944). According to the United States Census Bureau, the city has a total area of 1.2 square miles (3.1 km2), all land.
Economy
The economy of Brooksville is largely based on agriculture and tourism. The town is home to several farms, which produce a variety of crops, including corn, soybeans, and wheat. The town is also a popular destination for tourists, who come to enjoy the scenic views of the Ohio River and the nearby hills.
Demographics
As of the census of 2010, there were 1,717 people, 690 households, and 463 families residing in the city. The population density was 1,427.5 people per square mile (550.7/km2). There were 745 housing units at an average density of 619.2 per square mile (238.7/km2). The racial makeup of the city was 97.2% White, 0.9% African American, 0.2% Native American, 0.2% Asian, 0.1% Pacific Islander, 0.2% from other races, and 1.2% from two or more races. Hispanic or Latino of any race were 0.7% of the population.
There were 690 households, out of which 28.3% had children under the age of 18 living with them, 48.3% were married couples living together, 13.2% had a female householder with no husband present, and 33.3% were non-families. 28.3% of all households were made up of individuals, and 12.2% had someone living alone who was 65 years of age or older. The average household size was 2.45 and the average family size was 2.97.
In the city, the population was spread out, with 24.2% under the age of 18, 8.2% from 18 to 24, 28.2% from 25 to 44, 24.2% from 45 to 64, and 15.2% who were 65 years of age or older. The median age was 38 years. For every 100 females, there were 91.2 males. For every 100 females age 18 and over, there were 87.2 males.
The median income for a household in the city was $30,938, and the median income for a family was $37,500. Males had a median income of $30,000 versus $21,250 for females. The per capita income for the city was $15,945. About 11.2% of families and 14.2% of the population were below the poverty line, including 19.2% of those under age 18 and 11.2% of those age 65 or over.
Common Questions
What is Per Capita Income in Brooksville?
Per Capita income in Brooksville is $19,037.
What is the Median Family Income in Brooksville?
Median Family Income in Brooksville is $58,807.
What is the Median Household income in Brooksville?
Median Household Income in Brooksville is $50,000.
What is Income or Wage Gap in Brooksville?
Income or Wage Gap in Brooksville is 63.1%.
Women in Brooksville earn 36.9 cents for every dollar earned by a man.
What is Inequality or Gini Index in Brooksville?
Inequality or Gini Index in Brooksville is 0.45.
What is the Total Population of Brooksville?
Total Population of Brooksville is 764.
What is the Total Male Population of Brooksville?
Total Male Population of Brooksville is 322.
What is the Total Female Population of Brooksville?
Total Female Population of Brooksville is 442.
What is the Ratio of Males per 100 Females in Brooksville?
There are 72.85 Males per 100 Females in Brooksville.
What is the Ratio of Females per 100 Males in Brooksville?
There are 137.27 Females per 100 Males in Brooksville.
What is the Median Population Age in Brooksville?
Median Population Age in Brooksville is 29.4 Years.
What is the Average Family Size in Brooksville
Average Family Size in Brooksville is 3.3 People.
What is the Average Household Size in Brooksville
Average Household Size in Brooksville is 2.8 People.
How Large is the Labor Force in Brooksville?
There are 270 People in the Labor Forcein in Brooksville.
What is the Percentage of People in the Labor Force in Brooksville?
53.6% of People are in the Labor Force in Brooksville.
What is the Unemployment Rate in Brooksville?
Unemployment Rate in Brooksville is 2.2%.