Sharpsburg, KY Map & Demographics
Sharpsburg Map
Sharpsburg Overview
$27,115
PER CAPITA INCOME
$50,313
AVG FAMILY INCOME
$30,000
AVG HOUSEHOLD INCOME
43.7%
WAGE / INCOME GAP [ % ]
56.3¢/ $1
WAGE / INCOME GAP [ $ ]
0.60
INEQUALITY / GINI INDEX
428
TOTAL POPULATION
268
MALE POPULATION
160
FEMALE POPULATION
167.50
MALES / 100 FEMALES
59.70
FEMALES / 100 MALES
41.2
MEDIAN AGE
3.7
AVG FAMILY SIZE
2.4
AVG HOUSEHOLD SIZE
164
LABOR FORCE [ PEOPLE ]
45.4%
PERCENT IN LABOR FORCE
7.9%
UNEMPLOYMENT RATE
Sharpsburg Zip Codes
Income in Sharpsburg
Income Overview in Sharpsburg
Per Capita Income in Sharpsburg is $27,115, while median incomes of families and households are $50,313 and $30,000 respectively.
| Characteristic | Number | Measure |
| Per Capita Income | 428 | $27,115 |
| Median Family Income | 91 | $50,313 |
| Mean Family Income | 91 | $85,167 |
| Median Household Income | 178 | $30,000 |
| Mean Household Income | 178 | $52,937 |
| Income Deficit | 91 | $0 |
| Wage / Income Gap (%) | 428 | 43.71% |
| Wage / Income Gap ($) | 428 | 56.29¢ per $1 |
| Gini / Inequality Index | 428 | 0.60 |
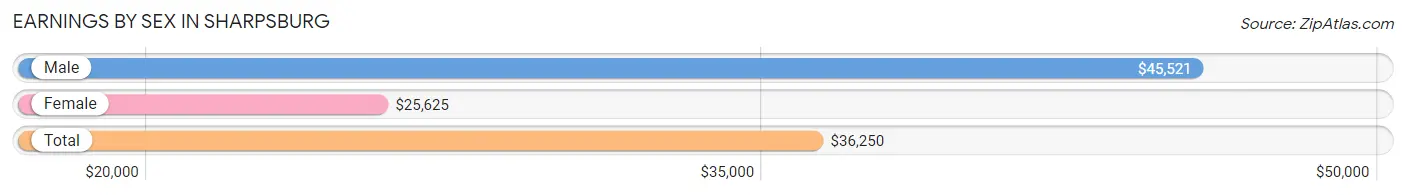
Earnings by Sex in Sharpsburg
Average Earnings in Sharpsburg are $36,250, $45,521 for men and $25,625 for women, a difference of 43.7%.
| Sex | Number | Average Earnings |
| Male | 127 (76.5%) | $45,521 |
| Female | 39 (23.5%) | $25,625 |
| Total | 166 (100.0%) | $36,250 |
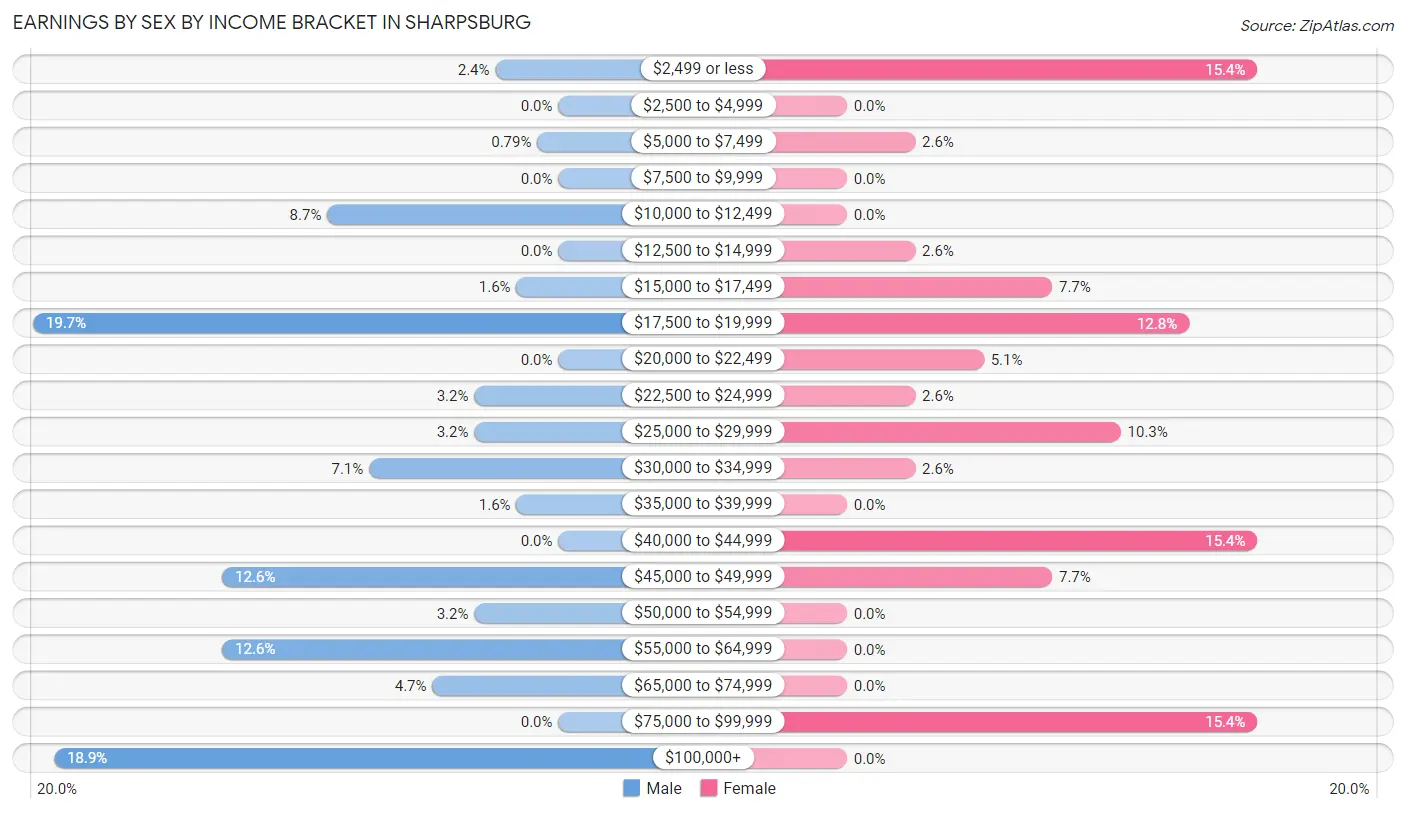
Earnings by Sex by Income Bracket in Sharpsburg
The most common earnings brackets in Sharpsburg are $17,500 to $19,999 for men (25 | 19.7%) and $2,499 or less for women (6 | 15.4%).
| Income | Male | Female |
| $2,499 or less | 3 (2.4%) | 6 (15.4%) |
| $2,500 to $4,999 | 0 (0.0%) | 0 (0.0%) |
| $5,000 to $7,499 | 1 (0.8%) | 1 (2.6%) |
| $7,500 to $9,999 | 0 (0.0%) | 0 (0.0%) |
| $10,000 to $12,499 | 11 (8.7%) | 0 (0.0%) |
| $12,500 to $14,999 | 0 (0.0%) | 1 (2.6%) |
| $15,000 to $17,499 | 2 (1.6%) | 3 (7.7%) |
| $17,500 to $19,999 | 25 (19.7%) | 5 (12.8%) |
| $20,000 to $22,499 | 0 (0.0%) | 2 (5.1%) |
| $22,500 to $24,999 | 4 (3.2%) | 1 (2.6%) |
| $25,000 to $29,999 | 4 (3.2%) | 4 (10.3%) |
| $30,000 to $34,999 | 9 (7.1%) | 1 (2.6%) |
| $35,000 to $39,999 | 2 (1.6%) | 0 (0.0%) |
| $40,000 to $44,999 | 0 (0.0%) | 6 (15.4%) |
| $45,000 to $49,999 | 16 (12.6%) | 3 (7.7%) |
| $50,000 to $54,999 | 4 (3.2%) | 0 (0.0%) |
| $55,000 to $64,999 | 16 (12.6%) | 0 (0.0%) |
| $65,000 to $74,999 | 6 (4.7%) | 0 (0.0%) |
| $75,000 to $99,999 | 0 (0.0%) | 6 (15.4%) |
| $100,000+ | 24 (18.9%) | 0 (0.0%) |
| Total | 127 (100.0%) | 39 (100.0%) |
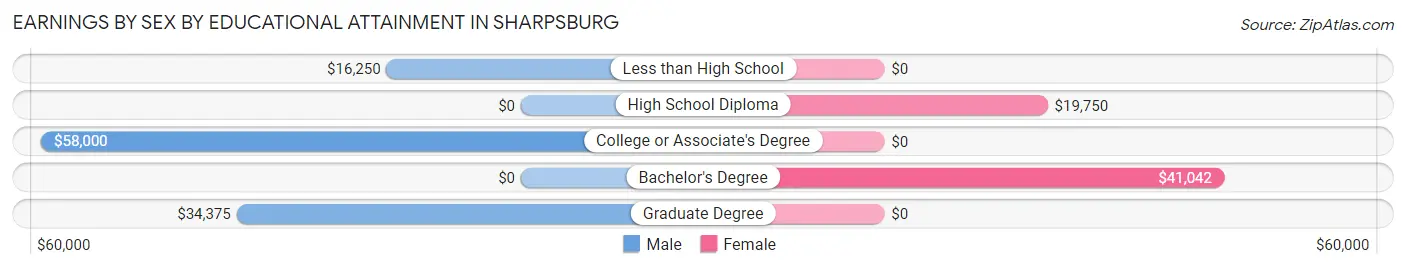
Earnings by Sex by Educational Attainment in Sharpsburg
Average earnings in Sharpsburg are $49,688 for men and $25,625 for women, a difference of 48.4%. Men with an educational attainment of college or associate's degree enjoy the highest average annual earnings of $58,000, while those with less than high school education earn the least with $16,250. Women with an educational attainment of bachelor's degree earn the most with the average annual earnings of $41,042, while those with high school diploma education have the smallest earnings of $19,750.
| Educational Attainment | Male Income | Female Income |
| Less than High School | $16,250 | $0 |
| High School Diploma | - | - |
| College or Associate's Degree | $58,000 | $0 |
| Bachelor's Degree | - | - |
| Graduate Degree | $34,375 | $0 |
| Total | $49,688 | $25,625 |
Family Income in Sharpsburg
Family Income Brackets in Sharpsburg
According to the Sharpsburg family income data, there are 20 families falling into the $50,000 to $74,999 income range, which is the most common income bracket and makes up 22.0% of all families.
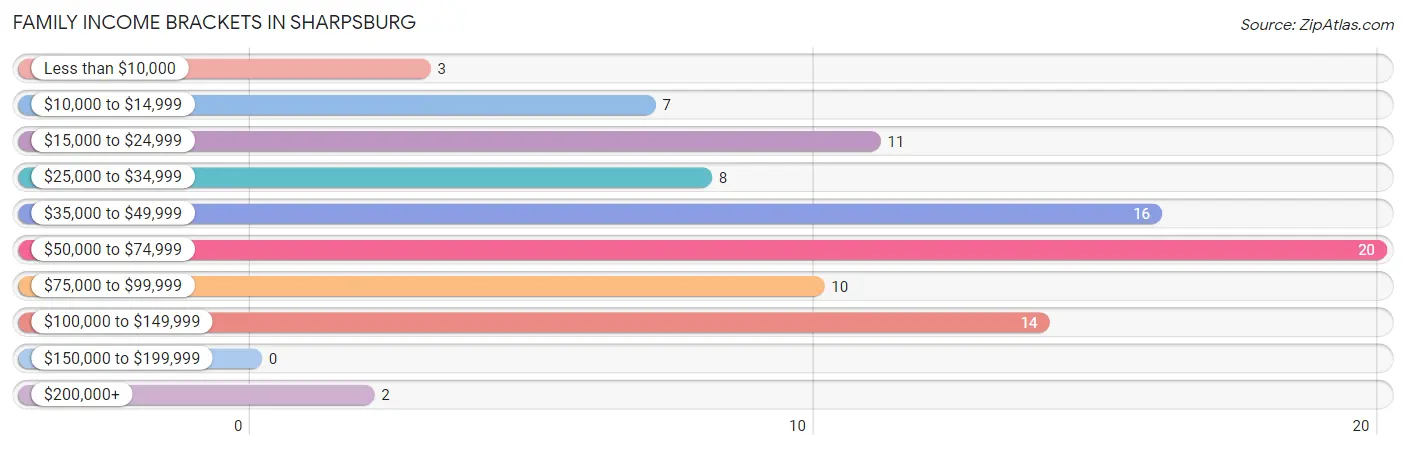
| Income Bracket | # Families | % Families |
| Less than $10,000 | 3 | 3.3% |
| $10,000 to $14,999 | 7 | 7.7% |
| $15,000 to $24,999 | 11 | 12.1% |
| $25,000 to $34,999 | 8 | 8.8% |
| $35,000 to $49,999 | 16 | 17.6% |
| $50,000 to $74,999 | 20 | 22.0% |
| $75,000 to $99,999 | 10 | 11.0% |
| $100,000 to $149,999 | 14 | 15.4% |
| $150,000 to $199,999 | 0 | 0.0% |
| $200,000+ | 2 | 2.2% |
Family Income by Famaliy Size in Sharpsburg
3-person families (10 | 11.0%) account for the highest median family income in Sharpsburg with $49,167 per family, while 2-person families (58 | 63.7%) have the highest median income of $22,322 per family member.
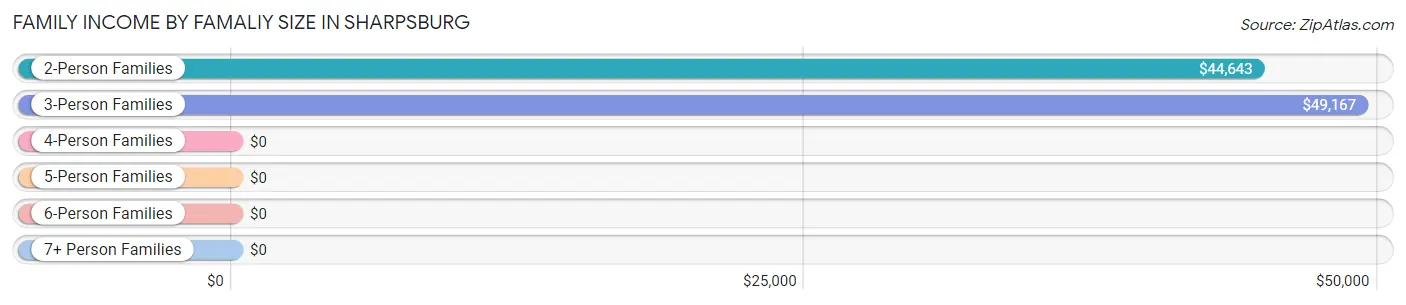
| Income Bracket | # Families | Median Income |
| 2-Person Families | 58 (63.7%) | $44,643 |
| 3-Person Families | 10 (11.0%) | $49,167 |
| 4-Person Families | 10 (11.0%) | $0 |
| 5-Person Families | 1 (1.1%) | $0 |
| 6-Person Families | 5 (5.5%) | $0 |
| 7+ Person Families | 7 (7.7%) | $0 |
| Total | 91 (100.0%) | $50,313 |
Family Income by Number of Earners in Sharpsburg

| Number of Earners | # Families | Median Income |
| No Earners | 31 (34.1%) | $0 |
| 1 Earner | 23 (25.3%) | $53,750 |
| 2 Earners | 35 (38.5%) | $83,750 |
| 3+ Earners | 2 (2.2%) | $0 |
| Total | 91 (100.0%) | $50,313 |
Household Income in Sharpsburg
Household Income Brackets in Sharpsburg
With 45 households falling in the category, the $10,000 to $14,999 income range is the most frequent in Sharpsburg, accounting for 25.3% of all households.
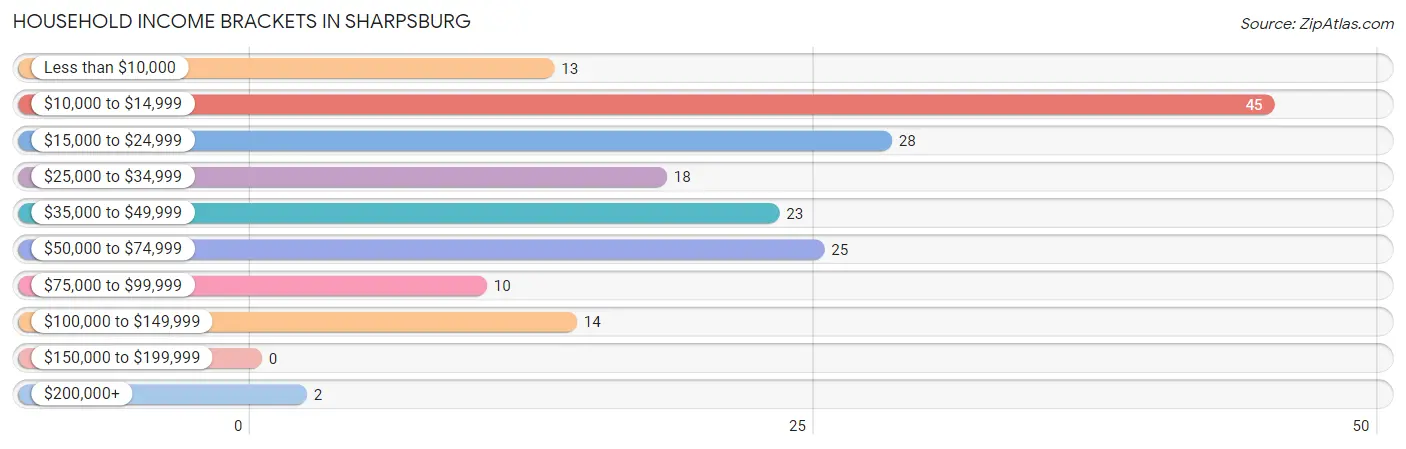
| Income Bracket | # Households | % Households |
| Less than $10,000 | 13 | 7.3% |
| $10,000 to $14,999 | 45 | 25.3% |
| $15,000 to $24,999 | 28 | 15.7% |
| $25,000 to $34,999 | 18 | 10.1% |
| $35,000 to $49,999 | 23 | 12.9% |
| $50,000 to $74,999 | 25 | 14.0% |
| $75,000 to $99,999 | 10 | 5.6% |
| $100,000 to $149,999 | 14 | 7.9% |
| $150,000 to $199,999 | 0 | 0.0% |
| $200,000+ | 2 | 1.1% |
Household Income by Householder Age in Sharpsburg
The median household income in Sharpsburg is $30,000, with the highest median household income of $68,750 found in the 25 to 44 years age bracket for the primary householder. A total of 26 households (14.6%) fall into this category. Meanwhile, the 15 to 24 years age bracket for the primary householder has the lowest median household income of $0, with 5 households (2.8%) in this group.
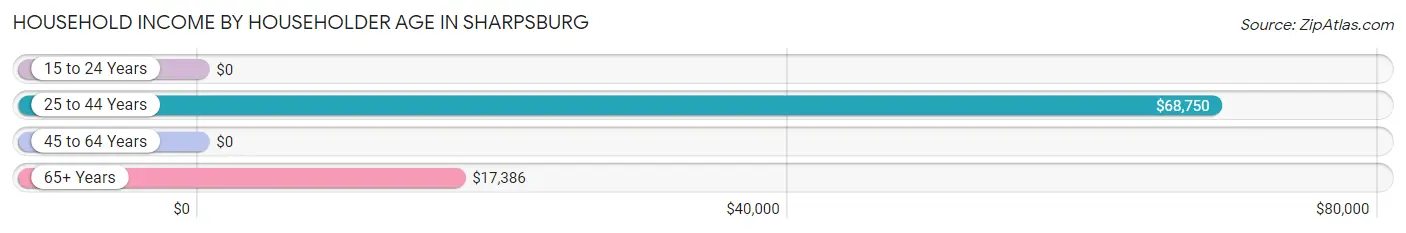
| Income Bracket | # Households | Median Income |
| 15 to 24 Years | 5 (2.8%) | $0 |
| 25 to 44 Years | 26 (14.6%) | $68,750 |
| 45 to 64 Years | 92 (51.7%) | $0 |
| 65+ Years | 55 (30.9%) | $17,386 |
| Total | 178 (100.0%) | $30,000 |
Poverty in Sharpsburg
Income Below Poverty by Sex and Age in Sharpsburg
With 17.5% poverty level for males and 40.6% for females among the residents of Sharpsburg, 5 year old males and 12 to 14 year old females are the most vulnerable to poverty, with 2 males (100.0%) and 6 females (100.0%) in their respective age groups living below the poverty level.
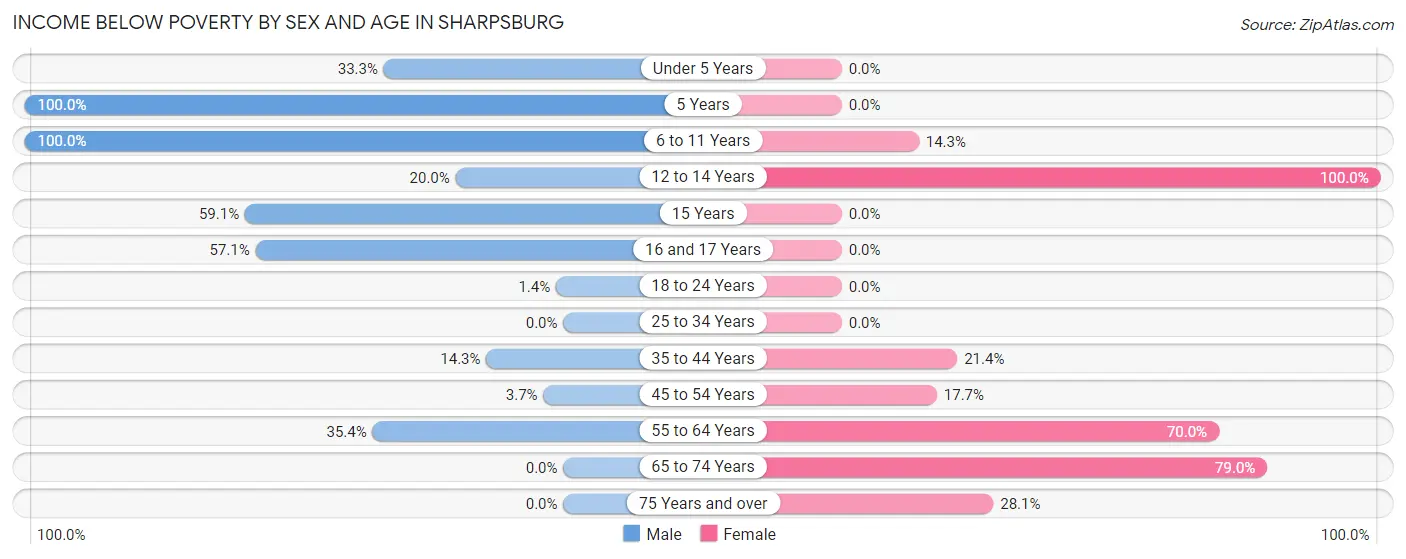
| Age Bracket | Male | Female |
| Under 5 Years | 1 (33.3%) | 0 (0.0%) |
| 5 Years | 2 (100.0%) | 0 (0.0%) |
| 6 to 11 Years | 1 (100.0%) | 1 (14.3%) |
| 12 to 14 Years | 4 (20.0%) | 6 (100.0%) |
| 15 Years | 13 (59.1%) | 0 (0.0%) |
| 16 and 17 Years | 4 (57.1%) | 0 (0.0%) |
| 18 to 24 Years | 1 (1.3%) | 0 (0.0%) |
| 25 to 34 Years | 0 (0.0%) | 0 (0.0%) |
| 35 to 44 Years | 3 (14.3%) | 3 (21.4%) |
| 45 to 54 Years | 1 (3.7%) | 3 (17.6%) |
| 55 to 64 Years | 17 (35.4%) | 28 (70.0%) |
| 65 to 74 Years | 0 (0.0%) | 15 (78.9%) |
| 75 Years and over | 0 (0.0%) | 9 (28.1%) |
| Total | 47 (17.5%) | 65 (40.6%) |
Income Above Poverty by Sex and Age in Sharpsburg
According to the poverty statistics in Sharpsburg, males aged 25 to 34 years and females aged under 5 years are the age groups that are most secure financially, with 100.0% of males and 100.0% of females in these age groups living above the poverty line.
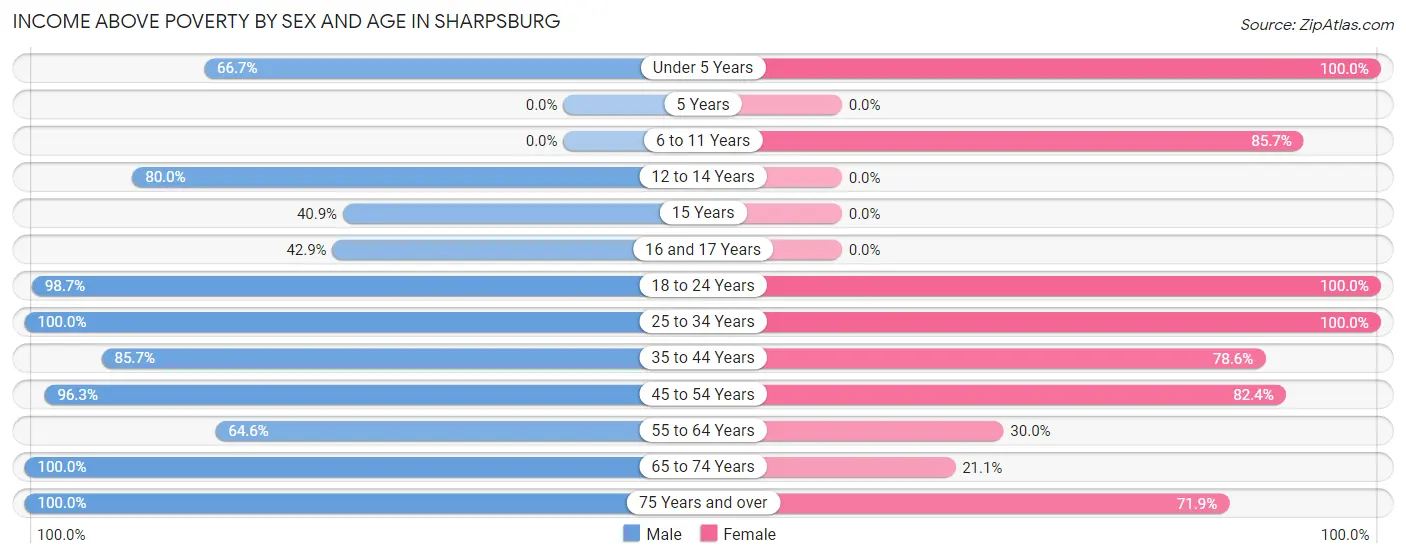
| Age Bracket | Male | Female |
| Under 5 Years | 2 (66.7%) | 6 (100.0%) |
| 5 Years | 0 (0.0%) | 0 (0.0%) |
| 6 to 11 Years | 0 (0.0%) | 6 (85.7%) |
| 12 to 14 Years | 16 (80.0%) | 0 (0.0%) |
| 15 Years | 9 (40.9%) | 0 (0.0%) |
| 16 and 17 Years | 3 (42.9%) | 0 (0.0%) |
| 18 to 24 Years | 73 (98.7%) | 4 (100.0%) |
| 25 to 34 Years | 23 (100.0%) | 15 (100.0%) |
| 35 to 44 Years | 18 (85.7%) | 11 (78.6%) |
| 45 to 54 Years | 26 (96.3%) | 14 (82.4%) |
| 55 to 64 Years | 31 (64.6%) | 12 (30.0%) |
| 65 to 74 Years | 9 (100.0%) | 4 (21.0%) |
| 75 Years and over | 11 (100.0%) | 23 (71.9%) |
| Total | 221 (82.5%) | 95 (59.4%) |
Income Below Poverty Among Married-Couple Families in Sharpsburg
The poverty statistics for married-couple families in Sharpsburg show that 12.8% or 6 of the total 47 families live below the poverty line. Families with 3 or 4 children have the highest poverty rate of 33.3%, comprising of 2 families. On the other hand, families with no children have the lowest poverty rate of 3.2%, which includes 1 families.
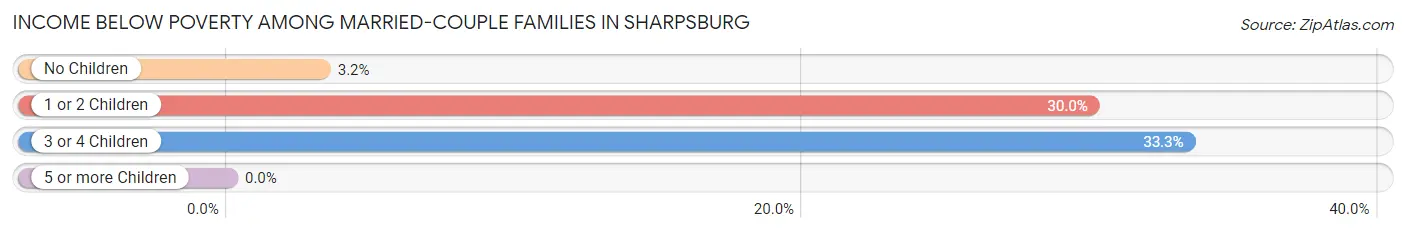
| Children | Above Poverty | Below Poverty |
| No Children | 30 (96.8%) | 1 (3.2%) |
| 1 or 2 Children | 7 (70.0%) | 3 (30.0%) |
| 3 or 4 Children | 4 (66.7%) | 2 (33.3%) |
| 5 or more Children | 0 (0.0%) | 0 (0.0%) |
| Total | 41 (87.2%) | 6 (12.8%) |
Income Below Poverty Among Single-Parent Households in Sharpsburg
According to the poverty data in Sharpsburg, 5.9% or 1 single-father households and 63.0% or 17 single-mother households are living below the poverty line. Among single-father households, those with no children have the highest poverty rate, with 1 households (9.1%) experiencing poverty. Likewise, among single-mother households, those with 1 or 2 children have the highest poverty rate, with 15 households (88.2%) falling below the poverty line.
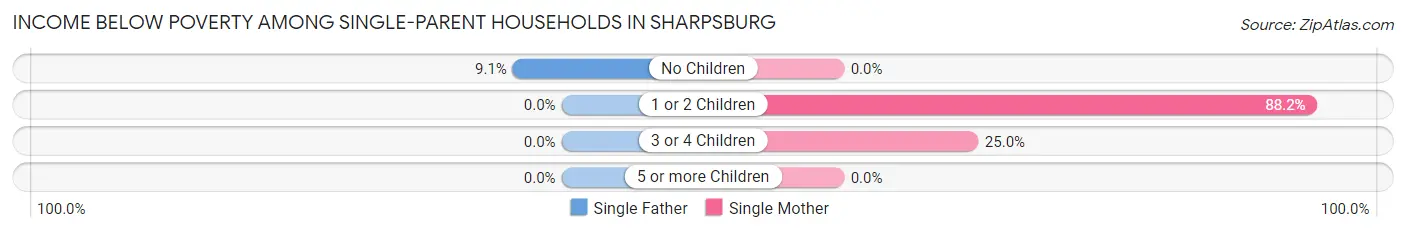
| Children | Single Father | Single Mother |
| No Children | 1 (9.1%) | 0 (0.0%) |
| 1 or 2 Children | 0 (0.0%) | 15 (88.2%) |
| 3 or 4 Children | 0 (0.0%) | 2 (25.0%) |
| 5 or more Children | 0 (0.0%) | 0 (0.0%) |
| Total | 1 (5.9%) | 17 (63.0%) |
Income Below Poverty Among Married-Couple vs Single-Parent Households in Sharpsburg
The poverty data for Sharpsburg shows that 6 of the married-couple family households (12.8%) and 18 of the single-parent households (40.9%) are living below the poverty level. Within the married-couple family households, those with 3 or 4 children have the highest poverty rate, with 2 households (33.3%) falling below the poverty line. Among the single-parent households, those with 1 or 2 children have the highest poverty rate, with 15 household (65.2%) living below poverty.
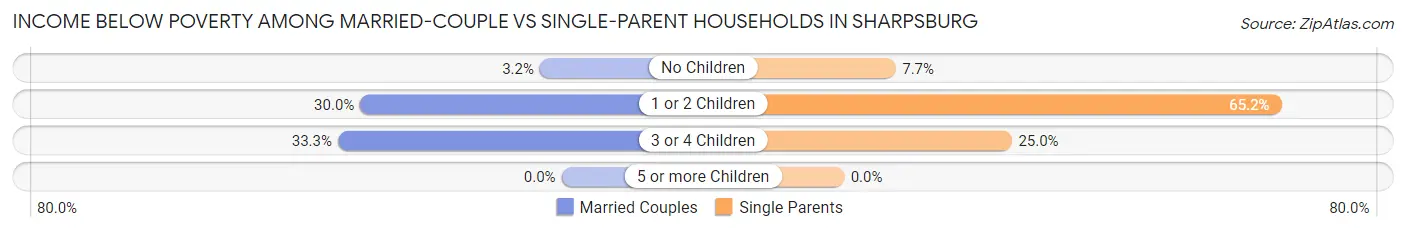
| Children | Married-Couple Families | Single-Parent Households |
| No Children | 1 (3.2%) | 1 (7.7%) |
| 1 or 2 Children | 3 (30.0%) | 15 (65.2%) |
| 3 or 4 Children | 2 (33.3%) | 2 (25.0%) |
| 5 or more Children | 0 (0.0%) | 0 (0.0%) |
| Total | 6 (12.8%) | 18 (40.9%) |
Race in Sharpsburg
The most populous races in Sharpsburg are White / Caucasian (252 | 58.9%), Hispanic or Latino (124 | 29.0%), and Some other Race (113 | 26.4%).
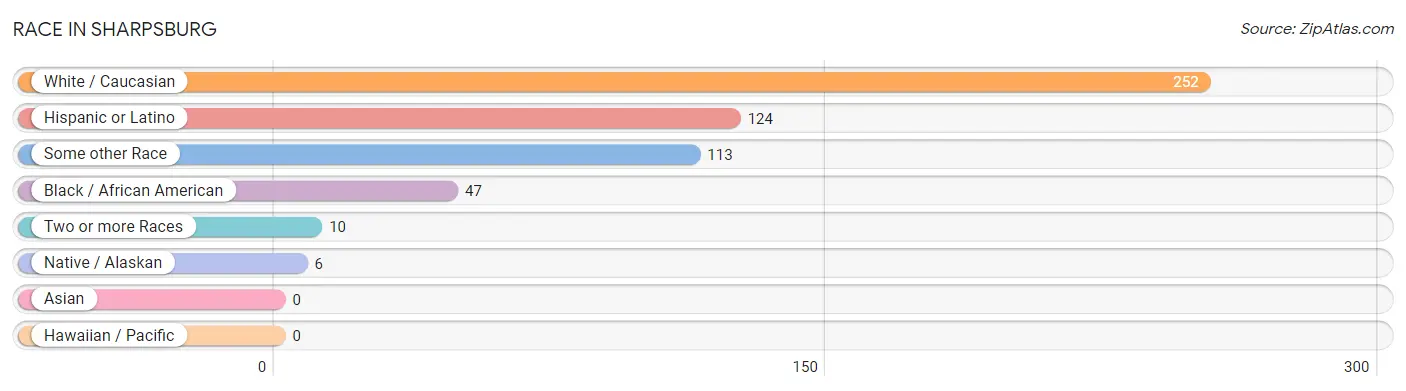
| Race | # Population | % Population |
| Asian | 0 | 0.0% |
| Black / African American | 47 | 11.0% |
| Hawaiian / Pacific | 0 | 0.0% |
| Hispanic or Latino | 124 | 29.0% |
| Native / Alaskan | 6 | 1.4% |
| White / Caucasian | 252 | 58.9% |
| Two or more Races | 10 | 2.3% |
| Some other Race | 113 | 26.4% |
| Total | 428 | 100.0% |
Ancestry in Sharpsburg
The most populous ancestries reported in Sharpsburg are Mexican (123 | 28.7%), American (75 | 17.5%), Irish (45 | 10.5%), English (24 | 5.6%), and German (13 | 3.0%), together accounting for 65.4% of all Sharpsburg residents.
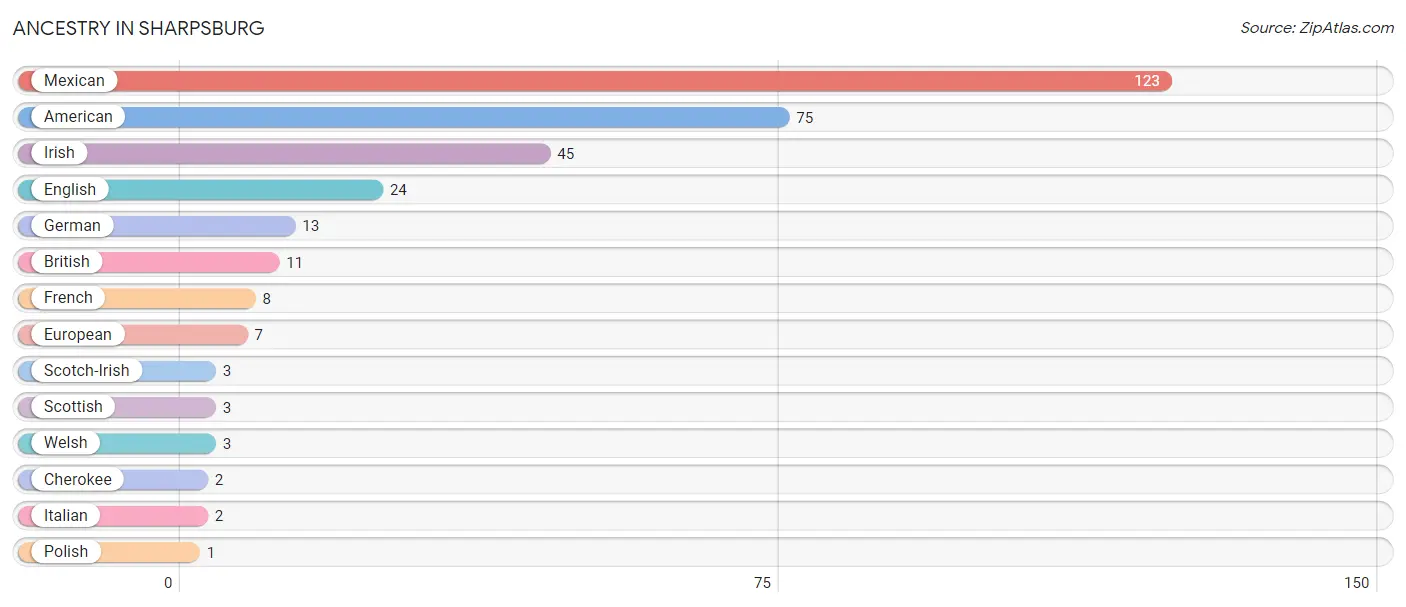
| Ancestry | # Population | % Population |
| American | 75 | 17.5% |
| British | 11 | 2.6% |
| Cherokee | 2 | 0.5% |
| English | 24 | 5.6% |
| European | 7 | 1.6% |
| French | 8 | 1.9% |
| German | 13 | 3.0% |
| Irish | 45 | 10.5% |
| Italian | 2 | 0.5% |
| Mexican | 123 | 28.7% |
| Polish | 1 | 0.2% |
| Scotch-Irish | 3 | 0.7% |
| Scottish | 3 | 0.7% |
| Welsh | 3 | 0.7% | View All 14 Rows |
Immigrants in Sharpsburg
The most numerous immigrant groups reported in Sharpsburg came from Central America (10 | 2.3%), Latin America (10 | 2.3%), and Mexico (10 | 2.3%), together accounting for 7.0% of all Sharpsburg residents.
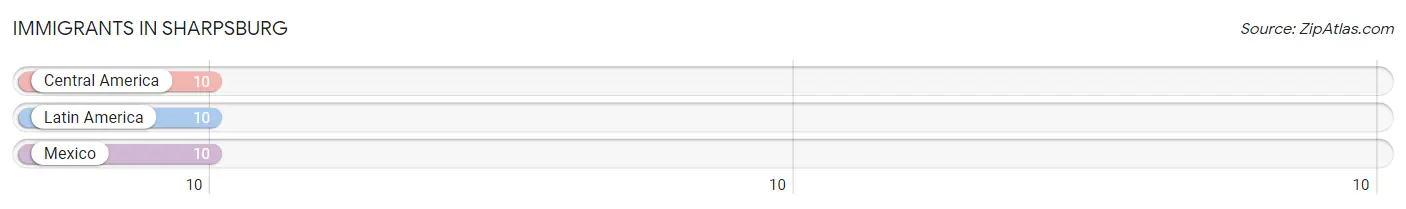
| Immigration Origin | # Population | % Population |
| Central America | 10 | 2.3% |
| Latin America | 10 | 2.3% |
| Mexico | 10 | 2.3% | View All 3 Rows |
Sex and Age in Sharpsburg
Sex and Age in Sharpsburg
The most populous age groups in Sharpsburg are 20 to 24 Years (73 | 27.2%) for men and 55 to 59 Years (25 | 15.6%) for women.
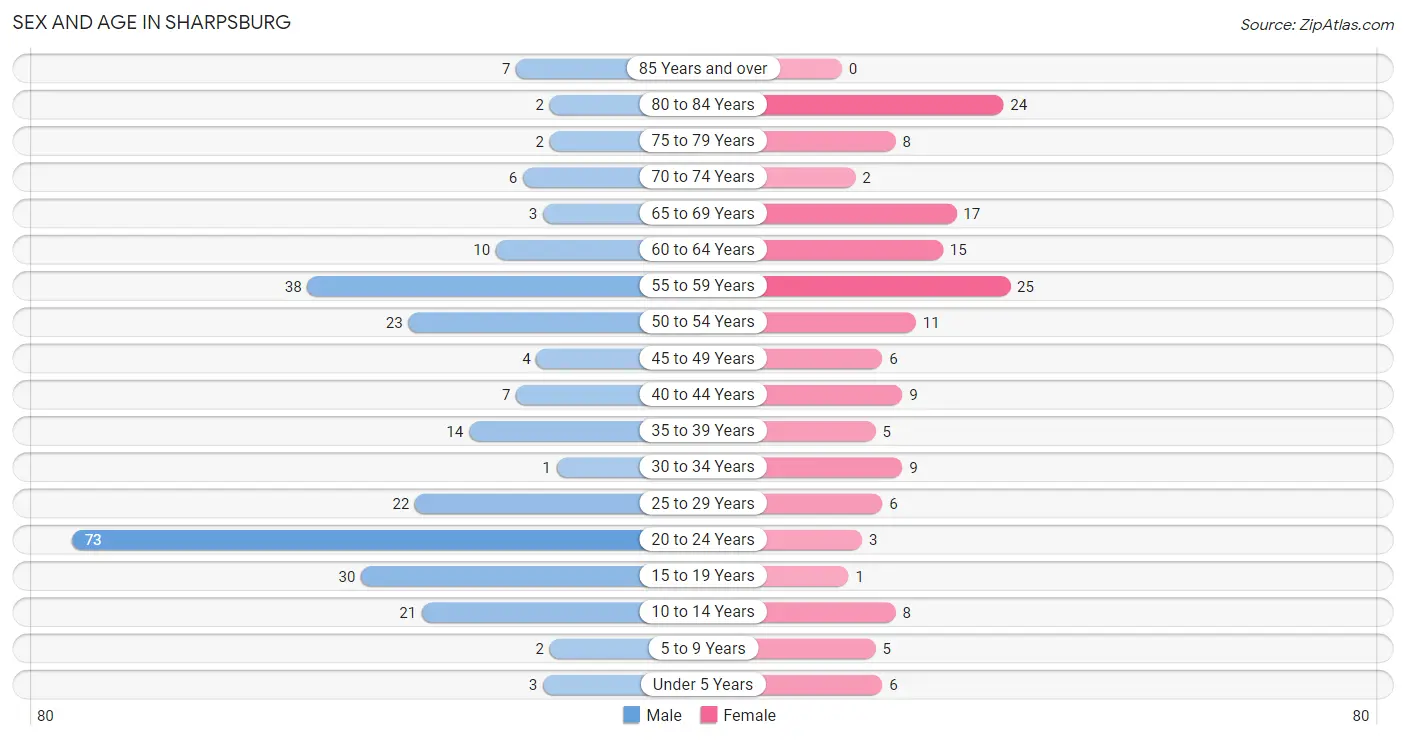
| Age Bracket | Male | Female |
| Under 5 Years | 3 (1.1%) | 6 (3.7%) |
| 5 to 9 Years | 2 (0.7%) | 5 (3.1%) |
| 10 to 14 Years | 21 (7.8%) | 8 (5.0%) |
| 15 to 19 Years | 30 (11.2%) | 1 (0.6%) |
| 20 to 24 Years | 73 (27.2%) | 3 (1.9%) |
| 25 to 29 Years | 22 (8.2%) | 6 (3.7%) |
| 30 to 34 Years | 1 (0.4%) | 9 (5.6%) |
| 35 to 39 Years | 14 (5.2%) | 5 (3.1%) |
| 40 to 44 Years | 7 (2.6%) | 9 (5.6%) |
| 45 to 49 Years | 4 (1.5%) | 6 (3.7%) |
| 50 to 54 Years | 23 (8.6%) | 11 (6.9%) |
| 55 to 59 Years | 38 (14.2%) | 25 (15.6%) |
| 60 to 64 Years | 10 (3.7%) | 15 (9.4%) |
| 65 to 69 Years | 3 (1.1%) | 17 (10.6%) |
| 70 to 74 Years | 6 (2.2%) | 2 (1.3%) |
| 75 to 79 Years | 2 (0.7%) | 8 (5.0%) |
| 80 to 84 Years | 2 (0.7%) | 24 (15.0%) |
| 85 Years and over | 7 (2.6%) | 0 (0.0%) |
| Total | 268 (100.0%) | 160 (100.0%) |
Families and Households in Sharpsburg
Median Family Size in Sharpsburg
The median family size in Sharpsburg is 3.74 persons per family, with single female/mother families (27 | 29.7%) accounting for the largest median family size of 5.81 persons per family. On the other hand, single male/father families (17 | 18.7%) represent the smallest median family size with 2.29 persons per family.
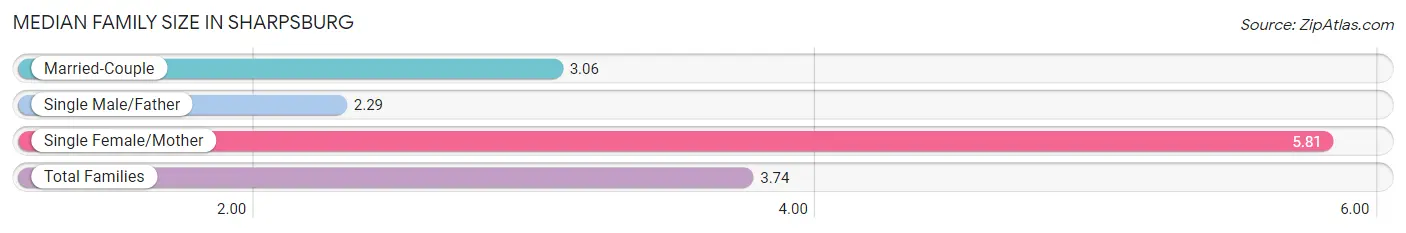
| Family Type | # Families | Family Size |
| Married-Couple | 47 (51.6%) | 3.06 |
| Single Male/Father | 17 (18.7%) | 2.29 |
| Single Female/Mother | 27 (29.7%) | 5.81 |
| Total Families | 91 (100.0%) | 3.74 |
Median Household Size in Sharpsburg
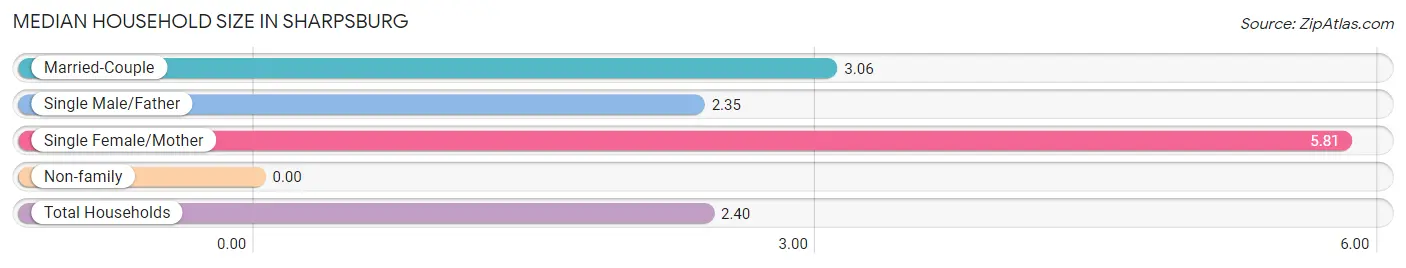
| Household Type | # Households | Household Size |
| Married-Couple | 47 (26.4%) | 3.06 |
| Single Male/Father | 17 (9.6%) | 2.35 |
| Single Female/Mother | 27 (15.2%) | 5.81 |
| Non-family | 87 (48.9%) | - |
| Total Households | 178 (100.0%) | 2.40 |
Household Size by Marriage Status in Sharpsburg
Out of a total of 178 households in Sharpsburg, 91 (51.1%) are family households, while 87 (48.9%) are nonfamily households. The most numerous type of family households are 2-person households, comprising 57, and the most common type of nonfamily households are 1-person households, comprising 87.
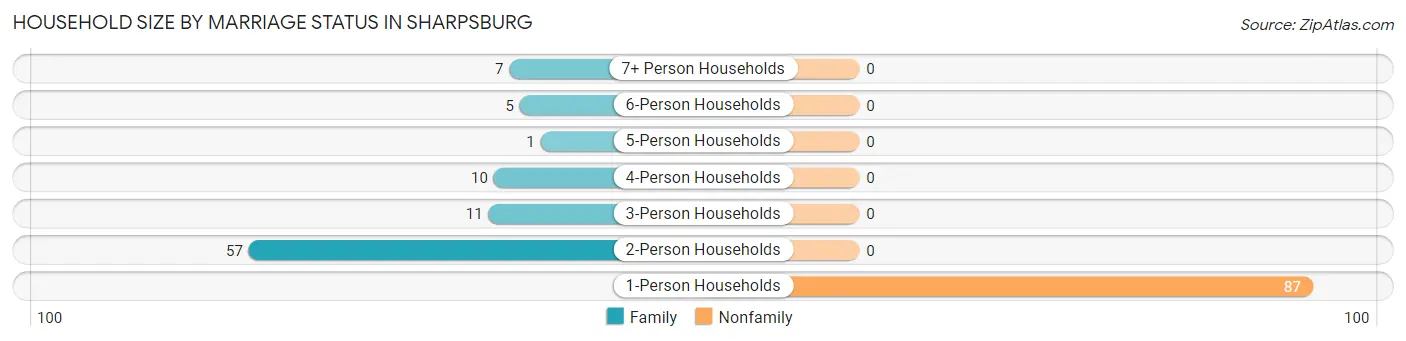
| Household Size | Family Households | Nonfamily Households |
| 1-Person Households | - | 87 (48.9%) |
| 2-Person Households | 57 (32.0%) | 0 (0.0%) |
| 3-Person Households | 11 (6.2%) | 0 (0.0%) |
| 4-Person Households | 10 (5.6%) | 0 (0.0%) |
| 5-Person Households | 1 (0.6%) | 0 (0.0%) |
| 6-Person Households | 5 (2.8%) | 0 (0.0%) |
| 7+ Person Households | 7 (3.9%) | 0 (0.0%) |
| Total | 91 (51.1%) | 87 (48.9%) |
Female Fertility in Sharpsburg
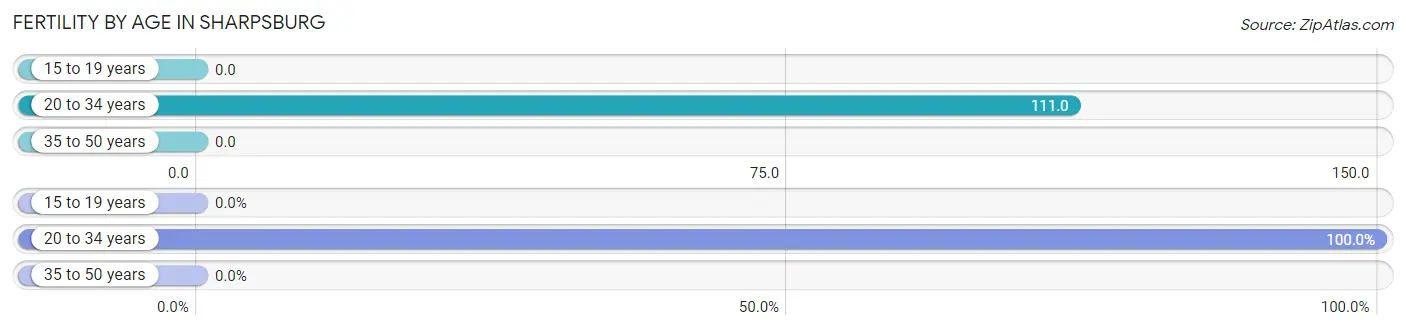
Fertility by Age in Sharpsburg
Average fertility rate in Sharpsburg is 44.0 births per 1,000 women. Women in the age bracket of 20 to 34 years have the highest fertility rate with 111.0 births per 1,000 women. Women in the age bracket of 20 to 34 years acount for 100.0% of all women with births.
| Age Bracket | Women with Births | Births / 1,000 Women |
| 15 to 19 years | 0 (0.0%) | 0.0 |
| 20 to 34 years | 2 (100.0%) | 111.0 |
| 35 to 50 years | 0 (0.0%) | 0.0 |
| Total | 2 (100.0%) | 44.0 |
Fertility by Age by Marriage Status in Sharpsburg
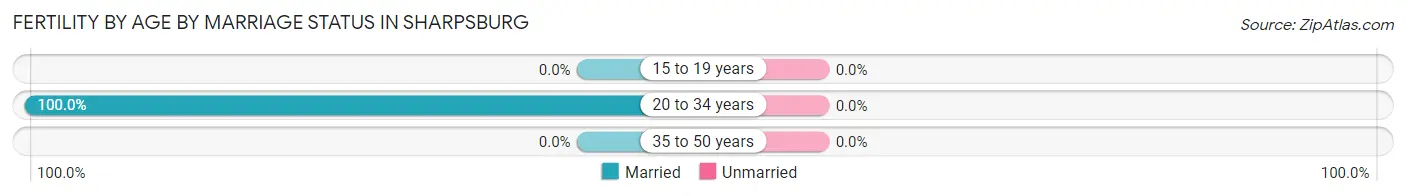
| Age Bracket | Married | Unmarried |
| 15 to 19 years | 0 (0.0%) | 0 (0.0%) |
| 20 to 34 years | 2 (100.0%) | 0 (0.0%) |
| 35 to 50 years | 0 (0.0%) | 0 (0.0%) |
| Total | 2 (100.0%) | 0 (0.0%) |
Fertility by Education in Sharpsburg
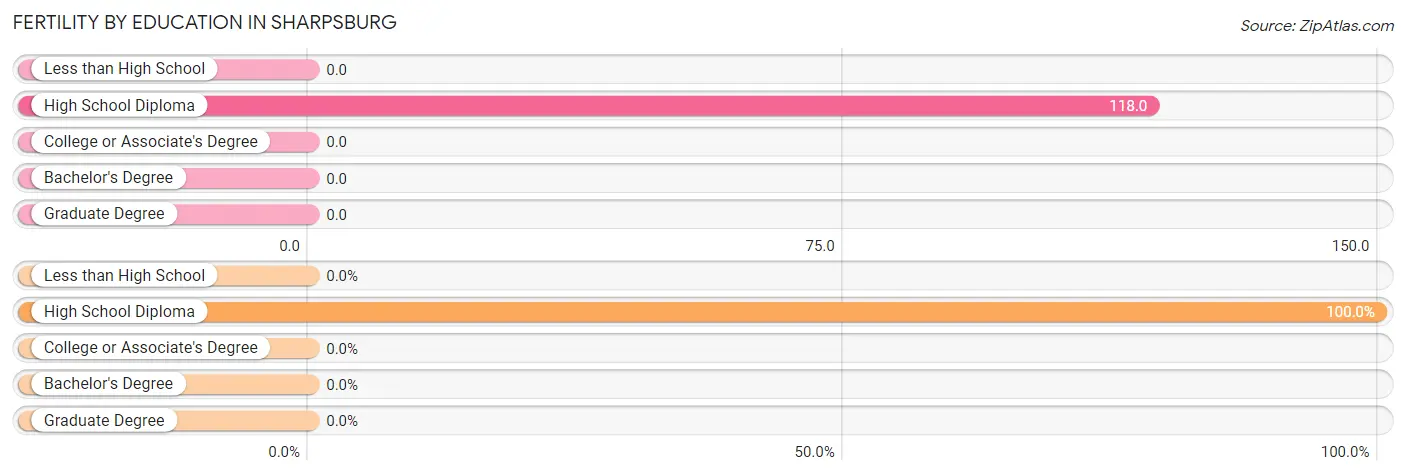
| Educational Attainment | Women with Births | Births / 1,000 Women |
| Less than High School | 0 (0.0%) | 0.0 |
| High School Diploma | 2 (100.0%) | 118.0 |
| College or Associate's Degree | 0 (0.0%) | 0.0 |
| Bachelor's Degree | 0 (0.0%) | 0.0 |
| Graduate Degree | 0 (0.0%) | 0.0 |
| Total | 2 (100.0%) | 44.0 |
Fertility by Education by Marriage Status in Sharpsburg
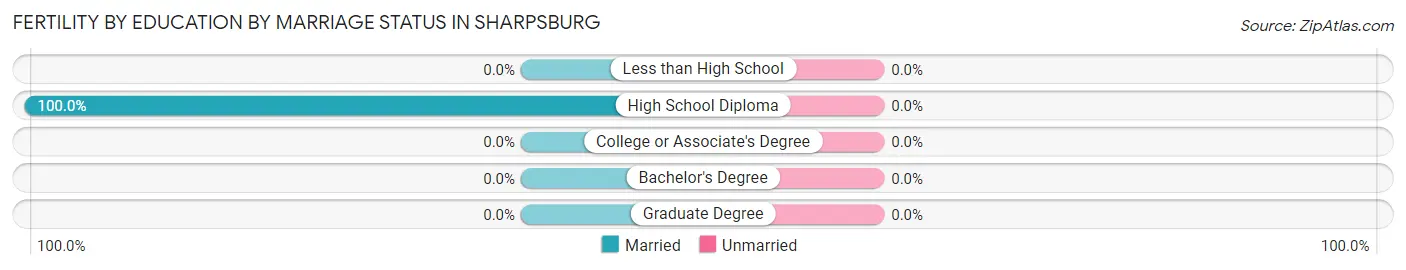
| Educational Attainment | Married | Unmarried |
| Less than High School | 0 (0.0%) | 0 (0.0%) |
| High School Diploma | 2 (100.0%) | 0 (0.0%) |
| College or Associate's Degree | 0 (0.0%) | 0 (0.0%) |
| Bachelor's Degree | 0 (0.0%) | 0 (0.0%) |
| Graduate Degree | 0 (0.0%) | 0 (0.0%) |
| Total | 2 (100.0%) | 0 (0.0%) |
Employment Characteristics in Sharpsburg
Employment by Class of Employer in Sharpsburg
Among the 151 employed individuals in Sharpsburg, private company employees (104 | 68.9%), self-employed (not incorporated) (13 | 8.6%), and not-for-profit organizations (12 | 8.0%) make up the most common classes of employment.
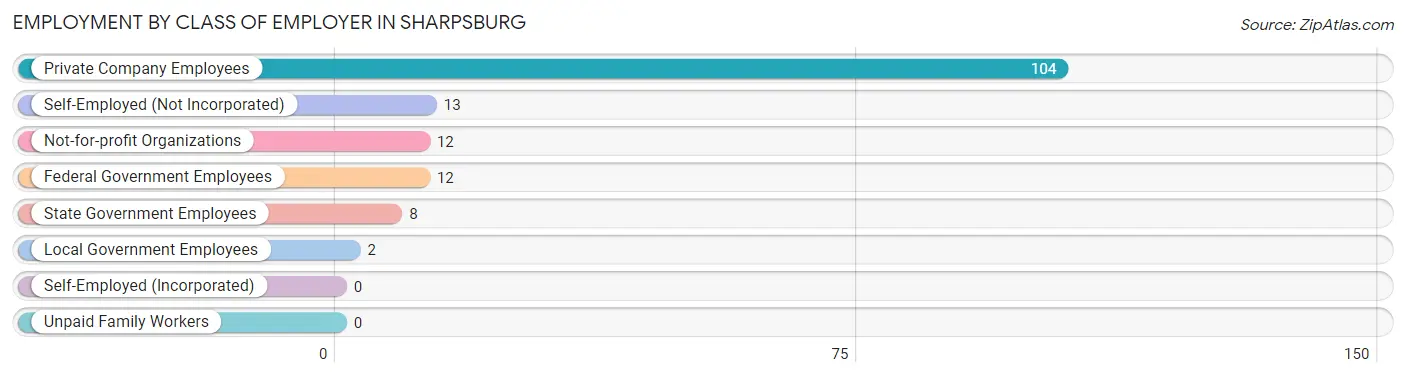
| Employer Class | # Employees | % Employees |
| Private Company Employees | 104 | 68.9% |
| Self-Employed (Incorporated) | 0 | 0.0% |
| Self-Employed (Not Incorporated) | 13 | 8.6% |
| Not-for-profit Organizations | 12 | 8.0% |
| Local Government Employees | 2 | 1.3% |
| State Government Employees | 8 | 5.3% |
| Federal Government Employees | 12 | 8.0% |
| Unpaid Family Workers | 0 | 0.0% |
| Total | 151 | 100.0% |
Employment Status by Age in Sharpsburg
According to the labor force statistics for Sharpsburg, out of the total population over 16 years of age (361), 45.4% or 164 individuals are in the labor force, with 7.9% or 13 of them unemployed. The age group with the highest labor force participation rate is 25 to 29 years, with 100.0% or 28 individuals in the labor force. Within the labor force, the 16 to 19 years age range has the highest percentage of unemployed individuals, with 100.0% or 3 of them being unemployed.
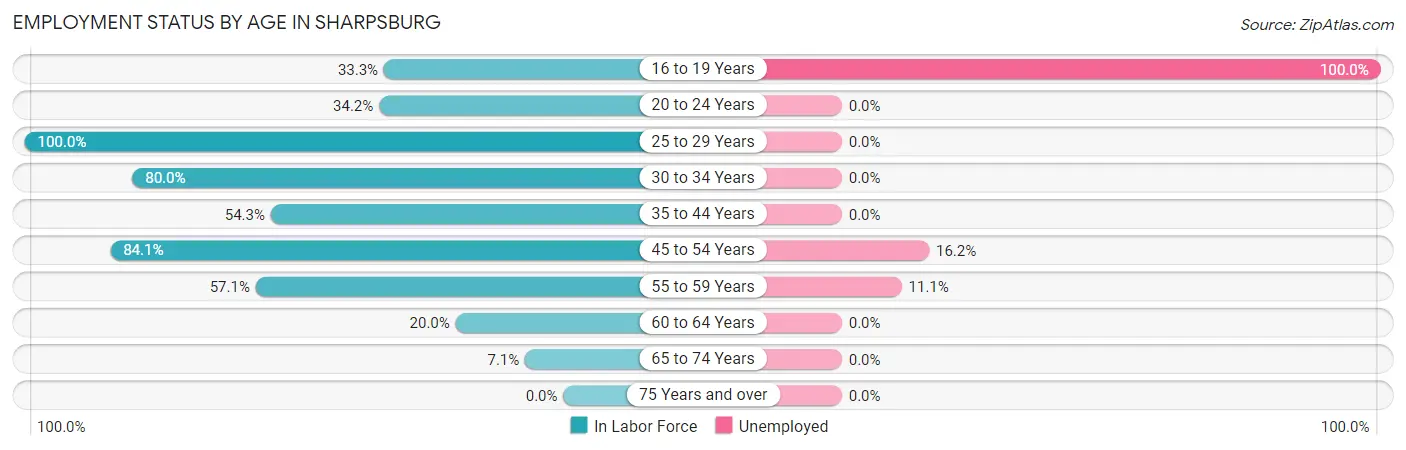
| Age Bracket | In Labor Force | Unemployed |
| 16 to 19 Years | 3 (33.3%) | 3 (100.0%) |
| 20 to 24 Years | 26 (34.2%) | 0 (0.0%) |
| 25 to 29 Years | 28 (100.0%) | 0 (0.0%) |
| 30 to 34 Years | 8 (80.0%) | 0 (0.0%) |
| 35 to 44 Years | 19 (54.3%) | 0 (0.0%) |
| 45 to 54 Years | 37 (84.1%) | 6 (16.2%) |
| 55 to 59 Years | 36 (57.1%) | 4 (11.1%) |
| 60 to 64 Years | 5 (20.0%) | 0 (0.0%) |
| 65 to 74 Years | 2 (7.1%) | 0 (0.0%) |
| 75 Years and over | 0 (0.0%) | 0 (0.0%) |
| Total | 164 (45.4%) | 13 (7.9%) |
Employment Status by Educational Attainment in Sharpsburg
According to labor force statistics for Sharpsburg, 64.9% of individuals (133) out of the total population between 25 and 64 years of age (205) are in the labor force, with 7.5% or 10 of them being unemployed. The group with the highest labor force participation rate are those with the educational attainment of college / associate degree, with 95.9% or 47 individuals in the labor force. Within the labor force, individuals with college / associate degree education have the highest percentage of unemployment, with 12.8% or 6 of them being unemployed.
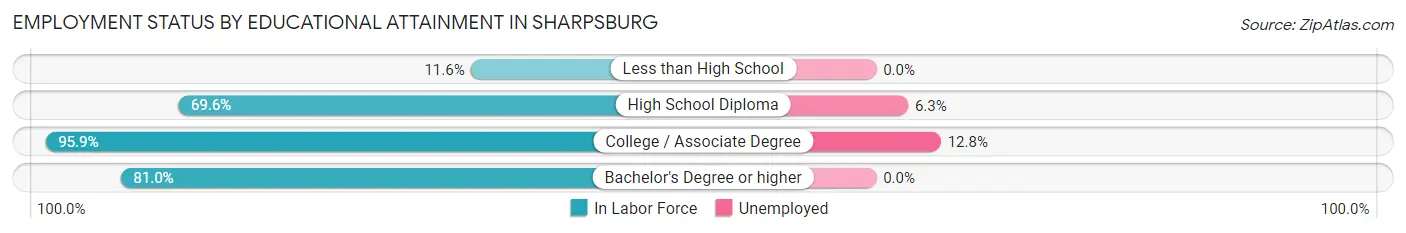
| Educational Attainment | In Labor Force | Unemployed |
| Less than High School | 5 (11.6%) | 0 (0.0%) |
| High School Diploma | 64 (69.6%) | 6 (6.3%) |
| College / Associate Degree | 47 (95.9%) | 6 (12.8%) |
| Bachelor's Degree or higher | 17 (81.0%) | 0 (0.0%) |
| Total | 133 (64.9%) | 15 (7.5%) |
Employment Occupations by Sex in Sharpsburg
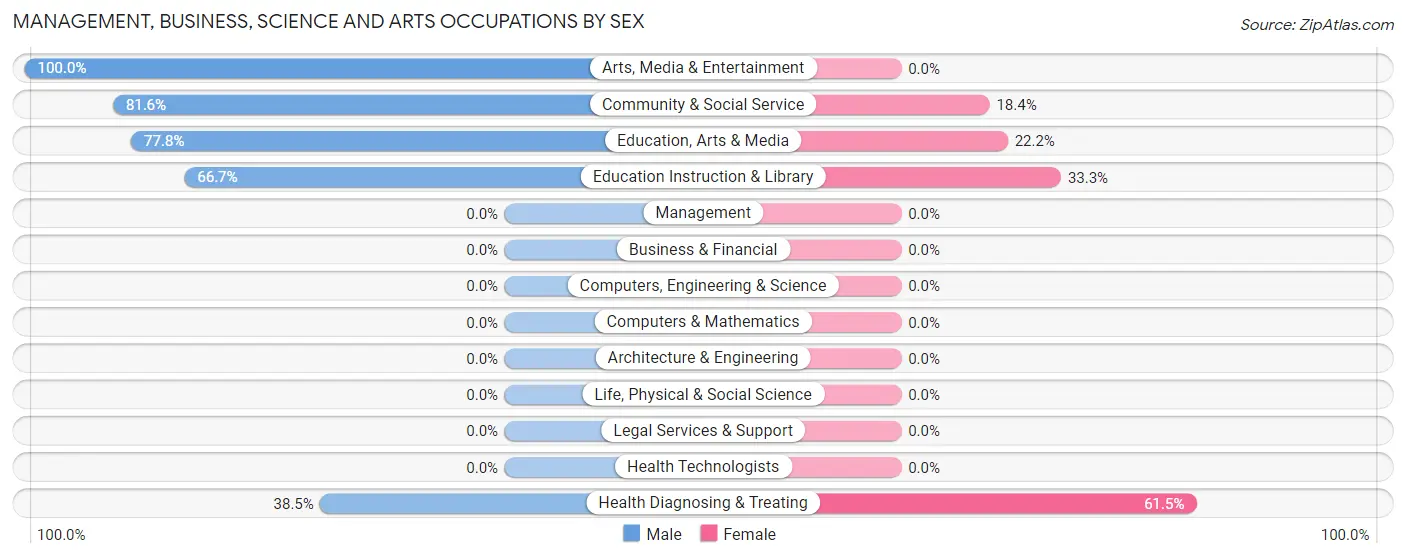
Management, Business, Science and Arts Occupations
The most common Management, Business, Science and Arts occupations in Sharpsburg are Community & Social Service (38 | 25.2%), Education, Arts & Media (27 | 17.9%), Health Diagnosing & Treating (13 | 8.6%), Arts, Media & Entertainment (8 | 5.3%), and Education Instruction & Library (3 | 2.0%).
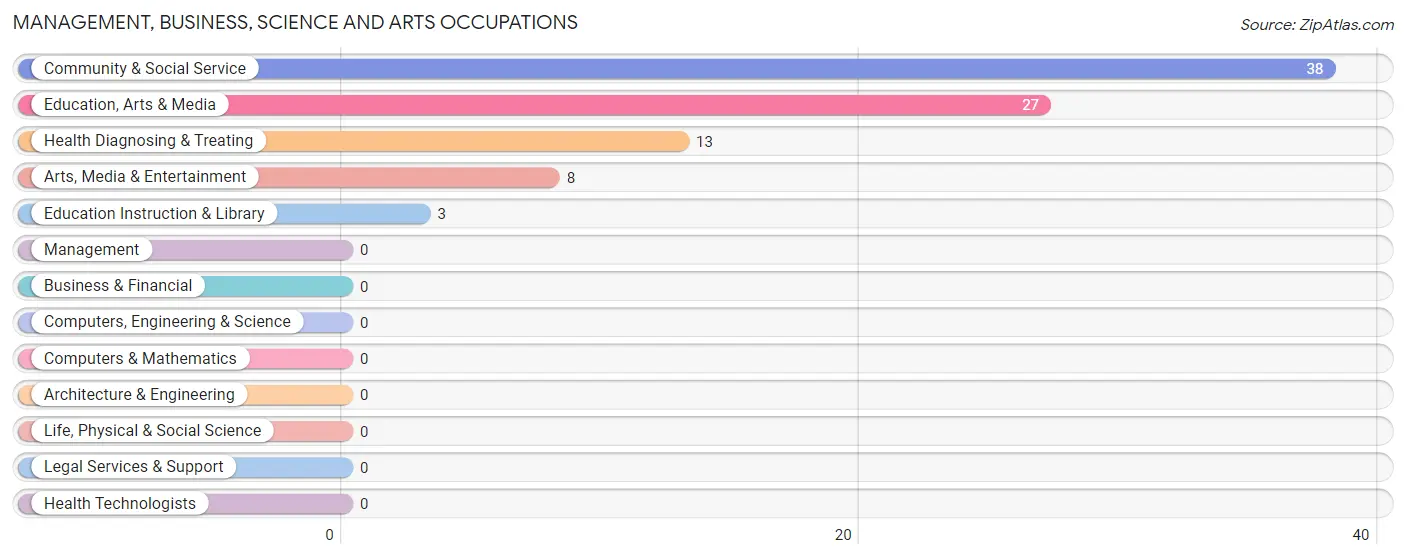
Management, Business, Science and Arts Occupations by Sex
Within the Management, Business, Science and Arts occupations in Sharpsburg, the most male-oriented occupations are Arts, Media & Entertainment (100.0%), Community & Social Service (81.6%), and Education, Arts & Media (77.8%), while the most female-oriented occupations are Health Diagnosing & Treating (61.5%), Education Instruction & Library (33.3%), and Education, Arts & Media (22.2%).
| Occupation | Male | Female |
| Management | 0 (0.0%) | 0 (0.0%) |
| Business & Financial | 0 (0.0%) | 0 (0.0%) |
| Computers, Engineering & Science | 0 (0.0%) | 0 (0.0%) |
| Computers & Mathematics | 0 (0.0%) | 0 (0.0%) |
| Architecture & Engineering | 0 (0.0%) | 0 (0.0%) |
| Life, Physical & Social Science | 0 (0.0%) | 0 (0.0%) |
| Community & Social Service | 31 (81.6%) | 7 (18.4%) |
| Education, Arts & Media | 21 (77.8%) | 6 (22.2%) |
| Legal Services & Support | 0 (0.0%) | 0 (0.0%) |
| Education Instruction & Library | 2 (66.7%) | 1 (33.3%) |
| Arts, Media & Entertainment | 8 (100.0%) | 0 (0.0%) |
| Health Diagnosing & Treating | 5 (38.5%) | 8 (61.5%) |
| Health Technologists | 0 (0.0%) | 0 (0.0%) |
| Total (Category) | 36 (70.6%) | 15 (29.4%) |
| Total (Overall) | 116 (76.8%) | 35 (23.2%) |
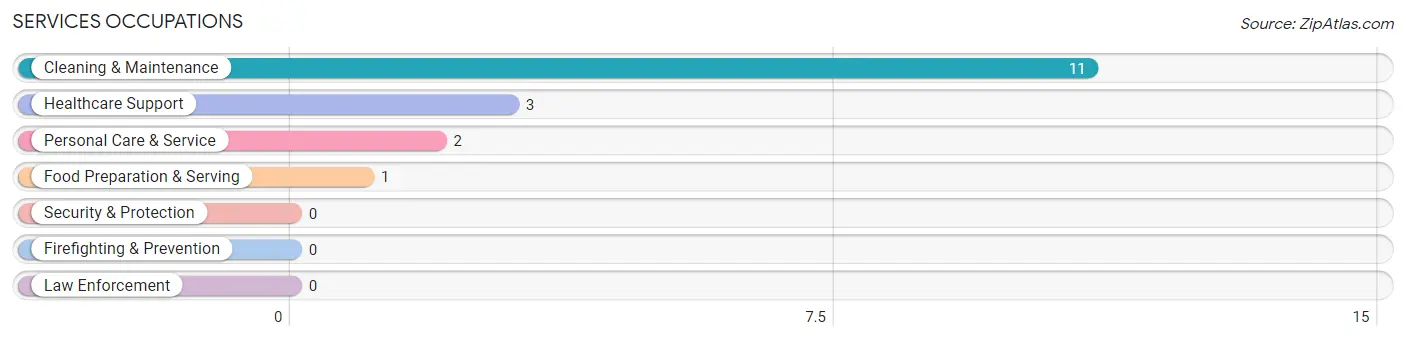
Services Occupations
The most common Services occupations in Sharpsburg are Cleaning & Maintenance (11 | 7.3%), Healthcare Support (3 | 2.0%), Personal Care & Service (2 | 1.3%), and Food Preparation & Serving (1 | 0.7%).
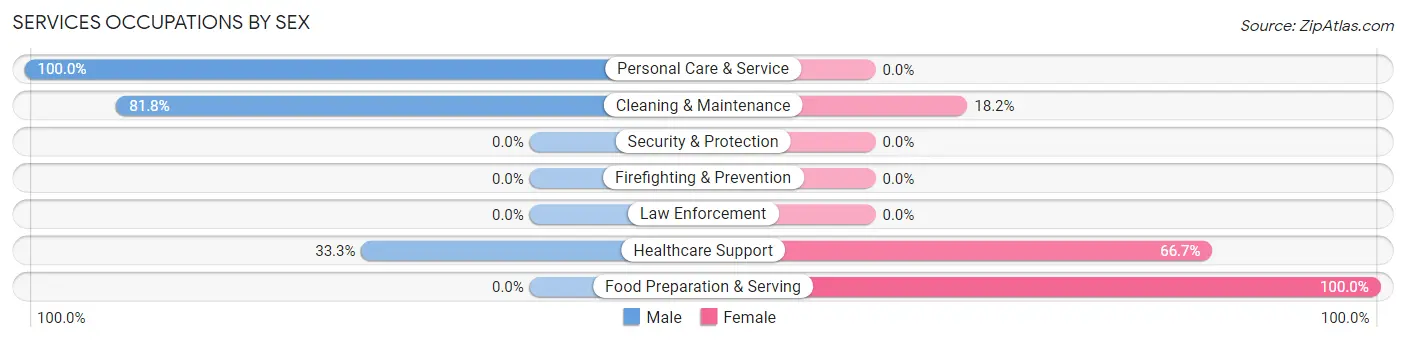
Services Occupations by Sex
Within the Services occupations in Sharpsburg, the most male-oriented occupations are Personal Care & Service (100.0%), Cleaning & Maintenance (81.8%), and Healthcare Support (33.3%), while the most female-oriented occupations are Food Preparation & Serving (100.0%), Healthcare Support (66.7%), and Cleaning & Maintenance (18.2%).
| Occupation | Male | Female |
| Healthcare Support | 1 (33.3%) | 2 (66.7%) |
| Security & Protection | 0 (0.0%) | 0 (0.0%) |
| Firefighting & Prevention | 0 (0.0%) | 0 (0.0%) |
| Law Enforcement | 0 (0.0%) | 0 (0.0%) |
| Food Preparation & Serving | 0 (0.0%) | 1 (100.0%) |
| Cleaning & Maintenance | 9 (81.8%) | 2 (18.2%) |
| Personal Care & Service | 2 (100.0%) | 0 (0.0%) |
| Total (Category) | 12 (70.6%) | 5 (29.4%) |
| Total (Overall) | 116 (76.8%) | 35 (23.2%) |
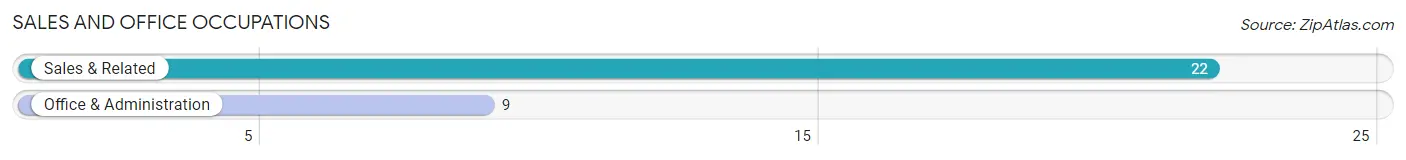
Sales and Office Occupations
The most common Sales and Office occupations in Sharpsburg are Sales & Related (22 | 14.6%), and Office & Administration (9 | 6.0%).
Sales and Office Occupations by Sex
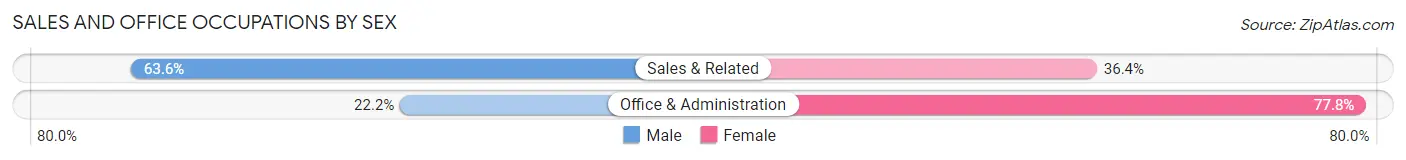
| Occupation | Male | Female |
| Sales & Related | 14 (63.6%) | 8 (36.4%) |
| Office & Administration | 2 (22.2%) | 7 (77.8%) |
| Total (Category) | 16 (51.6%) | 15 (48.4%) |
| Total (Overall) | 116 (76.8%) | 35 (23.2%) |
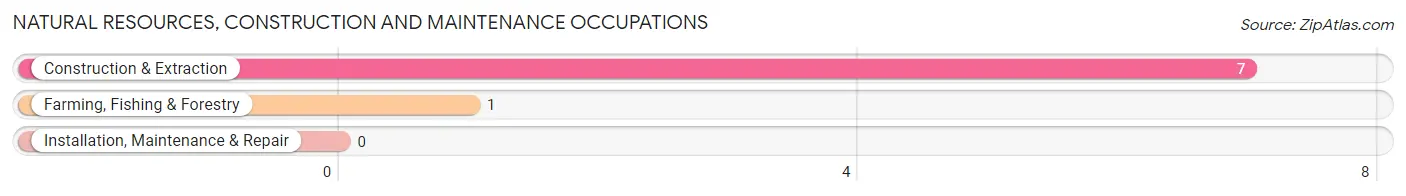
Natural Resources, Construction and Maintenance Occupations
The most common Natural Resources, Construction and Maintenance occupations in Sharpsburg are Construction & Extraction (7 | 4.6%), and Farming, Fishing & Forestry (1 | 0.7%).
Natural Resources, Construction and Maintenance Occupations by Sex
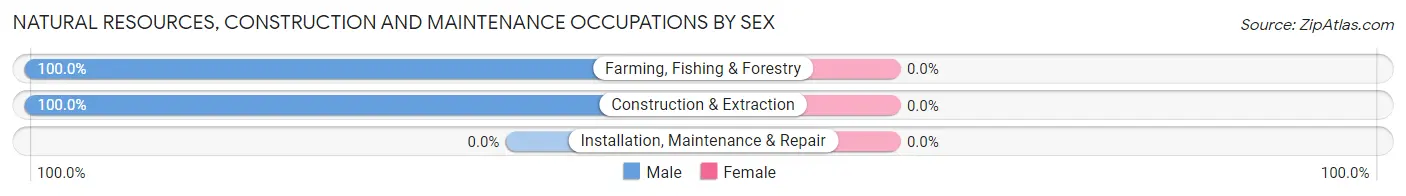
| Occupation | Male | Female |
| Farming, Fishing & Forestry | 1 (100.0%) | 0 (0.0%) |
| Construction & Extraction | 7 (100.0%) | 0 (0.0%) |
| Installation, Maintenance & Repair | 0 (0.0%) | 0 (0.0%) |
| Total (Category) | 8 (100.0%) | 0 (0.0%) |
| Total (Overall) | 116 (76.8%) | 35 (23.2%) |
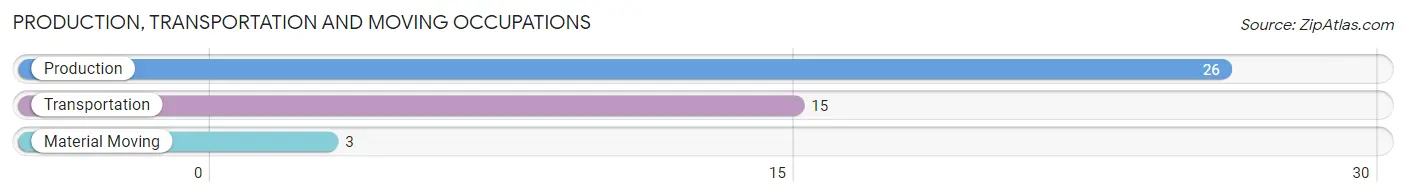
Production, Transportation and Moving Occupations
The most common Production, Transportation and Moving occupations in Sharpsburg are Production (26 | 17.2%), Transportation (15 | 9.9%), and Material Moving (3 | 2.0%).
Production, Transportation and Moving Occupations by Sex
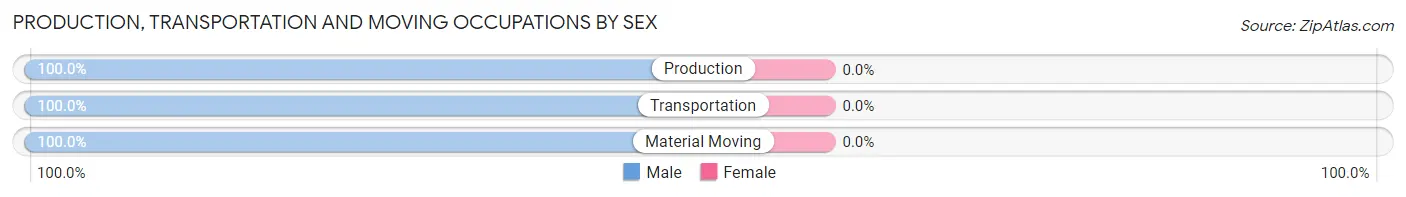
| Occupation | Male | Female |
| Production | 26 (100.0%) | 0 (0.0%) |
| Transportation | 15 (100.0%) | 0 (0.0%) |
| Material Moving | 3 (100.0%) | 0 (0.0%) |
| Total (Category) | 44 (100.0%) | 0 (0.0%) |
| Total (Overall) | 116 (76.8%) | 35 (23.2%) |
Employment Industries by Sex in Sharpsburg
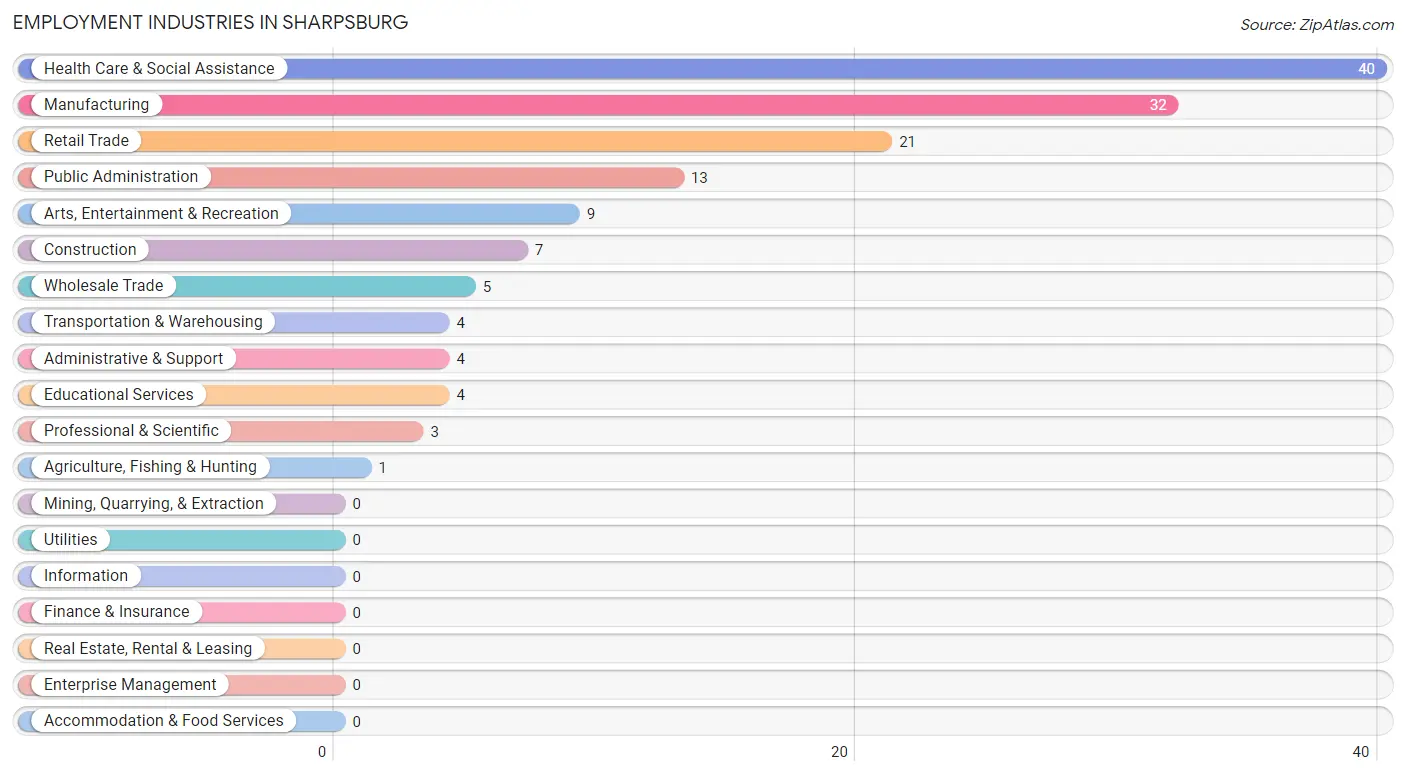
Employment Industries in Sharpsburg
The major employment industries in Sharpsburg include Health Care & Social Assistance (40 | 26.5%), Manufacturing (32 | 21.2%), Retail Trade (21 | 13.9%), Public Administration (13 | 8.6%), and Arts, Entertainment & Recreation (9 | 6.0%).
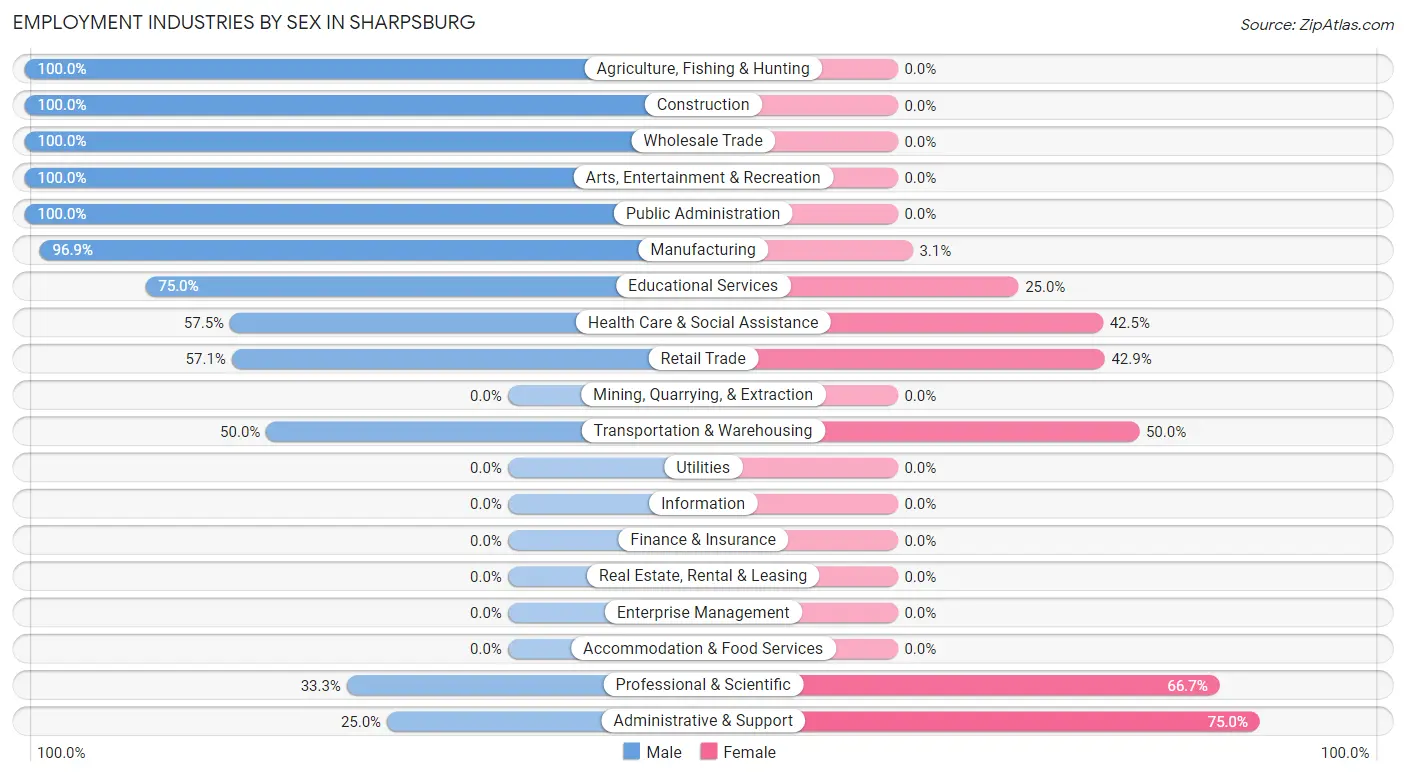
Employment Industries by Sex in Sharpsburg
The Sharpsburg industries that see more men than women are Agriculture, Fishing & Hunting (100.0%), Construction (100.0%), and Wholesale Trade (100.0%), whereas the industries that tend to have a higher number of women are Administrative & Support (75.0%), Professional & Scientific (66.7%), and Transportation & Warehousing (50.0%).
| Industry | Male | Female |
| Agriculture, Fishing & Hunting | 1 (100.0%) | 0 (0.0%) |
| Mining, Quarrying, & Extraction | 0 (0.0%) | 0 (0.0%) |
| Construction | 7 (100.0%) | 0 (0.0%) |
| Manufacturing | 31 (96.9%) | 1 (3.1%) |
| Wholesale Trade | 5 (100.0%) | 0 (0.0%) |
| Retail Trade | 12 (57.1%) | 9 (42.9%) |
| Transportation & Warehousing | 2 (50.0%) | 2 (50.0%) |
| Utilities | 0 (0.0%) | 0 (0.0%) |
| Information | 0 (0.0%) | 0 (0.0%) |
| Finance & Insurance | 0 (0.0%) | 0 (0.0%) |
| Real Estate, Rental & Leasing | 0 (0.0%) | 0 (0.0%) |
| Professional & Scientific | 1 (33.3%) | 2 (66.7%) |
| Enterprise Management | 0 (0.0%) | 0 (0.0%) |
| Administrative & Support | 1 (25.0%) | 3 (75.0%) |
| Educational Services | 3 (75.0%) | 1 (25.0%) |
| Health Care & Social Assistance | 23 (57.5%) | 17 (42.5%) |
| Arts, Entertainment & Recreation | 9 (100.0%) | 0 (0.0%) |
| Accommodation & Food Services | 0 (0.0%) | 0 (0.0%) |
| Public Administration | 13 (100.0%) | 0 (0.0%) |
| Total | 116 (76.8%) | 35 (23.2%) |
Education in Sharpsburg
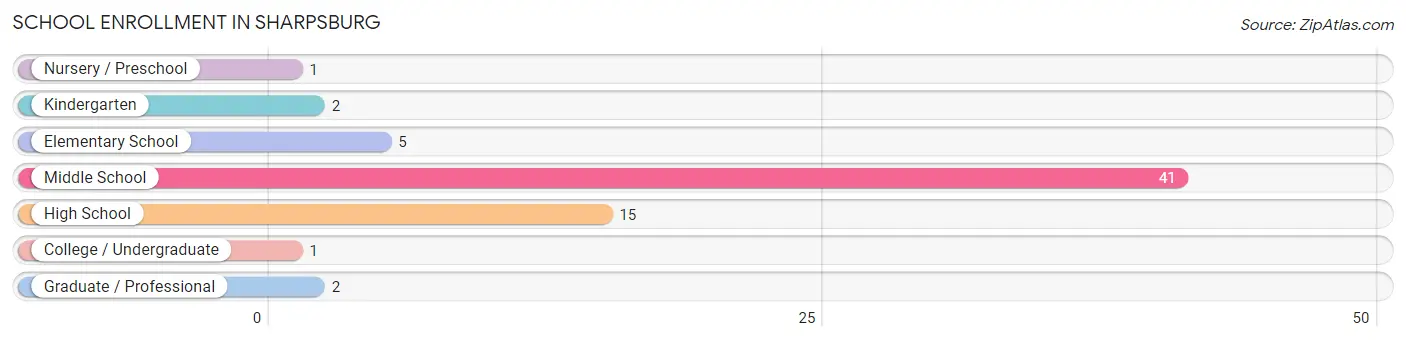
School Enrollment in Sharpsburg
The most common levels of schooling among the 67 students in Sharpsburg are middle school (41 | 61.2%), high school (15 | 22.4%), and elementary school (5 | 7.5%).
| School Level | # Students | % Students |
| Nursery / Preschool | 1 | 1.5% |
| Kindergarten | 2 | 3.0% |
| Elementary School | 5 | 7.5% |
| Middle School | 41 | 61.2% |
| High School | 15 | 22.4% |
| College / Undergraduate | 1 | 1.5% |
| Graduate / Professional | 2 | 3.0% |
| Total | 67 | 100.0% |
School Enrollment by Age by Funding Source in Sharpsburg
Out of a total of 67 students who are enrolled in schools in Sharpsburg, 11 (16.4%) attend a private institution, while the remaining 56 (83.6%) are enrolled in public schools. The age group of 35 years and over has the highest likelihood of being enrolled in private schools, with 1 (50.0% in the age bracket) enrolled. Conversely, the age group of 3 to 4 year olds has the lowest likelihood of being enrolled in a private school, with 1 (100.0% in the age bracket) attending a public institution.
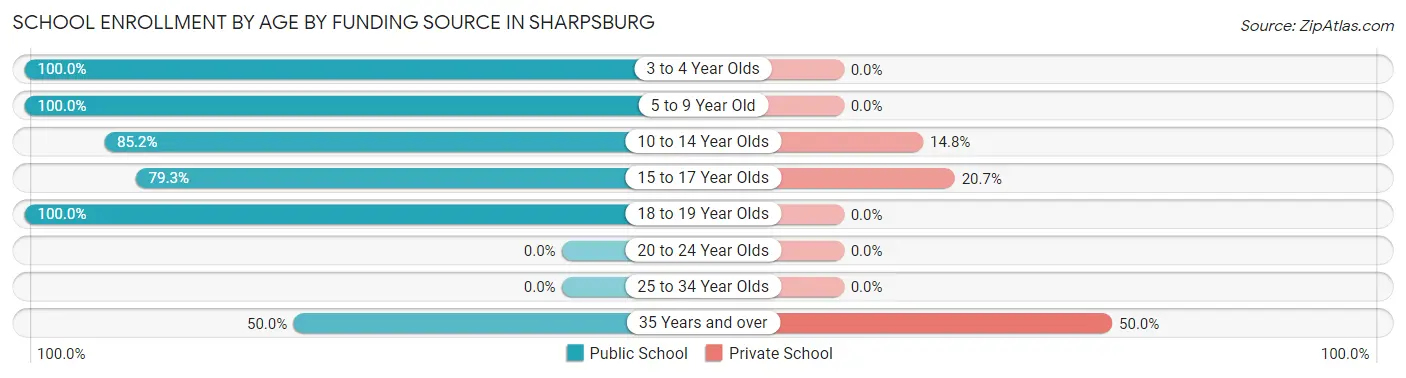
| Age Bracket | Public School | Private School |
| 3 to 4 Year Olds | 1 (100.0%) | 0 (0.0%) |
| 5 to 9 Year Old | 6 (100.0%) | 0 (0.0%) |
| 10 to 14 Year Olds | 23 (85.2%) | 4 (14.8%) |
| 15 to 17 Year Olds | 23 (79.3%) | 6 (20.7%) |
| 18 to 19 Year Olds | 2 (100.0%) | 0 (0.0%) |
| 20 to 24 Year Olds | 0 (0.0%) | 0 (0.0%) |
| 25 to 34 Year Olds | 0 (0.0%) | 0 (0.0%) |
| 35 Years and over | 1 (50.0%) | 1 (50.0%) |
| Total | 56 (83.6%) | 11 (16.4%) |
Educational Attainment by Field of Study in Sharpsburg
Arts & humanities (13 | 48.1%), education (3 | 11.1%), visual & performing arts (3 | 11.1%), communications (3 | 11.1%), and science & technology (2 | 7.4%) are the most common fields of study among 27 individuals in Sharpsburg who have obtained a bachelor's degree or higher.
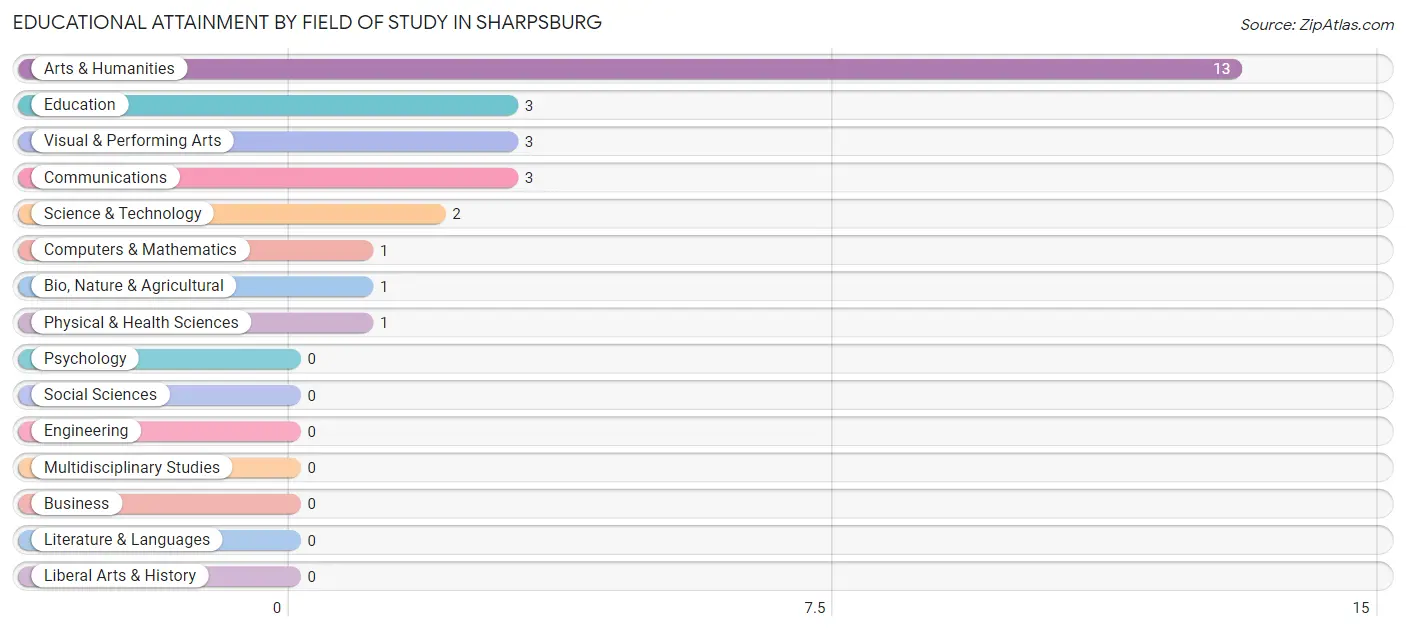
| Field of Study | # Graduates | % Graduates |
| Computers & Mathematics | 1 | 3.7% |
| Bio, Nature & Agricultural | 1 | 3.7% |
| Physical & Health Sciences | 1 | 3.7% |
| Psychology | 0 | 0.0% |
| Social Sciences | 0 | 0.0% |
| Engineering | 0 | 0.0% |
| Multidisciplinary Studies | 0 | 0.0% |
| Science & Technology | 2 | 7.4% |
| Business | 0 | 0.0% |
| Education | 3 | 11.1% |
| Literature & Languages | 0 | 0.0% |
| Liberal Arts & History | 0 | 0.0% |
| Visual & Performing Arts | 3 | 11.1% |
| Communications | 3 | 11.1% |
| Arts & Humanities | 13 | 48.1% |
| Total | 27 | 100.0% |
Transportation & Commute in Sharpsburg
Vehicle Availability by Sex in Sharpsburg
The most prevalent vehicle ownership categories in Sharpsburg are males with 2 vehicles (84, accounting for 72.4%) and females with 2 vehicles (16, making up 240.0%).
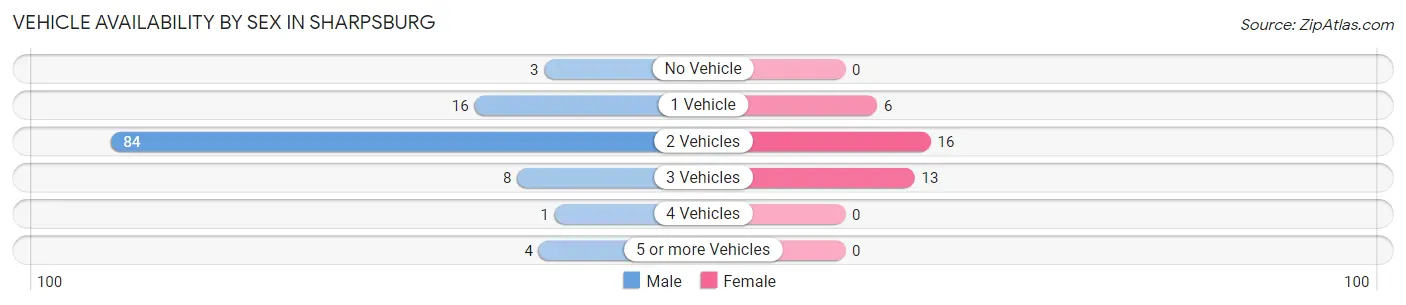
| Vehicles Available | Male | Female |
| No Vehicle | 3 (2.6%) | 0 (0.0%) |
| 1 Vehicle | 16 (13.8%) | 6 (17.1%) |
| 2 Vehicles | 84 (72.4%) | 16 (45.7%) |
| 3 Vehicles | 8 (6.9%) | 13 (37.1%) |
| 4 Vehicles | 1 (0.9%) | 0 (0.0%) |
| 5 or more Vehicles | 4 (3.5%) | 0 (0.0%) |
| Total | 116 (100.0%) | 35 (100.0%) |
Commute Time in Sharpsburg
The most frequently occuring commute durations in Sharpsburg are 15 to 19 minutes (37 commuters, 27.2%), 5 to 9 minutes (24 commuters, 17.6%), and 20 to 24 minutes (22 commuters, 16.2%).
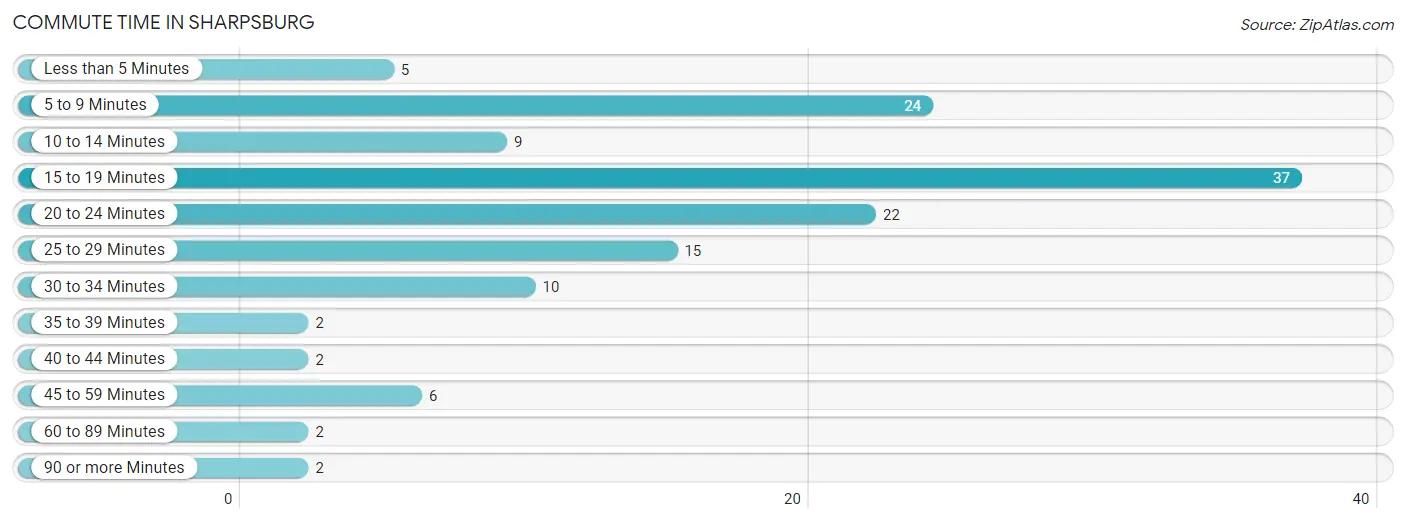
| Commute Time | # Commuters | % Commuters |
| Less than 5 Minutes | 5 | 3.7% |
| 5 to 9 Minutes | 24 | 17.6% |
| 10 to 14 Minutes | 9 | 6.6% |
| 15 to 19 Minutes | 37 | 27.2% |
| 20 to 24 Minutes | 22 | 16.2% |
| 25 to 29 Minutes | 15 | 11.0% |
| 30 to 34 Minutes | 10 | 7.3% |
| 35 to 39 Minutes | 2 | 1.5% |
| 40 to 44 Minutes | 2 | 1.5% |
| 45 to 59 Minutes | 6 | 4.4% |
| 60 to 89 Minutes | 2 | 1.5% |
| 90 or more Minutes | 2 | 1.5% |
Commute Time by Sex in Sharpsburg
The most common commute times in Sharpsburg are 15 to 19 minutes (35 commuters, 34.0%) for males and 30 to 34 minutes (7 commuters, 21.2%) for females.
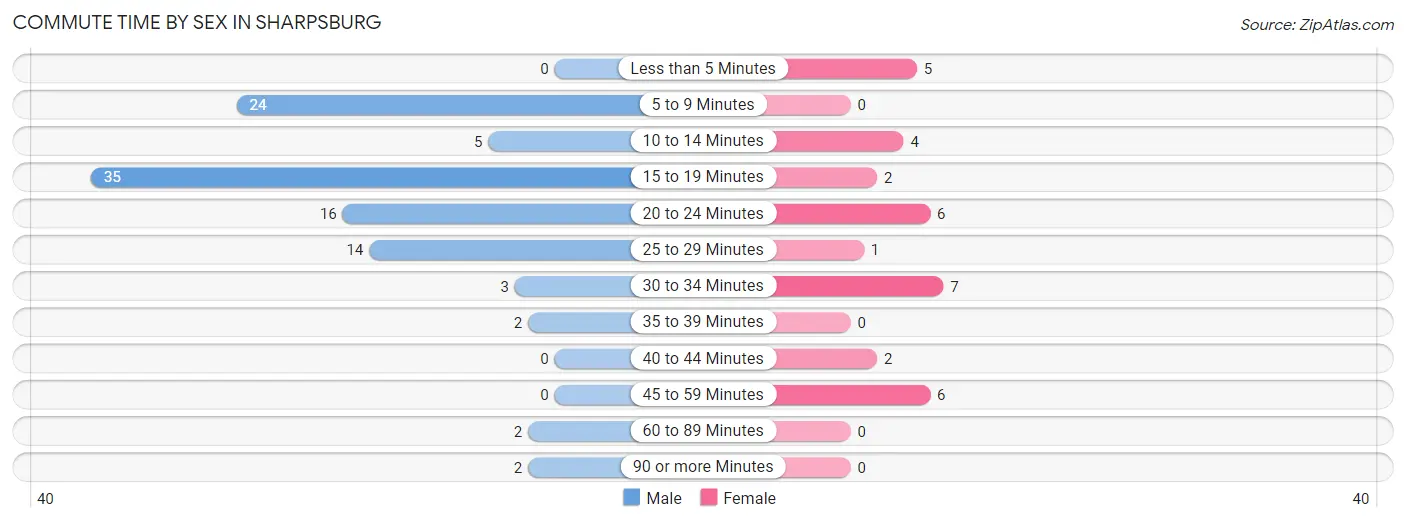
| Commute Time | Male | Female |
| Less than 5 Minutes | 0 (0.0%) | 5 (15.1%) |
| 5 to 9 Minutes | 24 (23.3%) | 0 (0.0%) |
| 10 to 14 Minutes | 5 (4.9%) | 4 (12.1%) |
| 15 to 19 Minutes | 35 (34.0%) | 2 (6.1%) |
| 20 to 24 Minutes | 16 (15.5%) | 6 (18.2%) |
| 25 to 29 Minutes | 14 (13.6%) | 1 (3.0%) |
| 30 to 34 Minutes | 3 (2.9%) | 7 (21.2%) |
| 35 to 39 Minutes | 2 (1.9%) | 0 (0.0%) |
| 40 to 44 Minutes | 0 (0.0%) | 2 (6.1%) |
| 45 to 59 Minutes | 0 (0.0%) | 6 (18.2%) |
| 60 to 89 Minutes | 2 (1.9%) | 0 (0.0%) |
| 90 or more Minutes | 2 (1.9%) | 0 (0.0%) |
Time of Departure to Work by Sex in Sharpsburg
The most frequent times of departure to work in Sharpsburg are 6:00 AM to 6:29 AM (38, 36.9%) for males and 6:30 AM to 6:59 AM (8, 24.2%) for females.
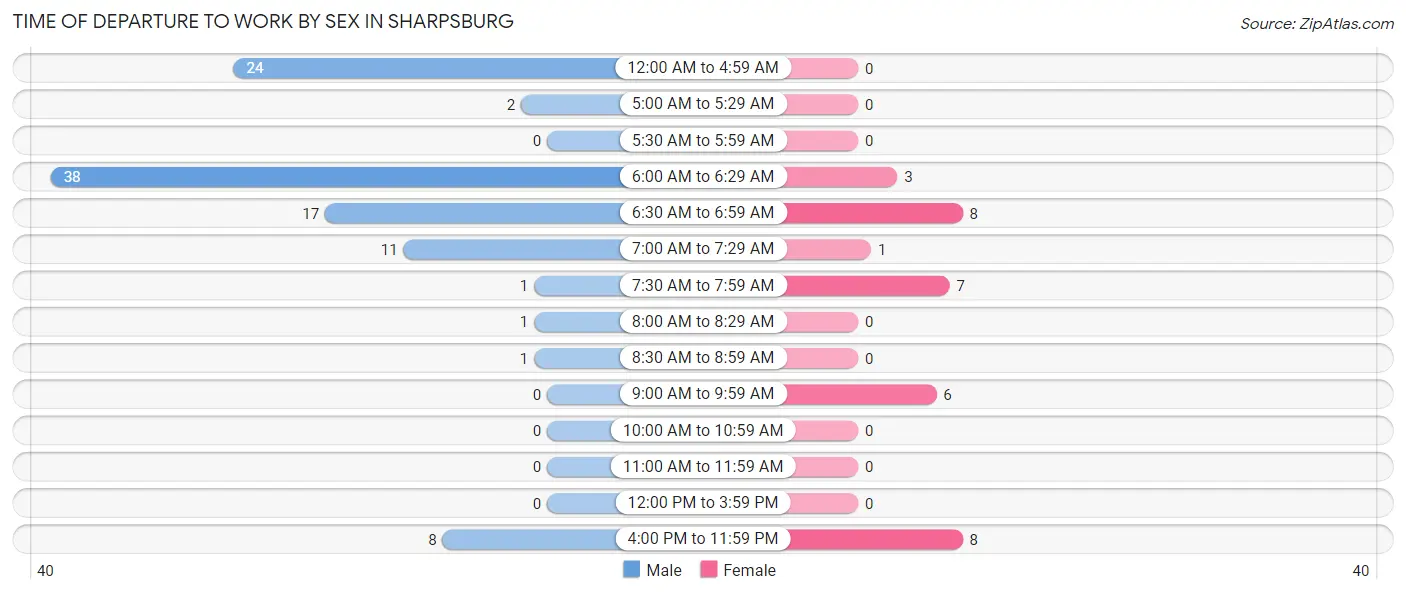
| Time of Departure | Male | Female |
| 12:00 AM to 4:59 AM | 24 (23.3%) | 0 (0.0%) |
| 5:00 AM to 5:29 AM | 2 (1.9%) | 0 (0.0%) |
| 5:30 AM to 5:59 AM | 0 (0.0%) | 0 (0.0%) |
| 6:00 AM to 6:29 AM | 38 (36.9%) | 3 (9.1%) |
| 6:30 AM to 6:59 AM | 17 (16.5%) | 8 (24.2%) |
| 7:00 AM to 7:29 AM | 11 (10.7%) | 1 (3.0%) |
| 7:30 AM to 7:59 AM | 1 (1.0%) | 7 (21.2%) |
| 8:00 AM to 8:29 AM | 1 (1.0%) | 0 (0.0%) |
| 8:30 AM to 8:59 AM | 1 (1.0%) | 0 (0.0%) |
| 9:00 AM to 9:59 AM | 0 (0.0%) | 6 (18.2%) |
| 10:00 AM to 10:59 AM | 0 (0.0%) | 0 (0.0%) |
| 11:00 AM to 11:59 AM | 0 (0.0%) | 0 (0.0%) |
| 12:00 PM to 3:59 PM | 0 (0.0%) | 0 (0.0%) |
| 4:00 PM to 11:59 PM | 8 (7.8%) | 8 (24.2%) |
| Total | 103 (100.0%) | 33 (100.0%) |
Housing Occupancy in Sharpsburg
Occupancy by Ownership in Sharpsburg
Of the total 178 dwellings in Sharpsburg, owner-occupied units account for 115 (64.6%), while renter-occupied units make up 63 (35.4%).
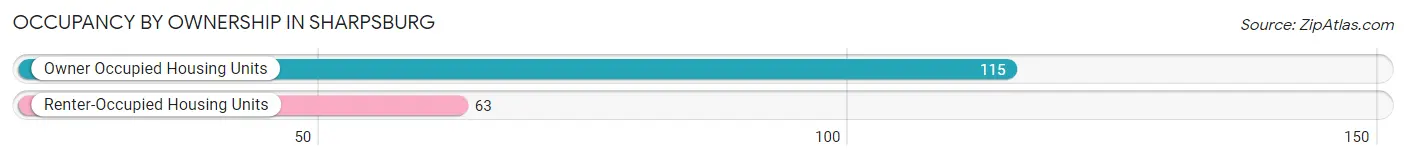
| Occupancy | # Housing Units | % Housing Units |
| Owner Occupied Housing Units | 115 | 64.6% |
| Renter-Occupied Housing Units | 63 | 35.4% |
| Total Occupied Housing Units | 178 | 100.0% |
Occupancy by Household Size in Sharpsburg
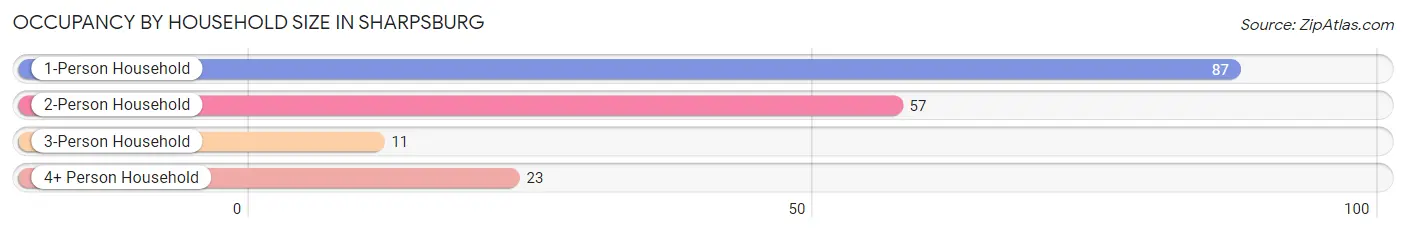
| Household Size | # Housing Units | % Housing Units |
| 1-Person Household | 87 | 48.9% |
| 2-Person Household | 57 | 32.0% |
| 3-Person Household | 11 | 6.2% |
| 4+ Person Household | 23 | 12.9% |
| Total Housing Units | 178 | 100.0% |
Occupancy by Ownership by Household Size in Sharpsburg
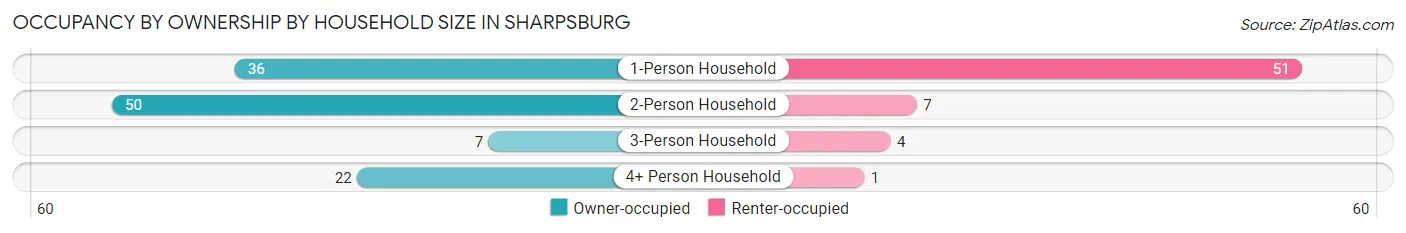
| Household Size | Owner-occupied | Renter-occupied |
| 1-Person Household | 36 (41.4%) | 51 (58.6%) |
| 2-Person Household | 50 (87.7%) | 7 (12.3%) |
| 3-Person Household | 7 (63.6%) | 4 (36.4%) |
| 4+ Person Household | 22 (95.7%) | 1 (4.3%) |
| Total Housing Units | 115 (64.6%) | 63 (35.4%) |
Occupancy by Educational Attainment in Sharpsburg
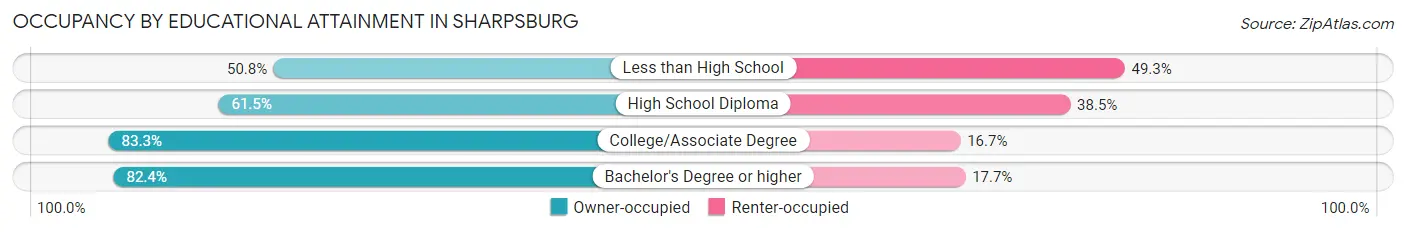
| Household Size | Owner-occupied | Renter-occupied |
| Less than High School | 34 (50.7%) | 33 (49.2%) |
| High School Diploma | 32 (61.5%) | 20 (38.5%) |
| College/Associate Degree | 35 (83.3%) | 7 (16.7%) |
| Bachelor's Degree or higher | 14 (82.4%) | 3 (17.6%) |
Occupancy by Age of Householder in Sharpsburg
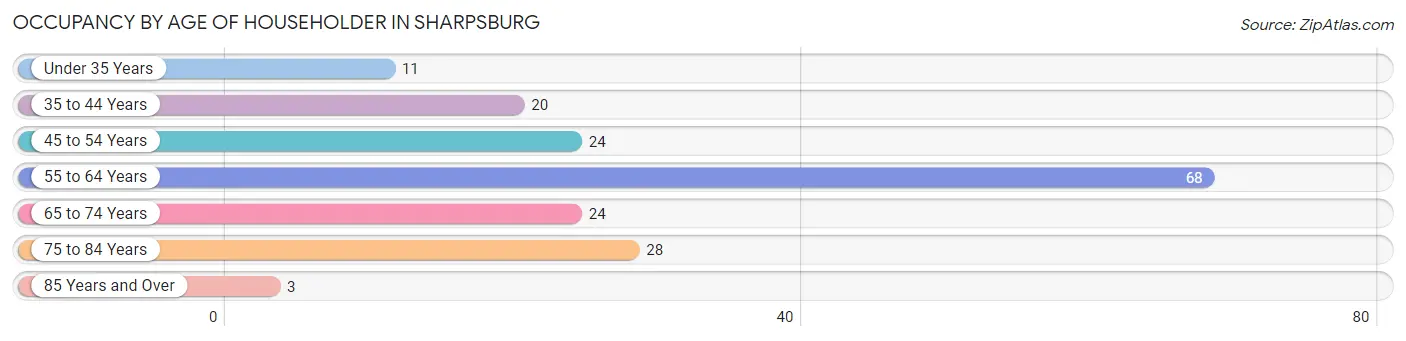
| Age Bracket | # Households | % Households |
| Under 35 Years | 11 | 6.2% |
| 35 to 44 Years | 20 | 11.2% |
| 45 to 54 Years | 24 | 13.5% |
| 55 to 64 Years | 68 | 38.2% |
| 65 to 74 Years | 24 | 13.5% |
| 75 to 84 Years | 28 | 15.7% |
| 85 Years and Over | 3 | 1.7% |
| Total | 178 | 100.0% |
Housing Finances in Sharpsburg
Median Income by Occupancy in Sharpsburg
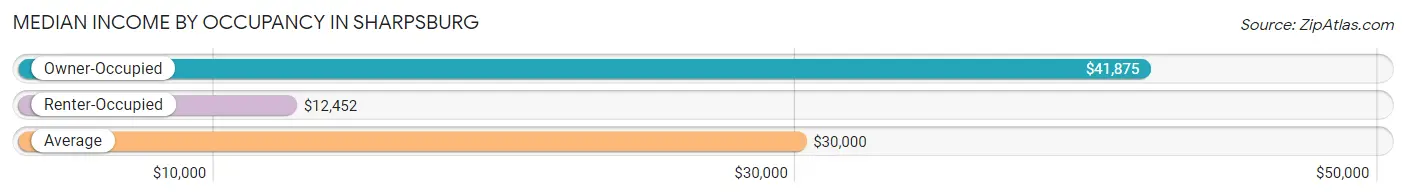
| Occupancy Type | # Households | Median Income |
| Owner-Occupied | 115 (64.6%) | $41,875 |
| Renter-Occupied | 63 (35.4%) | $12,452 |
| Average | 178 (100.0%) | $30,000 |
Occupancy by Householder Income Bracket in Sharpsburg
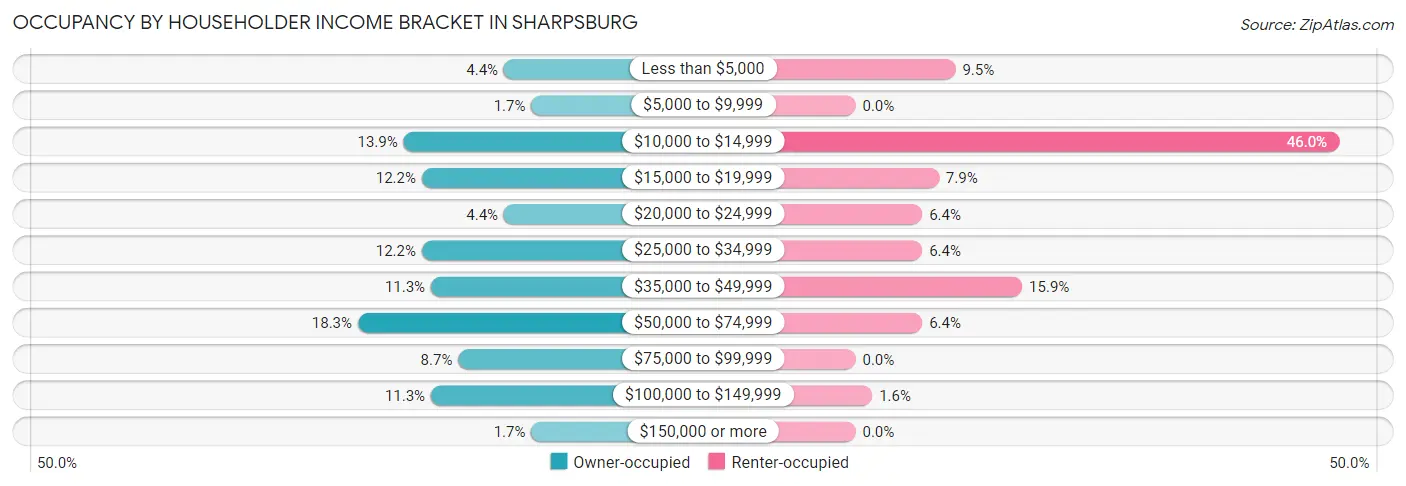
| Income Bracket | Owner-occupied | Renter-occupied |
| Less than $5,000 | 5 (4.3%) | 6 (9.5%) |
| $5,000 to $9,999 | 2 (1.7%) | 0 (0.0%) |
| $10,000 to $14,999 | 16 (13.9%) | 29 (46.0%) |
| $15,000 to $19,999 | 14 (12.2%) | 5 (7.9%) |
| $20,000 to $24,999 | 5 (4.3%) | 4 (6.4%) |
| $25,000 to $34,999 | 14 (12.2%) | 4 (6.4%) |
| $35,000 to $49,999 | 13 (11.3%) | 10 (15.9%) |
| $50,000 to $74,999 | 21 (18.3%) | 4 (6.4%) |
| $75,000 to $99,999 | 10 (8.7%) | 0 (0.0%) |
| $100,000 to $149,999 | 13 (11.3%) | 1 (1.6%) |
| $150,000 or more | 2 (1.7%) | 0 (0.0%) |
| Total | 115 (100.0%) | 63 (100.0%) |
Monthly Housing Cost Tiers in Sharpsburg
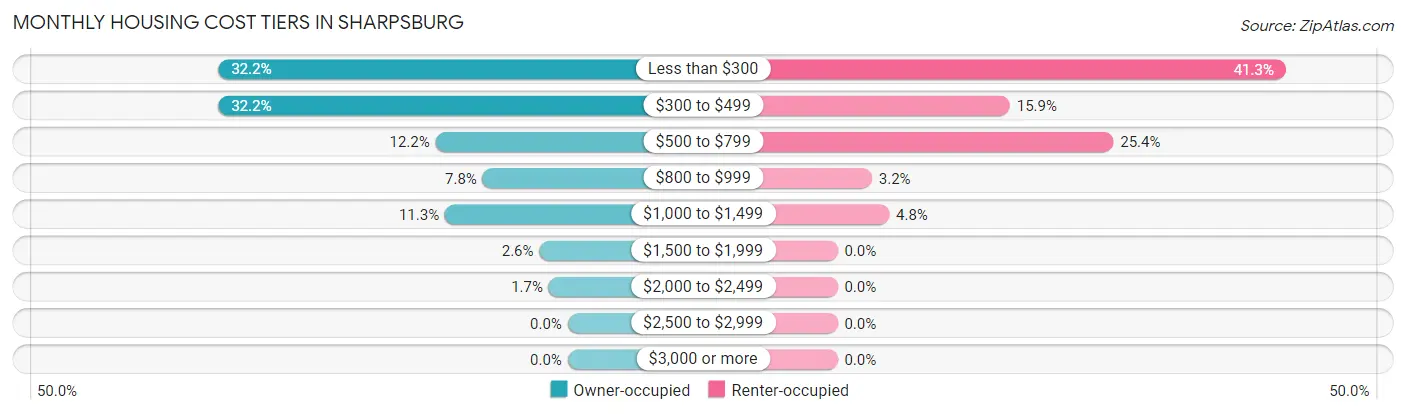
| Monthly Cost | Owner-occupied | Renter-occupied |
| Less than $300 | 37 (32.2%) | 26 (41.3%) |
| $300 to $499 | 37 (32.2%) | 10 (15.9%) |
| $500 to $799 | 14 (12.2%) | 16 (25.4%) |
| $800 to $999 | 9 (7.8%) | 2 (3.2%) |
| $1,000 to $1,499 | 13 (11.3%) | 3 (4.8%) |
| $1,500 to $1,999 | 3 (2.6%) | 0 (0.0%) |
| $2,000 to $2,499 | 2 (1.7%) | 0 (0.0%) |
| $2,500 to $2,999 | 0 (0.0%) | 0 (0.0%) |
| $3,000 or more | 0 (0.0%) | 0 (0.0%) |
| Total | 115 (100.0%) | 63 (100.0%) |
Physical Housing Characteristics in Sharpsburg
Housing Structures in Sharpsburg
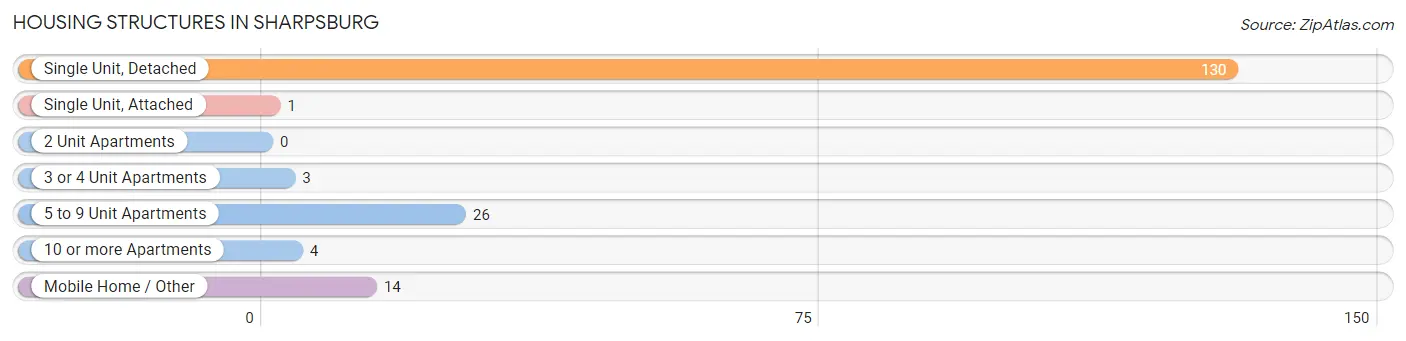
| Structure Type | # Housing Units | % Housing Units |
| Single Unit, Detached | 130 | 73.0% |
| Single Unit, Attached | 1 | 0.6% |
| 2 Unit Apartments | 0 | 0.0% |
| 3 or 4 Unit Apartments | 3 | 1.7% |
| 5 to 9 Unit Apartments | 26 | 14.6% |
| 10 or more Apartments | 4 | 2.2% |
| Mobile Home / Other | 14 | 7.9% |
| Total | 178 | 100.0% |
Housing Structures by Occupancy in Sharpsburg
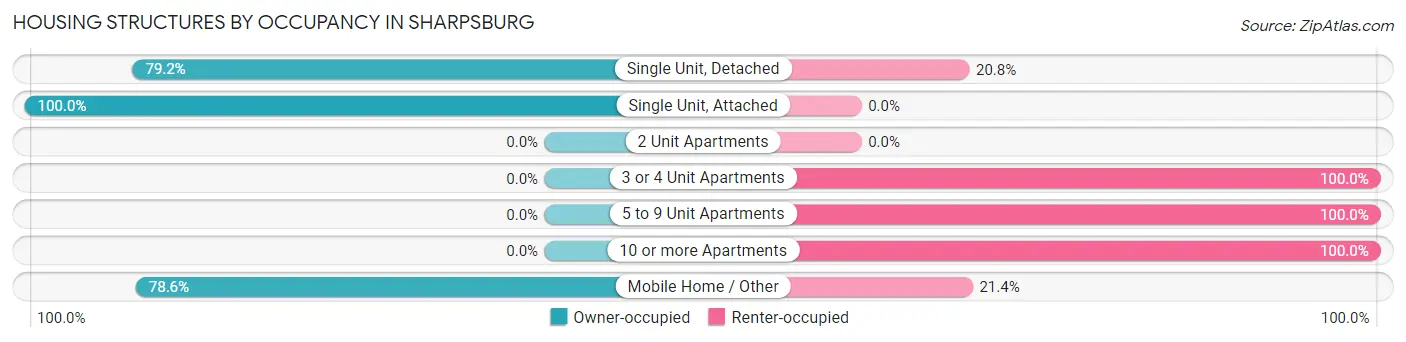
| Structure Type | Owner-occupied | Renter-occupied |
| Single Unit, Detached | 103 (79.2%) | 27 (20.8%) |
| Single Unit, Attached | 1 (100.0%) | 0 (0.0%) |
| 2 Unit Apartments | 0 (0.0%) | 0 (0.0%) |
| 3 or 4 Unit Apartments | 0 (0.0%) | 3 (100.0%) |
| 5 to 9 Unit Apartments | 0 (0.0%) | 26 (100.0%) |
| 10 or more Apartments | 0 (0.0%) | 4 (100.0%) |
| Mobile Home / Other | 11 (78.6%) | 3 (21.4%) |
| Total | 115 (64.6%) | 63 (35.4%) |
Housing Structures by Number of Rooms in Sharpsburg
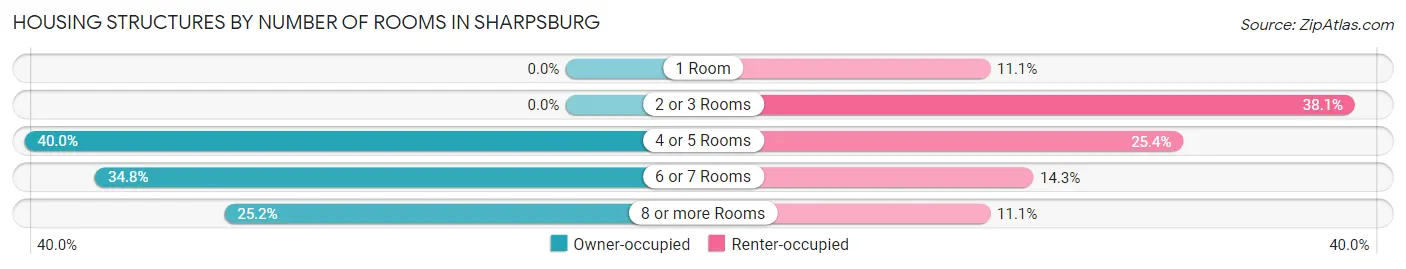
| Number of Rooms | Owner-occupied | Renter-occupied |
| 1 Room | 0 (0.0%) | 7 (11.1%) |
| 2 or 3 Rooms | 0 (0.0%) | 24 (38.1%) |
| 4 or 5 Rooms | 46 (40.0%) | 16 (25.4%) |
| 6 or 7 Rooms | 40 (34.8%) | 9 (14.3%) |
| 8 or more Rooms | 29 (25.2%) | 7 (11.1%) |
| Total | 115 (100.0%) | 63 (100.0%) |
Housing Structure by Heating Type in Sharpsburg
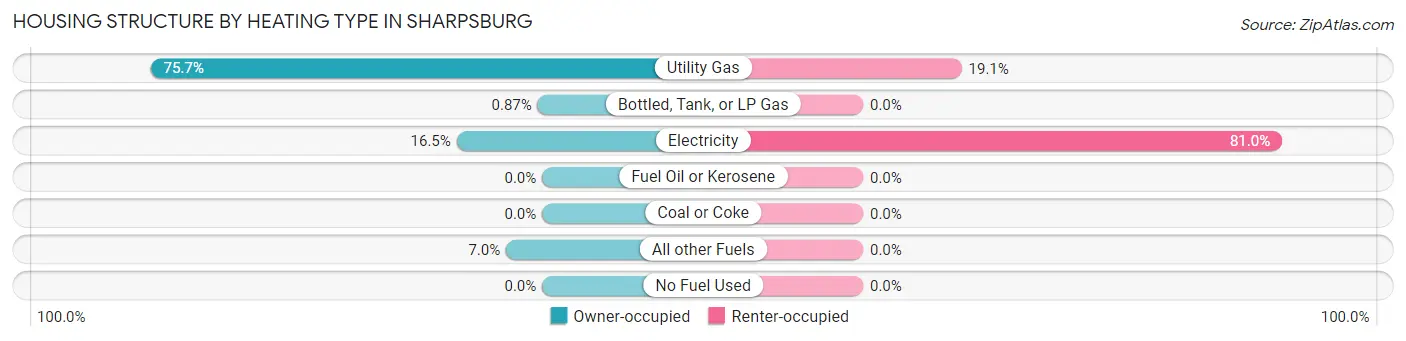
| Heating Type | Owner-occupied | Renter-occupied |
| Utility Gas | 87 (75.6%) | 12 (19.1%) |
| Bottled, Tank, or LP Gas | 1 (0.9%) | 0 (0.0%) |
| Electricity | 19 (16.5%) | 51 (80.9%) |
| Fuel Oil or Kerosene | 0 (0.0%) | 0 (0.0%) |
| Coal or Coke | 0 (0.0%) | 0 (0.0%) |
| All other Fuels | 8 (7.0%) | 0 (0.0%) |
| No Fuel Used | 0 (0.0%) | 0 (0.0%) |
| Total | 115 (100.0%) | 63 (100.0%) |
Household Vehicle Usage in Sharpsburg
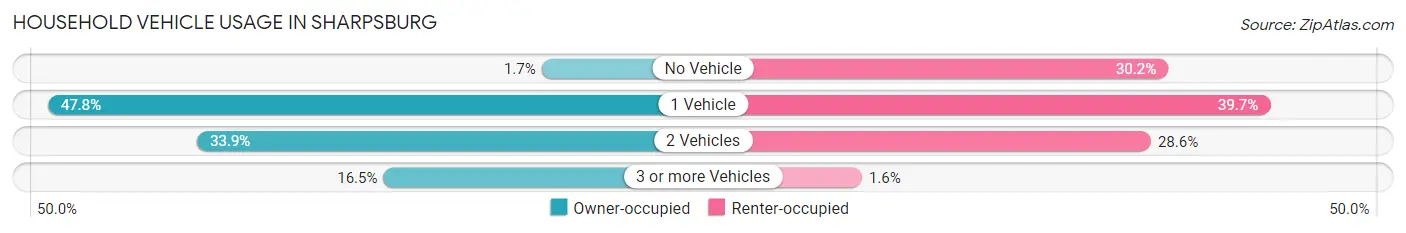
| Vehicles per Household | Owner-occupied | Renter-occupied |
| No Vehicle | 2 (1.7%) | 19 (30.2%) |
| 1 Vehicle | 55 (47.8%) | 25 (39.7%) |
| 2 Vehicles | 39 (33.9%) | 18 (28.6%) |
| 3 or more Vehicles | 19 (16.5%) | 1 (1.6%) |
| Total | 115 (100.0%) | 63 (100.0%) |
Real Estate & Mortgages in Sharpsburg
Real Estate and Mortgage Overview in Sharpsburg
| Characteristic | Without Mortgage | With Mortgage |
| Housing Units | 83 | 32 |
| Median Property Value | $34,300 | $92,000 |
| Median Household Income | $40,625 | $0 |
| Monthly Housing Costs | $316 | $0 |
| Real Estate Taxes | $293 | $7 |
Property Value by Mortgage Status in Sharpsburg
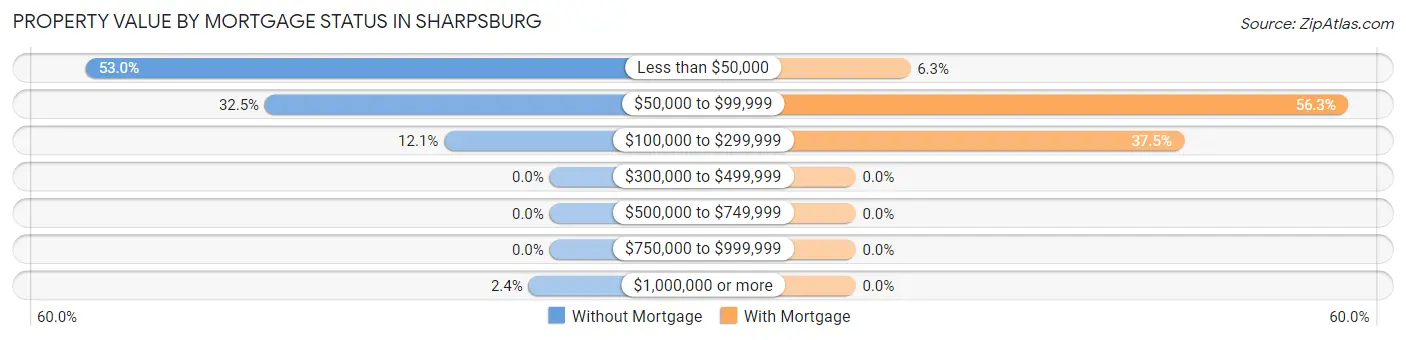
| Property Value | Without Mortgage | With Mortgage |
| Less than $50,000 | 44 (53.0%) | 2 (6.2%) |
| $50,000 to $99,999 | 27 (32.5%) | 18 (56.2%) |
| $100,000 to $299,999 | 10 (12.0%) | 12 (37.5%) |
| $300,000 to $499,999 | 0 (0.0%) | 0 (0.0%) |
| $500,000 to $749,999 | 0 (0.0%) | 0 (0.0%) |
| $750,000 to $999,999 | 0 (0.0%) | 0 (0.0%) |
| $1,000,000 or more | 2 (2.4%) | 0 (0.0%) |
| Total | 83 (100.0%) | 32 (100.0%) |
Household Income by Mortgage Status in Sharpsburg
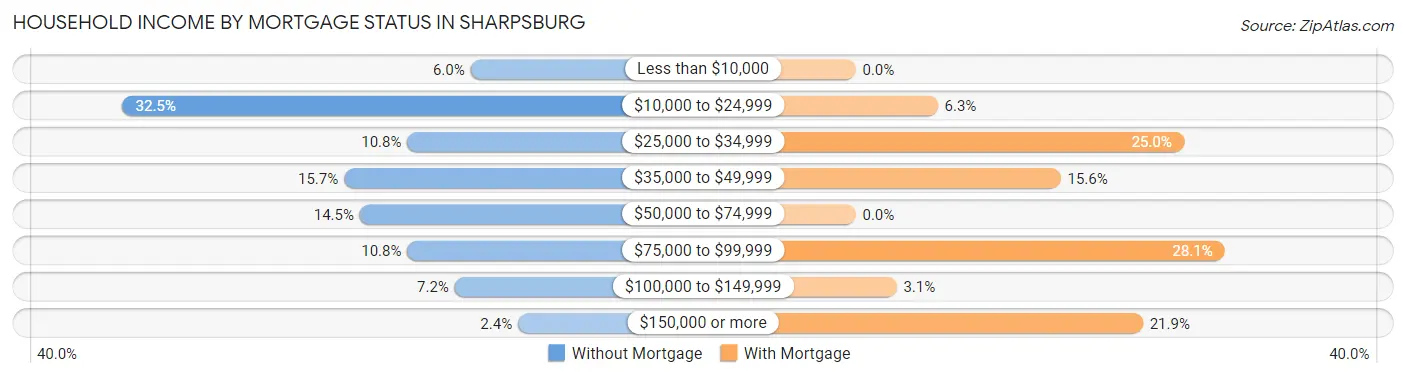
| Household Income | Without Mortgage | With Mortgage |
| Less than $10,000 | 5 (6.0%) | 0 (0.0%) |
| $10,000 to $24,999 | 27 (32.5%) | 2 (6.2%) |
| $25,000 to $34,999 | 9 (10.8%) | 8 (25.0%) |
| $35,000 to $49,999 | 13 (15.7%) | 5 (15.6%) |
| $50,000 to $74,999 | 12 (14.5%) | 0 (0.0%) |
| $75,000 to $99,999 | 9 (10.8%) | 9 (28.1%) |
| $100,000 to $149,999 | 6 (7.2%) | 1 (3.1%) |
| $150,000 or more | 2 (2.4%) | 7 (21.9%) |
| Total | 83 (100.0%) | 32 (100.0%) |
Property Value to Household Income Ratio in Sharpsburg
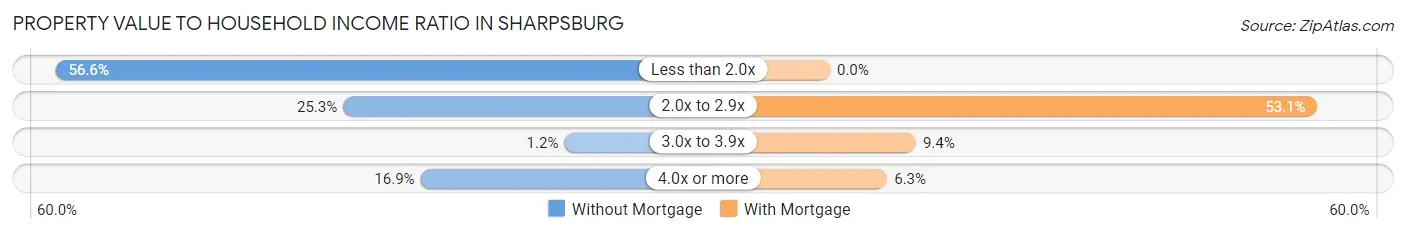
| Value-to-Income Ratio | Without Mortgage | With Mortgage |
| Less than 2.0x | 47 (56.6%) | 0 (0.0%) |
| 2.0x to 2.9x | 21 (25.3%) | 17 (53.1%) |
| 3.0x to 3.9x | 1 (1.2%) | 3 (9.4%) |
| 4.0x or more | 14 (16.9%) | 2 (6.2%) |
| Total | 83 (100.0%) | 32 (100.0%) |
Real Estate Taxes by Mortgage Status in Sharpsburg
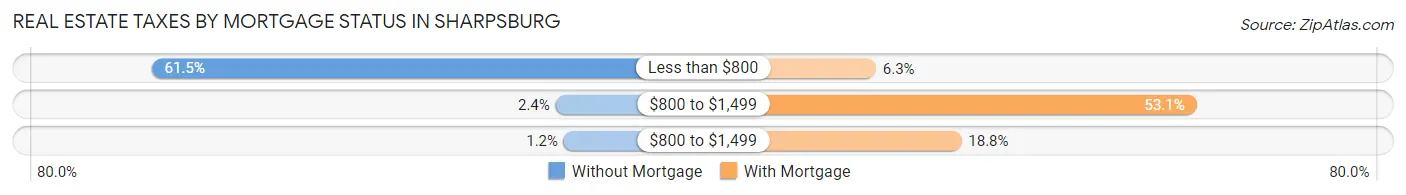
| Property Taxes | Without Mortgage | With Mortgage |
| Less than $800 | 51 (61.5%) | 2 (6.2%) |
| $800 to $1,499 | 2 (2.4%) | 17 (53.1%) |
| $800 to $1,499 | 1 (1.2%) | 6 (18.8%) |
| Total | 83 (100.0%) | 32 (100.0%) |
Health & Disability in Sharpsburg
Health Insurance Coverage by Age in Sharpsburg
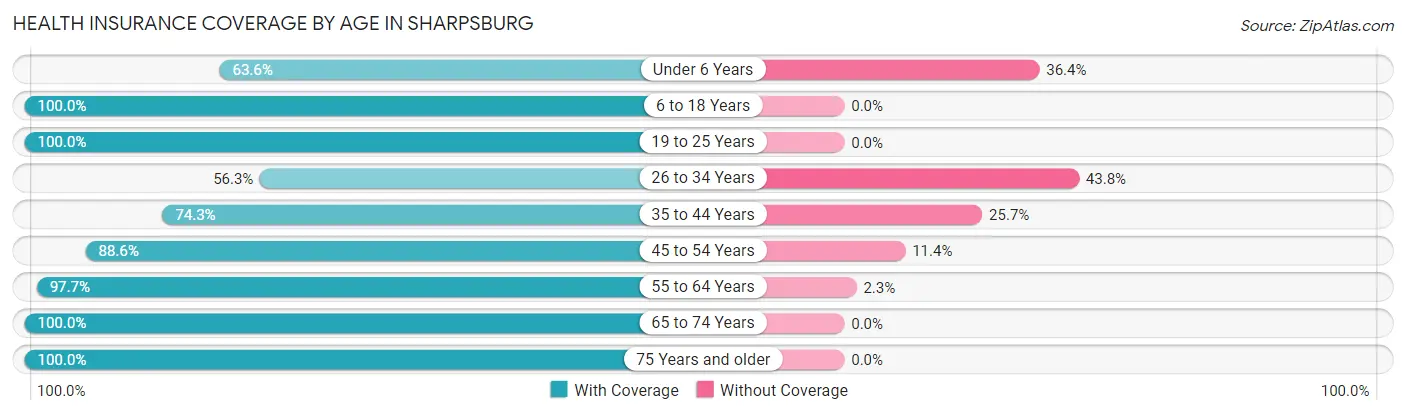
| Age Bracket | With Coverage | Without Coverage |
| Under 6 Years | 7 (63.6%) | 4 (36.4%) |
| 6 to 18 Years | 64 (100.0%) | 0 (0.0%) |
| 19 to 25 Years | 99 (100.0%) | 0 (0.0%) |
| 26 to 34 Years | 9 (56.2%) | 7 (43.8%) |
| 35 to 44 Years | 26 (74.3%) | 9 (25.7%) |
| 45 to 54 Years | 39 (88.6%) | 5 (11.4%) |
| 55 to 64 Years | 86 (97.7%) | 2 (2.3%) |
| 65 to 74 Years | 28 (100.0%) | 0 (0.0%) |
| 75 Years and older | 43 (100.0%) | 0 (0.0%) |
| Total | 401 (93.7%) | 27 (6.3%) |
Health Insurance Coverage by Citizenship Status in Sharpsburg
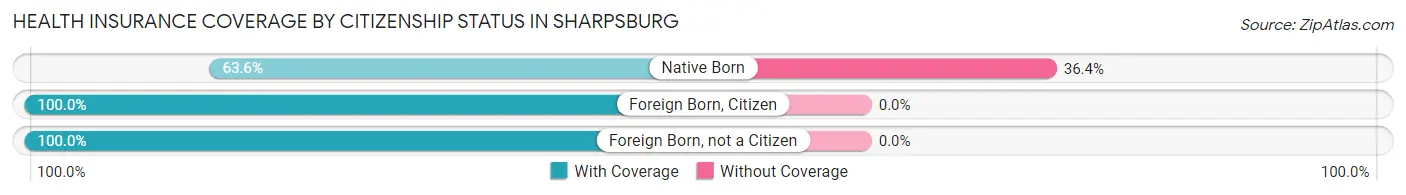
| Citizenship Status | With Coverage | Without Coverage |
| Native Born | 7 (63.6%) | 4 (36.4%) |
| Foreign Born, Citizen | 64 (100.0%) | 0 (0.0%) |
| Foreign Born, not a Citizen | 99 (100.0%) | 0 (0.0%) |
Health Insurance Coverage by Household Income in Sharpsburg
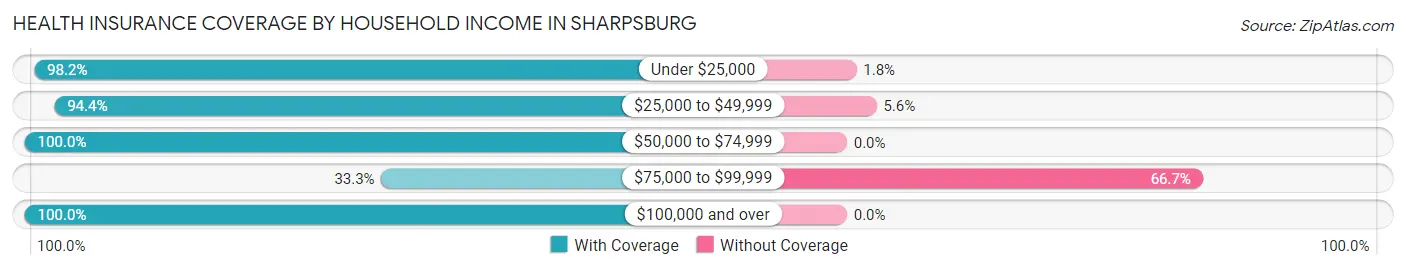
| Household Income | With Coverage | Without Coverage |
| Under $25,000 | 110 (98.2%) | 2 (1.8%) |
| $25,000 to $49,999 | 85 (94.4%) | 5 (5.6%) |
| $50,000 to $74,999 | 51 (100.0%) | 0 (0.0%) |
| $75,000 to $99,999 | 10 (33.3%) | 20 (66.7%) |
| $100,000 and over | 145 (100.0%) | 0 (0.0%) |
Public vs Private Health Insurance Coverage by Age in Sharpsburg
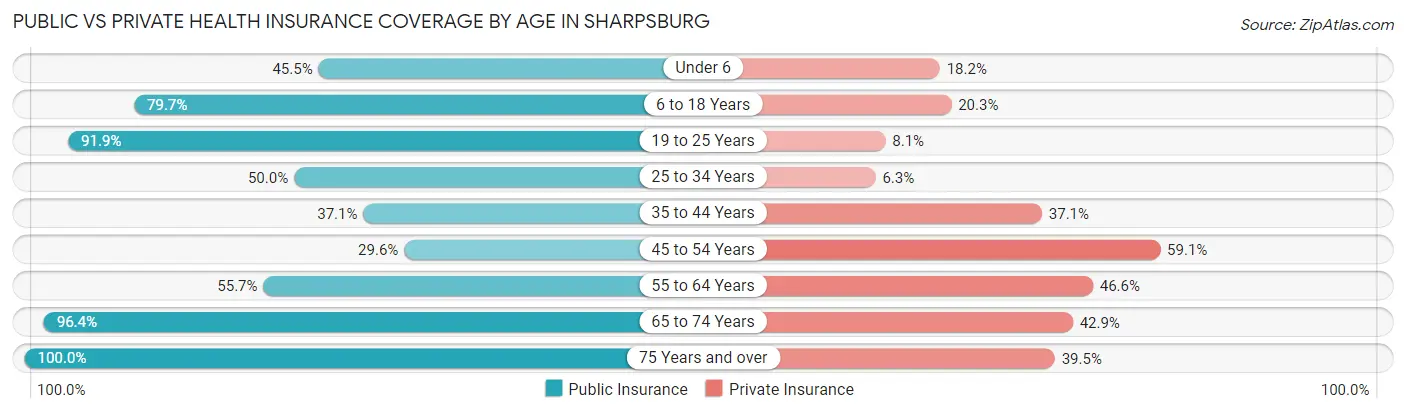
| Age Bracket | Public Insurance | Private Insurance |
| Under 6 | 5 (45.5%) | 2 (18.2%) |
| 6 to 18 Years | 51 (79.7%) | 13 (20.3%) |
| 19 to 25 Years | 91 (91.9%) | 8 (8.1%) |
| 25 to 34 Years | 8 (50.0%) | 1 (6.2%) |
| 35 to 44 Years | 13 (37.1%) | 13 (37.1%) |
| 45 to 54 Years | 13 (29.5%) | 26 (59.1%) |
| 55 to 64 Years | 49 (55.7%) | 41 (46.6%) |
| 65 to 74 Years | 27 (96.4%) | 12 (42.9%) |
| 75 Years and over | 43 (100.0%) | 17 (39.5%) |
| Total | 300 (70.1%) | 133 (31.1%) |
Disability Status by Sex by Age in Sharpsburg
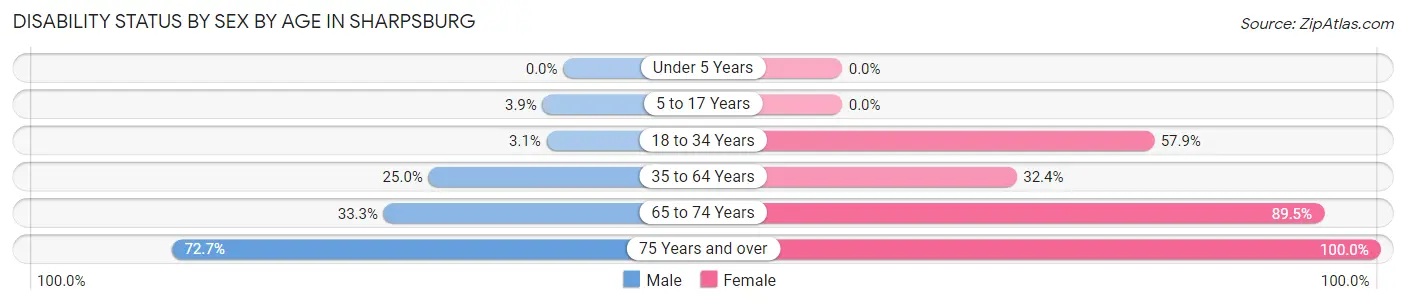
| Age Bracket | Male | Female |
| Under 5 Years | 0 (0.0%) | 0 (0.0%) |
| 5 to 17 Years | 2 (3.8%) | 0 (0.0%) |
| 18 to 34 Years | 3 (3.1%) | 11 (57.9%) |
| 35 to 64 Years | 24 (25.0%) | 23 (32.4%) |
| 65 to 74 Years | 3 (33.3%) | 17 (89.5%) |
| 75 Years and over | 8 (72.7%) | 32 (100.0%) |
Disability Class by Sex by Age in Sharpsburg
Disability Class: Hearing Difficulty
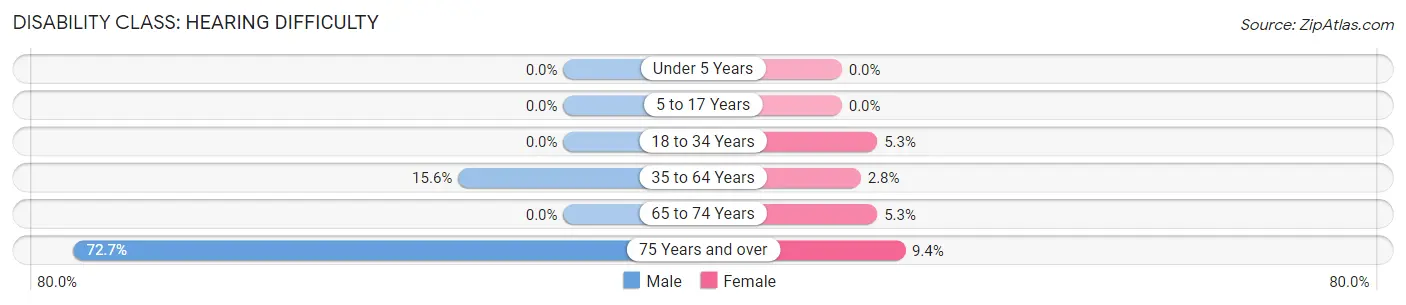
| Age Bracket | Male | Female |
| Under 5 Years | 0 (0.0%) | 0 (0.0%) |
| 5 to 17 Years | 0 (0.0%) | 0 (0.0%) |
| 18 to 34 Years | 0 (0.0%) | 1 (5.3%) |
| 35 to 64 Years | 15 (15.6%) | 2 (2.8%) |
| 65 to 74 Years | 0 (0.0%) | 1 (5.3%) |
| 75 Years and over | 8 (72.7%) | 3 (9.4%) |
Disability Class: Vision Difficulty
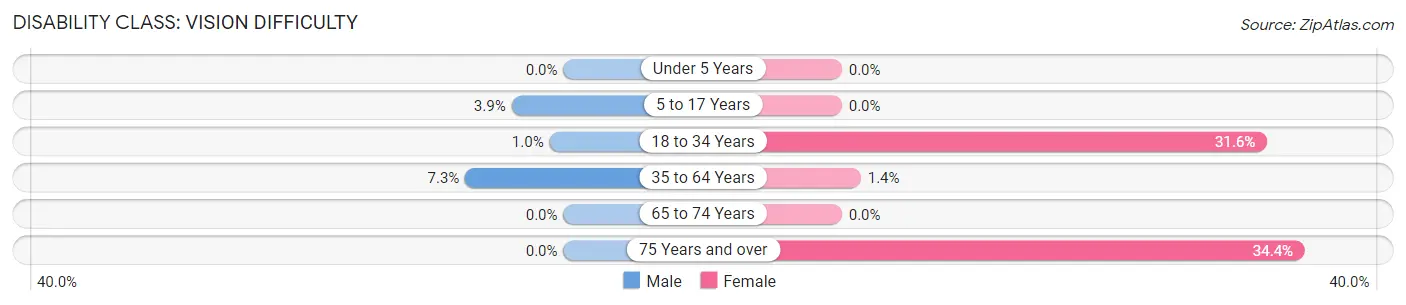
| Age Bracket | Male | Female |
| Under 5 Years | 0 (0.0%) | 0 (0.0%) |
| 5 to 17 Years | 2 (3.8%) | 0 (0.0%) |
| 18 to 34 Years | 1 (1.0%) | 6 (31.6%) |
| 35 to 64 Years | 7 (7.3%) | 1 (1.4%) |
| 65 to 74 Years | 0 (0.0%) | 0 (0.0%) |
| 75 Years and over | 0 (0.0%) | 11 (34.4%) |
Disability Class: Cognitive Difficulty
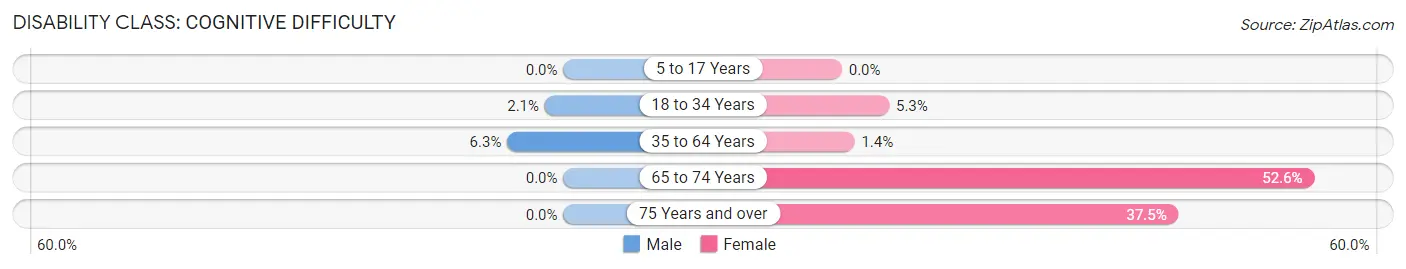
| Age Bracket | Male | Female |
| 5 to 17 Years | 0 (0.0%) | 0 (0.0%) |
| 18 to 34 Years | 2 (2.1%) | 1 (5.3%) |
| 35 to 64 Years | 6 (6.2%) | 1 (1.4%) |
| 65 to 74 Years | 0 (0.0%) | 10 (52.6%) |
| 75 Years and over | 0 (0.0%) | 12 (37.5%) |
Disability Class: Ambulatory Difficulty
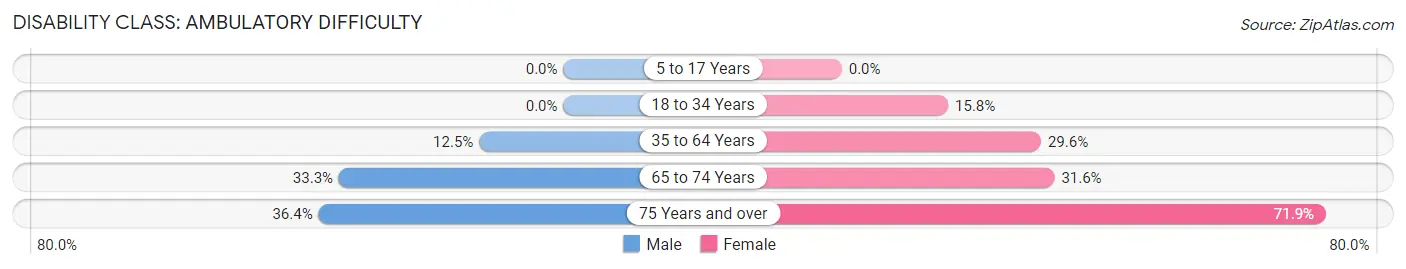
| Age Bracket | Male | Female |
| 5 to 17 Years | 0 (0.0%) | 0 (0.0%) |
| 18 to 34 Years | 0 (0.0%) | 3 (15.8%) |
| 35 to 64 Years | 12 (12.5%) | 21 (29.6%) |
| 65 to 74 Years | 3 (33.3%) | 6 (31.6%) |
| 75 Years and over | 4 (36.4%) | 23 (71.9%) |
Disability Class: Self-Care Difficulty
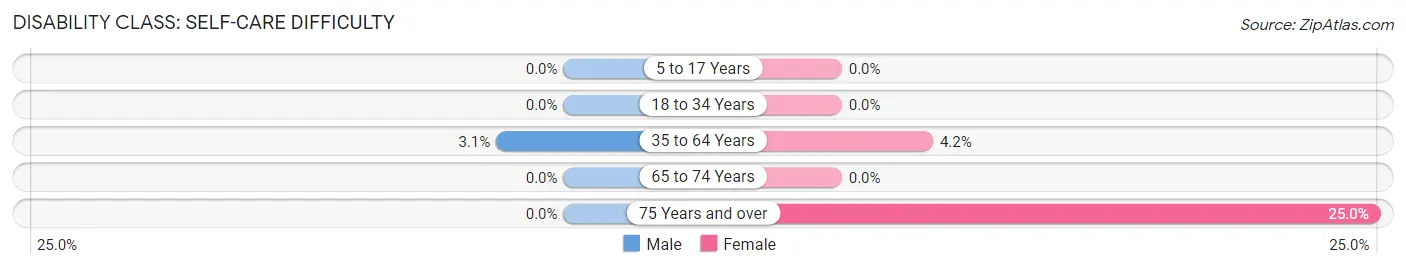
| Age Bracket | Male | Female |
| 5 to 17 Years | 0 (0.0%) | 0 (0.0%) |
| 18 to 34 Years | 0 (0.0%) | 0 (0.0%) |
| 35 to 64 Years | 3 (3.1%) | 3 (4.2%) |
| 65 to 74 Years | 0 (0.0%) | 0 (0.0%) |
| 75 Years and over | 0 (0.0%) | 8 (25.0%) |
Technology Access in Sharpsburg
Computing Device Access in Sharpsburg
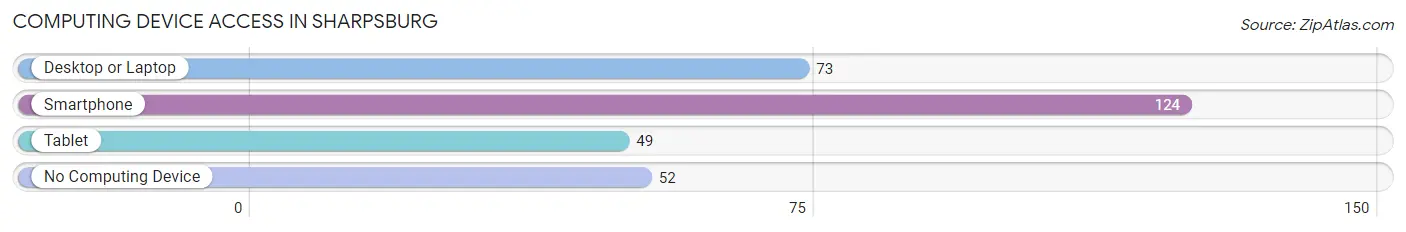
| Device Type | # Households | % Households |
| Desktop or Laptop | 73 | 41.0% |
| Smartphone | 124 | 69.7% |
| Tablet | 49 | 27.5% |
| No Computing Device | 52 | 29.2% |
| Total | 178 | 100.0% |
Internet Access in Sharpsburg
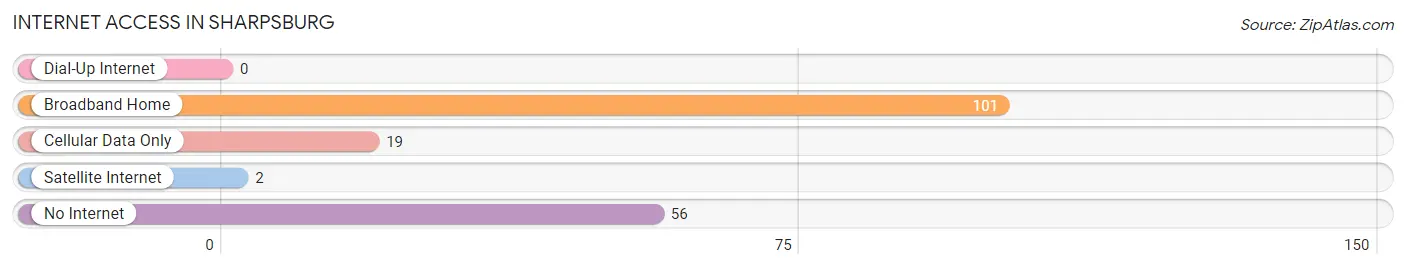
| Internet Type | # Households | % Households |
| Dial-Up Internet | 0 | 0.0% |
| Broadband Home | 101 | 56.7% |
| Cellular Data Only | 19 | 10.7% |
| Satellite Internet | 2 | 1.1% |
| No Internet | 56 | 31.5% |
| Total | 178 | 100.0% |
Sharpsburg Summary
Sharpburg, Kentucky is a small town located in the western part of the state, in the foothills of the Appalachian Mountains. It is situated in the county of Bath, and is part of the larger Lexington-Fayette metropolitan area. The town has a population of just over 1,000 people, and is known for its rural charm and small-town atmosphere.
Geography
Sharpburg is located in the western part of Kentucky, in the foothills of the Appalachian Mountains. It is situated in the county of Bath, and is part of the larger Lexington-Fayette metropolitan area. The town is located at the intersection of US Route 68 and KY Route 36. The terrain of the area is mostly rolling hills, with some flat areas. The climate is humid subtropical, with hot summers and mild winters.
History
Sharpburg was founded in 1820 by a group of settlers from Virginia. The town was named after the Sharp family, who were among the first settlers. The town grew slowly, and by the mid-1800s, it had become a thriving agricultural community. The town was also known for its coal mining industry, which provided jobs for many of the town's residents.
In the early 1900s, the town began to decline, as the coal industry began to decline. The town was also affected by the Great Depression, and many of the town's residents left in search of better opportunities. The town continued to decline until the 1950s, when the town began to experience a resurgence. The town was revitalized by the construction of a new highway, which brought new businesses and residents to the area.
Economy
Sharpburg's economy is largely based on agriculture and tourism. The town is home to several farms, which produce a variety of crops, including corn, soybeans, and wheat. The town is also home to several wineries, which produce a variety of wines. Tourism is also an important part of the town's economy, as the town is home to several historic sites, including the Sharpburg Historic District.
Demographics
As of the 2010 census, Sharpburg had a population of 1,072 people. The racial makeup of the town was 97.2% White, 0.9% African American, 0.2% Native American, 0.2% Asian, 0.1% Pacific Islander, 0.4% from other races, and 0.9% from two or more races. Hispanic or Latino of any race were 1.2% of the population.
The median income for a household in the town was $37,500, and the median income for a family was $45,000. The per capita income for the town was $19,845. About 11.2% of families and 14.2% of the population were below the poverty line, including 18.2% of those under age 18 and 8.3% of those age 65 or over.
Conclusion
Sharpburg, Kentucky is a small town located in the western part of the state, in the foothills of the Appalachian Mountains. It is situated in the county of Bath, and is part of the larger Lexington-Fayette metropolitan area. The town has a population of just over 1,000 people, and is known for its rural charm and small-town atmosphere. The town's economy is largely based on agriculture and tourism, and the town is home to several historic sites. The town has a diverse population, with a median income of $37,500 for households and $45,000 for families.
Common Questions
What is Per Capita Income in Sharpsburg?
Per Capita income in Sharpsburg is $27,115.
What is the Median Family Income in Sharpsburg?
Median Family Income in Sharpsburg is $50,313.
What is the Median Household income in Sharpsburg?
Median Household Income in Sharpsburg is $30,000.
What is Income or Wage Gap in Sharpsburg?
Income or Wage Gap in Sharpsburg is 43.7%.
Women in Sharpsburg earn 56.3 cents for every dollar earned by a man.
What is Inequality or Gini Index in Sharpsburg?
Inequality or Gini Index in Sharpsburg is 0.60.
What is the Total Population of Sharpsburg?
Total Population of Sharpsburg is 428.
What is the Total Male Population of Sharpsburg?
Total Male Population of Sharpsburg is 268.
What is the Total Female Population of Sharpsburg?
Total Female Population of Sharpsburg is 160.
What is the Ratio of Males per 100 Females in Sharpsburg?
There are 167.50 Males per 100 Females in Sharpsburg.
What is the Ratio of Females per 100 Males in Sharpsburg?
There are 59.70 Females per 100 Males in Sharpsburg.
What is the Median Population Age in Sharpsburg?
Median Population Age in Sharpsburg is 41.2 Years.
What is the Average Family Size in Sharpsburg
Average Family Size in Sharpsburg is 3.7 People.
What is the Average Household Size in Sharpsburg
Average Household Size in Sharpsburg is 2.4 People.
How Large is the Labor Force in Sharpsburg?
There are 164 People in the Labor Forcein in Sharpsburg.
What is the Percentage of People in the Labor Force in Sharpsburg?
45.4% of People are in the Labor Force in Sharpsburg.
What is the Unemployment Rate in Sharpsburg?
Unemployment Rate in Sharpsburg is 7.9%.