Jackson, KY Map & Demographics
Jackson Map
Jackson Overview
$24,381
PER CAPITA INCOME
$53,750
AVG FAMILY INCOME
$33,333
AVG HOUSEHOLD INCOME
31.4%
WAGE / INCOME GAP [ % ]
68.6¢/ $1
WAGE / INCOME GAP [ $ ]
0.45
INEQUALITY / GINI INDEX
2,286
TOTAL POPULATION
962
MALE POPULATION
1,324
FEMALE POPULATION
72.66
MALES / 100 FEMALES
137.63
FEMALES / 100 MALES
43.1
MEDIAN AGE
2.7
AVG FAMILY SIZE
2.0
AVG HOUSEHOLD SIZE
1,026
LABOR FORCE [ PEOPLE ]
53.2%
PERCENT IN LABOR FORCE
9.6%
UNEMPLOYMENT RATE
Jackson Zip Codes
Jackson Area Codes
Income in Jackson
Income Overview in Jackson
Per Capita Income in Jackson is $24,381, while median incomes of families and households are $53,750 and $33,333 respectively.
| Characteristic | Number | Measure |
| Per Capita Income | 2,286 | $24,381 |
| Median Family Income | 607 | $53,750 |
| Mean Family Income | 607 | $62,886 |
| Median Household Income | 1,094 | $33,333 |
| Mean Household Income | 1,094 | $50,464 |
| Income Deficit | 607 | $0 |
| Wage / Income Gap (%) | 2,286 | 31.44% |
| Wage / Income Gap ($) | 2,286 | 68.56¢ per $1 |
| Gini / Inequality Index | 2,286 | 0.45 |
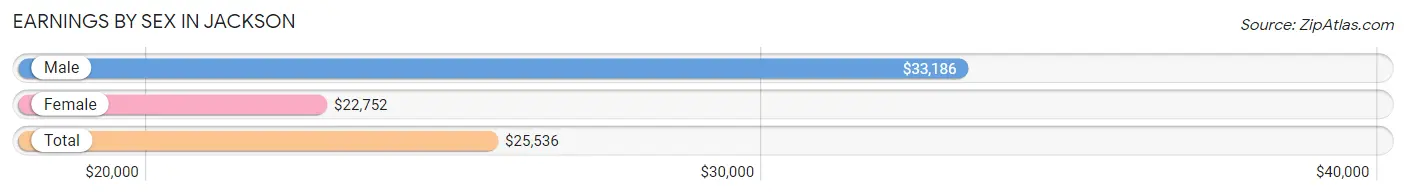
Earnings by Sex in Jackson
Average Earnings in Jackson are $25,536, $33,186 for men and $22,752 for women, a difference of 31.4%.
| Sex | Number | Average Earnings |
| Male | 494 (47.4%) | $33,186 |
| Female | 547 (52.5%) | $22,752 |
| Total | 1,041 (100.0%) | $25,536 |
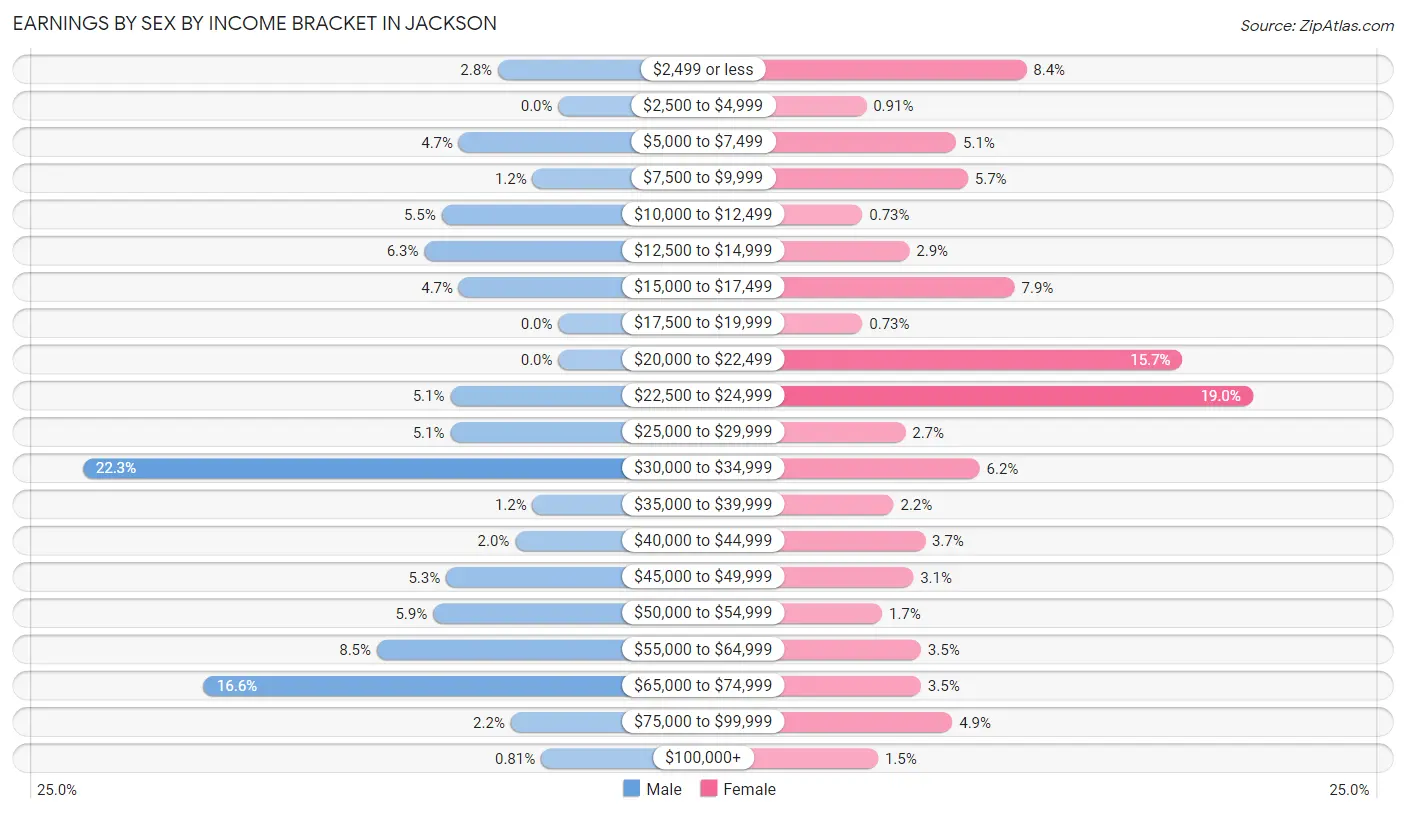
Earnings by Sex by Income Bracket in Jackson
The most common earnings brackets in Jackson are $30,000 to $34,999 for men (110 | 22.3%) and $22,500 to $24,999 for women (104 | 19.0%).
| Income | Male | Female |
| $2,499 or less | 14 (2.8%) | 46 (8.4%) |
| $2,500 to $4,999 | 0 (0.0%) | 5 (0.9%) |
| $5,000 to $7,499 | 23 (4.7%) | 28 (5.1%) |
| $7,500 to $9,999 | 6 (1.2%) | 31 (5.7%) |
| $10,000 to $12,499 | 27 (5.5%) | 4 (0.7%) |
| $12,500 to $14,999 | 31 (6.3%) | 16 (2.9%) |
| $15,000 to $17,499 | 23 (4.7%) | 43 (7.9%) |
| $17,500 to $19,999 | 0 (0.0%) | 4 (0.7%) |
| $20,000 to $22,499 | 0 (0.0%) | 86 (15.7%) |
| $22,500 to $24,999 | 25 (5.1%) | 104 (19.0%) |
| $25,000 to $29,999 | 25 (5.1%) | 15 (2.7%) |
| $30,000 to $34,999 | 110 (22.3%) | 34 (6.2%) |
| $35,000 to $39,999 | 6 (1.2%) | 12 (2.2%) |
| $40,000 to $44,999 | 10 (2.0%) | 20 (3.7%) |
| $45,000 to $49,999 | 26 (5.3%) | 17 (3.1%) |
| $50,000 to $54,999 | 29 (5.9%) | 9 (1.7%) |
| $55,000 to $64,999 | 42 (8.5%) | 19 (3.5%) |
| $65,000 to $74,999 | 82 (16.6%) | 19 (3.5%) |
| $75,000 to $99,999 | 11 (2.2%) | 27 (4.9%) |
| $100,000+ | 4 (0.8%) | 8 (1.5%) |
| Total | 494 (100.0%) | 547 (100.0%) |
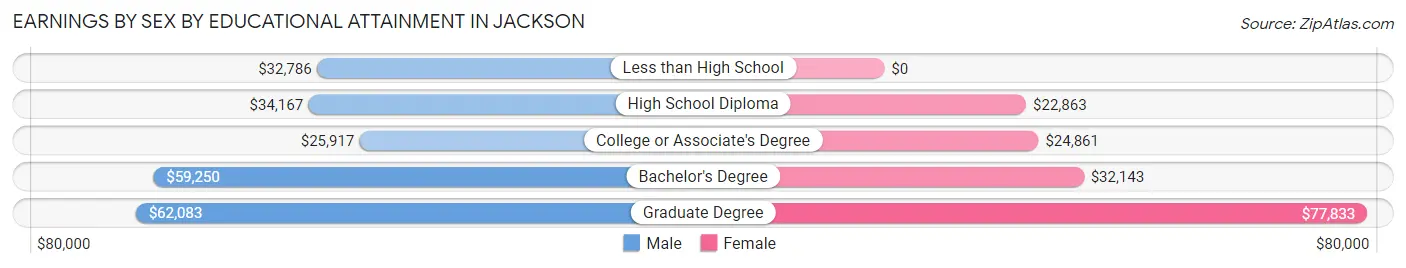
Earnings by Sex by Educational Attainment in Jackson
Average earnings in Jackson are $34,657 for men and $23,906 for women, a difference of 31.0%. Men with an educational attainment of graduate degree enjoy the highest average annual earnings of $62,083, while those with college or associate's degree education earn the least with $25,917. Women with an educational attainment of graduate degree earn the most with the average annual earnings of $77,833, while those with high school diploma education have the smallest earnings of $22,863.
| Educational Attainment | Male Income | Female Income |
| Less than High School | $32,786 | $0 |
| High School Diploma | $34,167 | $22,863 |
| College or Associate's Degree | $25,917 | $24,861 |
| Bachelor's Degree | $59,250 | $32,143 |
| Graduate Degree | $62,083 | $77,833 |
| Total | $34,657 | $23,906 |
Family Income in Jackson
Family Income Brackets in Jackson
According to the Jackson family income data, there are 110 families falling into the $50,000 to $74,999 income range, which is the most common income bracket and makes up 18.1% of all families. Conversely, the less than $10,000 income bracket is the least frequent group with only 2 families (0.3%) belonging to this category.
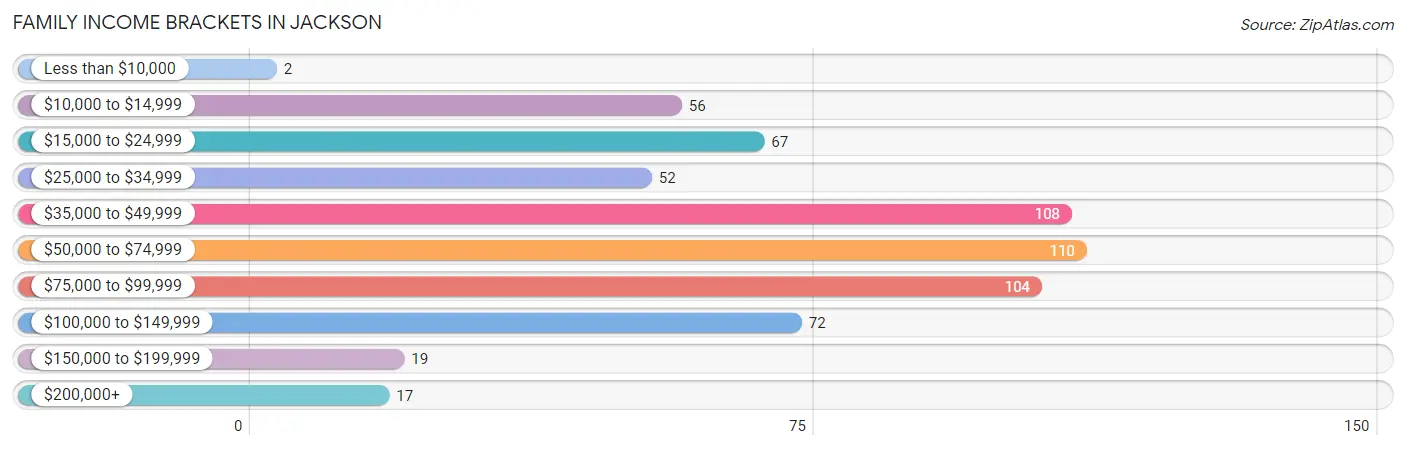
| Income Bracket | # Families | % Families |
| Less than $10,000 | 2 | 0.3% |
| $10,000 to $14,999 | 56 | 9.2% |
| $15,000 to $24,999 | 67 | 11.0% |
| $25,000 to $34,999 | 52 | 8.6% |
| $35,000 to $49,999 | 108 | 17.8% |
| $50,000 to $74,999 | 110 | 18.1% |
| $75,000 to $99,999 | 104 | 17.1% |
| $100,000 to $149,999 | 72 | 11.9% |
| $150,000 to $199,999 | 19 | 3.1% |
| $200,000+ | 17 | 2.8% |
Family Income by Famaliy Size in Jackson
5-person families (88 | 14.5%) account for the highest median family income in Jackson with $78,730 per family, while 3-person families (131 | 21.6%) have the highest median income of $23,018 per family member.
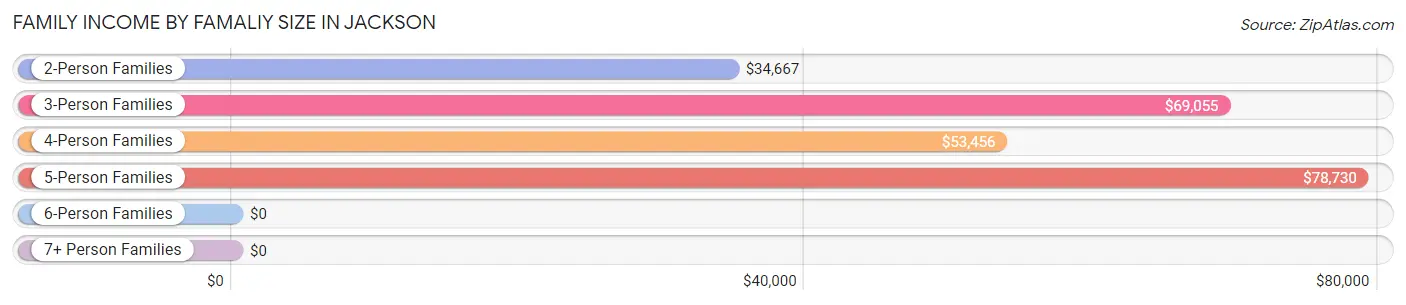
| Income Bracket | # Families | Median Income |
| 2-Person Families | 298 (49.1%) | $34,667 |
| 3-Person Families | 131 (21.6%) | $69,055 |
| 4-Person Families | 83 (13.7%) | $53,456 |
| 5-Person Families | 88 (14.5%) | $78,730 |
| 6-Person Families | 7 (1.1%) | $0 |
| 7+ Person Families | 0 (0.0%) | $0 |
| Total | 607 (100.0%) | $53,750 |
Family Income by Number of Earners in Jackson
The median family income in Jackson is $53,750, with families comprising 3+ earners (118) having the highest median family income of $79,221, while families with no earners (156) have the lowest median family income of $24,000, accounting for 19.4% and 25.7% of families, respectively.
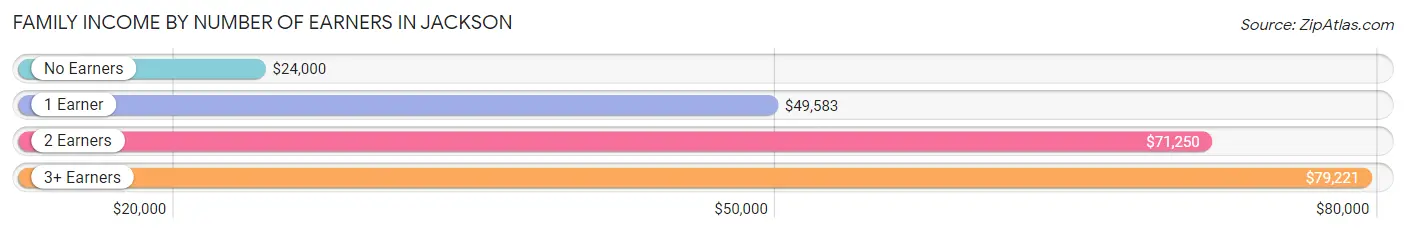
| Number of Earners | # Families | Median Income |
| No Earners | 156 (25.7%) | $24,000 |
| 1 Earner | 183 (30.1%) | $49,583 |
| 2 Earners | 150 (24.7%) | $71,250 |
| 3+ Earners | 118 (19.4%) | $79,221 |
| Total | 607 (100.0%) | $53,750 |
Household Income in Jackson
Household Income Brackets in Jackson
With 206 households falling in the category, the $10,000 to $14,999 income range is the most frequent in Jackson, accounting for 18.8% of all households. In contrast, only 19 households (1.7%) fall into the $150,000 to $199,999 income bracket, making it the least populous group.
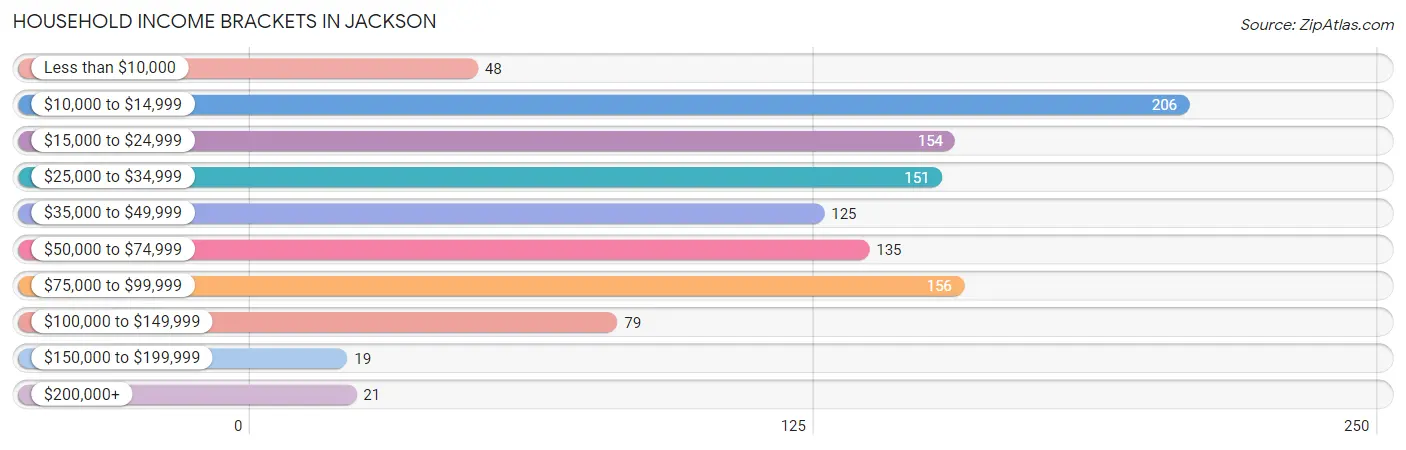
| Income Bracket | # Households | % Households |
| Less than $10,000 | 48 | 4.4% |
| $10,000 to $14,999 | 206 | 18.8% |
| $15,000 to $24,999 | 154 | 14.1% |
| $25,000 to $34,999 | 151 | 13.8% |
| $35,000 to $49,999 | 125 | 11.4% |
| $50,000 to $74,999 | 135 | 12.3% |
| $75,000 to $99,999 | 156 | 14.3% |
| $100,000 to $149,999 | 79 | 7.2% |
| $150,000 to $199,999 | 19 | 1.7% |
| $200,000+ | 21 | 1.9% |
Household Income by Householder Age in Jackson
The median household income in Jackson is $33,333, with the highest median household income of $73,049 found in the 25 to 44 years age bracket for the primary householder. A total of 398 households (36.4%) fall into this category. Meanwhile, the 15 to 24 years age bracket for the primary householder has the lowest median household income of $0, with 38 households (3.5%) in this group.
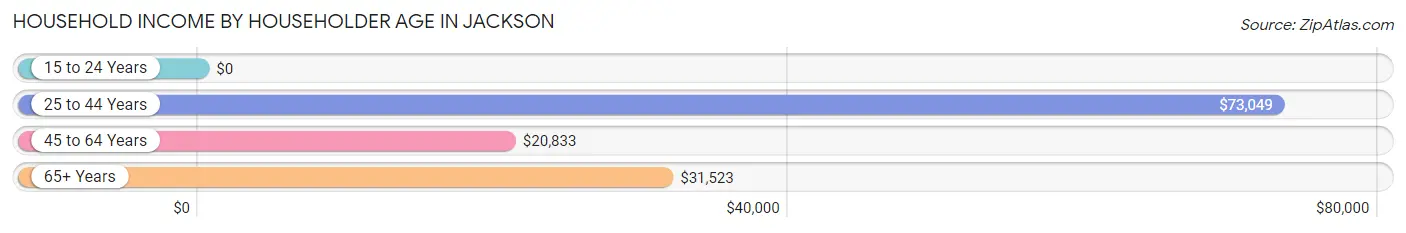
| Income Bracket | # Households | Median Income |
| 15 to 24 Years | 38 (3.5%) | $0 |
| 25 to 44 Years | 398 (36.4%) | $73,049 |
| 45 to 64 Years | 368 (33.6%) | $20,833 |
| 65+ Years | 290 (26.5%) | $31,523 |
| Total | 1,094 (100.0%) | $33,333 |
Poverty in Jackson
Income Below Poverty by Sex and Age in Jackson
With 22.9% poverty level for males and 17.6% for females among the residents of Jackson, under 5 year old males and 45 to 54 year old females are the most vulnerable to poverty, with 7 males (50.0%) and 63 females (42.9%) in their respective age groups living below the poverty level.
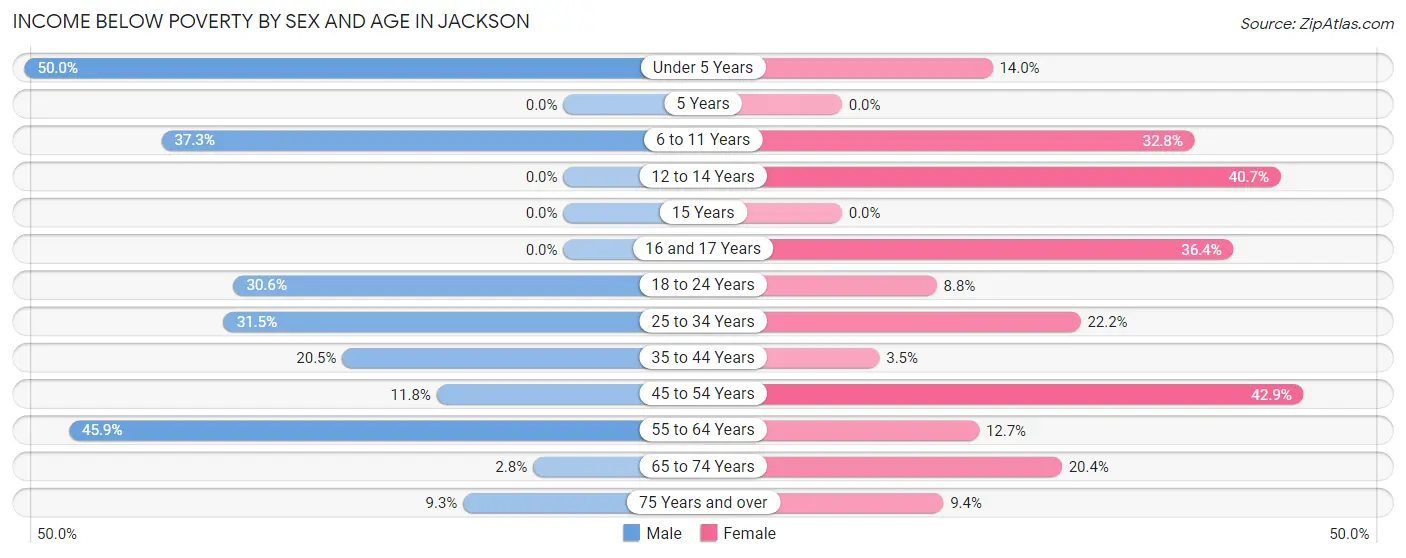
| Age Bracket | Male | Female |
| Under 5 Years | 7 (50.0%) | 13 (14.0%) |
| 5 Years | 0 (0.0%) | 0 (0.0%) |
| 6 to 11 Years | 22 (37.3%) | 19 (32.8%) |
| 12 to 14 Years | 0 (0.0%) | 11 (40.7%) |
| 15 Years | 0 (0.0%) | 0 (0.0%) |
| 16 and 17 Years | 0 (0.0%) | 8 (36.4%) |
| 18 to 24 Years | 30 (30.6%) | 11 (8.8%) |
| 25 to 34 Years | 46 (31.5%) | 33 (22.2%) |
| 35 to 44 Years | 32 (20.5%) | 7 (3.5%) |
| 45 to 54 Years | 18 (11.8%) | 63 (42.9%) |
| 55 to 64 Years | 50 (45.9%) | 21 (12.7%) |
| 65 to 74 Years | 2 (2.8%) | 20 (20.4%) |
| 75 Years and over | 4 (9.3%) | 16 (9.4%) |
| Total | 211 (22.9%) | 222 (17.6%) |
Income Above Poverty by Sex and Age in Jackson
According to the poverty statistics in Jackson, males aged 5 years and females aged 5 years are the age groups that are most secure financially, with 100.0% of males and 100.0% of females in these age groups living above the poverty line.
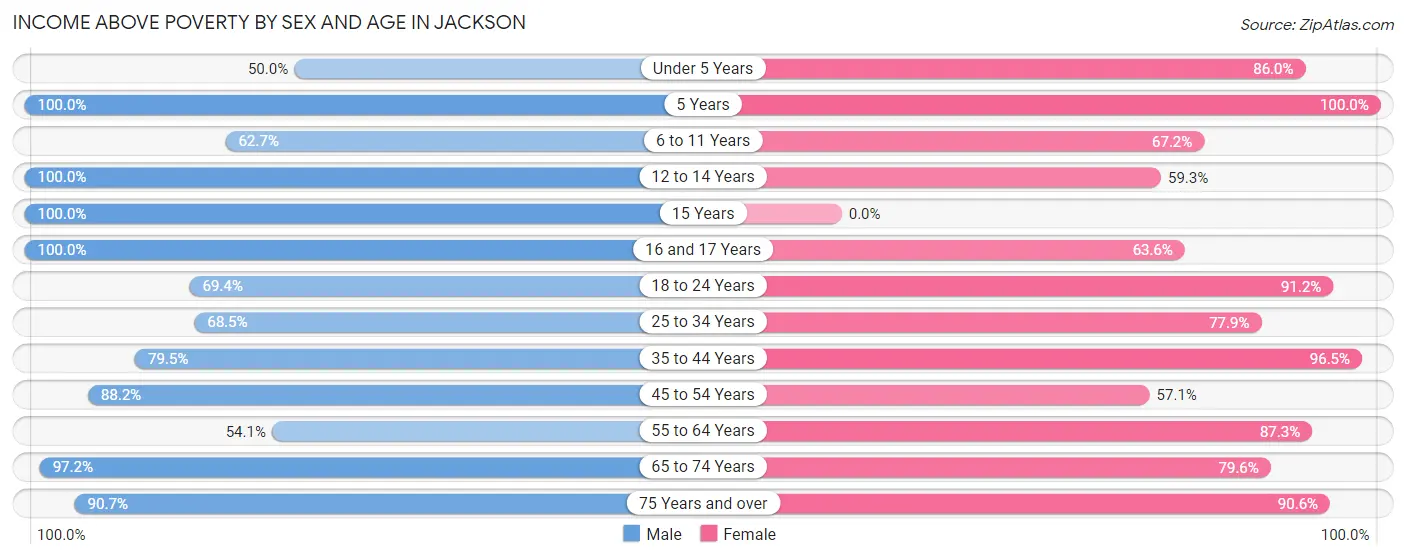
| Age Bracket | Male | Female |
| Under 5 Years | 7 (50.0%) | 80 (86.0%) |
| 5 Years | 33 (100.0%) | 8 (100.0%) |
| 6 to 11 Years | 37 (62.7%) | 39 (67.2%) |
| 12 to 14 Years | 17 (100.0%) | 16 (59.3%) |
| 15 Years | 21 (100.0%) | 0 (0.0%) |
| 16 and 17 Years | 1 (100.0%) | 14 (63.6%) |
| 18 to 24 Years | 68 (69.4%) | 114 (91.2%) |
| 25 to 34 Years | 100 (68.5%) | 116 (77.8%) |
| 35 to 44 Years | 124 (79.5%) | 194 (96.5%) |
| 45 to 54 Years | 135 (88.2%) | 84 (57.1%) |
| 55 to 64 Years | 59 (54.1%) | 144 (87.3%) |
| 65 to 74 Years | 69 (97.2%) | 78 (79.6%) |
| 75 Years and over | 39 (90.7%) | 154 (90.6%) |
| Total | 710 (77.1%) | 1,041 (82.4%) |
Income Below Poverty Among Married-Couple Families in Jackson
The poverty statistics for married-couple families in Jackson show that 6.5% or 24 of the total 371 families live below the poverty line. Families with 1 or 2 children have the highest poverty rate of 11.8%, comprising of 24 families. On the other hand, families with no children have the lowest poverty rate of 0.0%, which includes 0 families.
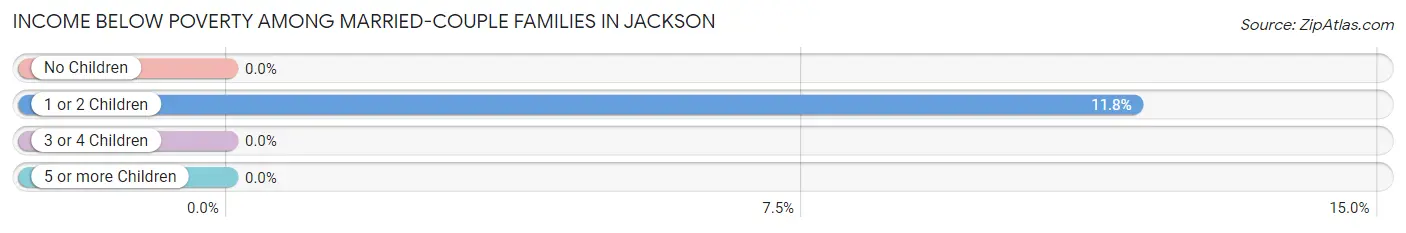
| Children | Above Poverty | Below Poverty |
| No Children | 161 (100.0%) | 0 (0.0%) |
| 1 or 2 Children | 179 (88.2%) | 24 (11.8%) |
| 3 or 4 Children | 7 (100.0%) | 0 (0.0%) |
| 5 or more Children | 0 (0.0%) | 0 (0.0%) |
| Total | 347 (93.5%) | 24 (6.5%) |
Income Below Poverty Among Single-Parent Households in Jackson
According to the poverty data in Jackson, 21.4% or 12 single-father households and 35.0% or 63 single-mother households are living below the poverty line. Among single-father households, those with 1 or 2 children have the highest poverty rate, with 12 households (24.5%) experiencing poverty. Likewise, among single-mother households, those with 1 or 2 children have the highest poverty rate, with 54 households (51.9%) falling below the poverty line.
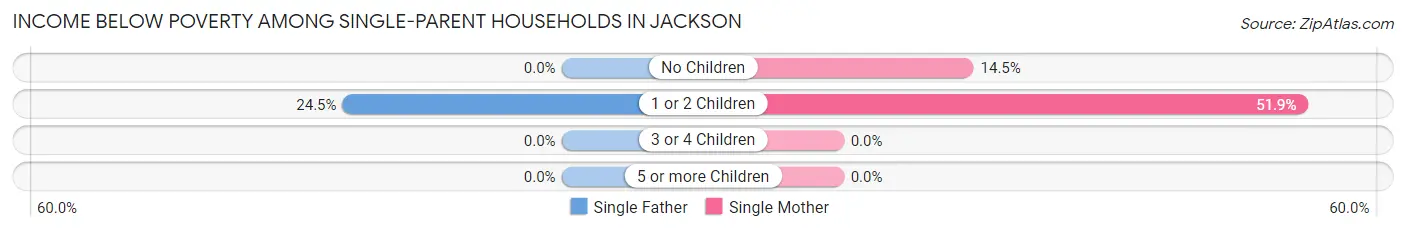
| Children | Single Father | Single Mother |
| No Children | 0 (0.0%) | 9 (14.5%) |
| 1 or 2 Children | 12 (24.5%) | 54 (51.9%) |
| 3 or 4 Children | 0 (0.0%) | 0 (0.0%) |
| 5 or more Children | 0 (0.0%) | 0 (0.0%) |
| Total | 12 (21.4%) | 63 (35.0%) |
Income Below Poverty Among Married-Couple vs Single-Parent Households in Jackson
The poverty data for Jackson shows that 24 of the married-couple family households (6.5%) and 75 of the single-parent households (31.8%) are living below the poverty level. Within the married-couple family households, those with 1 or 2 children have the highest poverty rate, with 24 households (11.8%) falling below the poverty line. Among the single-parent households, those with 1 or 2 children have the highest poverty rate, with 66 household (43.1%) living below poverty.
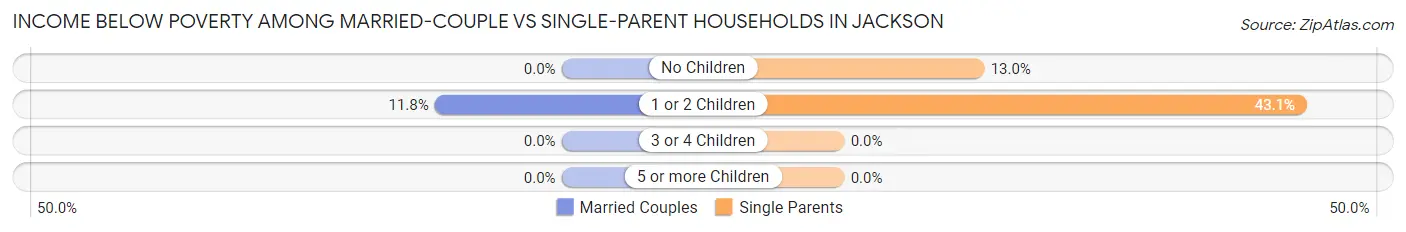
| Children | Married-Couple Families | Single-Parent Households |
| No Children | 0 (0.0%) | 9 (13.0%) |
| 1 or 2 Children | 24 (11.8%) | 66 (43.1%) |
| 3 or 4 Children | 0 (0.0%) | 0 (0.0%) |
| 5 or more Children | 0 (0.0%) | 0 (0.0%) |
| Total | 24 (6.5%) | 75 (31.8%) |
Race in Jackson
The most populous races in Jackson are White / Caucasian (2,222 | 97.2%), Asian (41 | 1.8%), and Two or more Races (23 | 1.0%).
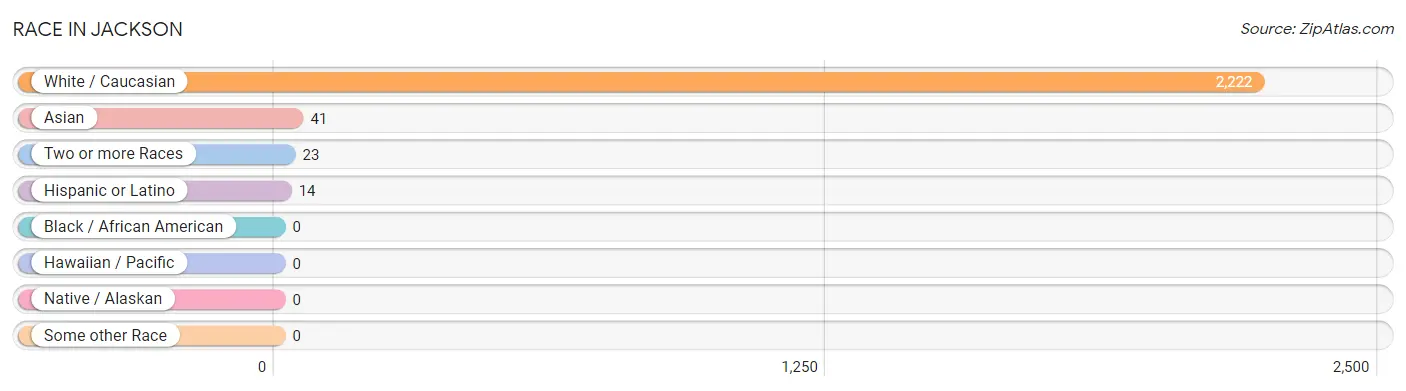
| Race | # Population | % Population |
| Asian | 41 | 1.8% |
| Black / African American | 0 | 0.0% |
| Hawaiian / Pacific | 0 | 0.0% |
| Hispanic or Latino | 14 | 0.6% |
| Native / Alaskan | 0 | 0.0% |
| White / Caucasian | 2,222 | 97.2% |
| Two or more Races | 23 | 1.0% |
| Some other Race | 0 | 0.0% |
| Total | 2,286 | 100.0% |
Ancestry in Jackson
The most populous ancestries reported in Jackson are American (714 | 31.2%), English (329 | 14.4%), Irish (89 | 3.9%), German (68 | 3.0%), and Italian (58 | 2.5%), together accounting for 55.0% of all Jackson residents.
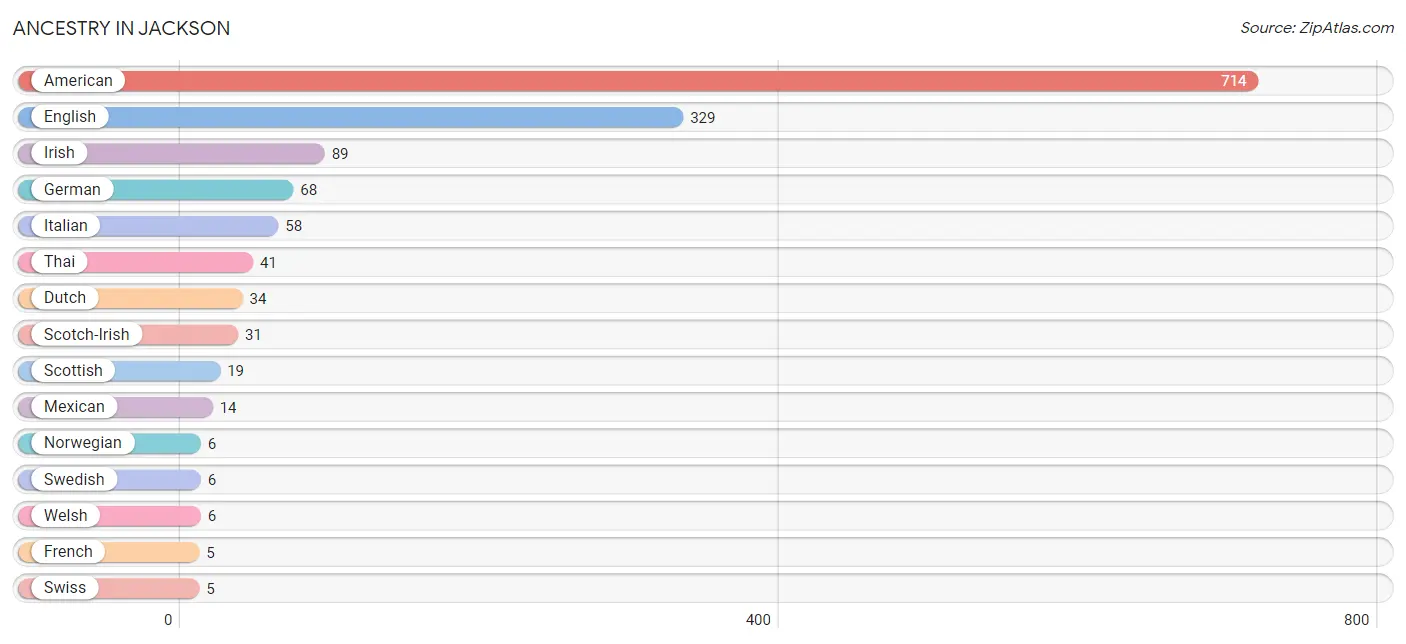
| Ancestry | # Population | % Population |
| American | 714 | 31.2% |
| British | 4 | 0.2% |
| Dutch | 34 | 1.5% |
| English | 329 | 14.4% |
| French | 5 | 0.2% |
| German | 68 | 3.0% |
| Irish | 89 | 3.9% |
| Italian | 58 | 2.5% |
| Mexican | 14 | 0.6% |
| Norwegian | 6 | 0.3% |
| Scotch-Irish | 31 | 1.4% |
| Scottish | 19 | 0.8% |
| Swedish | 6 | 0.3% |
| Swiss | 5 | 0.2% |
| Thai | 41 | 1.8% |
| Welsh | 6 | 0.3% | View All 16 Rows |
Immigrants in Jackson
The most numerous immigrant groups reported in Jackson came from Asia (41 | 1.8%), India (41 | 1.8%), and South Central Asia (41 | 1.8%), together accounting for 5.4% of all Jackson residents.
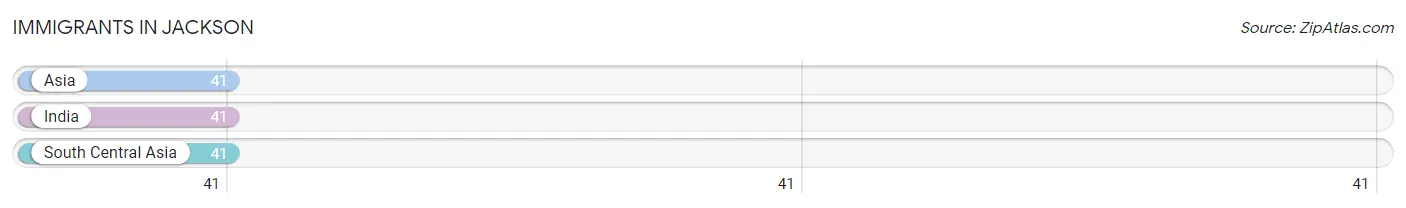
| Immigration Origin | # Population | % Population |
| Asia | 41 | 1.8% |
| India | 41 | 1.8% |
| South Central Asia | 41 | 1.8% | View All 3 Rows |
Sex and Age in Jackson
Sex and Age in Jackson
The most populous age groups in Jackson are 40 to 44 Years (115 | 11.9%) for men and 40 to 44 Years (145 | 11.0%) for women.
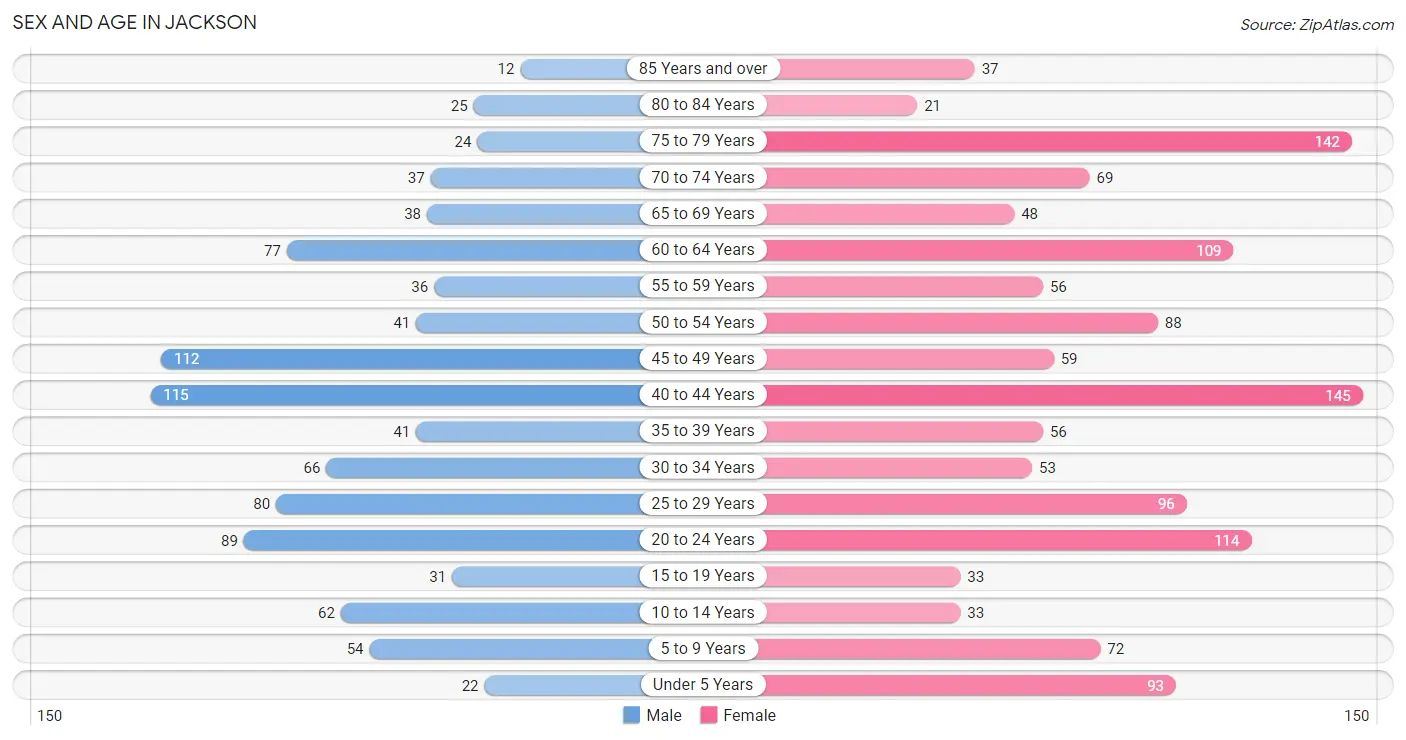
| Age Bracket | Male | Female |
| Under 5 Years | 22 (2.3%) | 93 (7.0%) |
| 5 to 9 Years | 54 (5.6%) | 72 (5.4%) |
| 10 to 14 Years | 62 (6.4%) | 33 (2.5%) |
| 15 to 19 Years | 31 (3.2%) | 33 (2.5%) |
| 20 to 24 Years | 89 (9.2%) | 114 (8.6%) |
| 25 to 29 Years | 80 (8.3%) | 96 (7.2%) |
| 30 to 34 Years | 66 (6.9%) | 53 (4.0%) |
| 35 to 39 Years | 41 (4.3%) | 56 (4.2%) |
| 40 to 44 Years | 115 (11.9%) | 145 (11.0%) |
| 45 to 49 Years | 112 (11.6%) | 59 (4.5%) |
| 50 to 54 Years | 41 (4.3%) | 88 (6.7%) |
| 55 to 59 Years | 36 (3.7%) | 56 (4.2%) |
| 60 to 64 Years | 77 (8.0%) | 109 (8.2%) |
| 65 to 69 Years | 38 (4.0%) | 48 (3.6%) |
| 70 to 74 Years | 37 (3.8%) | 69 (5.2%) |
| 75 to 79 Years | 24 (2.5%) | 142 (10.7%) |
| 80 to 84 Years | 25 (2.6%) | 21 (1.6%) |
| 85 Years and over | 12 (1.3%) | 37 (2.8%) |
| Total | 962 (100.0%) | 1,324 (100.0%) |
Families and Households in Jackson
Median Family Size in Jackson
The median family size in Jackson is 2.70 persons per family, with married-couple families (371 | 61.1%) accounting for the largest median family size of 2.92 persons per family. On the other hand, single male/father families (56 | 9.2%) represent the smallest median family size with 1.71 persons per family.
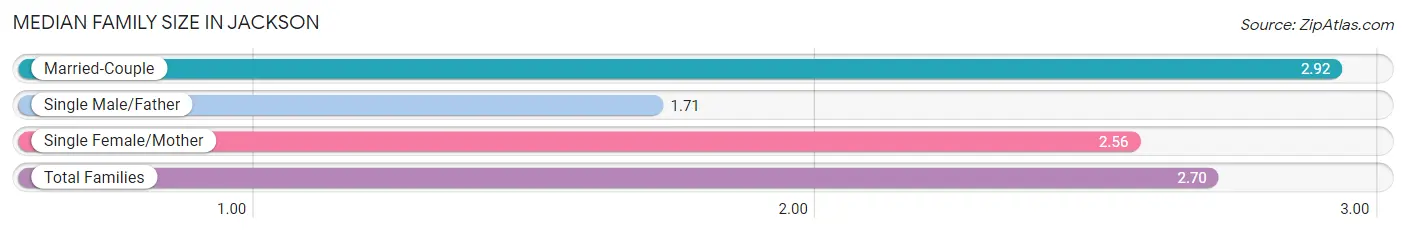
| Family Type | # Families | Family Size |
| Married-Couple | 371 (61.1%) | 2.92 |
| Single Male/Father | 56 (9.2%) | 1.71 |
| Single Female/Mother | 180 (29.6%) | 2.56 |
| Total Families | 607 (100.0%) | 2.70 |
Median Household Size in Jackson
The median household size in Jackson is 2.02 persons per household, with married-couple households (371 | 33.9%) accounting for the largest median household size of 2.94 persons per household. non-family households (487 | 44.5%) represent the smallest median household size with 1.06 persons per household.
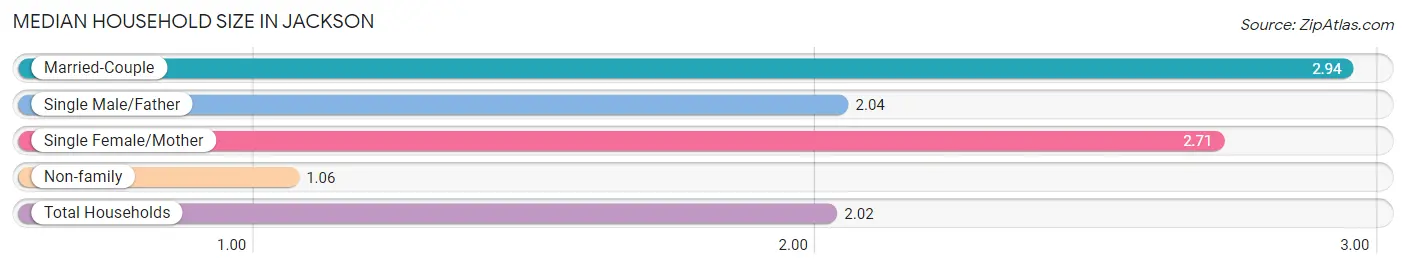
| Household Type | # Households | Household Size |
| Married-Couple | 371 (33.9%) | 2.94 |
| Single Male/Father | 56 (5.1%) | 2.04 |
| Single Female/Mother | 180 (16.5%) | 2.71 |
| Non-family | 487 (44.5%) | 1.06 |
| Total Households | 1,094 (100.0%) | 2.02 |
Household Size by Marriage Status in Jackson
Out of a total of 1,094 households in Jackson, 607 (55.5%) are family households, while 487 (44.5%) are nonfamily households. The most numerous type of family households are 2-person households, comprising 282, and the most common type of nonfamily households are 1-person households, comprising 474.
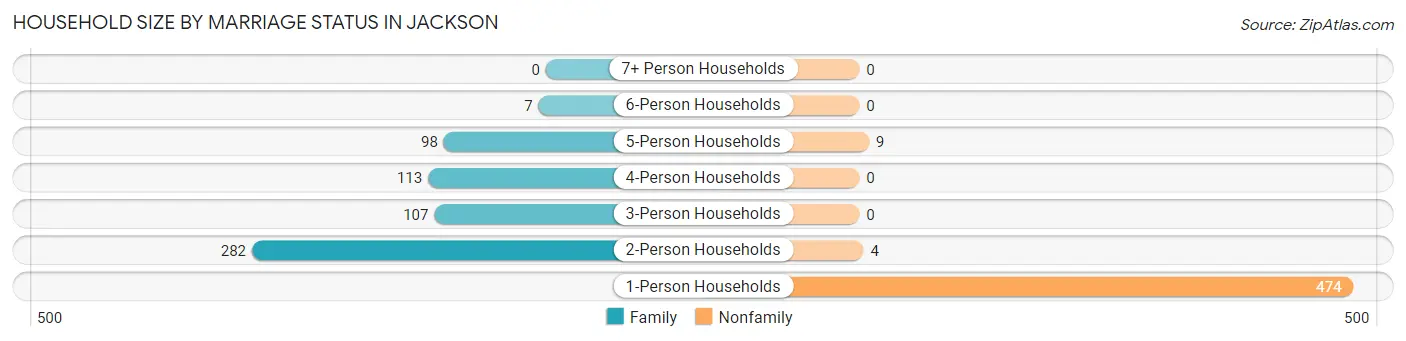
| Household Size | Family Households | Nonfamily Households |
| 1-Person Households | - | 474 (43.3%) |
| 2-Person Households | 282 (25.8%) | 4 (0.4%) |
| 3-Person Households | 107 (9.8%) | 0 (0.0%) |
| 4-Person Households | 113 (10.3%) | 0 (0.0%) |
| 5-Person Households | 98 (9.0%) | 9 (0.8%) |
| 6-Person Households | 7 (0.6%) | 0 (0.0%) |
| 7+ Person Households | 0 (0.0%) | 0 (0.0%) |
| Total | 607 (55.5%) | 487 (44.5%) |
Female Fertility in Jackson
Fertility by Age in Jackson
Average fertility rate in Jackson is 56.0 births per 1,000 women. Women in the age bracket of 20 to 34 years have the highest fertility rate with 110.0 births per 1,000 women. Women in the age bracket of 20 to 34 years acount for 90.6% of all women with births.
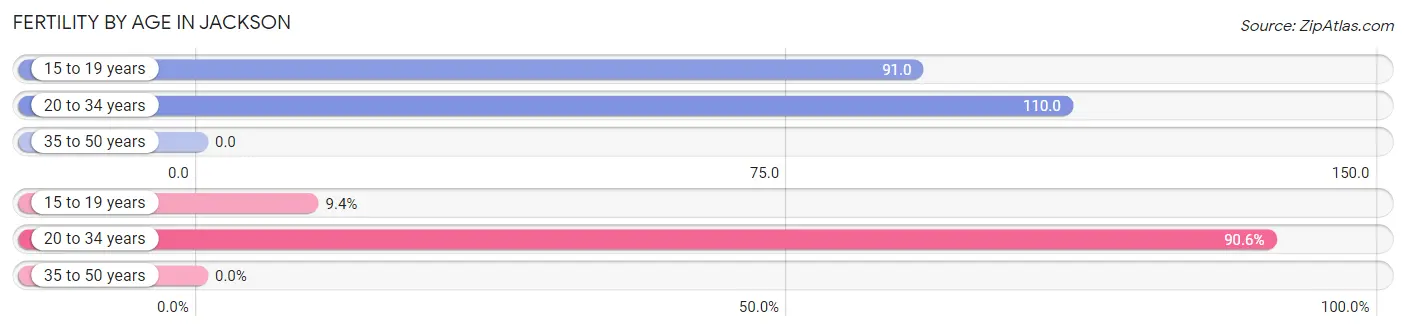
| Age Bracket | Women with Births | Births / 1,000 Women |
| 15 to 19 years | 3 (9.4%) | 91.0 |
| 20 to 34 years | 29 (90.6%) | 110.0 |
| 35 to 50 years | 0 (0.0%) | 0.0 |
| Total | 32 (100.0%) | 56.0 |
Fertility by Age by Marriage Status in Jackson
50.0% of women with births (32) in Jackson are married. The highest percentage of unmarried women with births falls into 15 to 19 years age bracket with 100.0% of them unmarried at the time of birth, while the lowest percentage of unmarried women with births belong to 20 to 34 years age bracket with 44.8% of them unmarried.
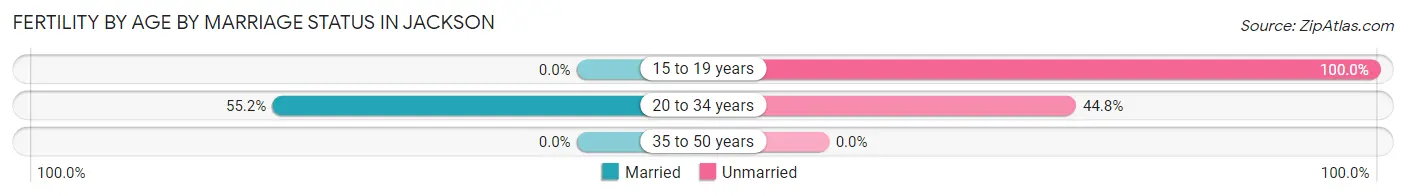
| Age Bracket | Married | Unmarried |
| 15 to 19 years | 0 (0.0%) | 3 (100.0%) |
| 20 to 34 years | 16 (55.2%) | 13 (44.8%) |
| 35 to 50 years | 0 (0.0%) | 0 (0.0%) |
| Total | 16 (50.0%) | 16 (50.0%) |
Fertility by Education in Jackson
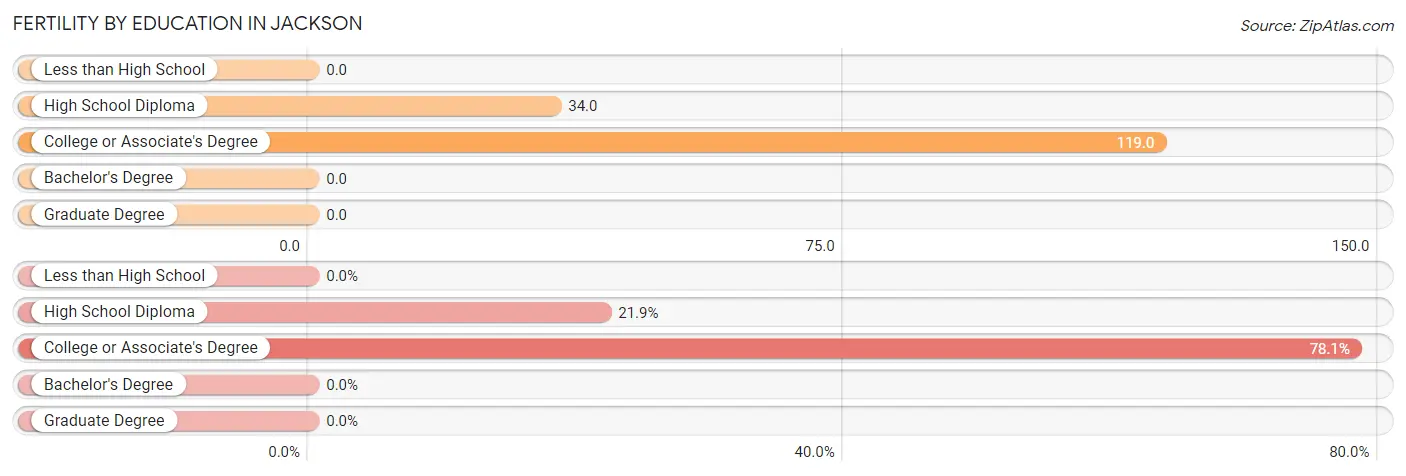
| Educational Attainment | Women with Births | Births / 1,000 Women |
| Less than High School | 0 (0.0%) | 0.0 |
| High School Diploma | 7 (21.9%) | 34.0 |
| College or Associate's Degree | 25 (78.1%) | 119.0 |
| Bachelor's Degree | 0 (0.0%) | 0.0 |
| Graduate Degree | 0 (0.0%) | 0.0 |
| Total | 32 (100.0%) | 56.0 |
Fertility by Education by Marriage Status in Jackson
50.0% of women with births in Jackson are unmarried. Women with the educational attainment of college or associate's degree are most likely to be married with 64.0% of them married at childbirth, while women with the educational attainment of high school diploma are least likely to be married with 100.0% of them unmarried at childbirth.
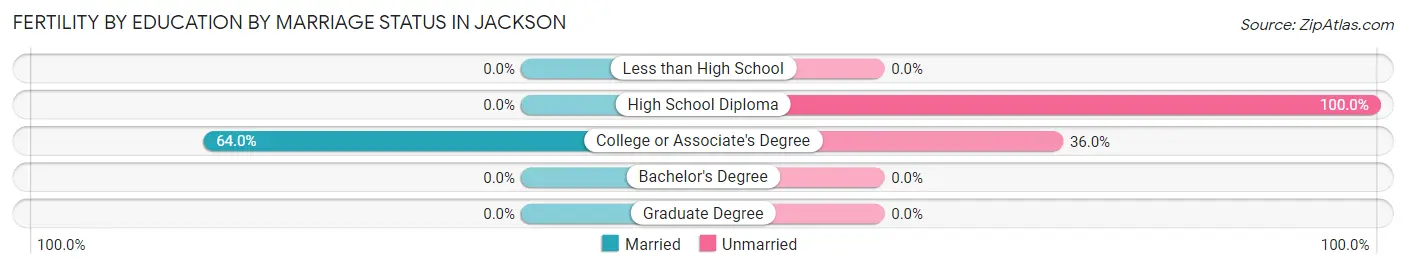
| Educational Attainment | Married | Unmarried |
| Less than High School | 0 (0.0%) | 0 (0.0%) |
| High School Diploma | 0 (0.0%) | 7 (100.0%) |
| College or Associate's Degree | 16 (64.0%) | 9 (36.0%) |
| Bachelor's Degree | 0 (0.0%) | 0 (0.0%) |
| Graduate Degree | 0 (0.0%) | 0 (0.0%) |
| Total | 16 (50.0%) | 16 (50.0%) |
Employment Characteristics in Jackson
Employment by Class of Employer in Jackson
Among the 928 employed individuals in Jackson, private company employees (530 | 57.1%), local government employees (180 | 19.4%), and state government employees (120 | 12.9%) make up the most common classes of employment.
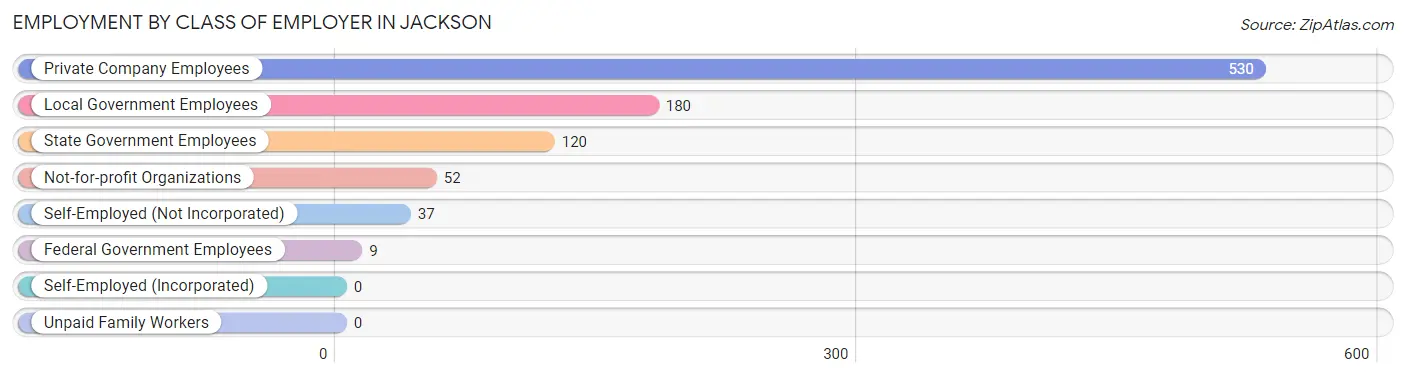
| Employer Class | # Employees | % Employees |
| Private Company Employees | 530 | 57.1% |
| Self-Employed (Incorporated) | 0 | 0.0% |
| Self-Employed (Not Incorporated) | 37 | 4.0% |
| Not-for-profit Organizations | 52 | 5.6% |
| Local Government Employees | 180 | 19.4% |
| State Government Employees | 120 | 12.9% |
| Federal Government Employees | 9 | 1.0% |
| Unpaid Family Workers | 0 | 0.0% |
| Total | 928 | 100.0% |
Employment Status by Age in Jackson
According to the labor force statistics for Jackson, out of the total population over 16 years of age (1,929), 53.2% or 1,026 individuals are in the labor force, with 9.6% or 98 of them unemployed. The age group with the highest labor force participation rate is 25 to 29 years, with 97.7% or 172 individuals in the labor force. Within the labor force, the 60 to 64 years age range has the highest percentage of unemployed individuals, with 25.0% or 8 of them being unemployed.
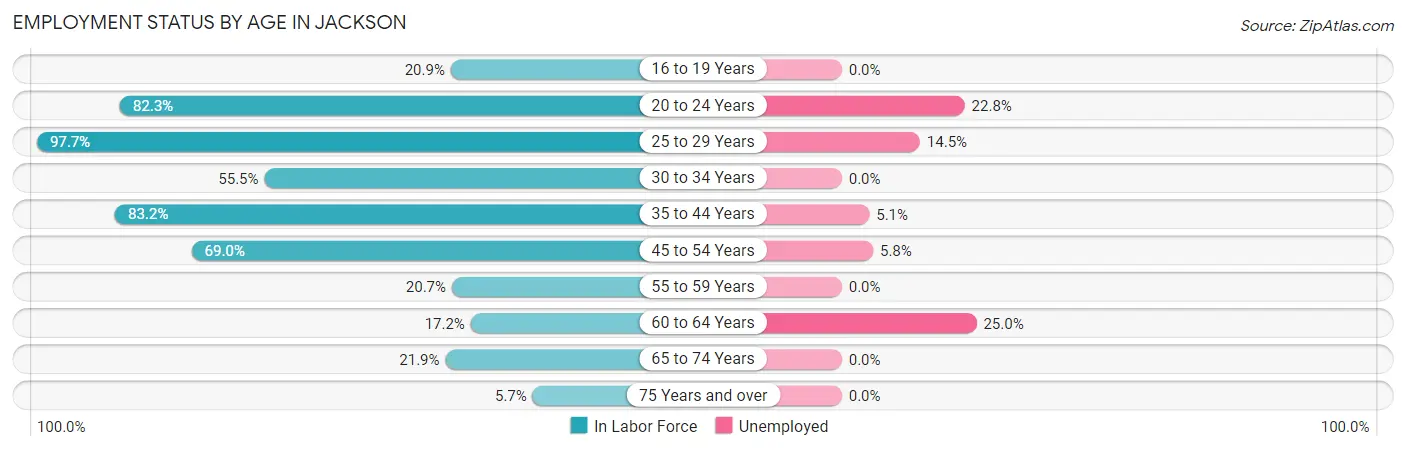
| Age Bracket | In Labor Force | Unemployed |
| 16 to 19 Years | 9 (20.9%) | 0 (0.0%) |
| 20 to 24 Years | 167 (82.3%) | 38 (22.8%) |
| 25 to 29 Years | 172 (97.7%) | 25 (14.5%) |
| 30 to 34 Years | 66 (55.5%) | 0 (0.0%) |
| 35 to 44 Years | 297 (83.2%) | 15 (5.1%) |
| 45 to 54 Years | 207 (69.0%) | 12 (5.8%) |
| 55 to 59 Years | 19 (20.7%) | 0 (0.0%) |
| 60 to 64 Years | 32 (17.2%) | 8 (25.0%) |
| 65 to 74 Years | 42 (21.9%) | 0 (0.0%) |
| 75 Years and over | 15 (5.7%) | 0 (0.0%) |
| Total | 1,026 (53.2%) | 98 (9.6%) |
Employment Status by Educational Attainment in Jackson
According to labor force statistics for Jackson, 64.5% of individuals (793) out of the total population between 25 and 64 years of age (1,230) are in the labor force, with 7.6% or 60 of them being unemployed. The group with the highest labor force participation rate are those with the educational attainment of bachelor's degree or higher, with 86.9% or 219 individuals in the labor force. Within the labor force, individuals with less than high school education have the highest percentage of unemployment, with 16.5% or 14 of them being unemployed.
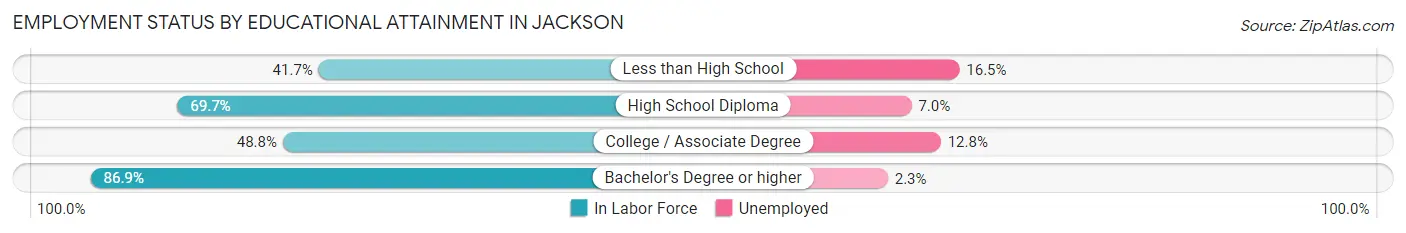
| Educational Attainment | In Labor Force | Unemployed |
| Less than High School | 85 (41.7%) | 34 (16.5%) |
| High School Diploma | 372 (69.7%) | 37 (7.0%) |
| College / Associate Degree | 117 (48.8%) | 31 (12.8%) |
| Bachelor's Degree or higher | 219 (86.9%) | 6 (2.3%) |
| Total | 793 (64.5%) | 93 (7.6%) |
Employment Occupations by Sex in Jackson
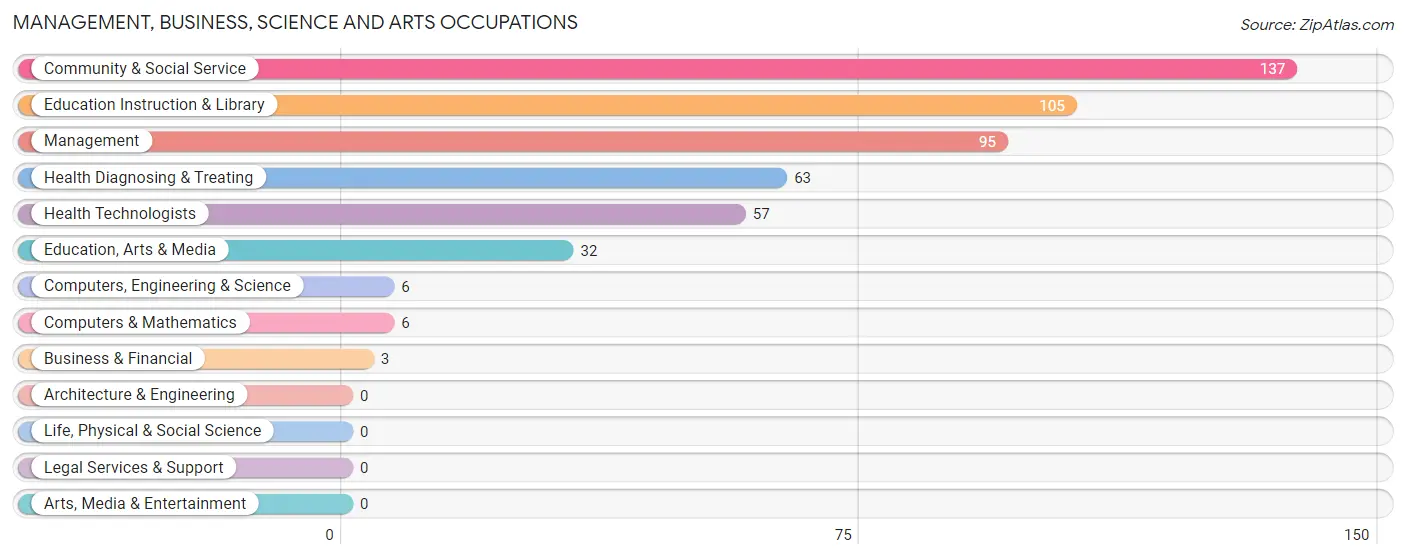
Management, Business, Science and Arts Occupations
The most common Management, Business, Science and Arts occupations in Jackson are Community & Social Service (137 | 14.8%), Education Instruction & Library (105 | 11.3%), Management (95 | 10.2%), Health Diagnosing & Treating (63 | 6.8%), and Health Technologists (57 | 6.1%).
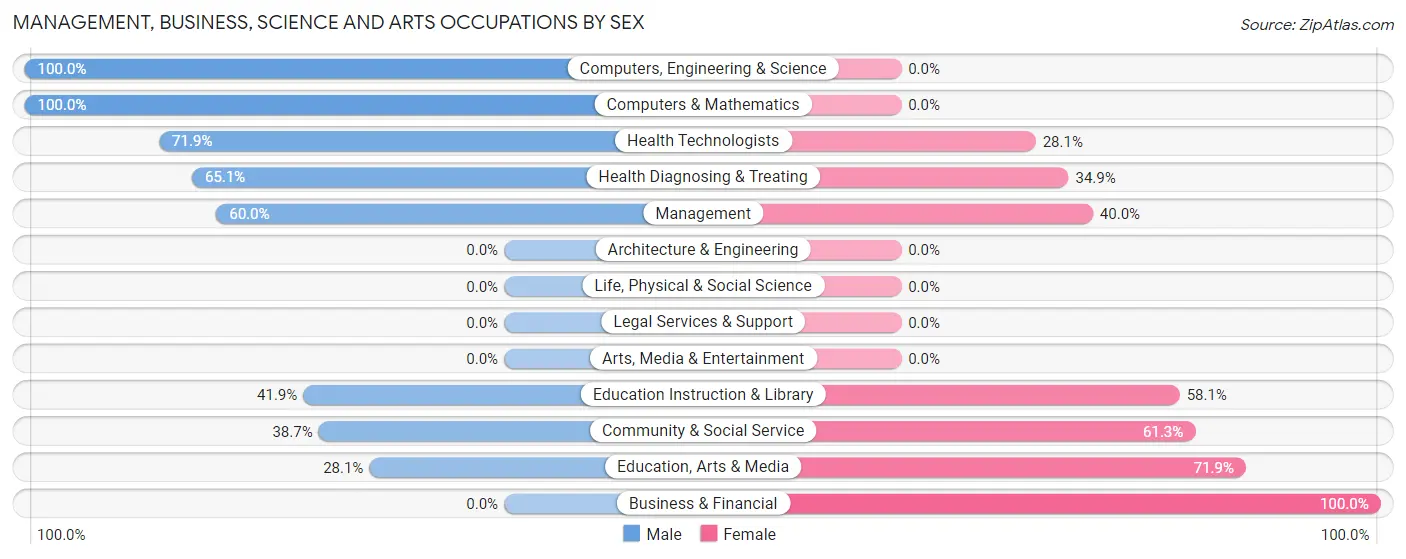
Management, Business, Science and Arts Occupations by Sex
Within the Management, Business, Science and Arts occupations in Jackson, the most male-oriented occupations are Computers, Engineering & Science (100.0%), Computers & Mathematics (100.0%), and Health Technologists (71.9%), while the most female-oriented occupations are Business & Financial (100.0%), Education, Arts & Media (71.9%), and Community & Social Service (61.3%).
| Occupation | Male | Female |
| Management | 57 (60.0%) | 38 (40.0%) |
| Business & Financial | 0 (0.0%) | 3 (100.0%) |
| Computers, Engineering & Science | 6 (100.0%) | 0 (0.0%) |
| Computers & Mathematics | 6 (100.0%) | 0 (0.0%) |
| Architecture & Engineering | 0 (0.0%) | 0 (0.0%) |
| Life, Physical & Social Science | 0 (0.0%) | 0 (0.0%) |
| Community & Social Service | 53 (38.7%) | 84 (61.3%) |
| Education, Arts & Media | 9 (28.1%) | 23 (71.9%) |
| Legal Services & Support | 0 (0.0%) | 0 (0.0%) |
| Education Instruction & Library | 44 (41.9%) | 61 (58.1%) |
| Arts, Media & Entertainment | 0 (0.0%) | 0 (0.0%) |
| Health Diagnosing & Treating | 41 (65.1%) | 22 (34.9%) |
| Health Technologists | 41 (71.9%) | 16 (28.1%) |
| Total (Category) | 157 (51.6%) | 147 (48.4%) |
| Total (Overall) | 434 (46.8%) | 494 (53.2%) |
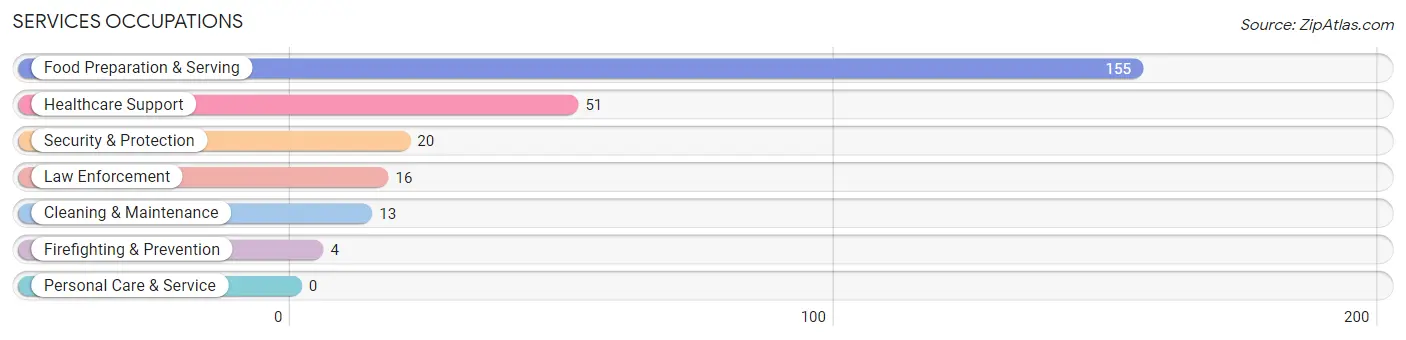
Services Occupations
The most common Services occupations in Jackson are Food Preparation & Serving (155 | 16.7%), Healthcare Support (51 | 5.5%), Security & Protection (20 | 2.2%), Law Enforcement (16 | 1.7%), and Cleaning & Maintenance (13 | 1.4%).
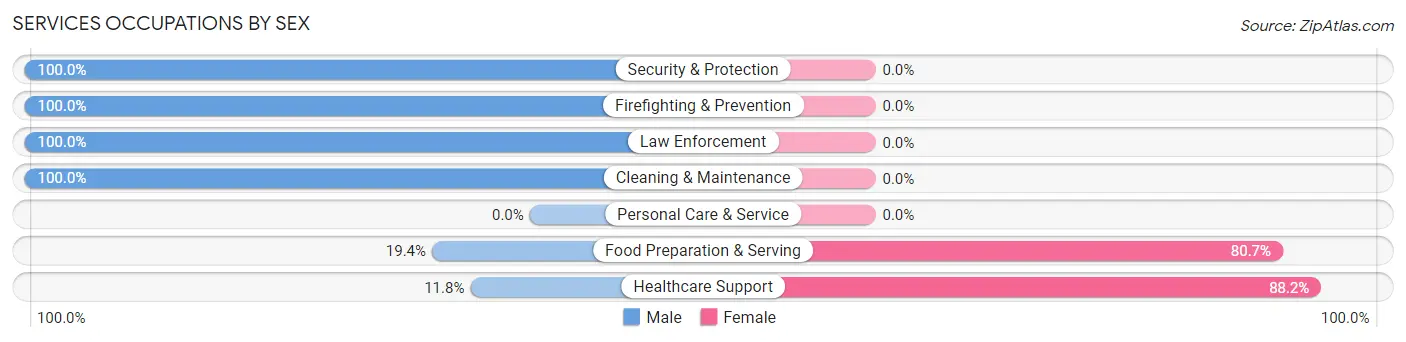
Services Occupations by Sex
Within the Services occupations in Jackson, the most male-oriented occupations are Security & Protection (100.0%), Firefighting & Prevention (100.0%), and Law Enforcement (100.0%), while the most female-oriented occupations are Healthcare Support (88.2%), and Food Preparation & Serving (80.6%).
| Occupation | Male | Female |
| Healthcare Support | 6 (11.8%) | 45 (88.2%) |
| Security & Protection | 20 (100.0%) | 0 (0.0%) |
| Firefighting & Prevention | 4 (100.0%) | 0 (0.0%) |
| Law Enforcement | 16 (100.0%) | 0 (0.0%) |
| Food Preparation & Serving | 30 (19.4%) | 125 (80.6%) |
| Cleaning & Maintenance | 13 (100.0%) | 0 (0.0%) |
| Personal Care & Service | 0 (0.0%) | 0 (0.0%) |
| Total (Category) | 69 (28.9%) | 170 (71.1%) |
| Total (Overall) | 434 (46.8%) | 494 (53.2%) |
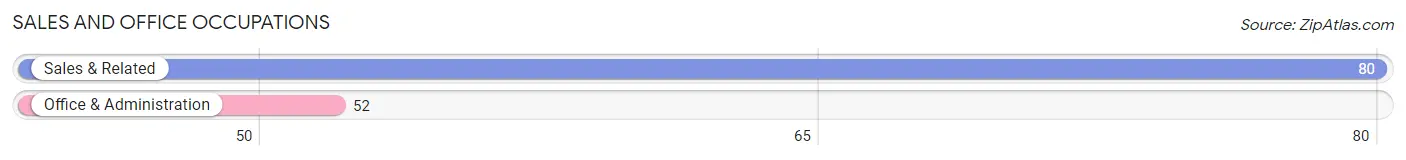
Sales and Office Occupations
The most common Sales and Office occupations in Jackson are Sales & Related (80 | 8.6%), and Office & Administration (52 | 5.6%).
Sales and Office Occupations by Sex
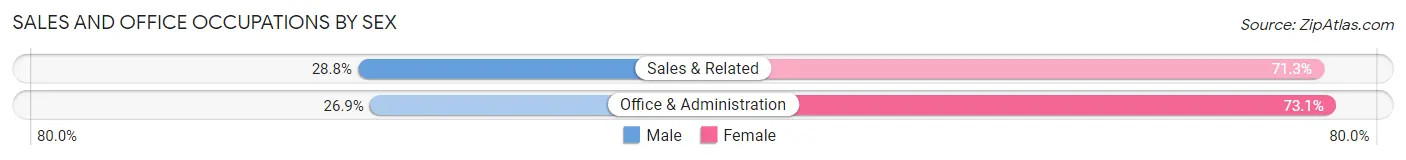
| Occupation | Male | Female |
| Sales & Related | 23 (28.7%) | 57 (71.3%) |
| Office & Administration | 14 (26.9%) | 38 (73.1%) |
| Total (Category) | 37 (28.0%) | 95 (72.0%) |
| Total (Overall) | 434 (46.8%) | 494 (53.2%) |
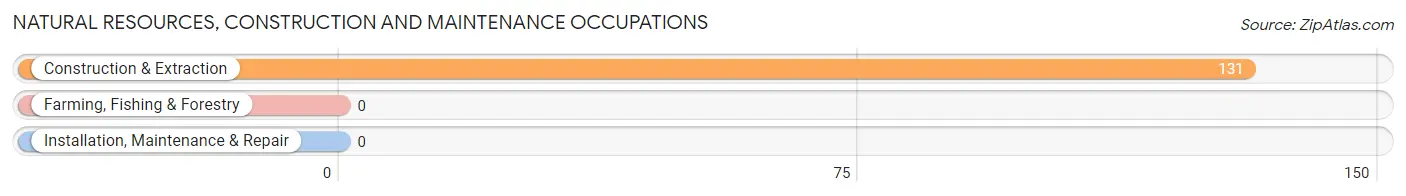
Natural Resources, Construction and Maintenance Occupations
The most common Natural Resources, Construction and Maintenance occupations in Jackson are , and Construction & Extraction (131 | 14.1%).
Natural Resources, Construction and Maintenance Occupations by Sex
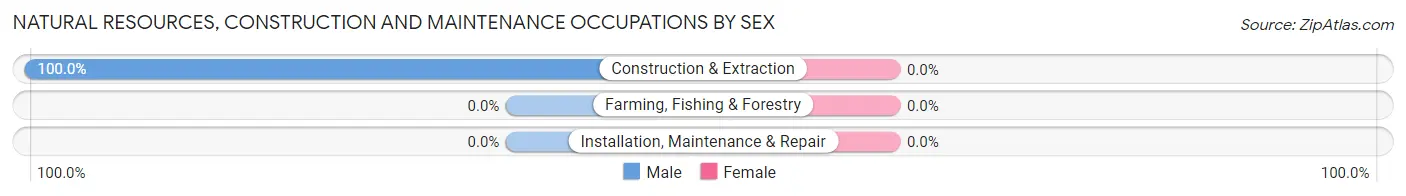
| Occupation | Male | Female |
| Farming, Fishing & Forestry | 0 (0.0%) | 0 (0.0%) |
| Construction & Extraction | 131 (100.0%) | 0 (0.0%) |
| Installation, Maintenance & Repair | 0 (0.0%) | 0 (0.0%) |
| Total (Category) | 131 (100.0%) | 0 (0.0%) |
| Total (Overall) | 434 (46.8%) | 494 (53.2%) |
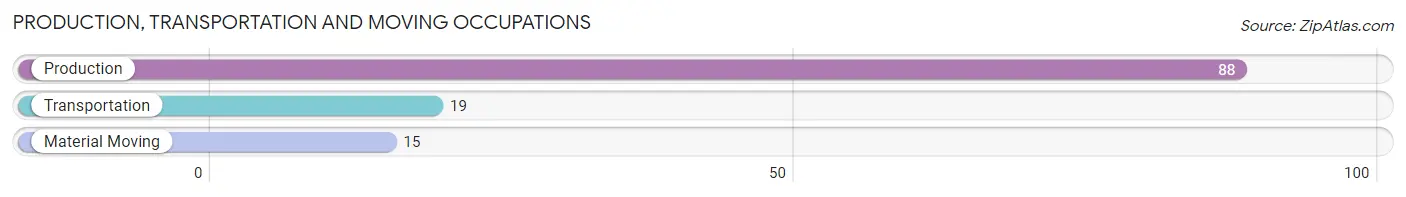
Production, Transportation and Moving Occupations
The most common Production, Transportation and Moving occupations in Jackson are Production (88 | 9.5%), Transportation (19 | 2.1%), and Material Moving (15 | 1.6%).
Production, Transportation and Moving Occupations by Sex
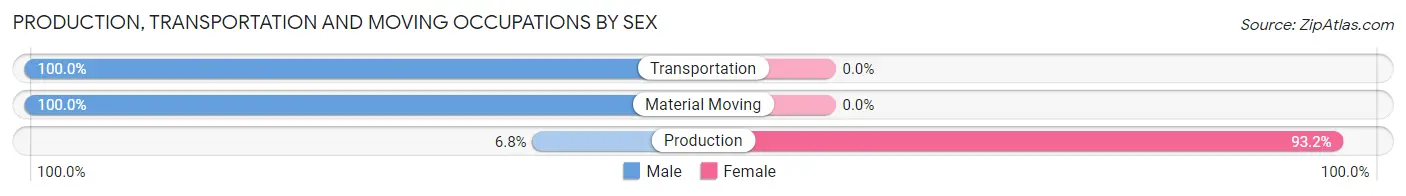
| Occupation | Male | Female |
| Production | 6 (6.8%) | 82 (93.2%) |
| Transportation | 19 (100.0%) | 0 (0.0%) |
| Material Moving | 15 (100.0%) | 0 (0.0%) |
| Total (Category) | 40 (32.8%) | 82 (67.2%) |
| Total (Overall) | 434 (46.8%) | 494 (53.2%) |
Employment Industries by Sex in Jackson
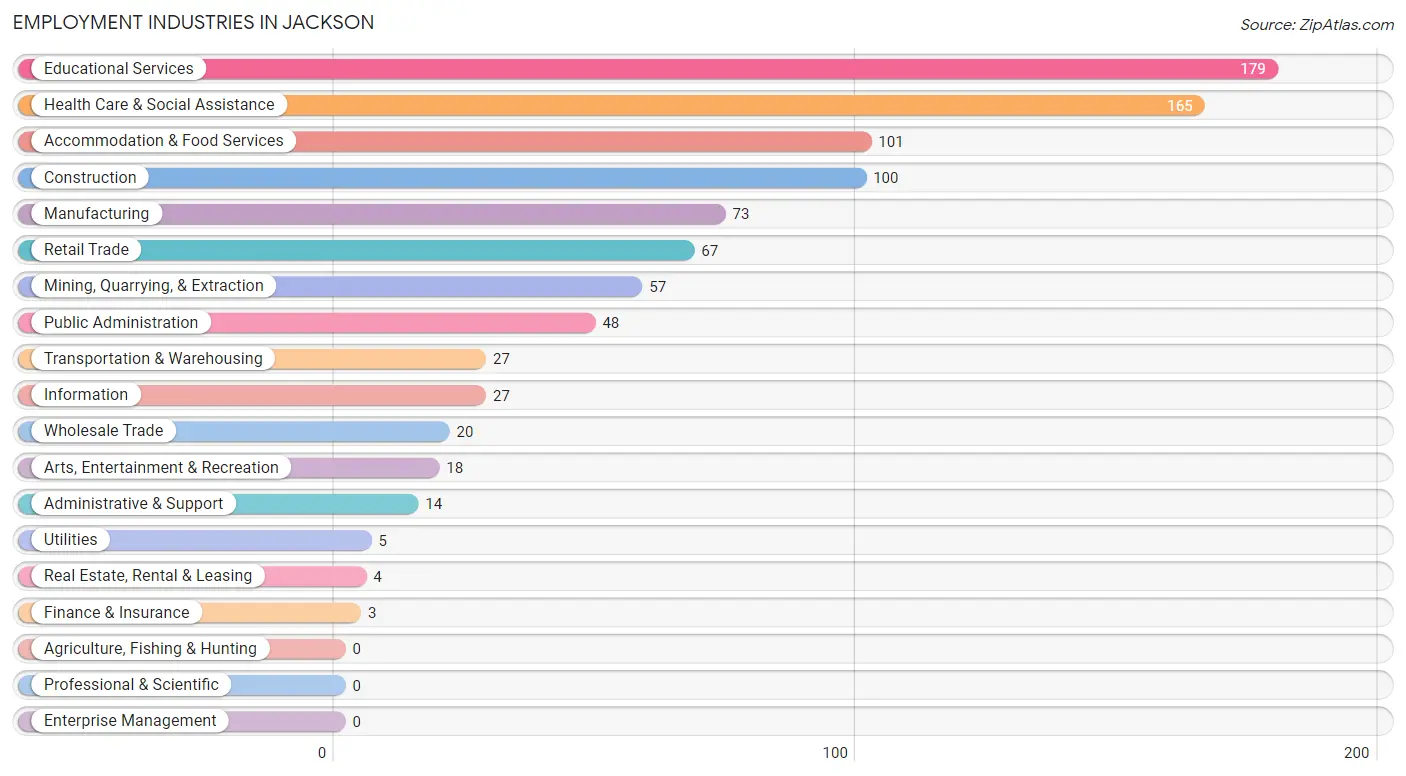
Employment Industries in Jackson
The major employment industries in Jackson include Educational Services (179 | 19.3%), Health Care & Social Assistance (165 | 17.8%), Accommodation & Food Services (101 | 10.9%), Construction (100 | 10.8%), and Manufacturing (73 | 7.9%).
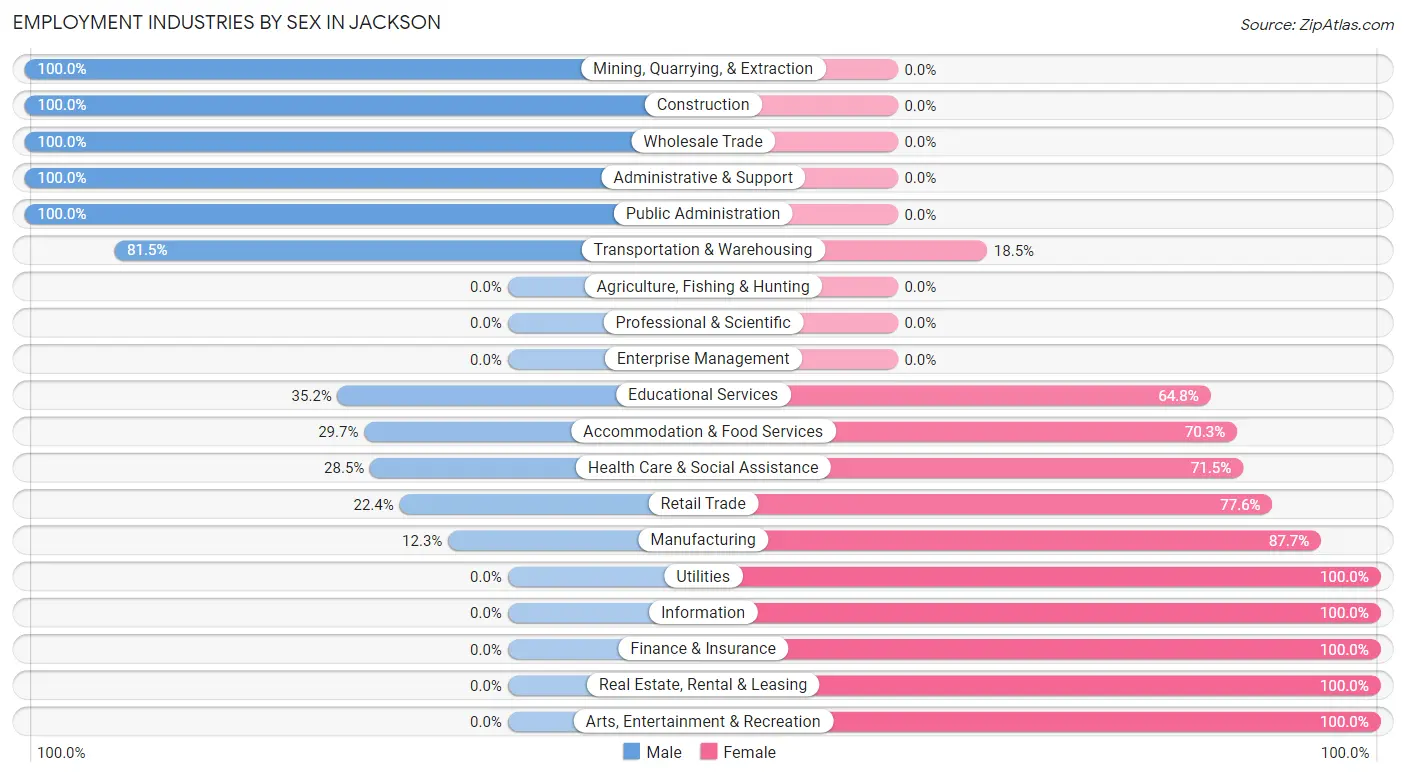
Employment Industries by Sex in Jackson
The Jackson industries that see more men than women are Mining, Quarrying, & Extraction (100.0%), Construction (100.0%), and Wholesale Trade (100.0%), whereas the industries that tend to have a higher number of women are Utilities (100.0%), Information (100.0%), and Finance & Insurance (100.0%).
| Industry | Male | Female |
| Agriculture, Fishing & Hunting | 0 (0.0%) | 0 (0.0%) |
| Mining, Quarrying, & Extraction | 57 (100.0%) | 0 (0.0%) |
| Construction | 100 (100.0%) | 0 (0.0%) |
| Manufacturing | 9 (12.3%) | 64 (87.7%) |
| Wholesale Trade | 20 (100.0%) | 0 (0.0%) |
| Retail Trade | 15 (22.4%) | 52 (77.6%) |
| Transportation & Warehousing | 22 (81.5%) | 5 (18.5%) |
| Utilities | 0 (0.0%) | 5 (100.0%) |
| Information | 0 (0.0%) | 27 (100.0%) |
| Finance & Insurance | 0 (0.0%) | 3 (100.0%) |
| Real Estate, Rental & Leasing | 0 (0.0%) | 4 (100.0%) |
| Professional & Scientific | 0 (0.0%) | 0 (0.0%) |
| Enterprise Management | 0 (0.0%) | 0 (0.0%) |
| Administrative & Support | 14 (100.0%) | 0 (0.0%) |
| Educational Services | 63 (35.2%) | 116 (64.8%) |
| Health Care & Social Assistance | 47 (28.5%) | 118 (71.5%) |
| Arts, Entertainment & Recreation | 0 (0.0%) | 18 (100.0%) |
| Accommodation & Food Services | 30 (29.7%) | 71 (70.3%) |
| Public Administration | 48 (100.0%) | 0 (0.0%) |
| Total | 434 (46.8%) | 494 (53.2%) |
Education in Jackson
School Enrollment in Jackson
The most common levels of schooling among the 351 students in Jackson are elementary school (79 | 22.5%), high school (70 | 19.9%), and kindergarten (69 | 19.7%).
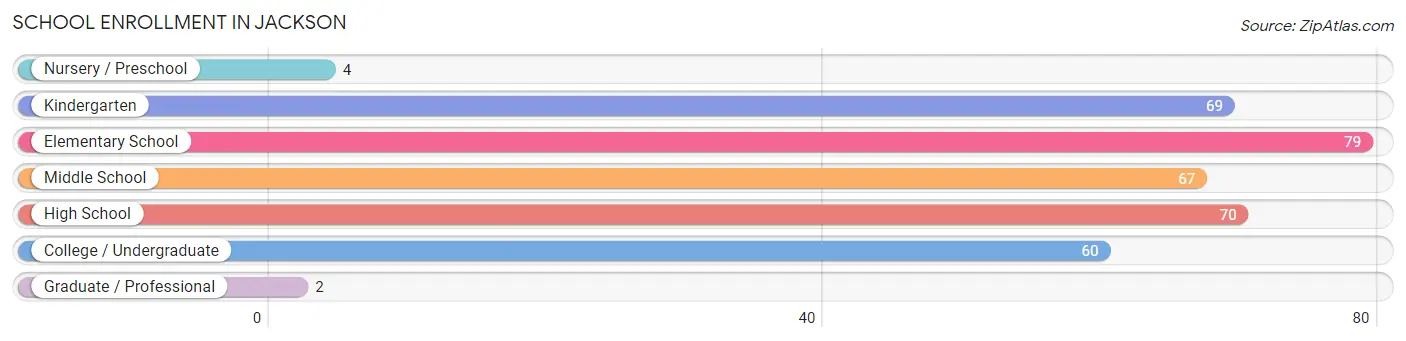
| School Level | # Students | % Students |
| Nursery / Preschool | 4 | 1.1% |
| Kindergarten | 69 | 19.7% |
| Elementary School | 79 | 22.5% |
| Middle School | 67 | 19.1% |
| High School | 70 | 19.9% |
| College / Undergraduate | 60 | 17.1% |
| Graduate / Professional | 2 | 0.6% |
| Total | 351 | 100.0% |
School Enrollment by Age by Funding Source in Jackson
Out of a total of 351 students who are enrolled in schools in Jackson, 50 (14.2%) attend a private institution, while the remaining 301 (85.8%) are enrolled in public schools. The age group of 5 to 9 year old has the highest likelihood of being enrolled in private schools, with 33 (26.2% in the age bracket) enrolled. Conversely, the age group of 3 to 4 year olds has the lowest likelihood of being enrolled in a private school, with 4 (100.0% in the age bracket) attending a public institution.
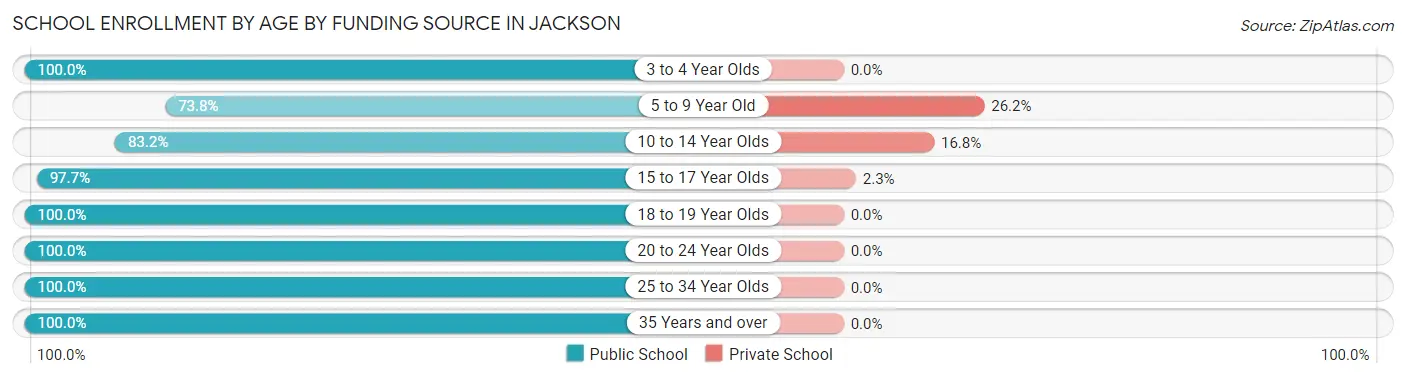
| Age Bracket | Public School | Private School |
| 3 to 4 Year Olds | 4 (100.0%) | 0 (0.0%) |
| 5 to 9 Year Old | 93 (73.8%) | 33 (26.2%) |
| 10 to 14 Year Olds | 79 (83.2%) | 16 (16.8%) |
| 15 to 17 Year Olds | 43 (97.7%) | 1 (2.3%) |
| 18 to 19 Year Olds | 8 (100.0%) | 0 (0.0%) |
| 20 to 24 Year Olds | 29 (100.0%) | 0 (0.0%) |
| 25 to 34 Year Olds | 18 (100.0%) | 0 (0.0%) |
| 35 Years and over | 27 (100.0%) | 0 (0.0%) |
| Total | 301 (85.8%) | 50 (14.2%) |
Educational Attainment by Field of Study in Jackson
Arts & humanities (104 | 30.7%), education (101 | 29.8%), communications (42 | 12.4%), science & technology (22 | 6.5%), and psychology (14 | 4.1%) are the most common fields of study among 339 individuals in Jackson who have obtained a bachelor's degree or higher.
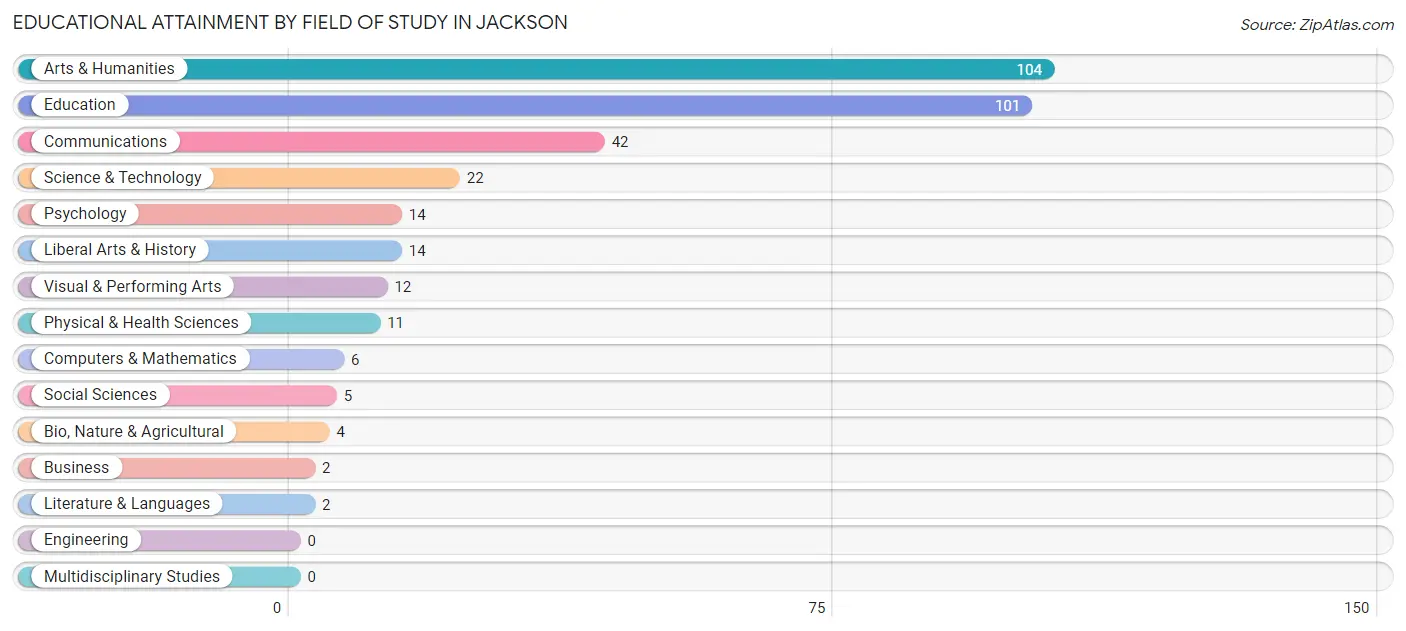
| Field of Study | # Graduates | % Graduates |
| Computers & Mathematics | 6 | 1.8% |
| Bio, Nature & Agricultural | 4 | 1.2% |
| Physical & Health Sciences | 11 | 3.2% |
| Psychology | 14 | 4.1% |
| Social Sciences | 5 | 1.5% |
| Engineering | 0 | 0.0% |
| Multidisciplinary Studies | 0 | 0.0% |
| Science & Technology | 22 | 6.5% |
| Business | 2 | 0.6% |
| Education | 101 | 29.8% |
| Literature & Languages | 2 | 0.6% |
| Liberal Arts & History | 14 | 4.1% |
| Visual & Performing Arts | 12 | 3.5% |
| Communications | 42 | 12.4% |
| Arts & Humanities | 104 | 30.7% |
| Total | 339 | 100.0% |
Transportation & Commute in Jackson
Vehicle Availability by Sex in Jackson
The most prevalent vehicle ownership categories in Jackson are males with 1 vehicle (156, accounting for 35.9%) and females with 1 vehicle (291, making up 31.6%).
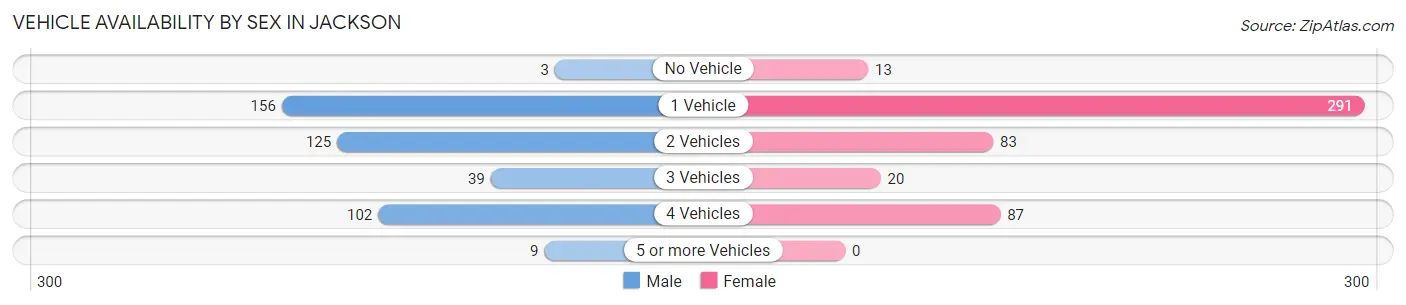
| Vehicles Available | Male | Female |
| No Vehicle | 3 (0.7%) | 13 (2.6%) |
| 1 Vehicle | 156 (35.9%) | 291 (58.9%) |
| 2 Vehicles | 125 (28.8%) | 83 (16.8%) |
| 3 Vehicles | 39 (9.0%) | 20 (4.1%) |
| 4 Vehicles | 102 (23.5%) | 87 (17.6%) |
| 5 or more Vehicles | 9 (2.1%) | 0 (0.0%) |
| Total | 434 (100.0%) | 494 (100.0%) |
Commute Time in Jackson
The most frequently occuring commute durations in Jackson are 5 to 9 minutes (294 commuters, 32.5%), 10 to 14 minutes (153 commuters, 16.9%), and less than 5 minutes (143 commuters, 15.8%).
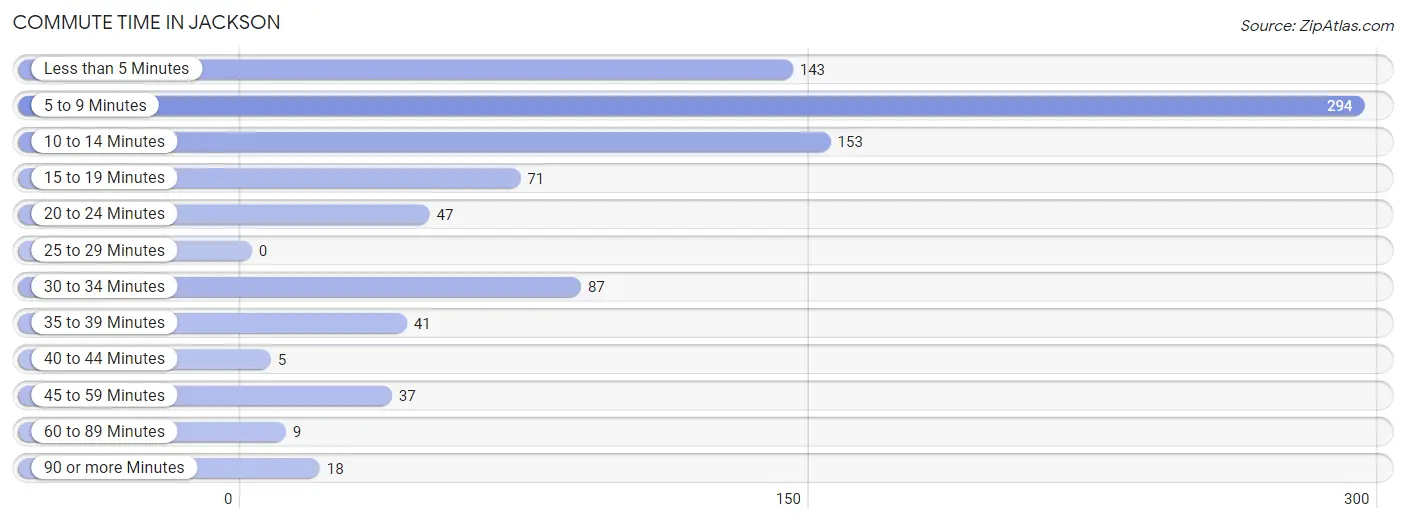
| Commute Time | # Commuters | % Commuters |
| Less than 5 Minutes | 143 | 15.8% |
| 5 to 9 Minutes | 294 | 32.5% |
| 10 to 14 Minutes | 153 | 16.9% |
| 15 to 19 Minutes | 71 | 7.9% |
| 20 to 24 Minutes | 47 | 5.2% |
| 25 to 29 Minutes | 0 | 0.0% |
| 30 to 34 Minutes | 87 | 9.6% |
| 35 to 39 Minutes | 41 | 4.5% |
| 40 to 44 Minutes | 5 | 0.5% |
| 45 to 59 Minutes | 37 | 4.1% |
| 60 to 89 Minutes | 9 | 1.0% |
| 90 or more Minutes | 18 | 2.0% |
Commute Time by Sex in Jackson
The most common commute times in Jackson are 5 to 9 minutes (128 commuters, 29.8%) for males and 5 to 9 minutes (166 commuters, 34.9%) for females.
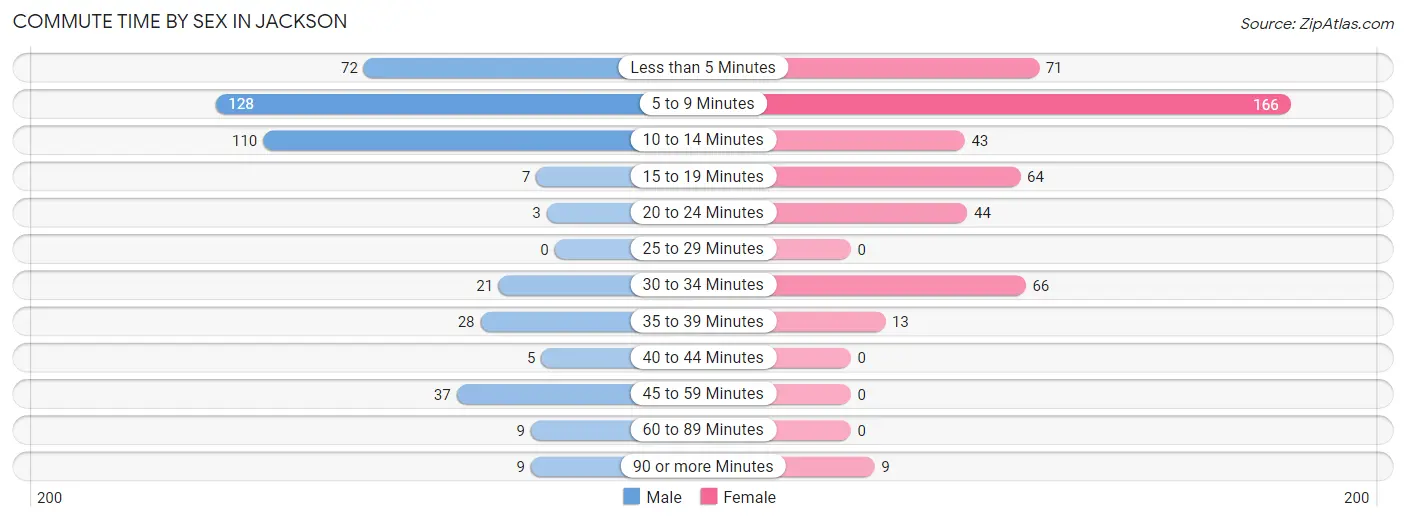
| Commute Time | Male | Female |
| Less than 5 Minutes | 72 (16.8%) | 71 (14.9%) |
| 5 to 9 Minutes | 128 (29.8%) | 166 (34.9%) |
| 10 to 14 Minutes | 110 (25.6%) | 43 (9.0%) |
| 15 to 19 Minutes | 7 (1.6%) | 64 (13.5%) |
| 20 to 24 Minutes | 3 (0.7%) | 44 (9.2%) |
| 25 to 29 Minutes | 0 (0.0%) | 0 (0.0%) |
| 30 to 34 Minutes | 21 (4.9%) | 66 (13.9%) |
| 35 to 39 Minutes | 28 (6.5%) | 13 (2.7%) |
| 40 to 44 Minutes | 5 (1.2%) | 0 (0.0%) |
| 45 to 59 Minutes | 37 (8.6%) | 0 (0.0%) |
| 60 to 89 Minutes | 9 (2.1%) | 0 (0.0%) |
| 90 or more Minutes | 9 (2.1%) | 9 (1.9%) |
Time of Departure to Work by Sex in Jackson
The most frequent times of departure to work in Jackson are 7:30 AM to 7:59 AM (95, 22.1%) for males and 7:30 AM to 7:59 AM (169, 35.5%) for females.
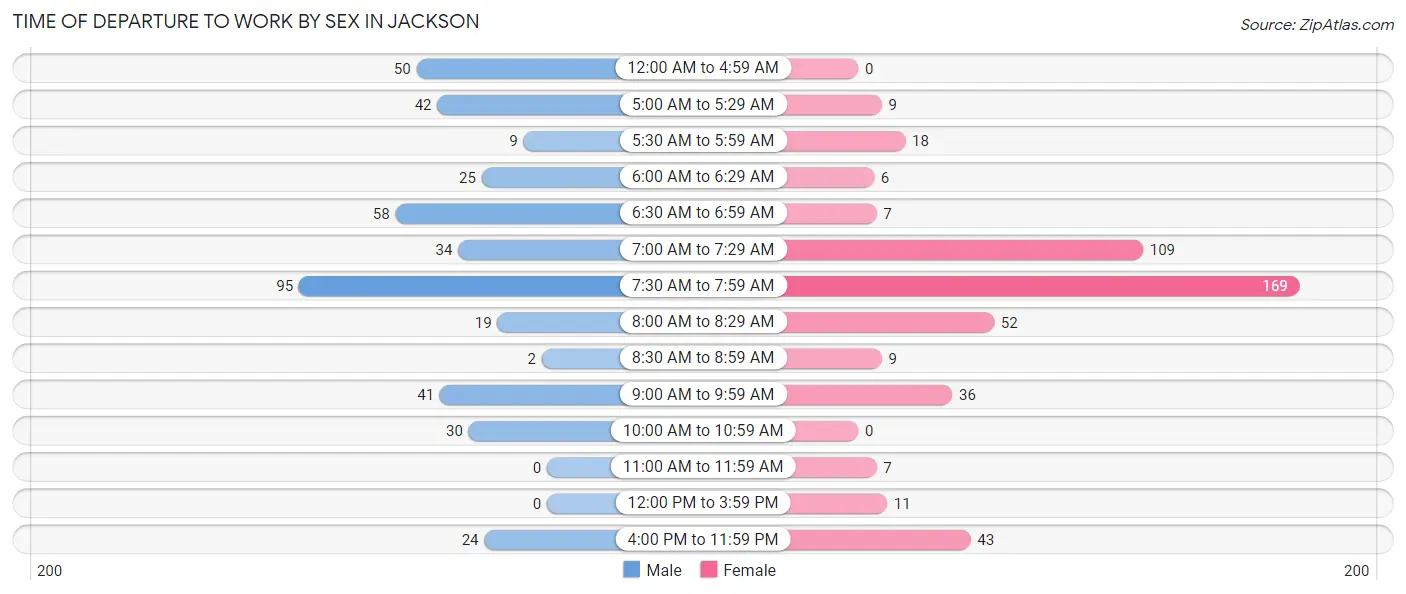
| Time of Departure | Male | Female |
| 12:00 AM to 4:59 AM | 50 (11.7%) | 0 (0.0%) |
| 5:00 AM to 5:29 AM | 42 (9.8%) | 9 (1.9%) |
| 5:30 AM to 5:59 AM | 9 (2.1%) | 18 (3.8%) |
| 6:00 AM to 6:29 AM | 25 (5.8%) | 6 (1.3%) |
| 6:30 AM to 6:59 AM | 58 (13.5%) | 7 (1.5%) |
| 7:00 AM to 7:29 AM | 34 (7.9%) | 109 (22.9%) |
| 7:30 AM to 7:59 AM | 95 (22.1%) | 169 (35.5%) |
| 8:00 AM to 8:29 AM | 19 (4.4%) | 52 (10.9%) |
| 8:30 AM to 8:59 AM | 2 (0.5%) | 9 (1.9%) |
| 9:00 AM to 9:59 AM | 41 (9.6%) | 36 (7.6%) |
| 10:00 AM to 10:59 AM | 30 (7.0%) | 0 (0.0%) |
| 11:00 AM to 11:59 AM | 0 (0.0%) | 7 (1.5%) |
| 12:00 PM to 3:59 PM | 0 (0.0%) | 11 (2.3%) |
| 4:00 PM to 11:59 PM | 24 (5.6%) | 43 (9.0%) |
| Total | 429 (100.0%) | 476 (100.0%) |
Housing Occupancy in Jackson
Occupancy by Ownership in Jackson
Of the total 1,094 dwellings in Jackson, owner-occupied units account for 632 (57.8%), while renter-occupied units make up 462 (42.2%).
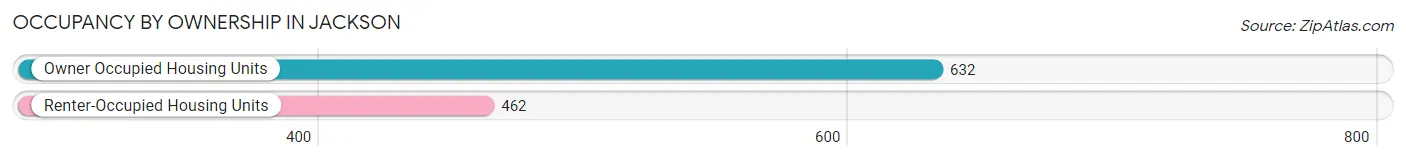
| Occupancy | # Housing Units | % Housing Units |
| Owner Occupied Housing Units | 632 | 57.8% |
| Renter-Occupied Housing Units | 462 | 42.2% |
| Total Occupied Housing Units | 1,094 | 100.0% |
Occupancy by Household Size in Jackson
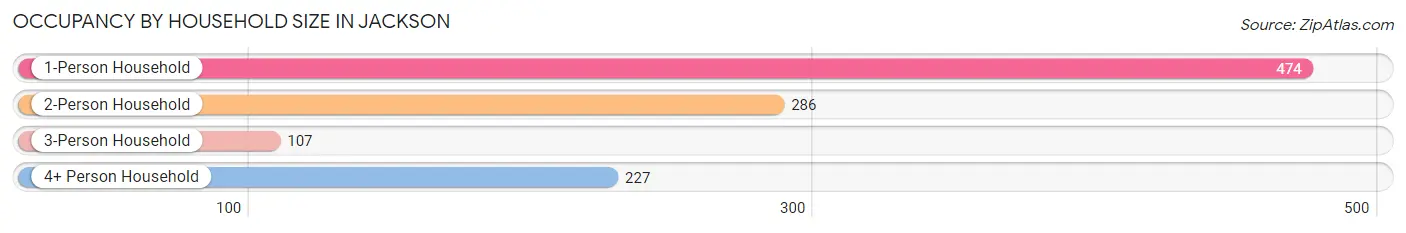
| Household Size | # Housing Units | % Housing Units |
| 1-Person Household | 474 | 43.3% |
| 2-Person Household | 286 | 26.1% |
| 3-Person Household | 107 | 9.8% |
| 4+ Person Household | 227 | 20.7% |
| Total Housing Units | 1,094 | 100.0% |
Occupancy by Ownership by Household Size in Jackson
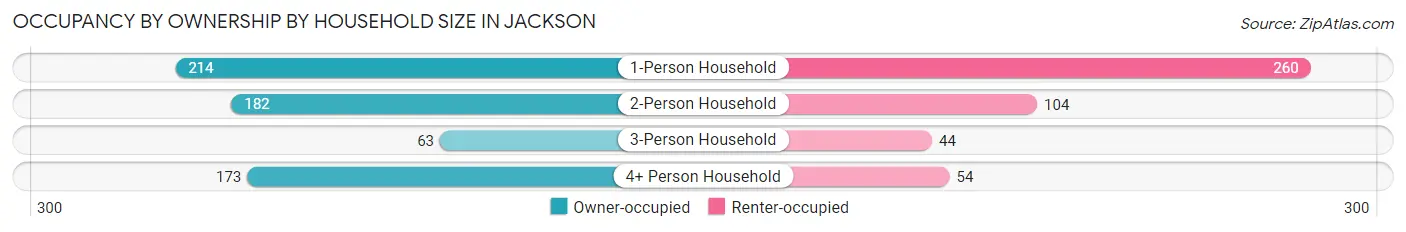
| Household Size | Owner-occupied | Renter-occupied |
| 1-Person Household | 214 (45.2%) | 260 (54.8%) |
| 2-Person Household | 182 (63.6%) | 104 (36.4%) |
| 3-Person Household | 63 (58.9%) | 44 (41.1%) |
| 4+ Person Household | 173 (76.2%) | 54 (23.8%) |
| Total Housing Units | 632 (57.8%) | 462 (42.2%) |
Occupancy by Educational Attainment in Jackson
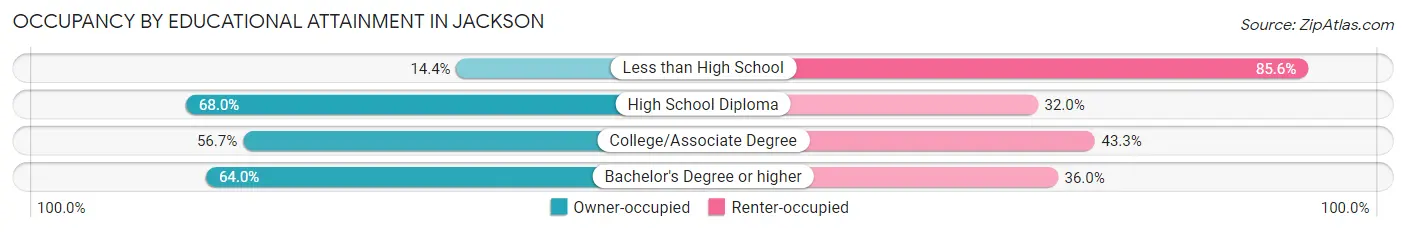
| Household Size | Owner-occupied | Renter-occupied |
| Less than High School | 22 (14.4%) | 131 (85.6%) |
| High School Diploma | 370 (68.0%) | 174 (32.0%) |
| College/Associate Degree | 110 (56.7%) | 84 (43.3%) |
| Bachelor's Degree or higher | 130 (64.0%) | 73 (36.0%) |
Occupancy by Age of Householder in Jackson
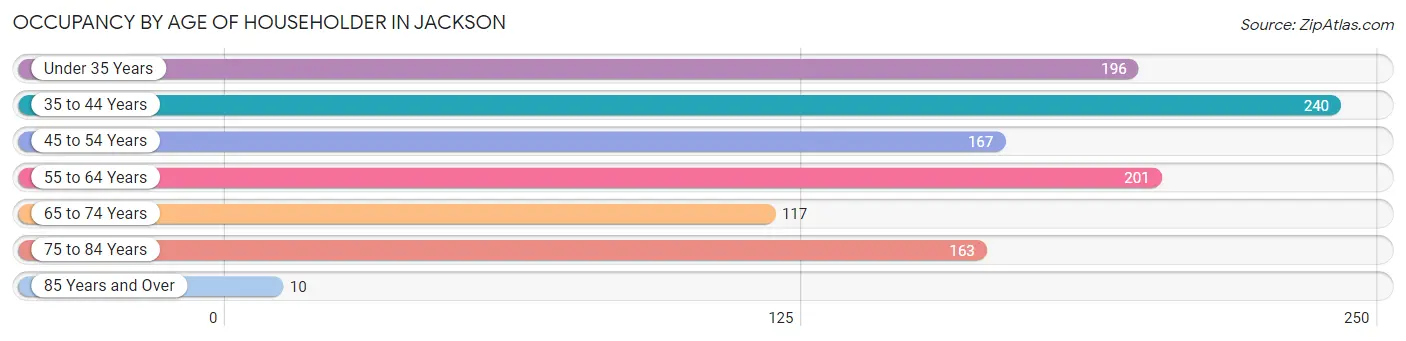
| Age Bracket | # Households | % Households |
| Under 35 Years | 196 | 17.9% |
| 35 to 44 Years | 240 | 21.9% |
| 45 to 54 Years | 167 | 15.3% |
| 55 to 64 Years | 201 | 18.4% |
| 65 to 74 Years | 117 | 10.7% |
| 75 to 84 Years | 163 | 14.9% |
| 85 Years and Over | 10 | 0.9% |
| Total | 1,094 | 100.0% |
Housing Finances in Jackson
Median Income by Occupancy in Jackson
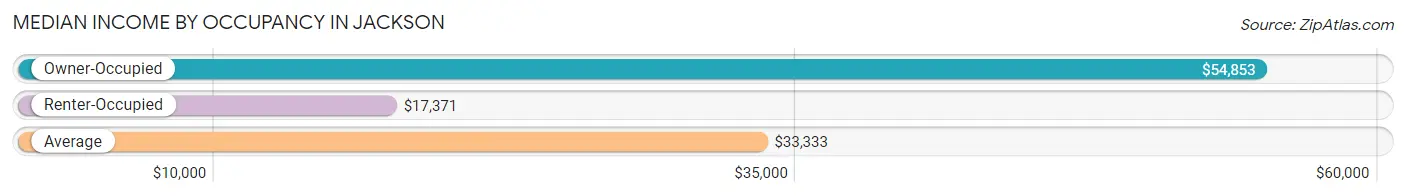
| Occupancy Type | # Households | Median Income |
| Owner-Occupied | 632 (57.8%) | $54,853 |
| Renter-Occupied | 462 (42.2%) | $17,371 |
| Average | 1,094 (100.0%) | $33,333 |
Occupancy by Householder Income Bracket in Jackson
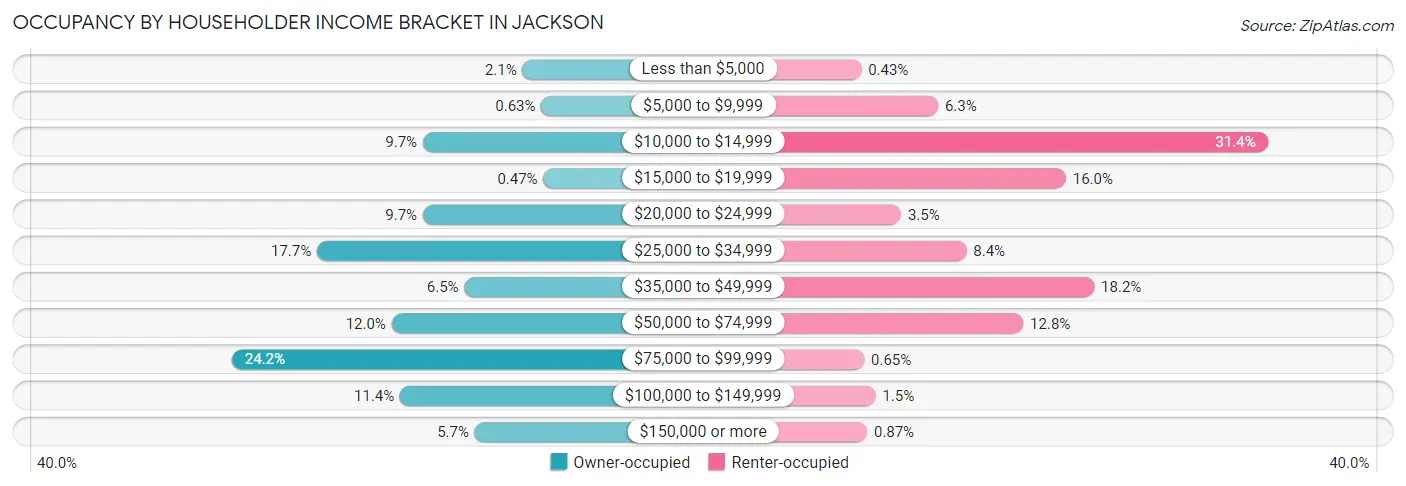
| Income Bracket | Owner-occupied | Renter-occupied |
| Less than $5,000 | 13 (2.1%) | 2 (0.4%) |
| $5,000 to $9,999 | 4 (0.6%) | 29 (6.3%) |
| $10,000 to $14,999 | 61 (9.7%) | 145 (31.4%) |
| $15,000 to $19,999 | 3 (0.5%) | 74 (16.0%) |
| $20,000 to $24,999 | 61 (9.7%) | 16 (3.5%) |
| $25,000 to $34,999 | 112 (17.7%) | 39 (8.4%) |
| $35,000 to $49,999 | 41 (6.5%) | 84 (18.2%) |
| $50,000 to $74,999 | 76 (12.0%) | 59 (12.8%) |
| $75,000 to $99,999 | 153 (24.2%) | 3 (0.6%) |
| $100,000 to $149,999 | 72 (11.4%) | 7 (1.5%) |
| $150,000 or more | 36 (5.7%) | 4 (0.9%) |
| Total | 632 (100.0%) | 462 (100.0%) |
Monthly Housing Cost Tiers in Jackson
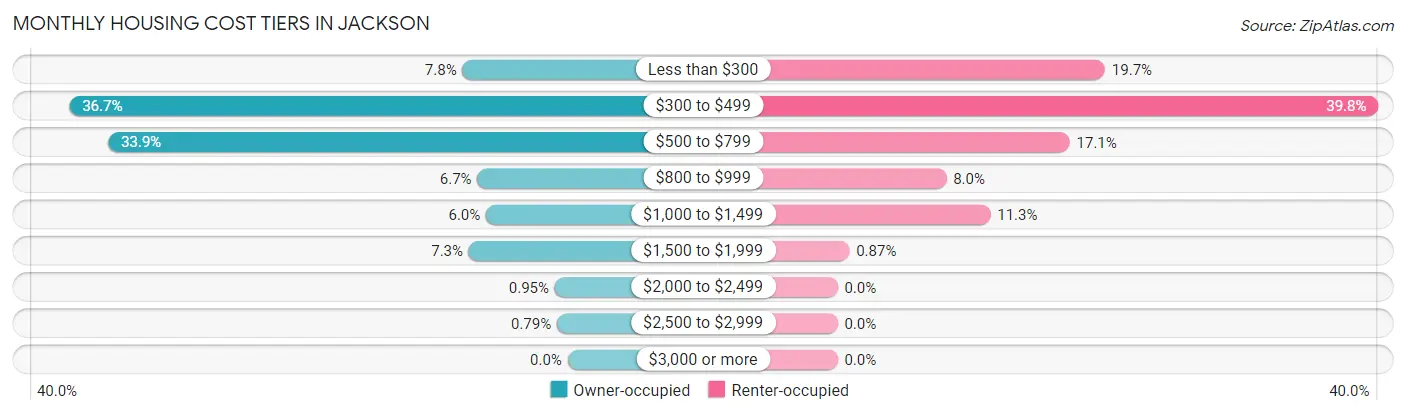
| Monthly Cost | Owner-occupied | Renter-occupied |
| Less than $300 | 49 (7.7%) | 91 (19.7%) |
| $300 to $499 | 232 (36.7%) | 184 (39.8%) |
| $500 to $799 | 214 (33.9%) | 79 (17.1%) |
| $800 to $999 | 42 (6.7%) | 37 (8.0%) |
| $1,000 to $1,499 | 38 (6.0%) | 52 (11.3%) |
| $1,500 to $1,999 | 46 (7.3%) | 4 (0.9%) |
| $2,000 to $2,499 | 6 (0.9%) | 0 (0.0%) |
| $2,500 to $2,999 | 5 (0.8%) | 0 (0.0%) |
| $3,000 or more | 0 (0.0%) | 0 (0.0%) |
| Total | 632 (100.0%) | 462 (100.0%) |
Physical Housing Characteristics in Jackson
Housing Structures in Jackson
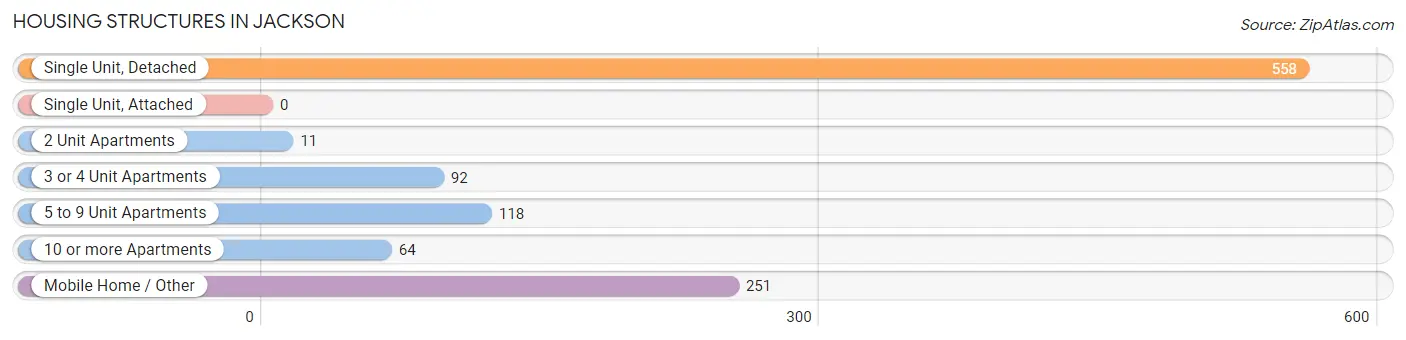
| Structure Type | # Housing Units | % Housing Units |
| Single Unit, Detached | 558 | 51.0% |
| Single Unit, Attached | 0 | 0.0% |
| 2 Unit Apartments | 11 | 1.0% |
| 3 or 4 Unit Apartments | 92 | 8.4% |
| 5 to 9 Unit Apartments | 118 | 10.8% |
| 10 or more Apartments | 64 | 5.9% |
| Mobile Home / Other | 251 | 22.9% |
| Total | 1,094 | 100.0% |
Housing Structures by Occupancy in Jackson
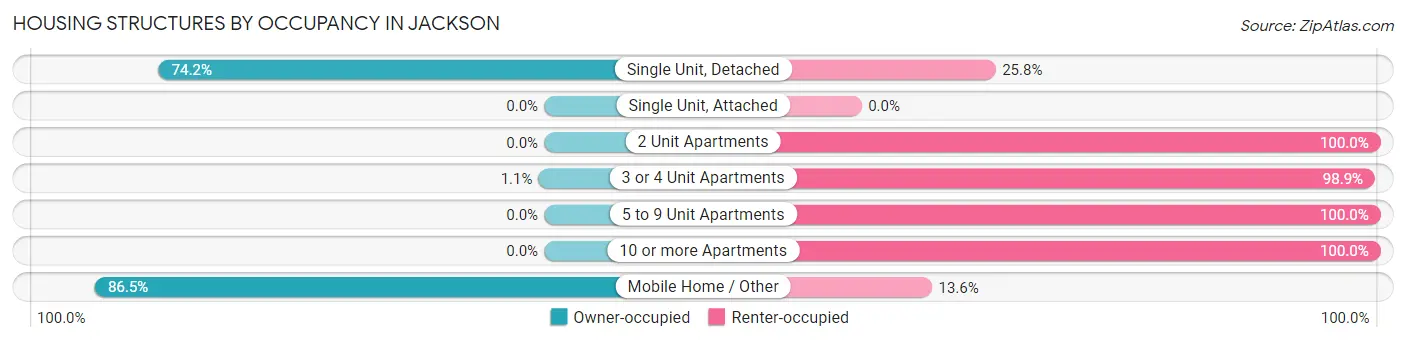
| Structure Type | Owner-occupied | Renter-occupied |
| Single Unit, Detached | 414 (74.2%) | 144 (25.8%) |
| Single Unit, Attached | 0 (0.0%) | 0 (0.0%) |
| 2 Unit Apartments | 0 (0.0%) | 11 (100.0%) |
| 3 or 4 Unit Apartments | 1 (1.1%) | 91 (98.9%) |
| 5 to 9 Unit Apartments | 0 (0.0%) | 118 (100.0%) |
| 10 or more Apartments | 0 (0.0%) | 64 (100.0%) |
| Mobile Home / Other | 217 (86.5%) | 34 (13.6%) |
| Total | 632 (57.8%) | 462 (42.2%) |
Housing Structures by Number of Rooms in Jackson
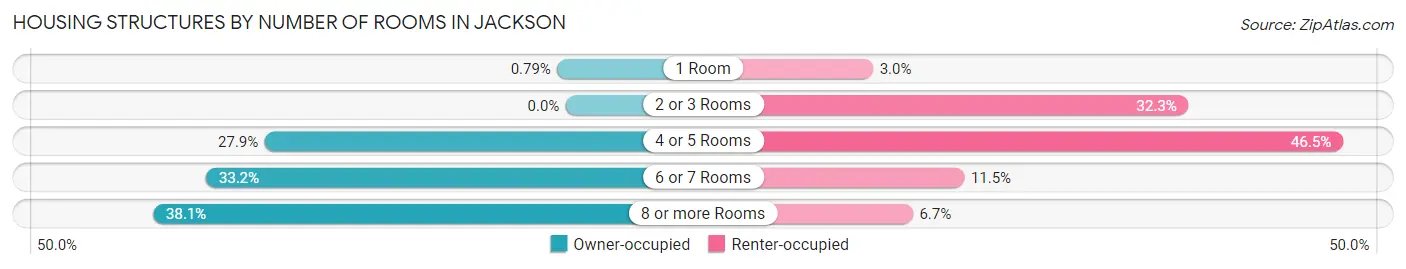
| Number of Rooms | Owner-occupied | Renter-occupied |
| 1 Room | 5 (0.8%) | 14 (3.0%) |
| 2 or 3 Rooms | 0 (0.0%) | 149 (32.3%) |
| 4 or 5 Rooms | 176 (27.9%) | 215 (46.5%) |
| 6 or 7 Rooms | 210 (33.2%) | 53 (11.5%) |
| 8 or more Rooms | 241 (38.1%) | 31 (6.7%) |
| Total | 632 (100.0%) | 462 (100.0%) |
Housing Structure by Heating Type in Jackson
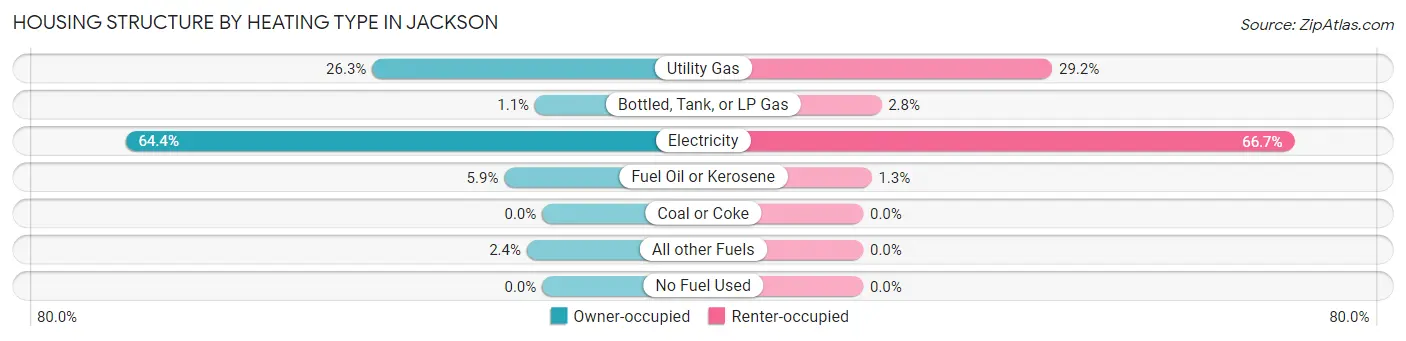
| Heating Type | Owner-occupied | Renter-occupied |
| Utility Gas | 166 (26.3%) | 135 (29.2%) |
| Bottled, Tank, or LP Gas | 7 (1.1%) | 13 (2.8%) |
| Electricity | 407 (64.4%) | 308 (66.7%) |
| Fuel Oil or Kerosene | 37 (5.9%) | 6 (1.3%) |
| Coal or Coke | 0 (0.0%) | 0 (0.0%) |
| All other Fuels | 15 (2.4%) | 0 (0.0%) |
| No Fuel Used | 0 (0.0%) | 0 (0.0%) |
| Total | 632 (100.0%) | 462 (100.0%) |
Household Vehicle Usage in Jackson
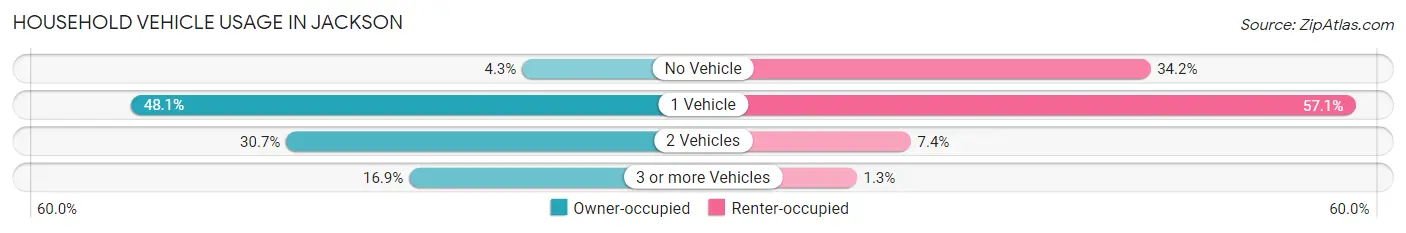
| Vehicles per Household | Owner-occupied | Renter-occupied |
| No Vehicle | 27 (4.3%) | 158 (34.2%) |
| 1 Vehicle | 304 (48.1%) | 264 (57.1%) |
| 2 Vehicles | 194 (30.7%) | 34 (7.4%) |
| 3 or more Vehicles | 107 (16.9%) | 6 (1.3%) |
| Total | 632 (100.0%) | 462 (100.0%) |
Real Estate & Mortgages in Jackson
Real Estate and Mortgage Overview in Jackson
| Characteristic | Without Mortgage | With Mortgage |
| Housing Units | 423 | 209 |
| Median Property Value | $62,600 | $118,600 |
| Median Household Income | $34,609 | $30 |
| Monthly Housing Costs | $409 | $0 |
| Real Estate Taxes | $1,028 | $19 |
Property Value by Mortgage Status in Jackson
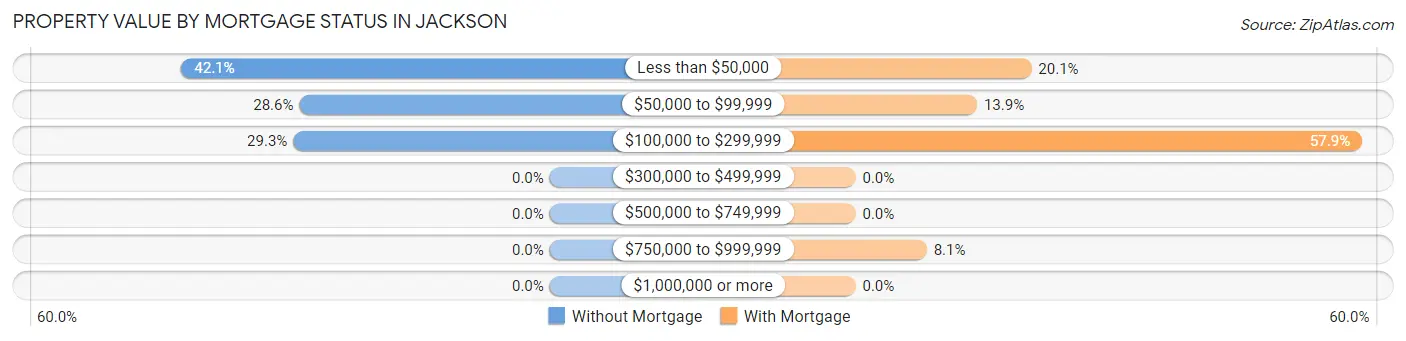
| Property Value | Without Mortgage | With Mortgage |
| Less than $50,000 | 178 (42.1%) | 42 (20.1%) |
| $50,000 to $99,999 | 121 (28.6%) | 29 (13.9%) |
| $100,000 to $299,999 | 124 (29.3%) | 121 (57.9%) |
| $300,000 to $499,999 | 0 (0.0%) | 0 (0.0%) |
| $500,000 to $749,999 | 0 (0.0%) | 0 (0.0%) |
| $750,000 to $999,999 | 0 (0.0%) | 17 (8.1%) |
| $1,000,000 or more | 0 (0.0%) | 0 (0.0%) |
| Total | 423 (100.0%) | 209 (100.0%) |
Household Income by Mortgage Status in Jackson
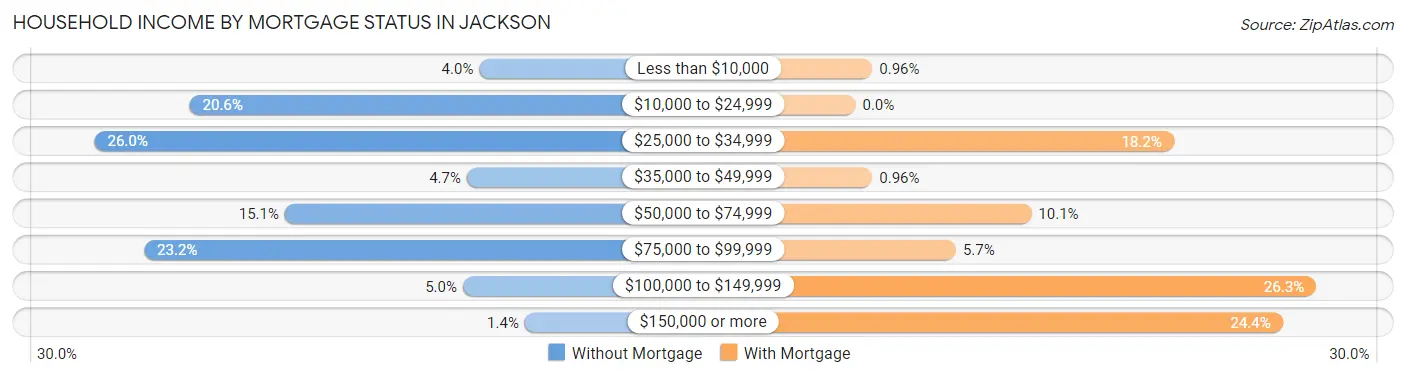
| Household Income | Without Mortgage | With Mortgage |
| Less than $10,000 | 17 (4.0%) | 2 (1.0%) |
| $10,000 to $24,999 | 87 (20.6%) | 0 (0.0%) |
| $25,000 to $34,999 | 110 (26.0%) | 38 (18.2%) |
| $35,000 to $49,999 | 20 (4.7%) | 2 (1.0%) |
| $50,000 to $74,999 | 64 (15.1%) | 21 (10.1%) |
| $75,000 to $99,999 | 98 (23.2%) | 12 (5.7%) |
| $100,000 to $149,999 | 21 (5.0%) | 55 (26.3%) |
| $150,000 or more | 6 (1.4%) | 51 (24.4%) |
| Total | 423 (100.0%) | 209 (100.0%) |
Property Value to Household Income Ratio in Jackson
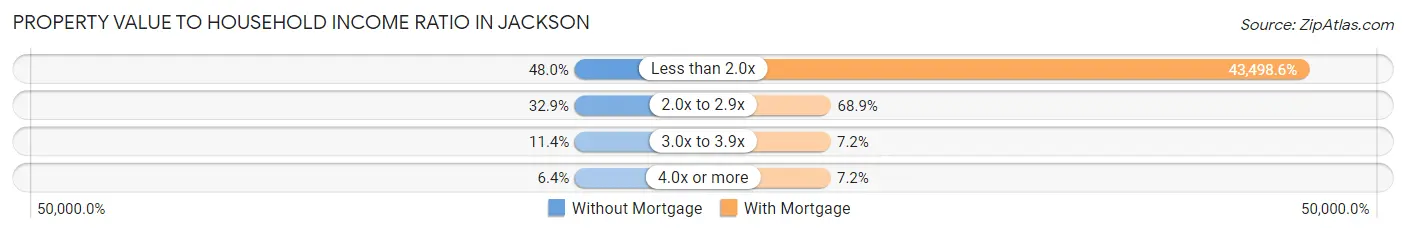
| Value-to-Income Ratio | Without Mortgage | With Mortgage |
| Less than 2.0x | 203 (48.0%) | 90,912 (43,498.6%) |
| 2.0x to 2.9x | 139 (32.9%) | 144 (68.9%) |
| 3.0x to 3.9x | 48 (11.4%) | 15 (7.2%) |
| 4.0x or more | 27 (6.4%) | 15 (7.2%) |
| Total | 423 (100.0%) | 209 (100.0%) |
Real Estate Taxes by Mortgage Status in Jackson
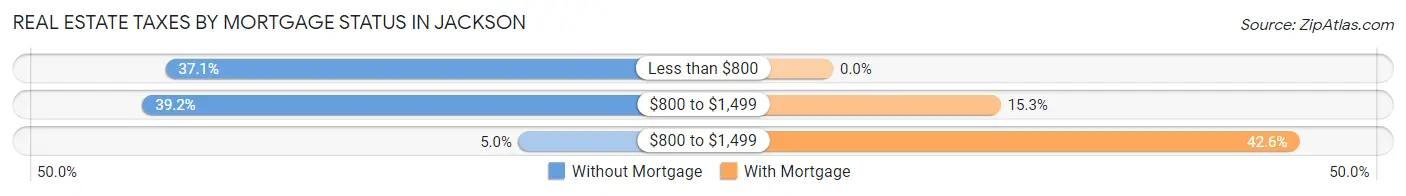
| Property Taxes | Without Mortgage | With Mortgage |
| Less than $800 | 157 (37.1%) | 0 (0.0%) |
| $800 to $1,499 | 166 (39.2%) | 32 (15.3%) |
| $800 to $1,499 | 21 (5.0%) | 89 (42.6%) |
| Total | 423 (100.0%) | 209 (100.0%) |
Health & Disability in Jackson
Health Insurance Coverage by Age in Jackson
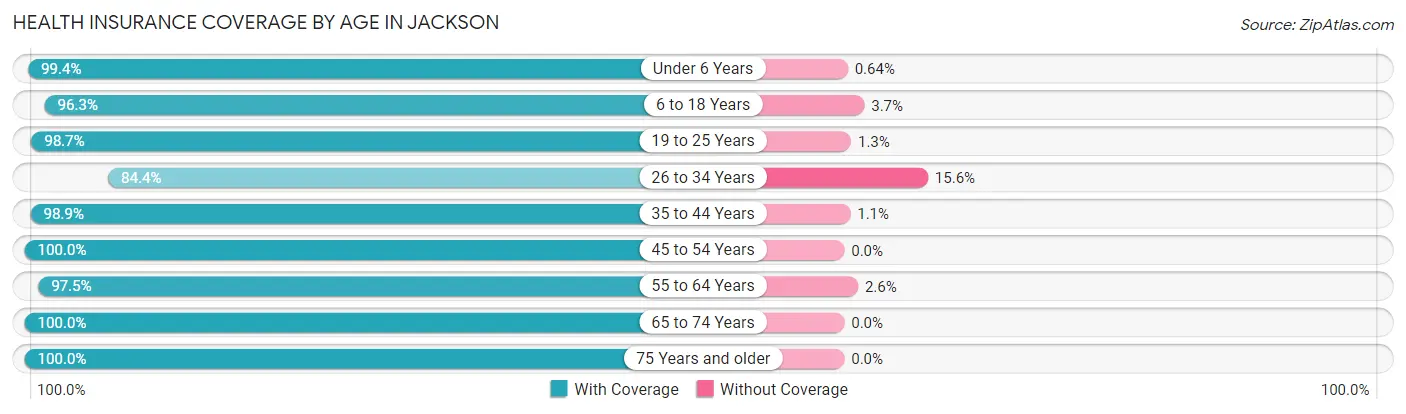
| Age Bracket | With Coverage | Without Coverage |
| Under 6 Years | 155 (99.4%) | 1 (0.6%) |
| 6 to 18 Years | 232 (96.3%) | 9 (3.7%) |
| 19 to 25 Years | 235 (98.7%) | 3 (1.3%) |
| 26 to 34 Years | 222 (84.4%) | 41 (15.6%) |
| 35 to 44 Years | 353 (98.9%) | 4 (1.1%) |
| 45 to 54 Years | 300 (100.0%) | 0 (0.0%) |
| 55 to 64 Years | 267 (97.5%) | 7 (2.5%) |
| 65 to 74 Years | 169 (100.0%) | 0 (0.0%) |
| 75 Years and older | 213 (100.0%) | 0 (0.0%) |
| Total | 2,146 (97.1%) | 65 (2.9%) |
Health Insurance Coverage by Citizenship Status in Jackson
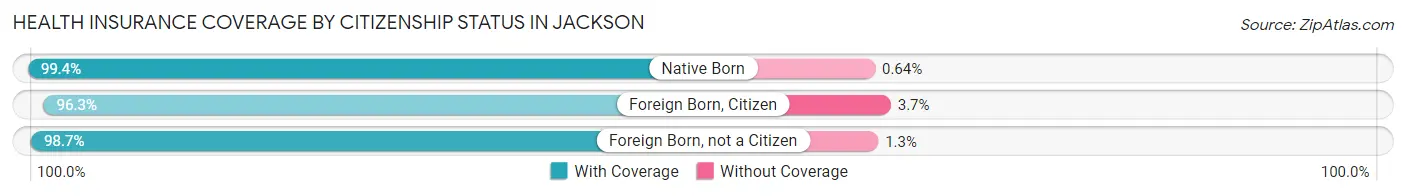
| Citizenship Status | With Coverage | Without Coverage |
| Native Born | 155 (99.4%) | 1 (0.6%) |
| Foreign Born, Citizen | 232 (96.3%) | 9 (3.7%) |
| Foreign Born, not a Citizen | 235 (98.7%) | 3 (1.3%) |
Health Insurance Coverage by Household Income in Jackson
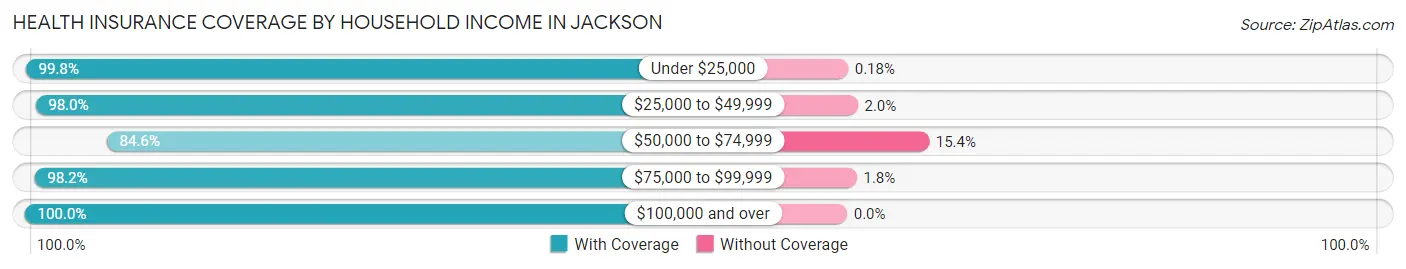
| Household Income | With Coverage | Without Coverage |
| Under $25,000 | 557 (99.8%) | 1 (0.2%) |
| $25,000 to $49,999 | 584 (98.0%) | 12 (2.0%) |
| $50,000 to $74,999 | 248 (84.6%) | 45 (15.4%) |
| $75,000 to $99,999 | 377 (98.2%) | 7 (1.8%) |
| $100,000 and over | 380 (100.0%) | 0 (0.0%) |
Public vs Private Health Insurance Coverage by Age in Jackson
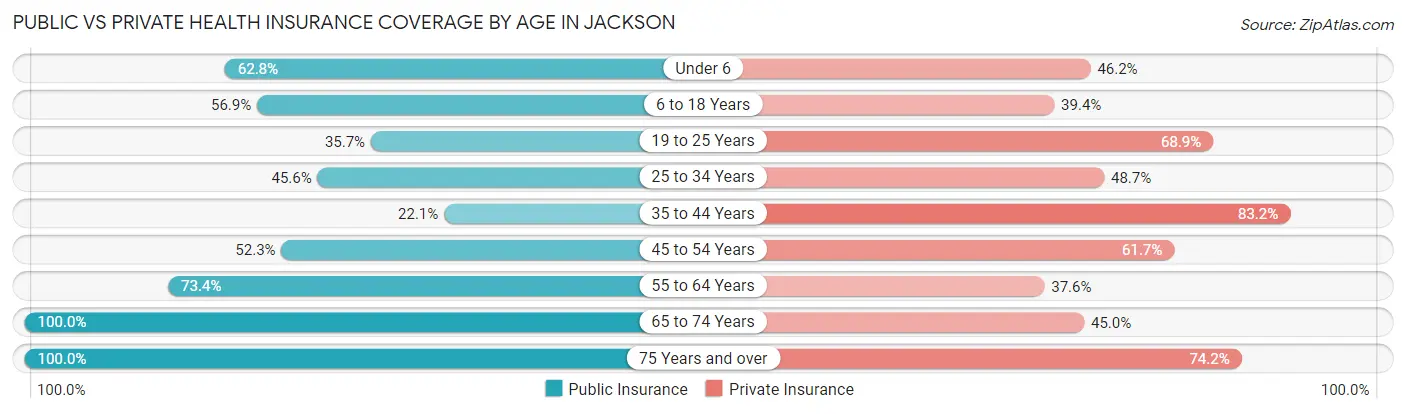
| Age Bracket | Public Insurance | Private Insurance |
| Under 6 | 98 (62.8%) | 72 (46.2%) |
| 6 to 18 Years | 137 (56.9%) | 95 (39.4%) |
| 19 to 25 Years | 85 (35.7%) | 164 (68.9%) |
| 25 to 34 Years | 120 (45.6%) | 128 (48.7%) |
| 35 to 44 Years | 79 (22.1%) | 297 (83.2%) |
| 45 to 54 Years | 157 (52.3%) | 185 (61.7%) |
| 55 to 64 Years | 201 (73.4%) | 103 (37.6%) |
| 65 to 74 Years | 169 (100.0%) | 76 (45.0%) |
| 75 Years and over | 213 (100.0%) | 158 (74.2%) |
| Total | 1,259 (56.9%) | 1,278 (57.8%) |
Disability Status by Sex by Age in Jackson
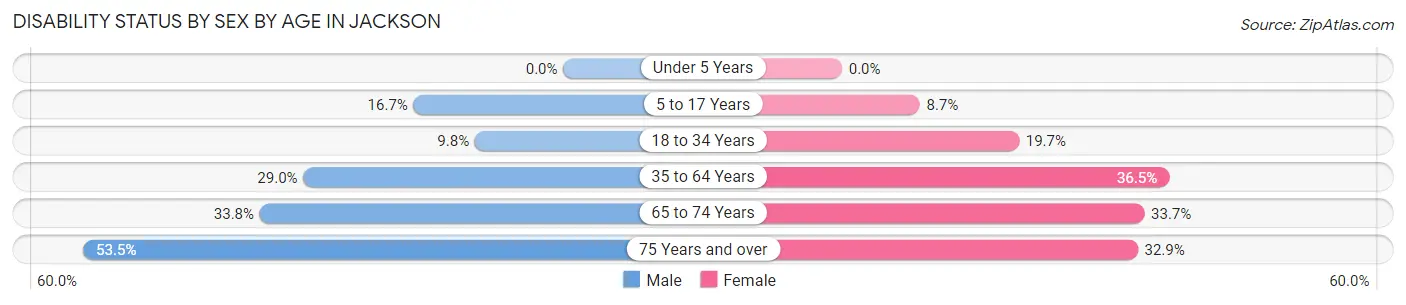
| Age Bracket | Male | Female |
| Under 5 Years | 0 (0.0%) | 0 (0.0%) |
| 5 to 17 Years | 23 (16.7%) | 11 (8.7%) |
| 18 to 34 Years | 24 (9.8%) | 54 (19.7%) |
| 35 to 64 Years | 121 (28.9%) | 187 (36.4%) |
| 65 to 74 Years | 24 (33.8%) | 33 (33.7%) |
| 75 Years and over | 23 (53.5%) | 56 (32.9%) |
Disability Class by Sex by Age in Jackson
Disability Class: Hearing Difficulty
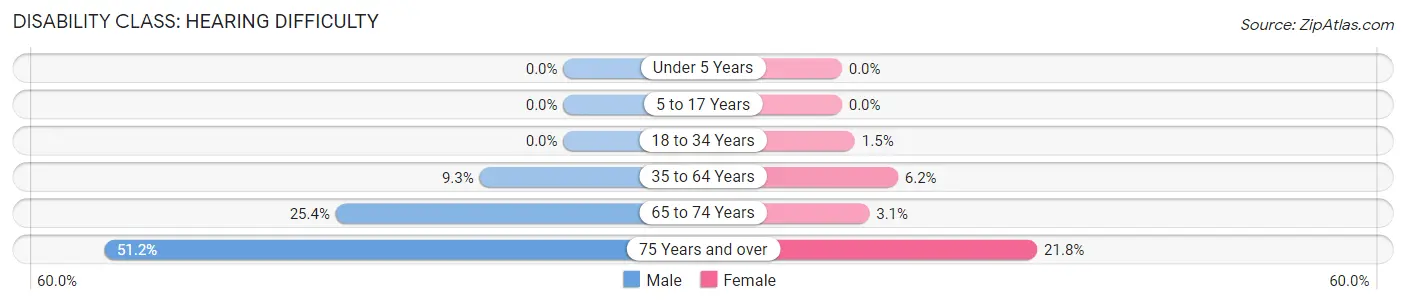
| Age Bracket | Male | Female |
| Under 5 Years | 0 (0.0%) | 0 (0.0%) |
| 5 to 17 Years | 0 (0.0%) | 0 (0.0%) |
| 18 to 34 Years | 0 (0.0%) | 4 (1.5%) |
| 35 to 64 Years | 39 (9.3%) | 32 (6.2%) |
| 65 to 74 Years | 18 (25.4%) | 3 (3.1%) |
| 75 Years and over | 22 (51.2%) | 37 (21.8%) |
Disability Class: Vision Difficulty
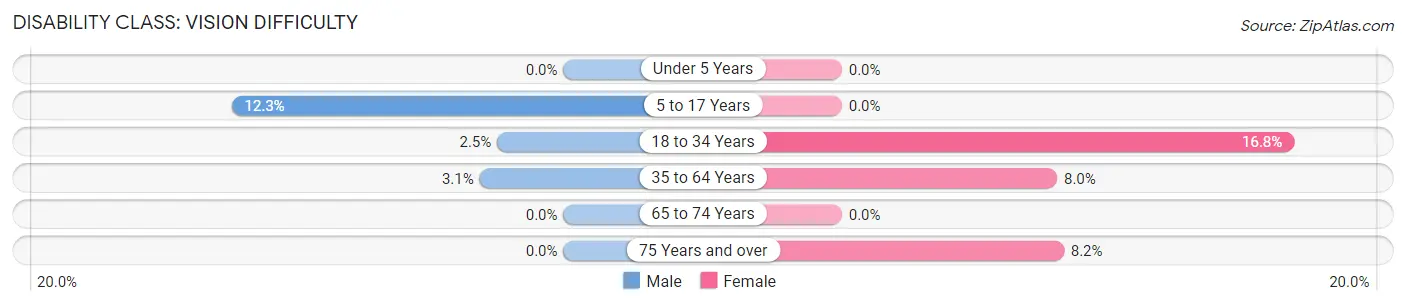
| Age Bracket | Male | Female |
| Under 5 Years | 0 (0.0%) | 0 (0.0%) |
| 5 to 17 Years | 17 (12.3%) | 0 (0.0%) |
| 18 to 34 Years | 6 (2.5%) | 46 (16.8%) |
| 35 to 64 Years | 13 (3.1%) | 41 (8.0%) |
| 65 to 74 Years | 0 (0.0%) | 0 (0.0%) |
| 75 Years and over | 0 (0.0%) | 14 (8.2%) |
Disability Class: Cognitive Difficulty
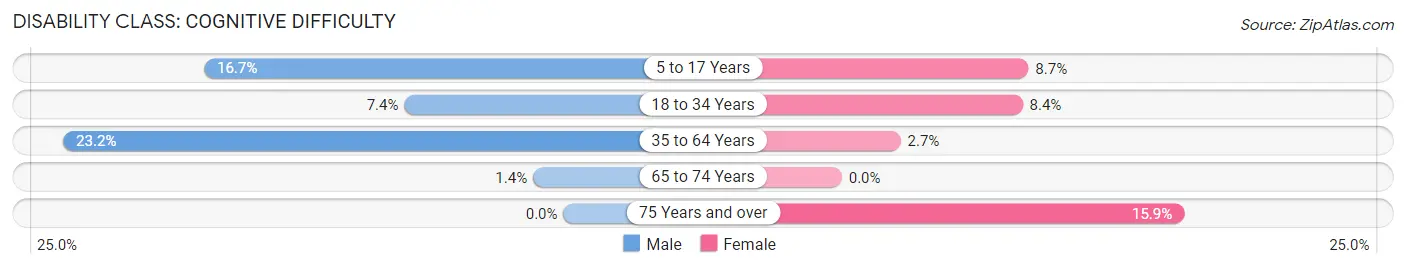
| Age Bracket | Male | Female |
| 5 to 17 Years | 23 (16.7%) | 11 (8.7%) |
| 18 to 34 Years | 18 (7.4%) | 23 (8.4%) |
| 35 to 64 Years | 97 (23.2%) | 14 (2.7%) |
| 65 to 74 Years | 1 (1.4%) | 0 (0.0%) |
| 75 Years and over | 0 (0.0%) | 27 (15.9%) |
Disability Class: Ambulatory Difficulty
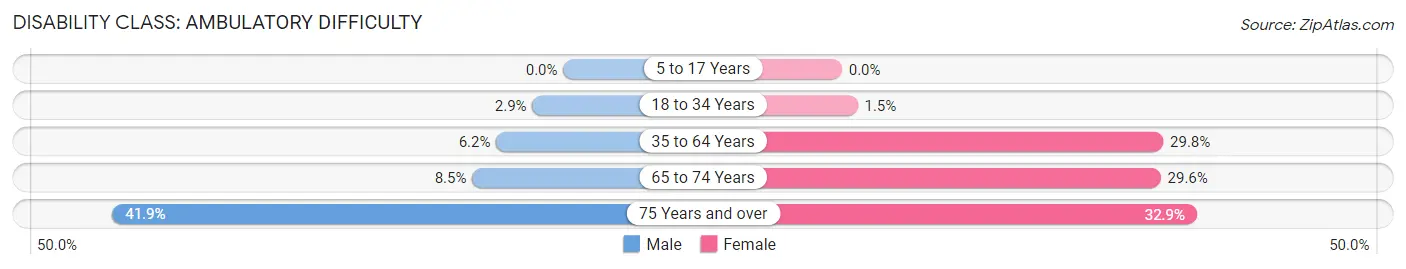
| Age Bracket | Male | Female |
| 5 to 17 Years | 0 (0.0%) | 0 (0.0%) |
| 18 to 34 Years | 7 (2.9%) | 4 (1.5%) |
| 35 to 64 Years | 26 (6.2%) | 153 (29.8%) |
| 65 to 74 Years | 6 (8.5%) | 29 (29.6%) |
| 75 Years and over | 18 (41.9%) | 56 (32.9%) |
Disability Class: Self-Care Difficulty
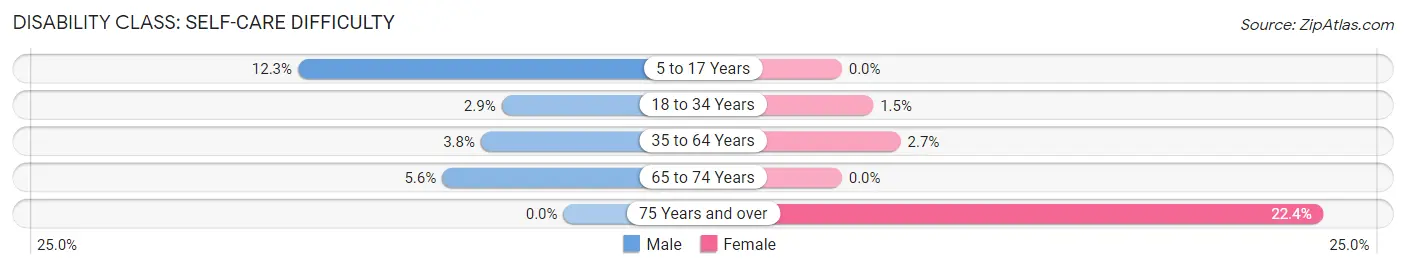
| Age Bracket | Male | Female |
| 5 to 17 Years | 17 (12.3%) | 0 (0.0%) |
| 18 to 34 Years | 7 (2.9%) | 4 (1.5%) |
| 35 to 64 Years | 16 (3.8%) | 14 (2.7%) |
| 65 to 74 Years | 4 (5.6%) | 0 (0.0%) |
| 75 Years and over | 0 (0.0%) | 38 (22.4%) |
Technology Access in Jackson
Computing Device Access in Jackson
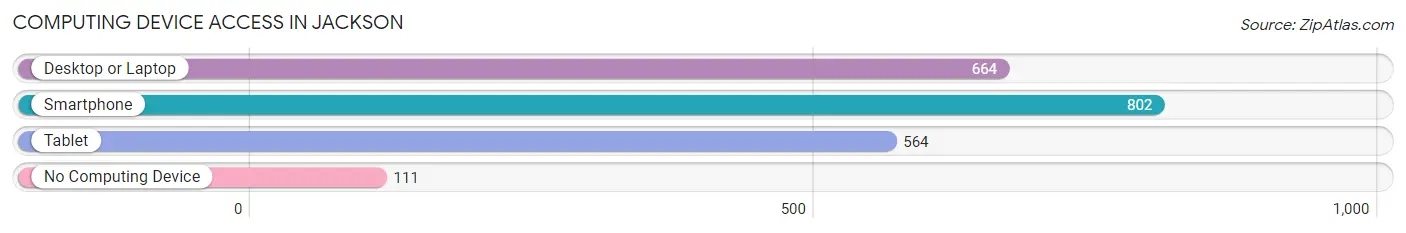
| Device Type | # Households | % Households |
| Desktop or Laptop | 664 | 60.7% |
| Smartphone | 802 | 73.3% |
| Tablet | 564 | 51.5% |
| No Computing Device | 111 | 10.2% |
| Total | 1,094 | 100.0% |
Internet Access in Jackson
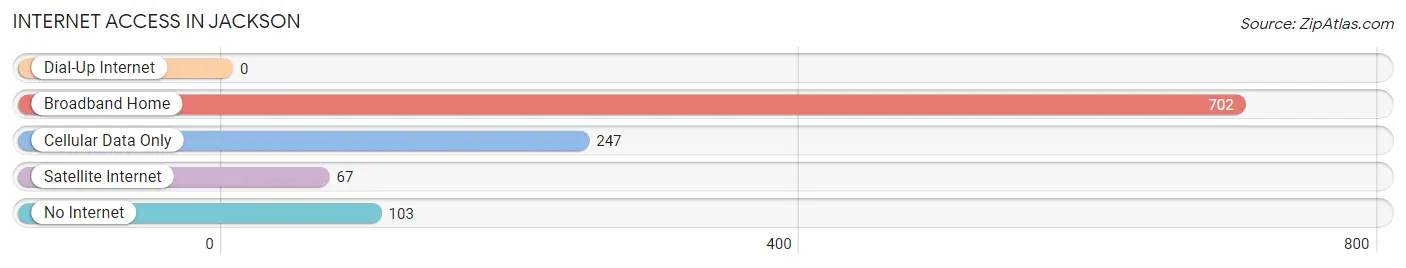
| Internet Type | # Households | % Households |
| Dial-Up Internet | 0 | 0.0% |
| Broadband Home | 702 | 64.2% |
| Cellular Data Only | 247 | 22.6% |
| Satellite Internet | 67 | 6.1% |
| No Internet | 103 | 9.4% |
| Total | 1,094 | 100.0% |
Jackson Summary
Jackson, Kentucky is a small city located in Breathitt County in the eastern part of the state. It is the county seat of Breathitt County and is situated in the foothills of the Appalachian Mountains. The city has a population of approximately 2,000 people and is the largest city in the county.
History
Jackson was founded in 1818 by a group of settlers from Virginia and North Carolina. The city was named after Andrew Jackson, the seventh president of the United States. The city was incorporated in 1820 and was the first city in the state to be incorporated.
The city was an important stop on the Kentucky and Tennessee Railroad, which connected the city to the rest of the state. The railroad was a major factor in the growth of the city and helped to make it a major hub for the timber and coal industries.
The city was also an important stop on the Underground Railroad, which was used by slaves escaping to freedom in the north. The city was a safe haven for many slaves and was a major stop on the route to freedom.
Geography
Jackson is located in the eastern part of the state in the foothills of the Appalachian Mountains. The city is situated on the banks of the North Fork of the Kentucky River. The city is surrounded by rolling hills and is located in a valley.
The climate in Jackson is humid subtropical, with hot summers and mild winters. The average temperature in the summer is around 80 degrees Fahrenheit and the average temperature in the winter is around 40 degrees Fahrenheit.
Economy
The economy of Jackson is largely based on agriculture and tourism. The city is home to several farms and ranches, as well as a number of tourist attractions. The city is also home to several manufacturing plants, including a paper mill and a furniture factory.
The city is also home to several small businesses, including restaurants, shops, and other services. The city is also home to a number of government offices, including the Breathitt County Courthouse.
Demographics
As of the 2010 census, the population of Jackson was 2,000 people. The racial makeup of the city was 97.2% White, 0.7% African American, 0.2% Native American, 0.2% Asian, 0.1% Pacific Islander, 0.2% from other races, and 1.0% from two or more races. Hispanic or Latino of any race were 0.7% of the population.
The median income for a household in the city was $25,000 and the median income for a family was $30,000. The per capita income for the city was $14,000. About 18.2% of families and 22.2% of the population were below the poverty line, including 28.3% of those under age 18 and 16.7% of those age 65 or over.
Jackson is a small city with a rich history and a diverse economy. The city is home to a number of farms and ranches, as well as a number of tourist attractions. The city is also home to several manufacturing plants and small businesses. The city has a population of approximately 2,000 people and is the largest city in the county.
Common Questions
What is Per Capita Income in Jackson?
Per Capita income in Jackson is $24,381.
What is the Median Family Income in Jackson?
Median Family Income in Jackson is $53,750.
What is the Median Household income in Jackson?
Median Household Income in Jackson is $33,333.
What is Income or Wage Gap in Jackson?
Income or Wage Gap in Jackson is 31.4%.
Women in Jackson earn 68.6 cents for every dollar earned by a man.
What is Inequality or Gini Index in Jackson?
Inequality or Gini Index in Jackson is 0.45.
What is the Total Population of Jackson?
Total Population of Jackson is 2,286.
What is the Total Male Population of Jackson?
Total Male Population of Jackson is 962.
What is the Total Female Population of Jackson?
Total Female Population of Jackson is 1,324.
What is the Ratio of Males per 100 Females in Jackson?
There are 72.66 Males per 100 Females in Jackson.
What is the Ratio of Females per 100 Males in Jackson?
There are 137.63 Females per 100 Males in Jackson.
What is the Median Population Age in Jackson?
Median Population Age in Jackson is 43.1 Years.
What is the Average Family Size in Jackson
Average Family Size in Jackson is 2.7 People.
What is the Average Household Size in Jackson
Average Household Size in Jackson is 2.0 People.
How Large is the Labor Force in Jackson?
There are 1,026 People in the Labor Forcein in Jackson.
What is the Percentage of People in the Labor Force in Jackson?
53.2% of People are in the Labor Force in Jackson.
What is the Unemployment Rate in Jackson?
Unemployment Rate in Jackson is 9.6%.