Fordsville, KY Map & Demographics
Fordsville Map
Fordsville Overview
$18,352
PER CAPITA INCOME
$48,409
AVG FAMILY INCOME
$43,281
AVG HOUSEHOLD INCOME
60.9%
WAGE / INCOME GAP [ % ]
39.1¢/ $1
WAGE / INCOME GAP [ $ ]
0.43
INEQUALITY / GINI INDEX
546
TOTAL POPULATION
232
MALE POPULATION
314
FEMALE POPULATION
73.89
MALES / 100 FEMALES
135.34
FEMALES / 100 MALES
32.1
MEDIAN AGE
2.9
AVG FAMILY SIZE
3.0
AVG HOUSEHOLD SIZE
251
LABOR FORCE [ PEOPLE ]
55.2%
PERCENT IN LABOR FORCE
1.2%
UNEMPLOYMENT RATE
Fordsville Zip Codes
Fordsville Area Codes
Income in Fordsville
Income Overview in Fordsville
Per Capita Income in Fordsville is $18,352, while median incomes of families and households are $48,409 and $43,281 respectively.
| Characteristic | Number | Measure |
| Per Capita Income | 546 | $18,352 |
| Median Family Income | 96 | $48,409 |
| Mean Family Income | 96 | $52,321 |
| Median Household Income | 161 | $43,281 |
| Mean Household Income | 161 | $50,216 |
| Income Deficit | 96 | $0 |
| Wage / Income Gap (%) | 546 | 60.88% |
| Wage / Income Gap ($) | 546 | 39.12¢ per $1 |
| Gini / Inequality Index | 546 | 0.43 |
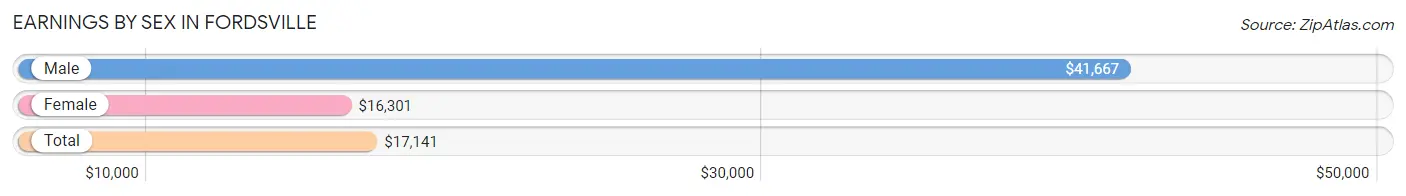
Earnings by Sex in Fordsville
Average Earnings in Fordsville are $17,141, $41,667 for men and $16,301 for women, a difference of 60.9%.
| Sex | Number | Average Earnings |
| Male | 98 (38.7%) | $41,667 |
| Female | 155 (61.3%) | $16,301 |
| Total | 253 (100.0%) | $17,141 |
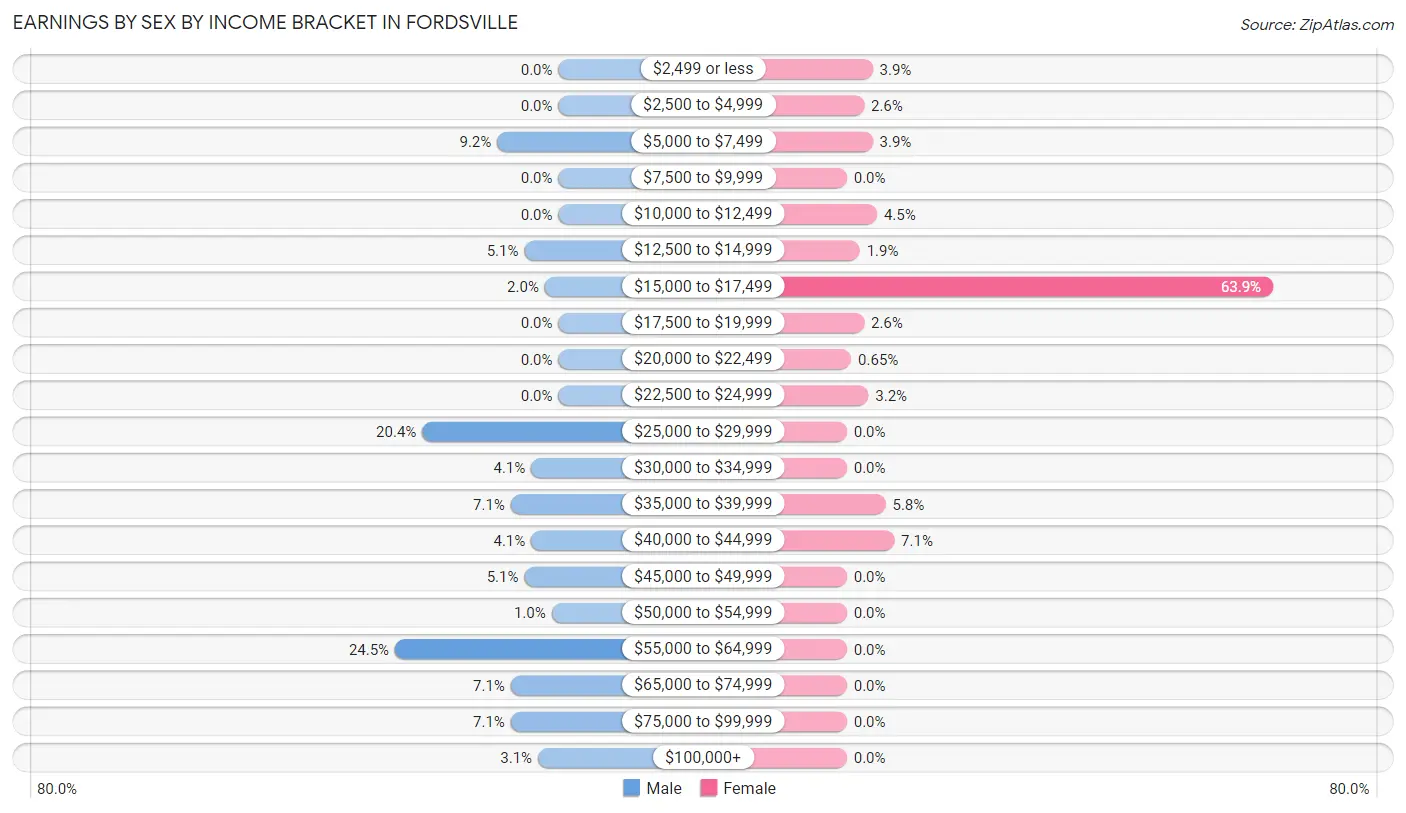
Earnings by Sex by Income Bracket in Fordsville
The most common earnings brackets in Fordsville are $55,000 to $64,999 for men (24 | 24.5%) and $15,000 to $17,499 for women (99 | 63.9%).
| Income | Male | Female |
| $2,499 or less | 0 (0.0%) | 6 (3.9%) |
| $2,500 to $4,999 | 0 (0.0%) | 4 (2.6%) |
| $5,000 to $7,499 | 9 (9.2%) | 6 (3.9%) |
| $7,500 to $9,999 | 0 (0.0%) | 0 (0.0%) |
| $10,000 to $12,499 | 0 (0.0%) | 7 (4.5%) |
| $12,500 to $14,999 | 5 (5.1%) | 3 (1.9%) |
| $15,000 to $17,499 | 2 (2.0%) | 99 (63.9%) |
| $17,500 to $19,999 | 0 (0.0%) | 4 (2.6%) |
| $20,000 to $22,499 | 0 (0.0%) | 1 (0.6%) |
| $22,500 to $24,999 | 0 (0.0%) | 5 (3.2%) |
| $25,000 to $29,999 | 20 (20.4%) | 0 (0.0%) |
| $30,000 to $34,999 | 4 (4.1%) | 0 (0.0%) |
| $35,000 to $39,999 | 7 (7.1%) | 9 (5.8%) |
| $40,000 to $44,999 | 4 (4.1%) | 11 (7.1%) |
| $45,000 to $49,999 | 5 (5.1%) | 0 (0.0%) |
| $50,000 to $54,999 | 1 (1.0%) | 0 (0.0%) |
| $55,000 to $64,999 | 24 (24.5%) | 0 (0.0%) |
| $65,000 to $74,999 | 7 (7.1%) | 0 (0.0%) |
| $75,000 to $99,999 | 7 (7.1%) | 0 (0.0%) |
| $100,000+ | 3 (3.1%) | 0 (0.0%) |
| Total | 98 (100.0%) | 155 (100.0%) |
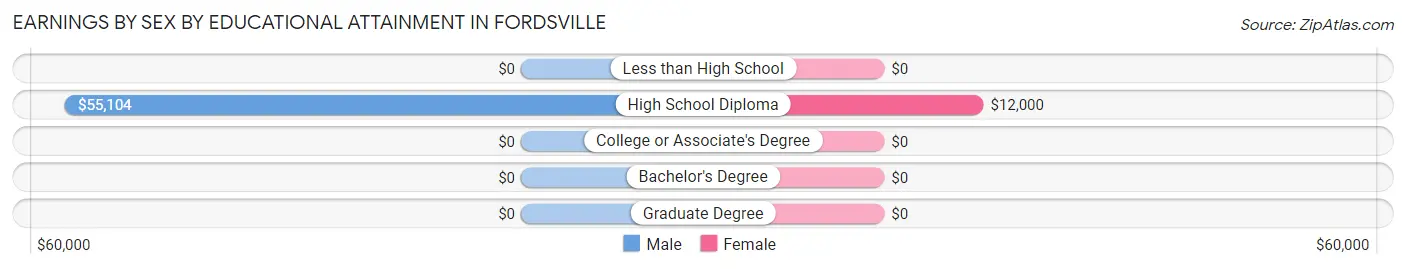
Earnings by Sex by Educational Attainment in Fordsville
Average earnings in Fordsville are $48,750 for men and $15,000 for women, a difference of 69.2%. Men with an educational attainment of high school diploma enjoy the highest average annual earnings of $55,104, while those with high school diploma education earn the least with $55,104. Women with an educational attainment of high school diploma earn the most with the average annual earnings of $12,000, while those with high school diploma education have the smallest earnings of $12,000.
| Educational Attainment | Male Income | Female Income |
| Less than High School | - | - |
| High School Diploma | $55,104 | $12,000 |
| College or Associate's Degree | - | - |
| Bachelor's Degree | - | - |
| Graduate Degree | - | - |
| Total | $48,750 | $15,000 |
Family Income in Fordsville
Family Income Brackets in Fordsville
According to the Fordsville family income data, there are 35 families falling into the $35,000 to $49,999 income range, which is the most common income bracket and makes up 36.5% of all families.
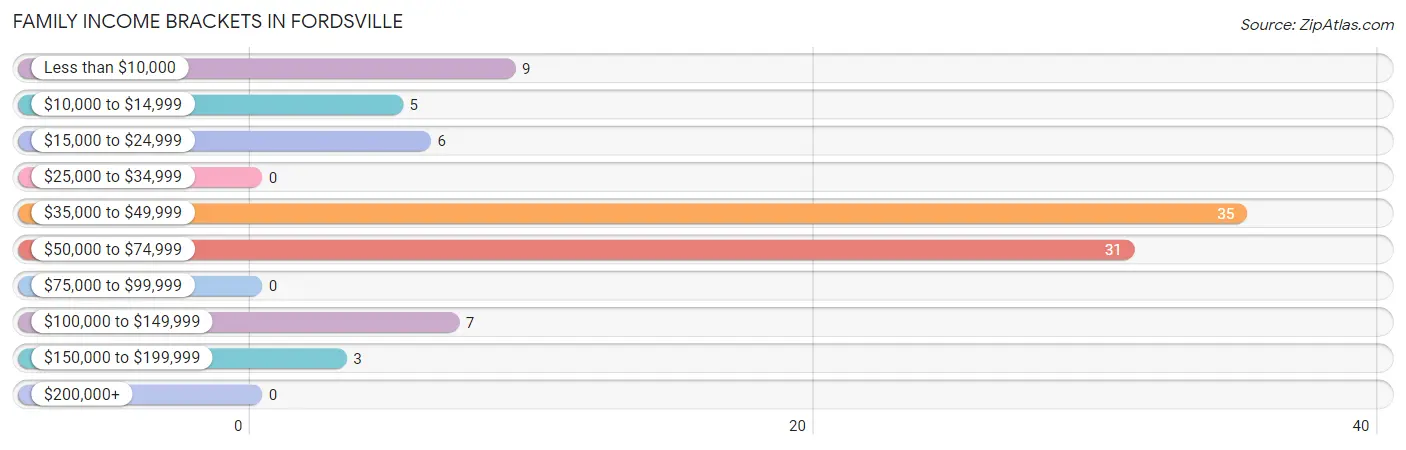
| Income Bracket | # Families | % Families |
| Less than $10,000 | 9 | 9.4% |
| $10,000 to $14,999 | 5 | 5.2% |
| $15,000 to $24,999 | 6 | 6.3% |
| $25,000 to $34,999 | 0 | 0.0% |
| $35,000 to $49,999 | 35 | 36.5% |
| $50,000 to $74,999 | 31 | 32.3% |
| $75,000 to $99,999 | 0 | 0.0% |
| $100,000 to $149,999 | 7 | 7.3% |
| $150,000 to $199,999 | 3 | 3.1% |
| $200,000+ | 0 | 0.0% |
Family Income by Famaliy Size in Fordsville
2-person families (57 | 59.4%) account for the highest median family income in Fordsville with $48,750 per family, while 2-person families (57 | 59.4%) have the highest median income of $24,375 per family member.
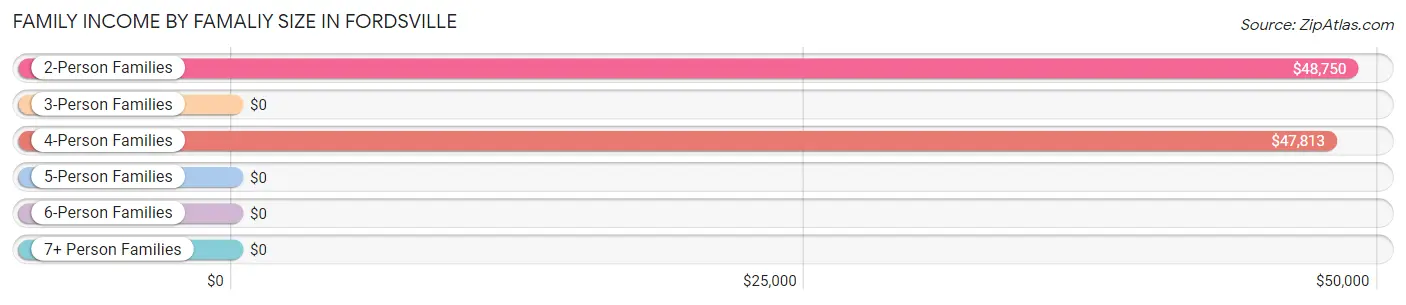
| Income Bracket | # Families | Median Income |
| 2-Person Families | 57 (59.4%) | $48,750 |
| 3-Person Families | 11 (11.5%) | $0 |
| 4-Person Families | 26 (27.1%) | $47,813 |
| 5-Person Families | 1 (1.0%) | $0 |
| 6-Person Families | 0 (0.0%) | $0 |
| 7+ Person Families | 1 (1.0%) | $0 |
| Total | 96 (100.0%) | $48,409 |
Family Income by Number of Earners in Fordsville
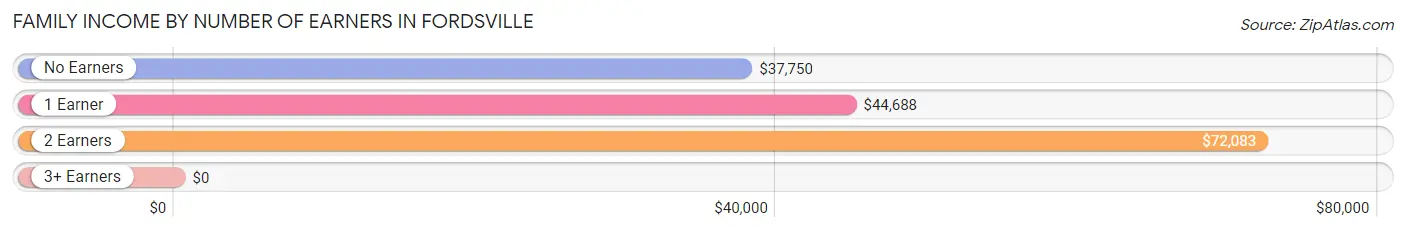
| Number of Earners | # Families | Median Income |
| No Earners | 21 (21.9%) | $37,750 |
| 1 Earner | 45 (46.9%) | $44,688 |
| 2 Earners | 29 (30.2%) | $72,083 |
| 3+ Earners | 1 (1.0%) | $0 |
| Total | 96 (100.0%) | $48,409 |
Household Income in Fordsville
Household Income Brackets in Fordsville
With 34 households falling in the category, the $35,000 to $49,999 income range is the most frequent in Fordsville, accounting for 21.1% of all households.
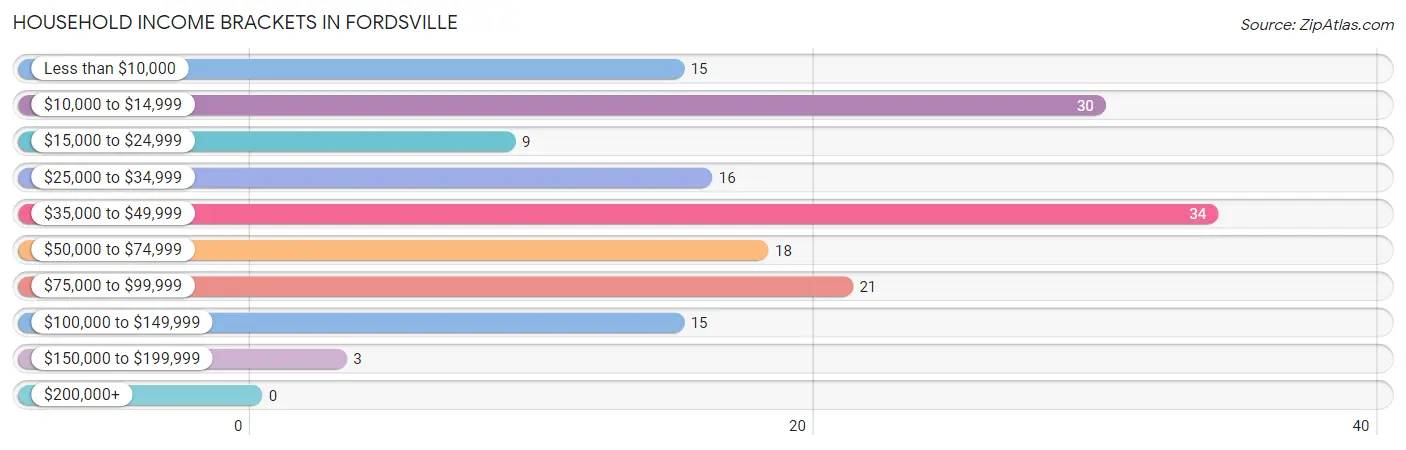
| Income Bracket | # Households | % Households |
| Less than $10,000 | 15 | 9.3% |
| $10,000 to $14,999 | 30 | 18.6% |
| $15,000 to $24,999 | 9 | 5.6% |
| $25,000 to $34,999 | 16 | 9.9% |
| $35,000 to $49,999 | 34 | 21.1% |
| $50,000 to $74,999 | 18 | 11.2% |
| $75,000 to $99,999 | 21 | 13.0% |
| $100,000 to $149,999 | 15 | 9.3% |
| $150,000 to $199,999 | 3 | 1.9% |
| $200,000+ | 0 | 0.0% |
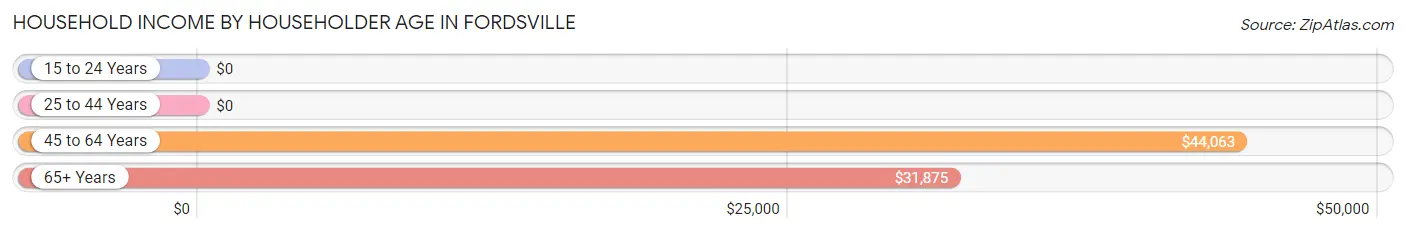
Household Income by Householder Age in Fordsville
The median household income in Fordsville is $43,281, with the highest median household income of $44,063 found in the 45 to 64 years age bracket for the primary householder. A total of 69 households (42.9%) fall into this category. Meanwhile, the 15 to 24 years age bracket for the primary householder has the lowest median household income of $0, with 2 households (1.2%) in this group.
| Income Bracket | # Households | Median Income |
| 15 to 24 Years | 2 (1.2%) | $0 |
| 25 to 44 Years | 46 (28.6%) | $0 |
| 45 to 64 Years | 69 (42.9%) | $44,063 |
| 65+ Years | 44 (27.3%) | $31,875 |
| Total | 161 (100.0%) | $43,281 |
Poverty in Fordsville
Income Below Poverty by Sex and Age in Fordsville
With 22.1% poverty level for males and 15.8% for females among the residents of Fordsville, 6 to 11 year old males and 55 to 64 year old females are the most vulnerable to poverty, with 8 males (61.5%) and 15 females (62.5%) in their respective age groups living below the poverty level.
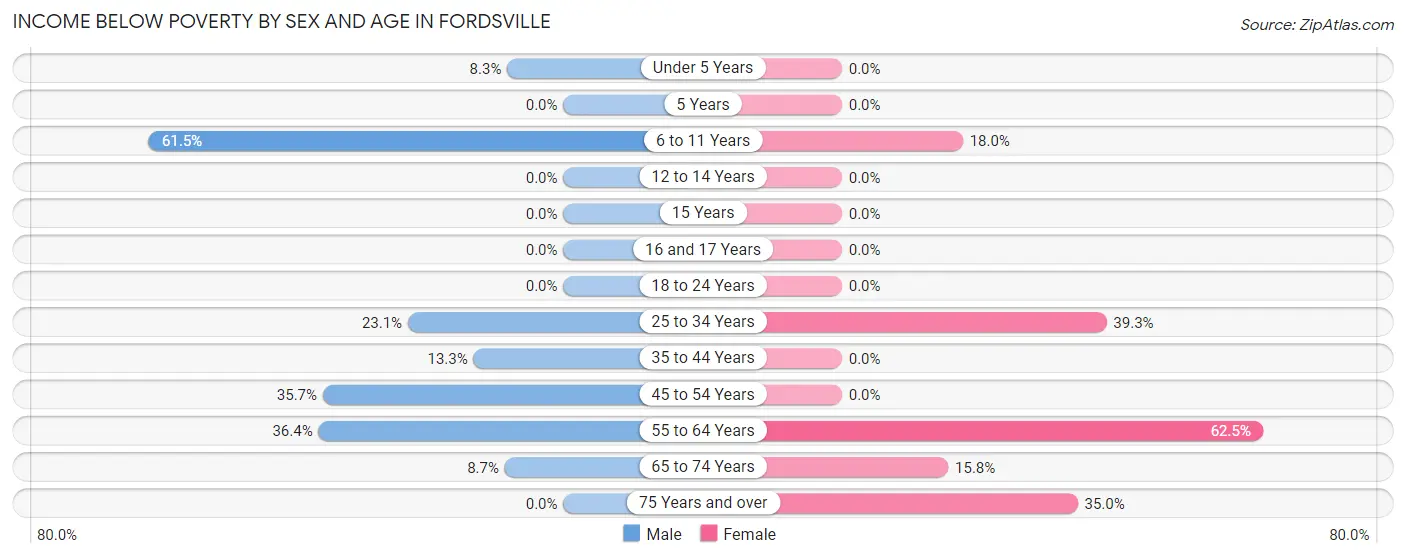
| Age Bracket | Male | Female |
| Under 5 Years | 2 (8.3%) | 0 (0.0%) |
| 5 Years | 0 (0.0%) | 0 (0.0%) |
| 6 to 11 Years | 8 (61.5%) | 7 (17.9%) |
| 12 to 14 Years | 0 (0.0%) | 0 (0.0%) |
| 15 Years | 0 (0.0%) | 0 (0.0%) |
| 16 and 17 Years | 0 (0.0%) | 0 (0.0%) |
| 18 to 24 Years | 0 (0.0%) | 0 (0.0%) |
| 25 to 34 Years | 9 (23.1%) | 11 (39.3%) |
| 35 to 44 Years | 2 (13.3%) | 0 (0.0%) |
| 45 to 54 Years | 15 (35.7%) | 0 (0.0%) |
| 55 to 64 Years | 8 (36.4%) | 15 (62.5%) |
| 65 to 74 Years | 2 (8.7%) | 3 (15.8%) |
| 75 Years and over | 0 (0.0%) | 7 (35.0%) |
| Total | 46 (22.1%) | 43 (15.8%) |
Income Above Poverty by Sex and Age in Fordsville
According to the poverty statistics in Fordsville, males aged 5 years and females aged under 5 years are the age groups that are most secure financially, with 100.0% of males and 100.0% of females in these age groups living above the poverty line.
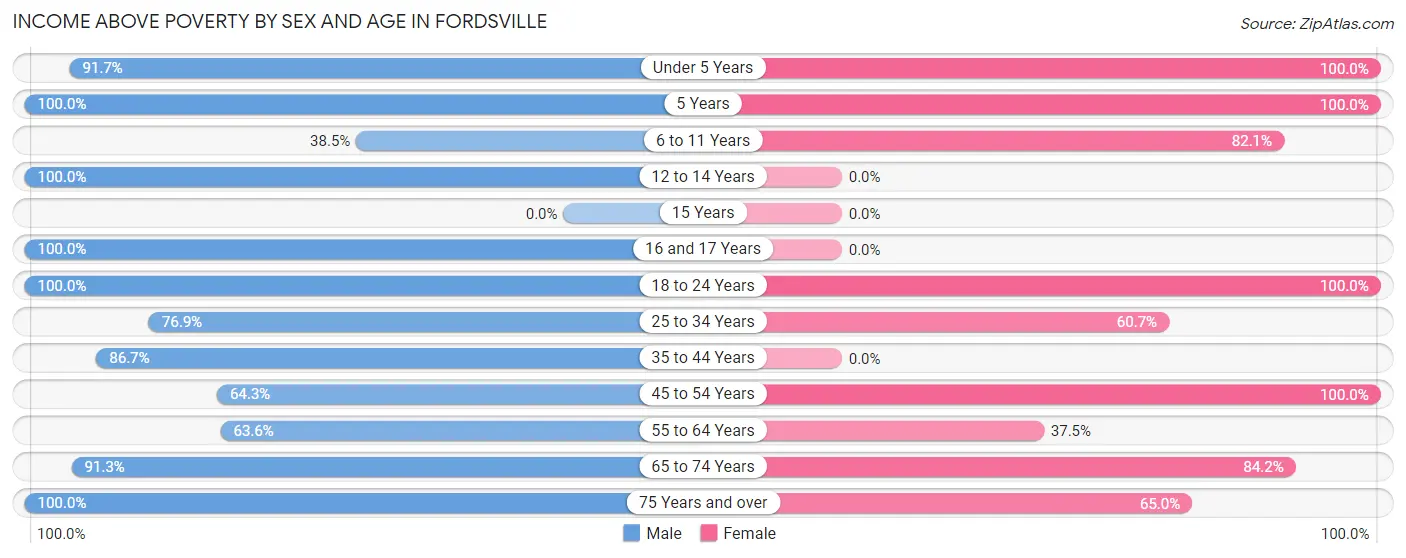
| Age Bracket | Male | Female |
| Under 5 Years | 22 (91.7%) | 7 (100.0%) |
| 5 Years | 3 (100.0%) | 1 (100.0%) |
| 6 to 11 Years | 5 (38.5%) | 32 (82.1%) |
| 12 to 14 Years | 1 (100.0%) | 0 (0.0%) |
| 15 Years | 0 (0.0%) | 0 (0.0%) |
| 16 and 17 Years | 3 (100.0%) | 0 (0.0%) |
| 18 to 24 Years | 15 (100.0%) | 107 (100.0%) |
| 25 to 34 Years | 30 (76.9%) | 17 (60.7%) |
| 35 to 44 Years | 13 (86.7%) | 0 (0.0%) |
| 45 to 54 Years | 27 (64.3%) | 27 (100.0%) |
| 55 to 64 Years | 14 (63.6%) | 9 (37.5%) |
| 65 to 74 Years | 21 (91.3%) | 16 (84.2%) |
| 75 Years and over | 8 (100.0%) | 13 (65.0%) |
| Total | 162 (77.9%) | 229 (84.2%) |
Income Below Poverty Among Married-Couple Families in Fordsville
The poverty statistics for married-couple families in Fordsville show that 17.2% or 10 of the total 58 families live below the poverty line. Families with 3 or 4 children have the highest poverty rate of 100.0%, comprising of 1 families. On the other hand, families with no children have the lowest poverty rate of 0.0%, which includes 0 families.
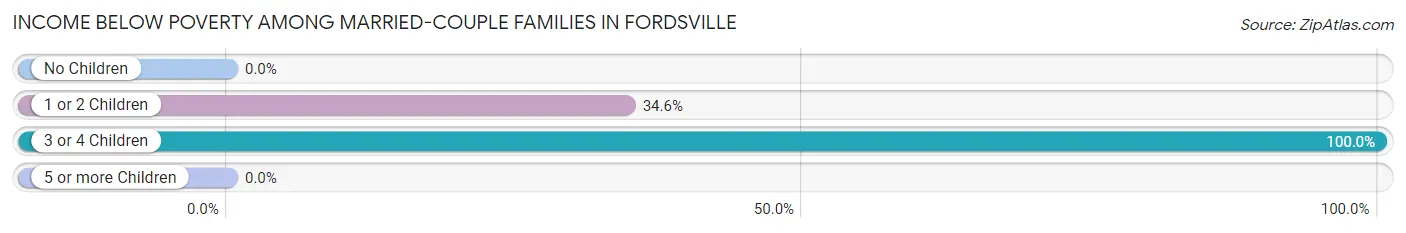
| Children | Above Poverty | Below Poverty |
| No Children | 31 (100.0%) | 0 (0.0%) |
| 1 or 2 Children | 17 (65.4%) | 9 (34.6%) |
| 3 or 4 Children | 0 (0.0%) | 1 (100.0%) |
| 5 or more Children | 0 (0.0%) | 0 (0.0%) |
| Total | 48 (82.8%) | 10 (17.2%) |
Income Below Poverty Among Single-Parent Households in Fordsville
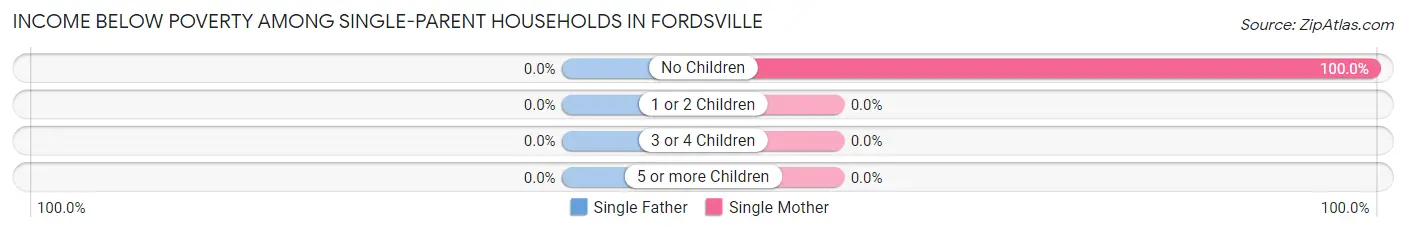
| Children | Single Father | Single Mother |
| No Children | 0 (0.0%) | 6 (100.0%) |
| 1 or 2 Children | 0 (0.0%) | 0 (0.0%) |
| 3 or 4 Children | 0 (0.0%) | 0 (0.0%) |
| 5 or more Children | 0 (0.0%) | 0 (0.0%) |
| Total | 0 (0.0%) | 6 (35.3%) |
Income Below Poverty Among Married-Couple vs Single-Parent Households in Fordsville
The poverty data for Fordsville shows that 10 of the married-couple family households (17.2%) and 6 of the single-parent households (15.8%) are living below the poverty level. Within the married-couple family households, those with 3 or 4 children have the highest poverty rate, with 1 households (100.0%) falling below the poverty line. Among the single-parent households, those with no children have the highest poverty rate, with 6 household (66.7%) living below poverty.
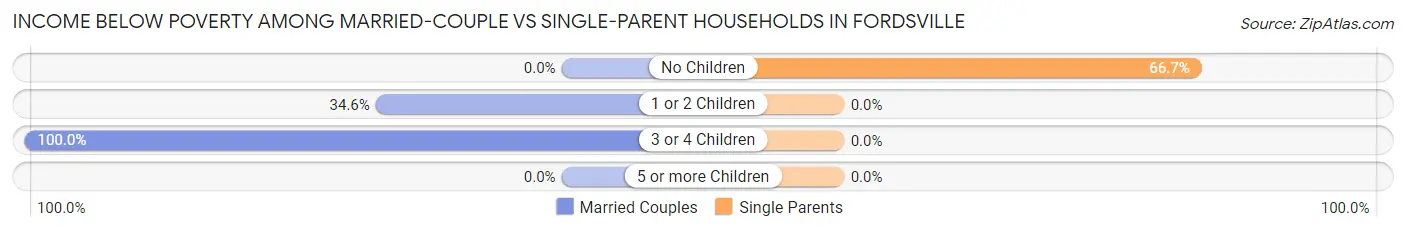
| Children | Married-Couple Families | Single-Parent Households |
| No Children | 0 (0.0%) | 6 (66.7%) |
| 1 or 2 Children | 9 (34.6%) | 0 (0.0%) |
| 3 or 4 Children | 1 (100.0%) | 0 (0.0%) |
| 5 or more Children | 0 (0.0%) | 0 (0.0%) |
| Total | 10 (17.2%) | 6 (15.8%) |
Race in Fordsville
The most populous races in Fordsville are White / Caucasian (425 | 77.8%), Black / African American (118 | 21.6%), and Hispanic or Latino (29 | 5.3%).
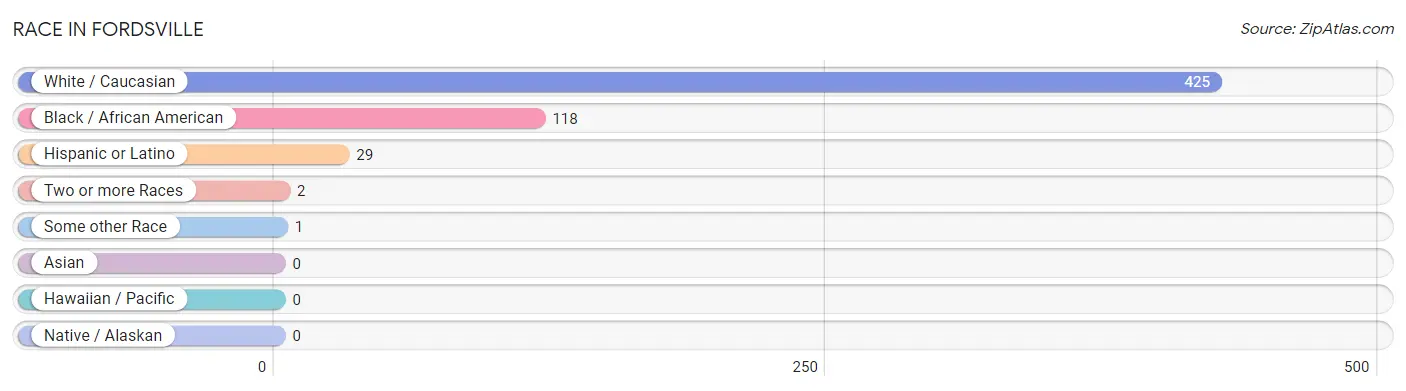
| Race | # Population | % Population |
| Asian | 0 | 0.0% |
| Black / African American | 118 | 21.6% |
| Hawaiian / Pacific | 0 | 0.0% |
| Hispanic or Latino | 29 | 5.3% |
| Native / Alaskan | 0 | 0.0% |
| White / Caucasian | 425 | 77.8% |
| Two or more Races | 2 | 0.4% |
| Some other Race | 1 | 0.2% |
| Total | 546 | 100.0% |
Ancestry in Fordsville
The most populous ancestries reported in Fordsville are American (97 | 17.8%), English (45 | 8.2%), Mexican (29 | 5.3%), German (10 | 1.8%), and Irish (8 | 1.5%), together accounting for 34.6% of all Fordsville residents.
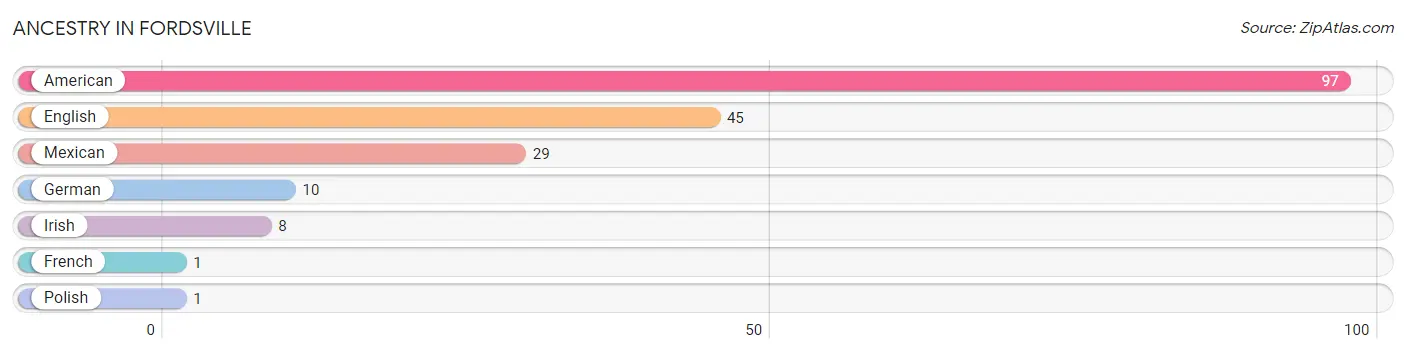
| Ancestry | # Population | % Population |
| American | 97 | 17.8% |
| English | 45 | 8.2% |
| French | 1 | 0.2% |
| German | 10 | 1.8% |
| Irish | 8 | 1.5% |
| Mexican | 29 | 5.3% |
| Polish | 1 | 0.2% | View All 7 Rows |
Immigrants in Fordsville

| Immigration Origin | # Population | % Population | View All 0 Rows |
Sex and Age in Fordsville
Sex and Age in Fordsville
The most populous age groups in Fordsville are 35 to 39 Years (27 | 11.6%) for men and 15 to 19 Years (94 | 29.9%) for women.
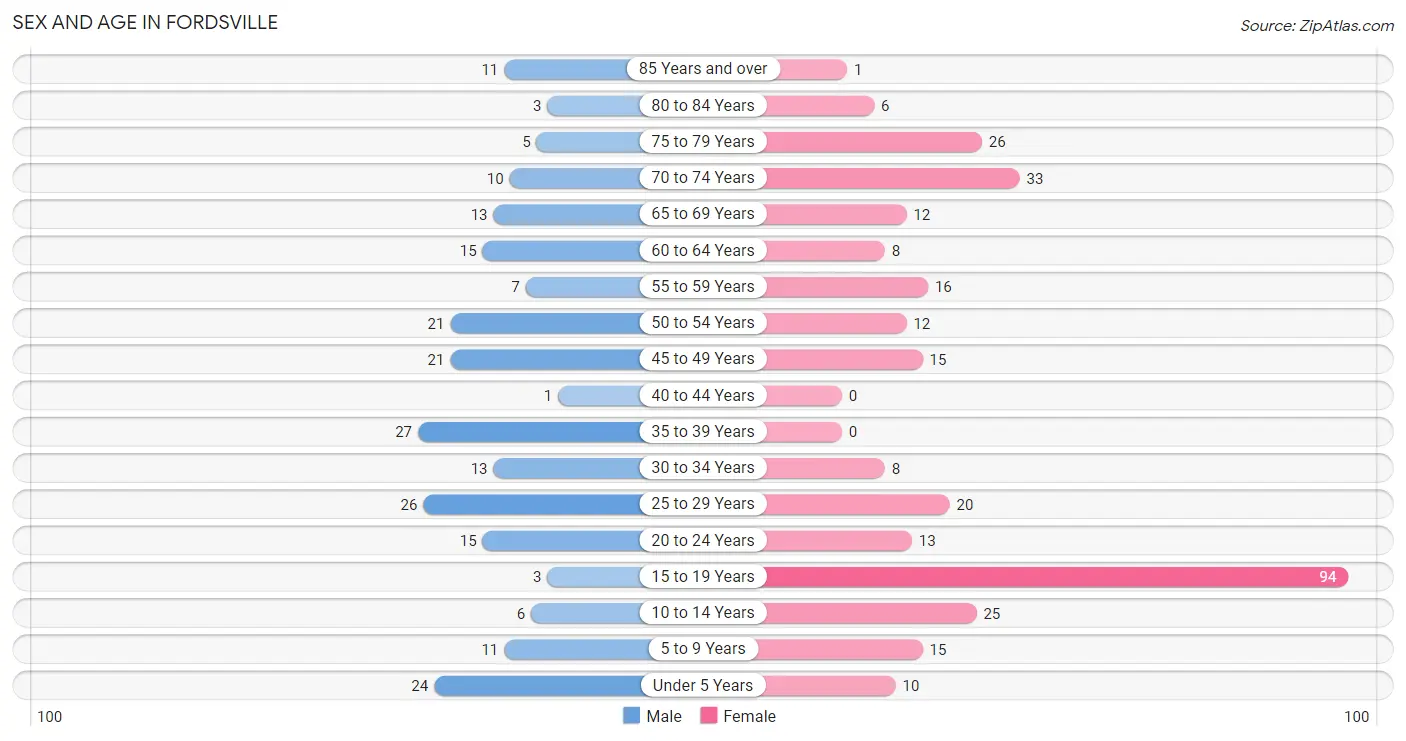
| Age Bracket | Male | Female |
| Under 5 Years | 24 (10.3%) | 10 (3.2%) |
| 5 to 9 Years | 11 (4.7%) | 15 (4.8%) |
| 10 to 14 Years | 6 (2.6%) | 25 (8.0%) |
| 15 to 19 Years | 3 (1.3%) | 94 (29.9%) |
| 20 to 24 Years | 15 (6.5%) | 13 (4.1%) |
| 25 to 29 Years | 26 (11.2%) | 20 (6.4%) |
| 30 to 34 Years | 13 (5.6%) | 8 (2.5%) |
| 35 to 39 Years | 27 (11.6%) | 0 (0.0%) |
| 40 to 44 Years | 1 (0.4%) | 0 (0.0%) |
| 45 to 49 Years | 21 (9.0%) | 15 (4.8%) |
| 50 to 54 Years | 21 (9.0%) | 12 (3.8%) |
| 55 to 59 Years | 7 (3.0%) | 16 (5.1%) |
| 60 to 64 Years | 15 (6.5%) | 8 (2.5%) |
| 65 to 69 Years | 13 (5.6%) | 12 (3.8%) |
| 70 to 74 Years | 10 (4.3%) | 33 (10.5%) |
| 75 to 79 Years | 5 (2.2%) | 26 (8.3%) |
| 80 to 84 Years | 3 (1.3%) | 6 (1.9%) |
| 85 Years and over | 11 (4.7%) | 1 (0.3%) |
| Total | 232 (100.0%) | 314 (100.0%) |
Families and Households in Fordsville
Median Family Size in Fordsville
The median family size in Fordsville is 2.86 persons per family, with single female/mother families (17 | 17.7%) accounting for the largest median family size of 4.18 persons per family. On the other hand, single male/father families (21 | 21.9%) represent the smallest median family size with 2.00 persons per family.
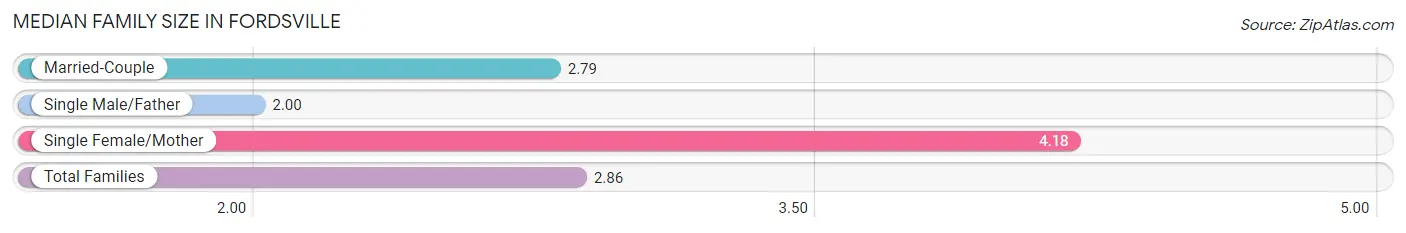
| Family Type | # Families | Family Size |
| Married-Couple | 58 (60.4%) | 2.79 |
| Single Male/Father | 21 (21.9%) | 2.00 |
| Single Female/Mother | 17 (17.7%) | 4.18 |
| Total Families | 96 (100.0%) | 2.86 |
Median Household Size in Fordsville
The median household size in Fordsville is 3.00 persons per household, with single female/mother households (17 | 10.6%) accounting for the largest median household size of 4.82 persons per household. single male/father households (21 | 13.0%) represent the smallest median household size with 2.52 persons per household.
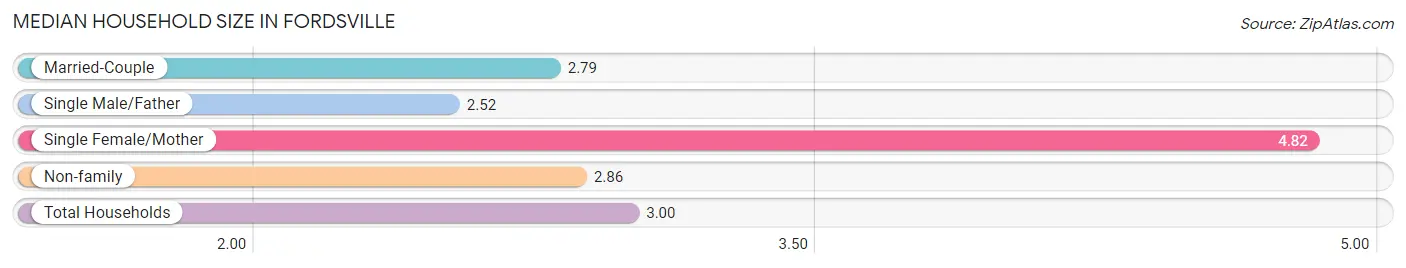
| Household Type | # Households | Household Size |
| Married-Couple | 58 (36.0%) | 2.79 |
| Single Male/Father | 21 (13.0%) | 2.52 |
| Single Female/Mother | 17 (10.6%) | 4.82 |
| Non-family | 65 (40.4%) | 2.86 |
| Total Households | 161 (100.0%) | 3.00 |
Household Size by Marriage Status in Fordsville
Out of a total of 161 households in Fordsville, 96 (59.6%) are family households, while 65 (40.4%) are nonfamily households. The most numerous type of family households are 3-person households, comprising 35, and the most common type of nonfamily households are 1-person households, comprising 51.
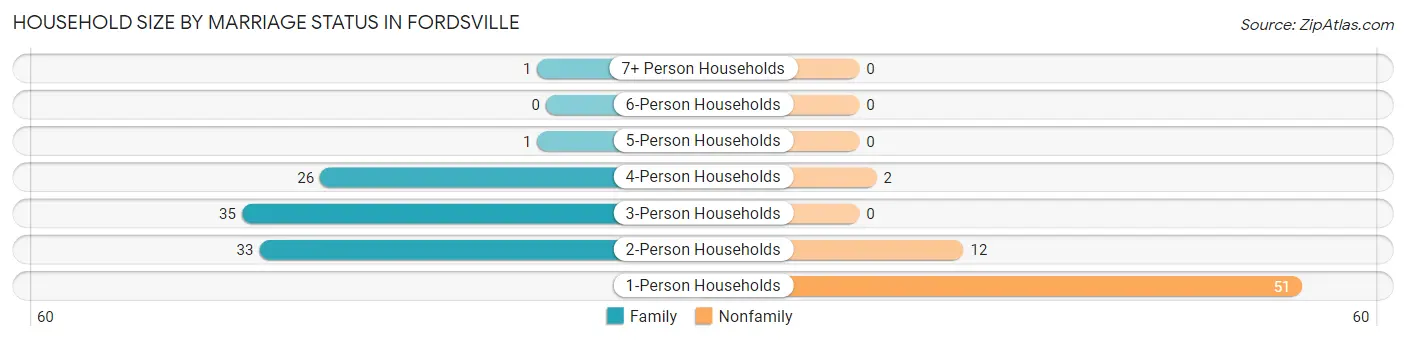
| Household Size | Family Households | Nonfamily Households |
| 1-Person Households | - | 51 (31.7%) |
| 2-Person Households | 33 (20.5%) | 12 (7.4%) |
| 3-Person Households | 35 (21.7%) | 0 (0.0%) |
| 4-Person Households | 26 (16.2%) | 2 (1.2%) |
| 5-Person Households | 1 (0.6%) | 0 (0.0%) |
| 6-Person Households | 0 (0.0%) | 0 (0.0%) |
| 7+ Person Households | 1 (0.6%) | 0 (0.0%) |
| Total | 96 (59.6%) | 65 (40.4%) |
Female Fertility in Fordsville
Fertility by Age in Fordsville
Average fertility rate in Fordsville is 7.0 births per 1,000 women. Women in the age bracket of 20 to 34 years have the highest fertility rate with 24.0 births per 1,000 women. Women in the age bracket of 20 to 34 years acount for 100.0% of all women with births.
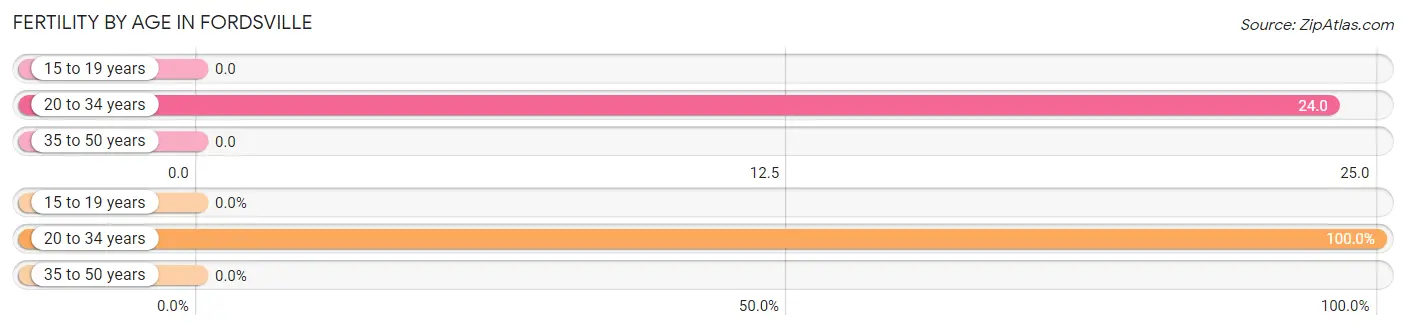
| Age Bracket | Women with Births | Births / 1,000 Women |
| 15 to 19 years | 0 (0.0%) | 0.0 |
| 20 to 34 years | 1 (100.0%) | 24.0 |
| 35 to 50 years | 0 (0.0%) | 0.0 |
| Total | 1 (100.0%) | 7.0 |
Fertility by Age by Marriage Status in Fordsville
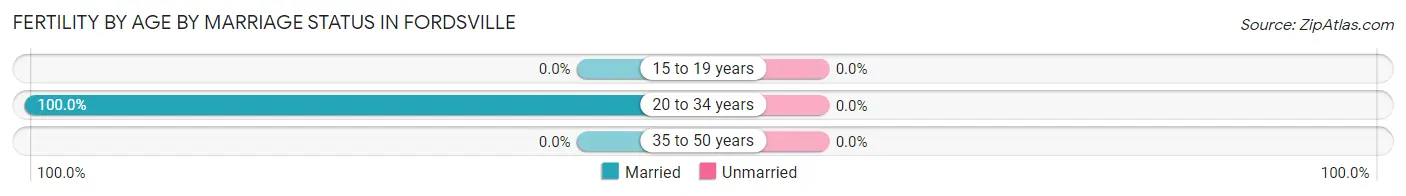
| Age Bracket | Married | Unmarried |
| 15 to 19 years | 0 (0.0%) | 0 (0.0%) |
| 20 to 34 years | 1 (100.0%) | 0 (0.0%) |
| 35 to 50 years | 0 (0.0%) | 0 (0.0%) |
| Total | 1 (100.0%) | 0 (0.0%) |
Fertility by Education in Fordsville
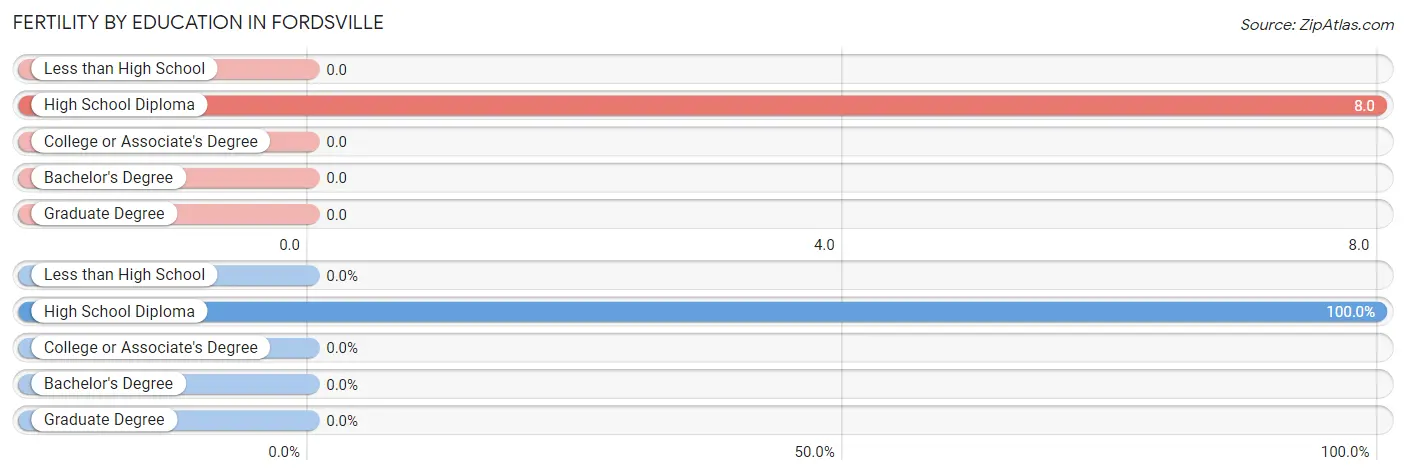
| Educational Attainment | Women with Births | Births / 1,000 Women |
| Less than High School | 0 (0.0%) | 0.0 |
| High School Diploma | 1 (100.0%) | 8.0 |
| College or Associate's Degree | 0 (0.0%) | 0.0 |
| Bachelor's Degree | 0 (0.0%) | 0.0 |
| Graduate Degree | 0 (0.0%) | 0.0 |
| Total | 1 (100.0%) | 7.0 |
Fertility by Education by Marriage Status in Fordsville
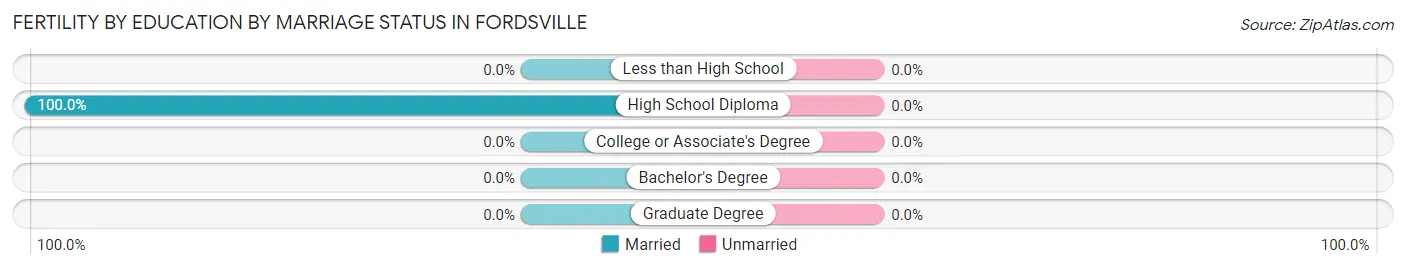
| Educational Attainment | Married | Unmarried |
| Less than High School | 0 (0.0%) | 0 (0.0%) |
| High School Diploma | 1 (100.0%) | 0 (0.0%) |
| College or Associate's Degree | 0 (0.0%) | 0 (0.0%) |
| Bachelor's Degree | 0 (0.0%) | 0 (0.0%) |
| Graduate Degree | 0 (0.0%) | 0 (0.0%) |
| Total | 1 (100.0%) | 0 (0.0%) |
Employment Characteristics in Fordsville
Employment by Class of Employer in Fordsville
Among the 246 employed individuals in Fordsville, private company employees (210 | 85.4%), self-employed (not incorporated) (15 | 6.1%), and not-for-profit organizations (15 | 6.1%) make up the most common classes of employment.
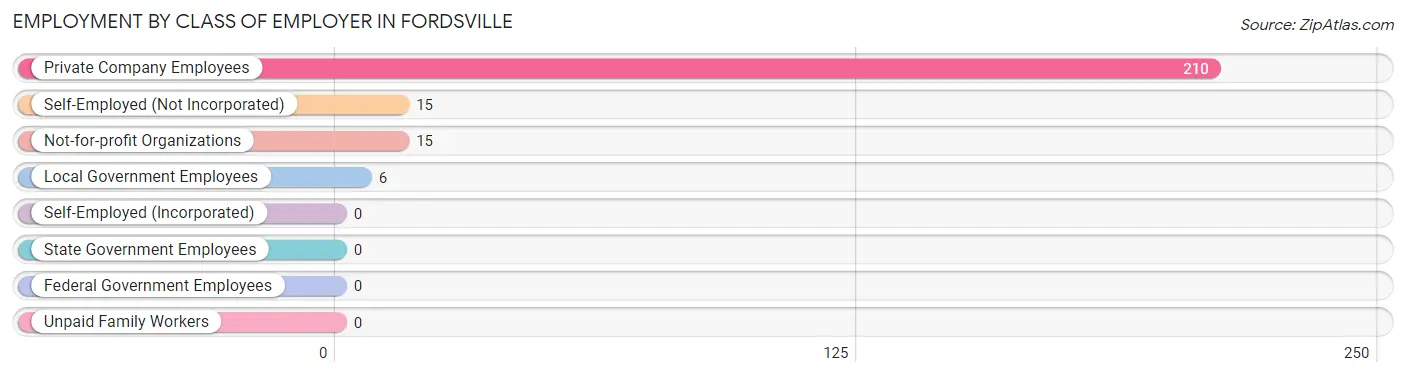
| Employer Class | # Employees | % Employees |
| Private Company Employees | 210 | 85.4% |
| Self-Employed (Incorporated) | 0 | 0.0% |
| Self-Employed (Not Incorporated) | 15 | 6.1% |
| Not-for-profit Organizations | 15 | 6.1% |
| Local Government Employees | 6 | 2.4% |
| State Government Employees | 0 | 0.0% |
| Federal Government Employees | 0 | 0.0% |
| Unpaid Family Workers | 0 | 0.0% |
| Total | 246 | 100.0% |
Employment Status by Age in Fordsville
According to the labor force statistics for Fordsville, out of the total population over 16 years of age (455), 55.2% or 251 individuals are in the labor force, with 1.2% or 3 of them unemployed. The age group with the highest labor force participation rate is 16 to 19 years, with 96.9% or 94 individuals in the labor force. Within the labor force, the 25 to 29 years age range has the highest percentage of unemployed individuals, with 7.1% or 3 of them being unemployed.
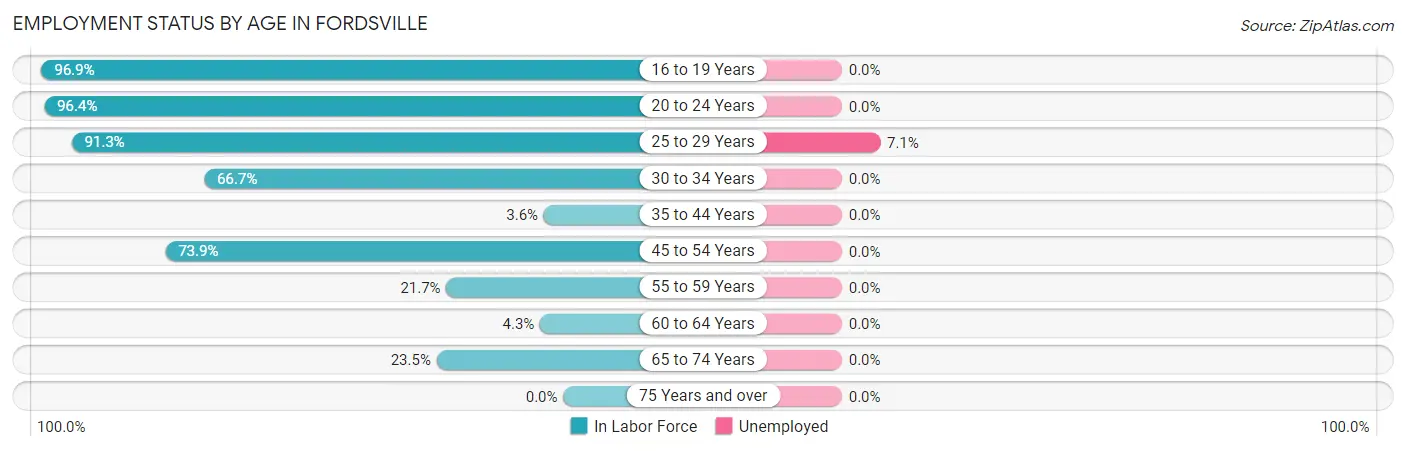
| Age Bracket | In Labor Force | Unemployed |
| 16 to 19 Years | 94 (96.9%) | 0 (0.0%) |
| 20 to 24 Years | 27 (96.4%) | 0 (0.0%) |
| 25 to 29 Years | 42 (91.3%) | 3 (7.1%) |
| 30 to 34 Years | 14 (66.7%) | 0 (0.0%) |
| 35 to 44 Years | 1 (3.6%) | 0 (0.0%) |
| 45 to 54 Years | 51 (73.9%) | 0 (0.0%) |
| 55 to 59 Years | 5 (21.7%) | 0 (0.0%) |
| 60 to 64 Years | 1 (4.3%) | 0 (0.0%) |
| 65 to 74 Years | 16 (23.5%) | 0 (0.0%) |
| 75 Years and over | 0 (0.0%) | 0 (0.0%) |
| Total | 251 (55.2%) | 3 (1.2%) |
Employment Status by Educational Attainment in Fordsville
According to labor force statistics for Fordsville, 54.3% of individuals (114) out of the total population between 25 and 64 years of age (210) are in the labor force, with 2.6% or 3 of them being unemployed. The group with the highest labor force participation rate are those with the educational attainment of bachelor's degree or higher, with 100.0% or 5 individuals in the labor force. Within the labor force, individuals with high school diploma education have the highest percentage of unemployment, with 3.4% or 3 of them being unemployed.
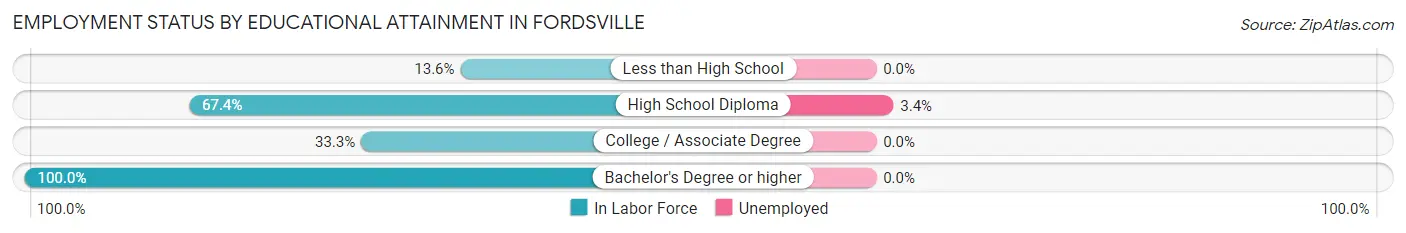
| Educational Attainment | In Labor Force | Unemployed |
| Less than High School | 3 (13.6%) | 0 (0.0%) |
| High School Diploma | 89 (67.4%) | 4 (3.4%) |
| College / Associate Degree | 17 (33.3%) | 0 (0.0%) |
| Bachelor's Degree or higher | 5 (100.0%) | 0 (0.0%) |
| Total | 114 (54.3%) | 5 (2.6%) |
Employment Occupations by Sex in Fordsville
Management, Business, Science and Arts Occupations
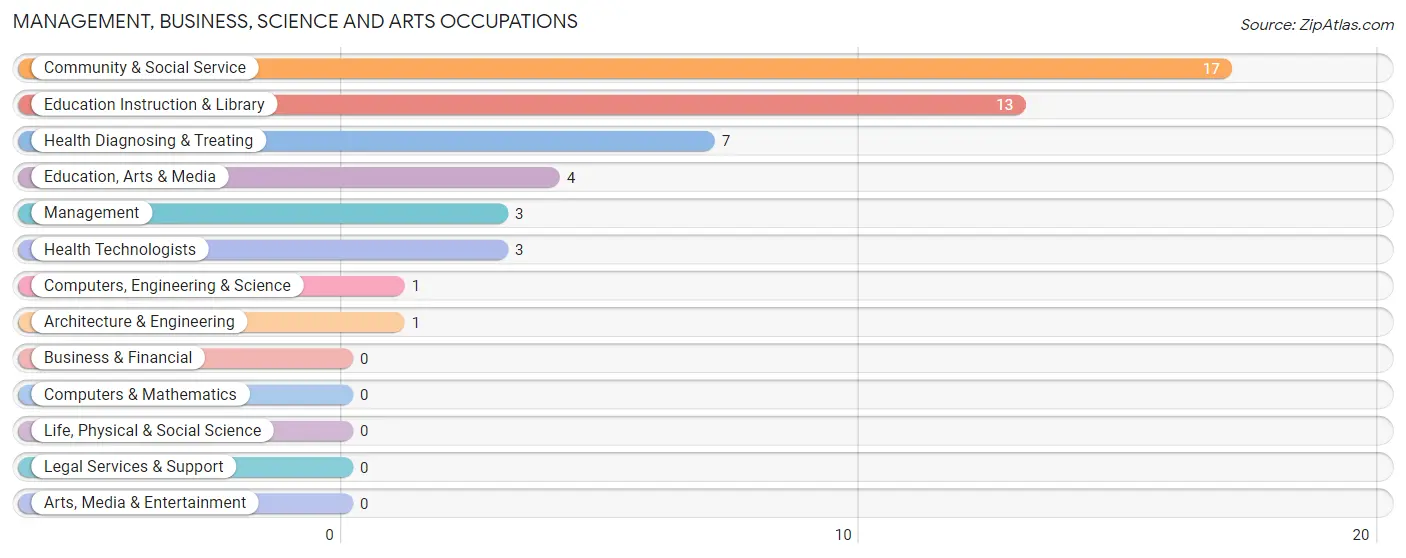
The most common Management, Business, Science and Arts occupations in Fordsville are Community & Social Service (17 | 6.9%), Education Instruction & Library (13 | 5.2%), Health Diagnosing & Treating (7 | 2.8%), Education, Arts & Media (4 | 1.6%), and Management (3 | 1.2%).
Management, Business, Science and Arts Occupations by Sex
Within the Management, Business, Science and Arts occupations in Fordsville, the most male-oriented occupations are Management (100.0%), Computers, Engineering & Science (100.0%), and Architecture & Engineering (100.0%), while the most female-oriented occupations are Education Instruction & Library (100.0%), Health Diagnosing & Treating (100.0%), and Health Technologists (100.0%).
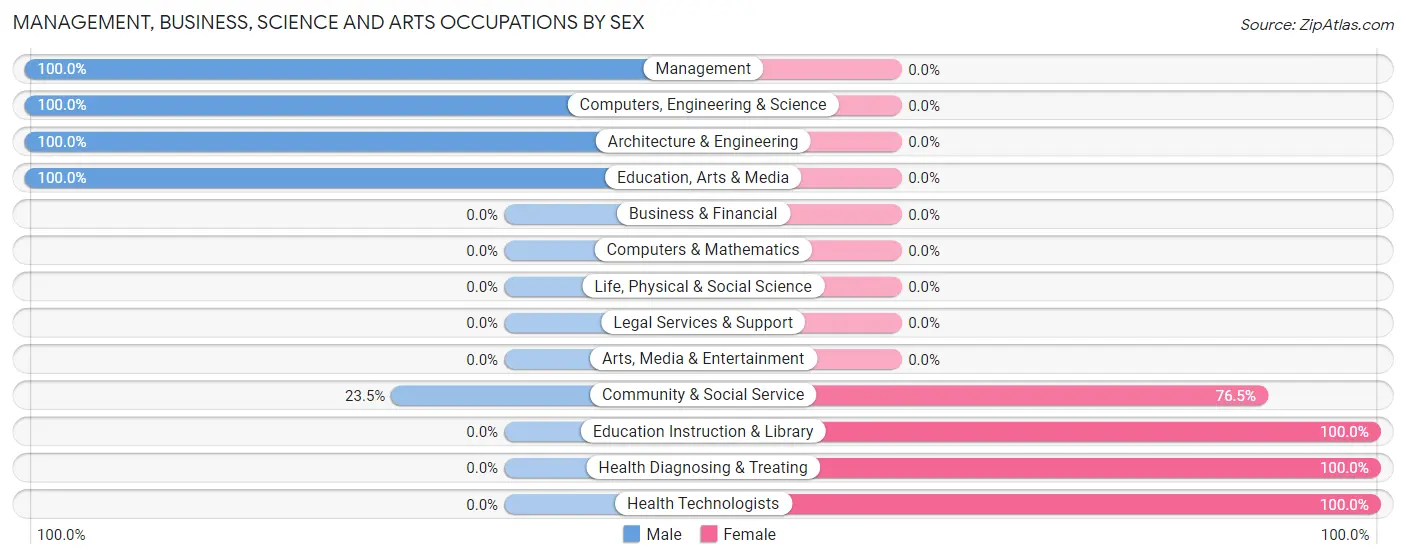
| Occupation | Male | Female |
| Management | 3 (100.0%) | 0 (0.0%) |
| Business & Financial | 0 (0.0%) | 0 (0.0%) |
| Computers, Engineering & Science | 1 (100.0%) | 0 (0.0%) |
| Computers & Mathematics | 0 (0.0%) | 0 (0.0%) |
| Architecture & Engineering | 1 (100.0%) | 0 (0.0%) |
| Life, Physical & Social Science | 0 (0.0%) | 0 (0.0%) |
| Community & Social Service | 4 (23.5%) | 13 (76.5%) |
| Education, Arts & Media | 4 (100.0%) | 0 (0.0%) |
| Legal Services & Support | 0 (0.0%) | 0 (0.0%) |
| Education Instruction & Library | 0 (0.0%) | 13 (100.0%) |
| Arts, Media & Entertainment | 0 (0.0%) | 0 (0.0%) |
| Health Diagnosing & Treating | 0 (0.0%) | 7 (100.0%) |
| Health Technologists | 0 (0.0%) | 3 (100.0%) |
| Total (Category) | 8 (28.6%) | 20 (71.4%) |
| Total (Overall) | 98 (39.5%) | 150 (60.5%) |
Services Occupations
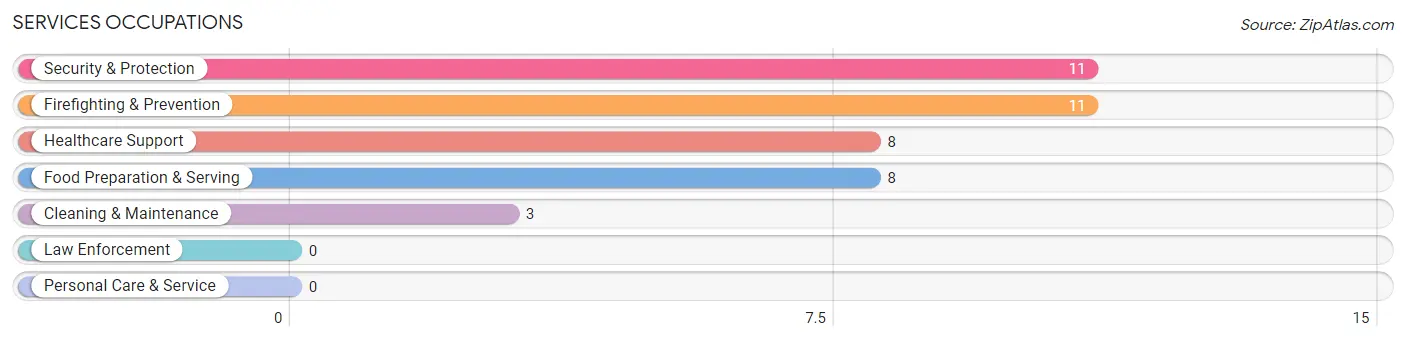
The most common Services occupations in Fordsville are Security & Protection (11 | 4.4%), Firefighting & Prevention (11 | 4.4%), Healthcare Support (8 | 3.2%), Food Preparation & Serving (8 | 3.2%), and Cleaning & Maintenance (3 | 1.2%).
Services Occupations by Sex
Within the Services occupations in Fordsville, the most male-oriented occupations are Security & Protection (100.0%), Firefighting & Prevention (100.0%), and Food Preparation & Serving (50.0%), while the most female-oriented occupations are Healthcare Support (100.0%), Cleaning & Maintenance (100.0%), and Food Preparation & Serving (50.0%).
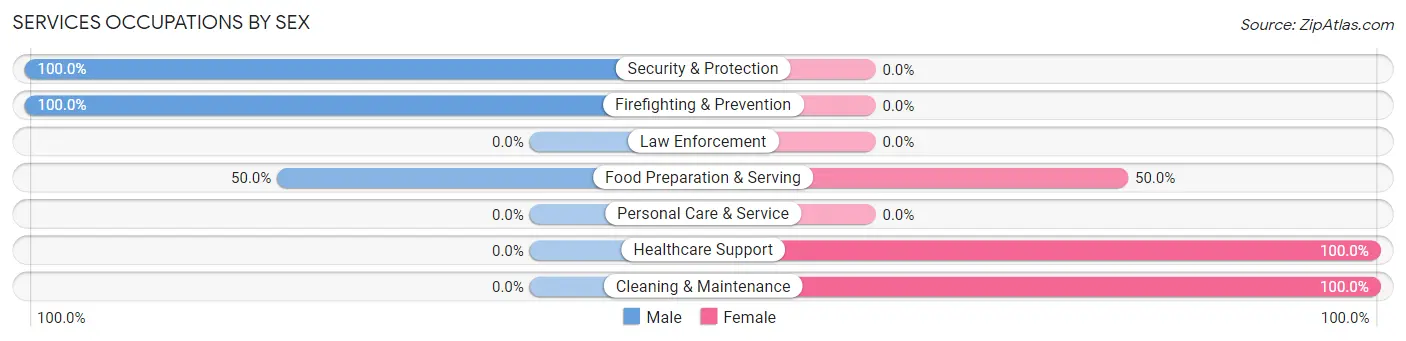
| Occupation | Male | Female |
| Healthcare Support | 0 (0.0%) | 8 (100.0%) |
| Security & Protection | 11 (100.0%) | 0 (0.0%) |
| Firefighting & Prevention | 11 (100.0%) | 0 (0.0%) |
| Law Enforcement | 0 (0.0%) | 0 (0.0%) |
| Food Preparation & Serving | 4 (50.0%) | 4 (50.0%) |
| Cleaning & Maintenance | 0 (0.0%) | 3 (100.0%) |
| Personal Care & Service | 0 (0.0%) | 0 (0.0%) |
| Total (Category) | 15 (50.0%) | 15 (50.0%) |
| Total (Overall) | 98 (39.5%) | 150 (60.5%) |
Sales and Office Occupations
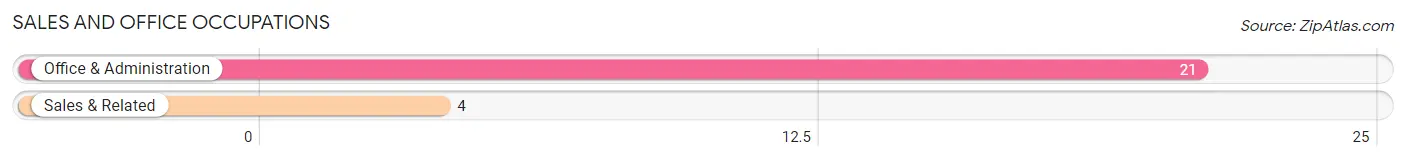
The most common Sales and Office occupations in Fordsville are Office & Administration (21 | 8.5%), and Sales & Related (4 | 1.6%).
Sales and Office Occupations by Sex
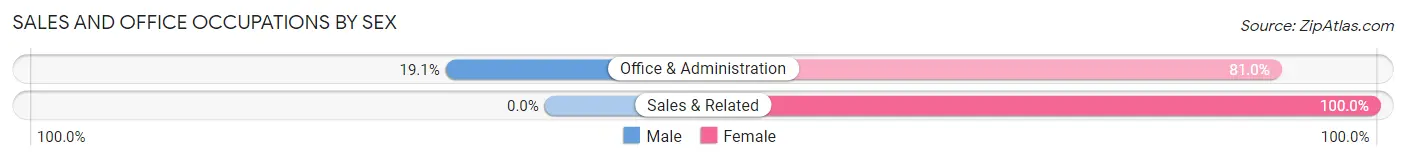
| Occupation | Male | Female |
| Sales & Related | 0 (0.0%) | 4 (100.0%) |
| Office & Administration | 4 (19.1%) | 17 (80.9%) |
| Total (Category) | 4 (16.0%) | 21 (84.0%) |
| Total (Overall) | 98 (39.5%) | 150 (60.5%) |
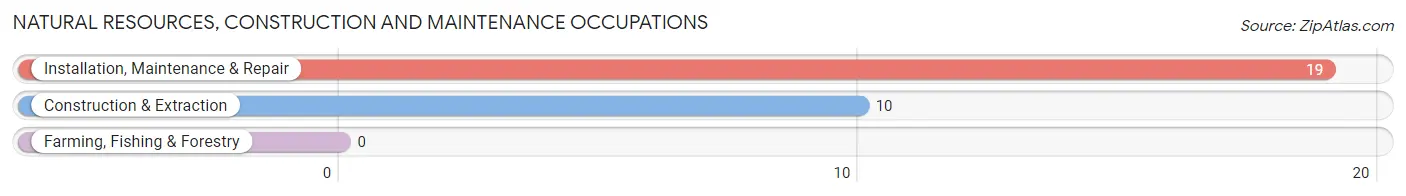
Natural Resources, Construction and Maintenance Occupations
The most common Natural Resources, Construction and Maintenance occupations in Fordsville are Installation, Maintenance & Repair (19 | 7.7%), and Construction & Extraction (10 | 4.0%).
Natural Resources, Construction and Maintenance Occupations by Sex
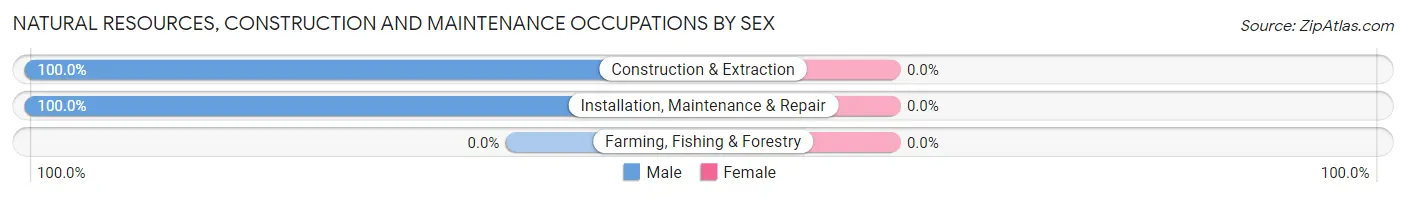
| Occupation | Male | Female |
| Farming, Fishing & Forestry | 0 (0.0%) | 0 (0.0%) |
| Construction & Extraction | 10 (100.0%) | 0 (0.0%) |
| Installation, Maintenance & Repair | 19 (100.0%) | 0 (0.0%) |
| Total (Category) | 29 (100.0%) | 0 (0.0%) |
| Total (Overall) | 98 (39.5%) | 150 (60.5%) |
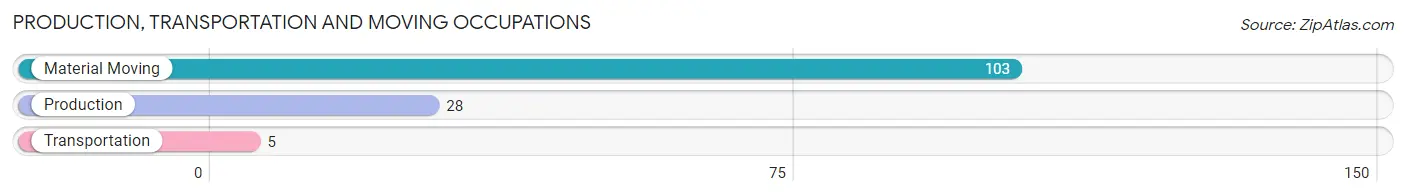
Production, Transportation and Moving Occupations
The most common Production, Transportation and Moving occupations in Fordsville are Material Moving (103 | 41.5%), Production (28 | 11.3%), and Transportation (5 | 2.0%).
Production, Transportation and Moving Occupations by Sex
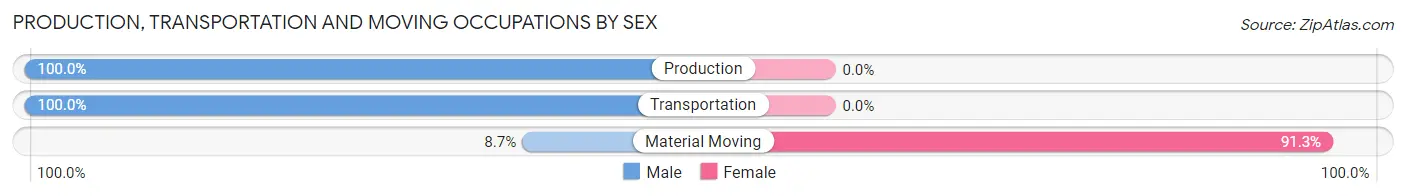
| Occupation | Male | Female |
| Production | 28 (100.0%) | 0 (0.0%) |
| Transportation | 5 (100.0%) | 0 (0.0%) |
| Material Moving | 9 (8.7%) | 94 (91.3%) |
| Total (Category) | 42 (30.9%) | 94 (69.1%) |
| Total (Overall) | 98 (39.5%) | 150 (60.5%) |
Employment Industries by Sex in Fordsville
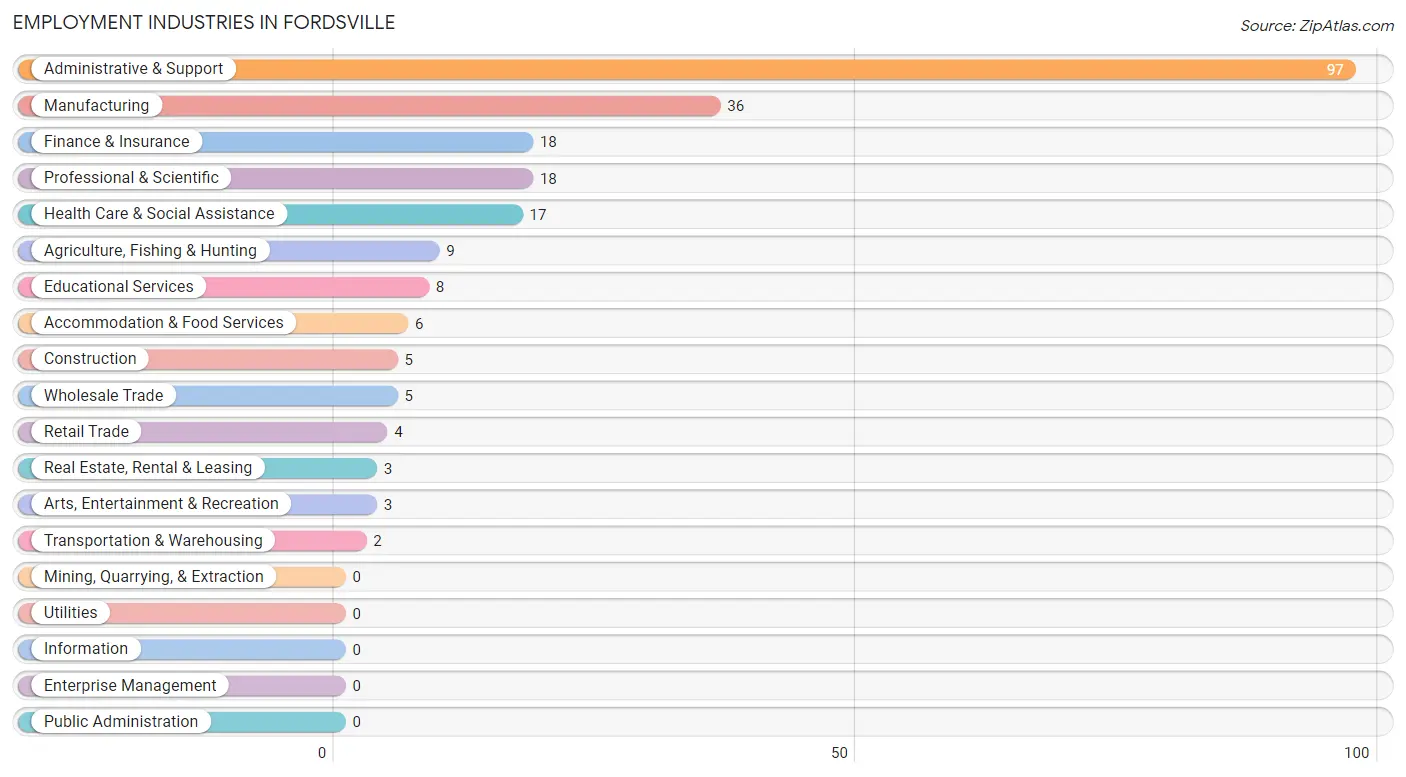
Employment Industries in Fordsville
The major employment industries in Fordsville include Administrative & Support (97 | 39.1%), Manufacturing (36 | 14.5%), Finance & Insurance (18 | 7.3%), Professional & Scientific (18 | 7.3%), and Health Care & Social Assistance (17 | 6.9%).
Employment Industries by Sex in Fordsville
The Fordsville industries that see more men than women are Agriculture, Fishing & Hunting (100.0%), Construction (100.0%), and Manufacturing (100.0%), whereas the industries that tend to have a higher number of women are Retail Trade (100.0%), Finance & Insurance (100.0%), and Educational Services (100.0%).
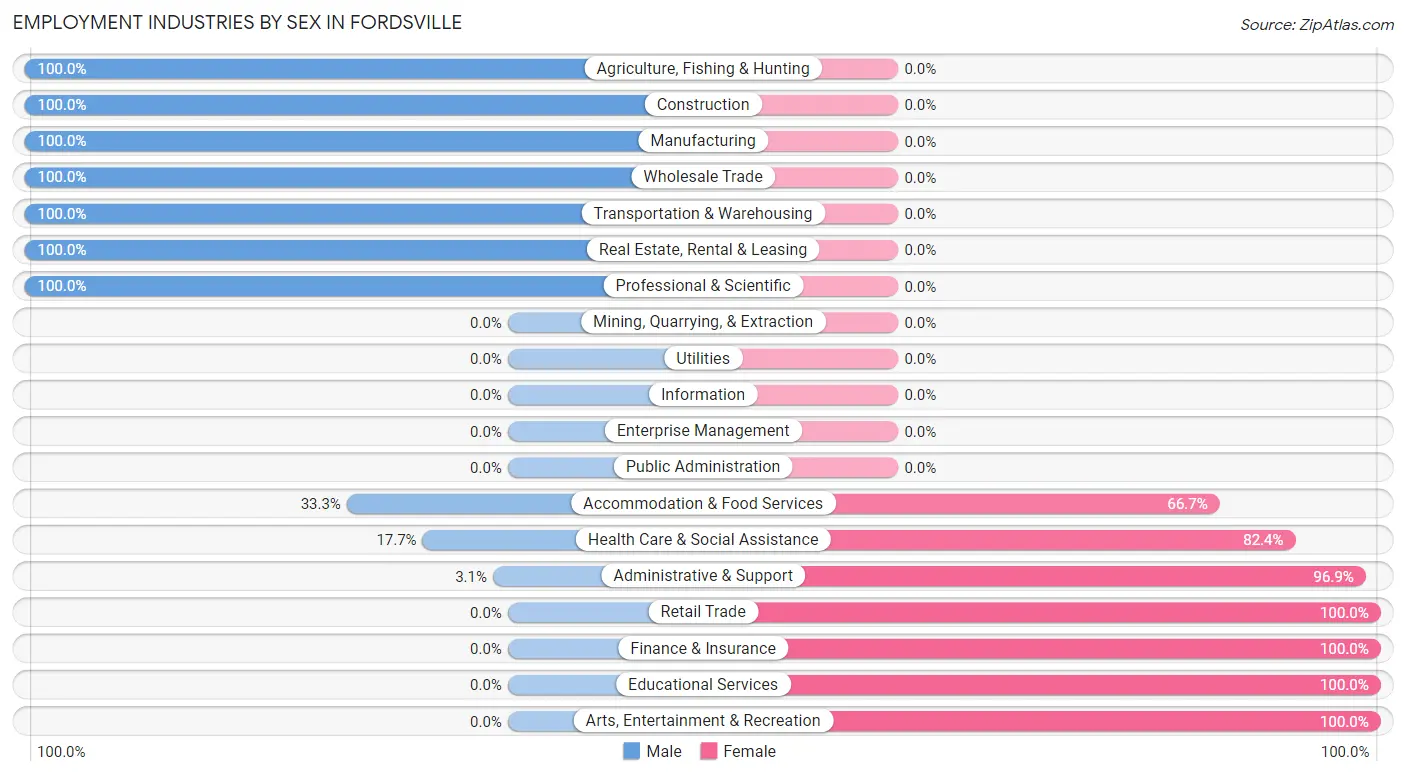
| Industry | Male | Female |
| Agriculture, Fishing & Hunting | 9 (100.0%) | 0 (0.0%) |
| Mining, Quarrying, & Extraction | 0 (0.0%) | 0 (0.0%) |
| Construction | 5 (100.0%) | 0 (0.0%) |
| Manufacturing | 36 (100.0%) | 0 (0.0%) |
| Wholesale Trade | 5 (100.0%) | 0 (0.0%) |
| Retail Trade | 0 (0.0%) | 4 (100.0%) |
| Transportation & Warehousing | 2 (100.0%) | 0 (0.0%) |
| Utilities | 0 (0.0%) | 0 (0.0%) |
| Information | 0 (0.0%) | 0 (0.0%) |
| Finance & Insurance | 0 (0.0%) | 18 (100.0%) |
| Real Estate, Rental & Leasing | 3 (100.0%) | 0 (0.0%) |
| Professional & Scientific | 18 (100.0%) | 0 (0.0%) |
| Enterprise Management | 0 (0.0%) | 0 (0.0%) |
| Administrative & Support | 3 (3.1%) | 94 (96.9%) |
| Educational Services | 0 (0.0%) | 8 (100.0%) |
| Health Care & Social Assistance | 3 (17.6%) | 14 (82.4%) |
| Arts, Entertainment & Recreation | 0 (0.0%) | 3 (100.0%) |
| Accommodation & Food Services | 2 (33.3%) | 4 (66.7%) |
| Public Administration | 0 (0.0%) | 0 (0.0%) |
| Total | 98 (39.5%) | 150 (60.5%) |
Education in Fordsville
School Enrollment in Fordsville
The most common levels of schooling among the 57 students in Fordsville are elementary school (35 | 61.4%), middle school (17 | 29.8%), and high school (4 | 7.0%).
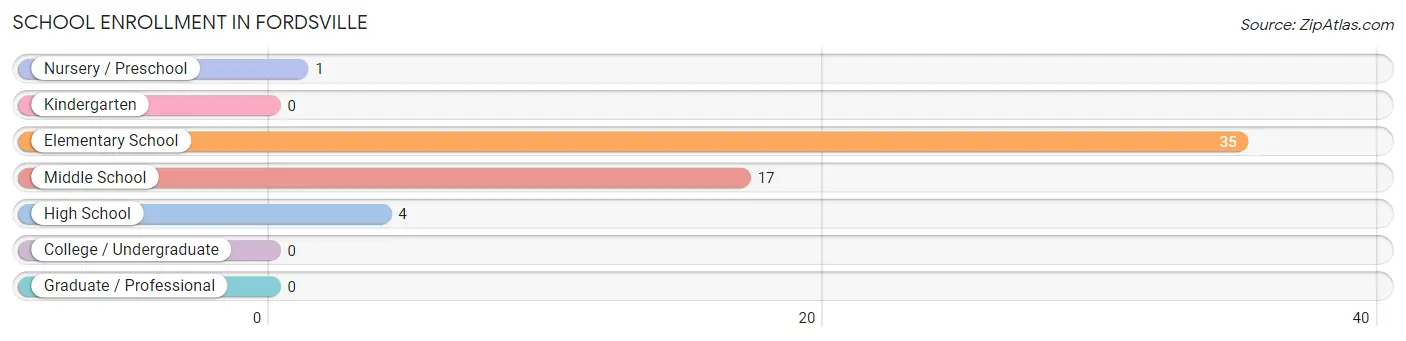
| School Level | # Students | % Students |
| Nursery / Preschool | 1 | 1.8% |
| Kindergarten | 0 | 0.0% |
| Elementary School | 35 | 61.4% |
| Middle School | 17 | 29.8% |
| High School | 4 | 7.0% |
| College / Undergraduate | 0 | 0.0% |
| Graduate / Professional | 0 | 0.0% |
| Total | 57 | 100.0% |
School Enrollment by Age by Funding Source in Fordsville
Out of a total of 57 students who are enrolled in schools in Fordsville, 12 (21.1%) attend a private institution, while the remaining 45 (78.9%) are enrolled in public schools. The age group of 5 to 9 year old has the highest likelihood of being enrolled in private schools, with 12 (52.2% in the age bracket) enrolled. Conversely, the age group of 10 to 14 year olds has the lowest likelihood of being enrolled in a private school, with 31 (100.0% in the age bracket) attending a public institution.
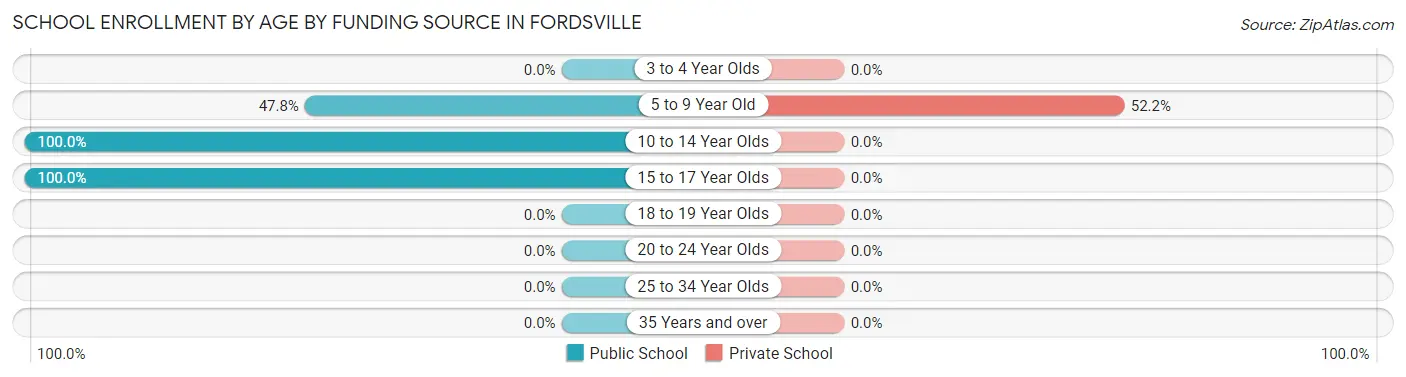
| Age Bracket | Public School | Private School |
| 3 to 4 Year Olds | 0 (0.0%) | 0 (0.0%) |
| 5 to 9 Year Old | 11 (47.8%) | 12 (52.2%) |
| 10 to 14 Year Olds | 31 (100.0%) | 0 (0.0%) |
| 15 to 17 Year Olds | 3 (100.0%) | 0 (0.0%) |
| 18 to 19 Year Olds | 0 (0.0%) | 0 (0.0%) |
| 20 to 24 Year Olds | 0 (0.0%) | 0 (0.0%) |
| 25 to 34 Year Olds | 0 (0.0%) | 0 (0.0%) |
| 35 Years and over | 0 (0.0%) | 0 (0.0%) |
| Total | 45 (78.9%) | 12 (21.1%) |
Educational Attainment by Field of Study in Fordsville
Education (11 | 57.9%), business (5 | 26.3%), and arts & humanities (3 | 15.8%) are the most common fields of study among 19 individuals in Fordsville who have obtained a bachelor's degree or higher.
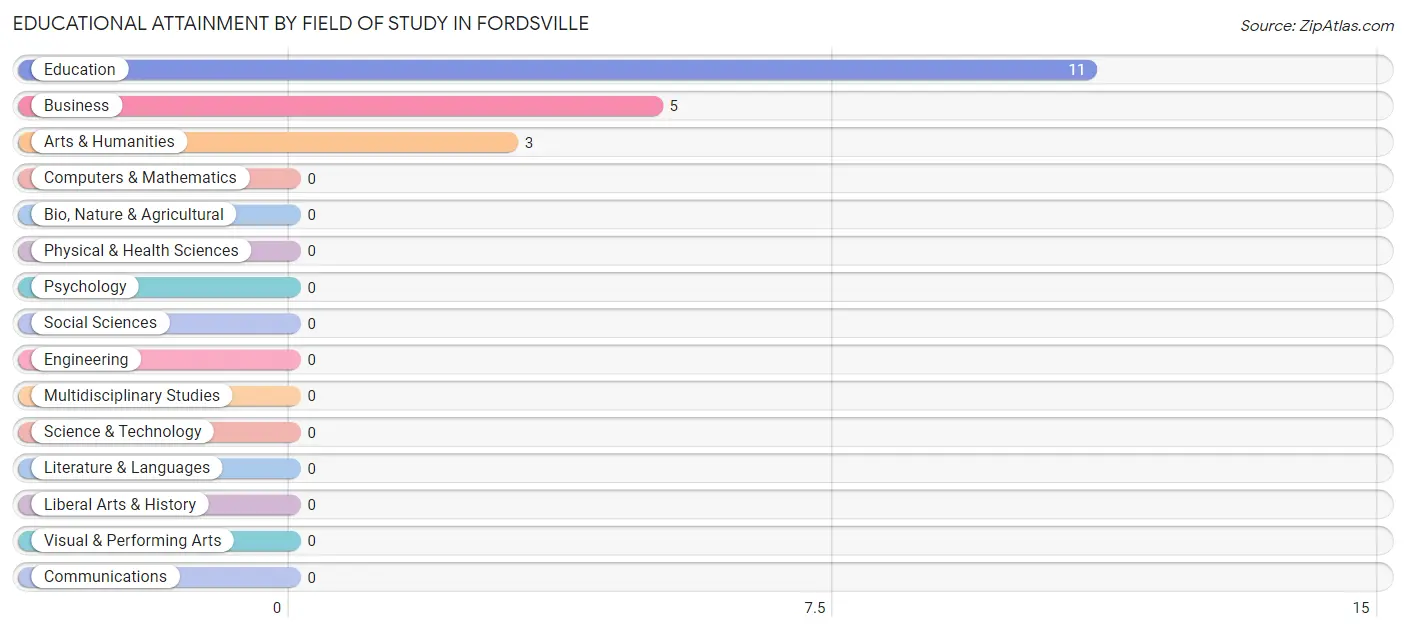
| Field of Study | # Graduates | % Graduates |
| Computers & Mathematics | 0 | 0.0% |
| Bio, Nature & Agricultural | 0 | 0.0% |
| Physical & Health Sciences | 0 | 0.0% |
| Psychology | 0 | 0.0% |
| Social Sciences | 0 | 0.0% |
| Engineering | 0 | 0.0% |
| Multidisciplinary Studies | 0 | 0.0% |
| Science & Technology | 0 | 0.0% |
| Business | 5 | 26.3% |
| Education | 11 | 57.9% |
| Literature & Languages | 0 | 0.0% |
| Liberal Arts & History | 0 | 0.0% |
| Visual & Performing Arts | 0 | 0.0% |
| Communications | 0 | 0.0% |
| Arts & Humanities | 3 | 15.8% |
| Total | 19 | 100.0% |
Transportation & Commute in Fordsville
Vehicle Availability by Sex in Fordsville
The most prevalent vehicle ownership categories in Fordsville are males with 4 vehicles (38, accounting for 38.8%) and females with 4 vehicles (109, making up 25.7%).
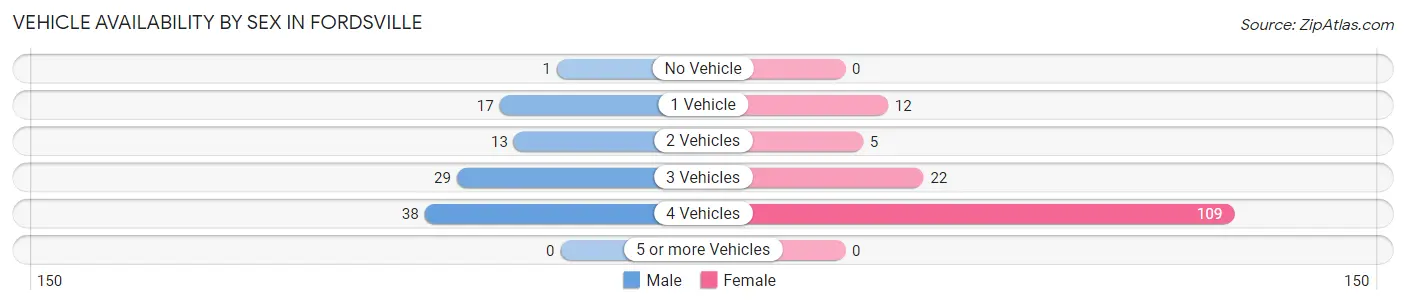
| Vehicles Available | Male | Female |
| No Vehicle | 1 (1.0%) | 0 (0.0%) |
| 1 Vehicle | 17 (17.3%) | 12 (8.1%) |
| 2 Vehicles | 13 (13.3%) | 5 (3.4%) |
| 3 Vehicles | 29 (29.6%) | 22 (14.9%) |
| 4 Vehicles | 38 (38.8%) | 109 (73.7%) |
| 5 or more Vehicles | 0 (0.0%) | 0 (0.0%) |
| Total | 98 (100.0%) | 148 (100.0%) |
Commute Time in Fordsville
The most frequently occuring commute durations in Fordsville are 30 to 34 minutes (127 commuters, 51.6%), 35 to 39 minutes (29 commuters, 11.8%), and 45 to 59 minutes (28 commuters, 11.4%).
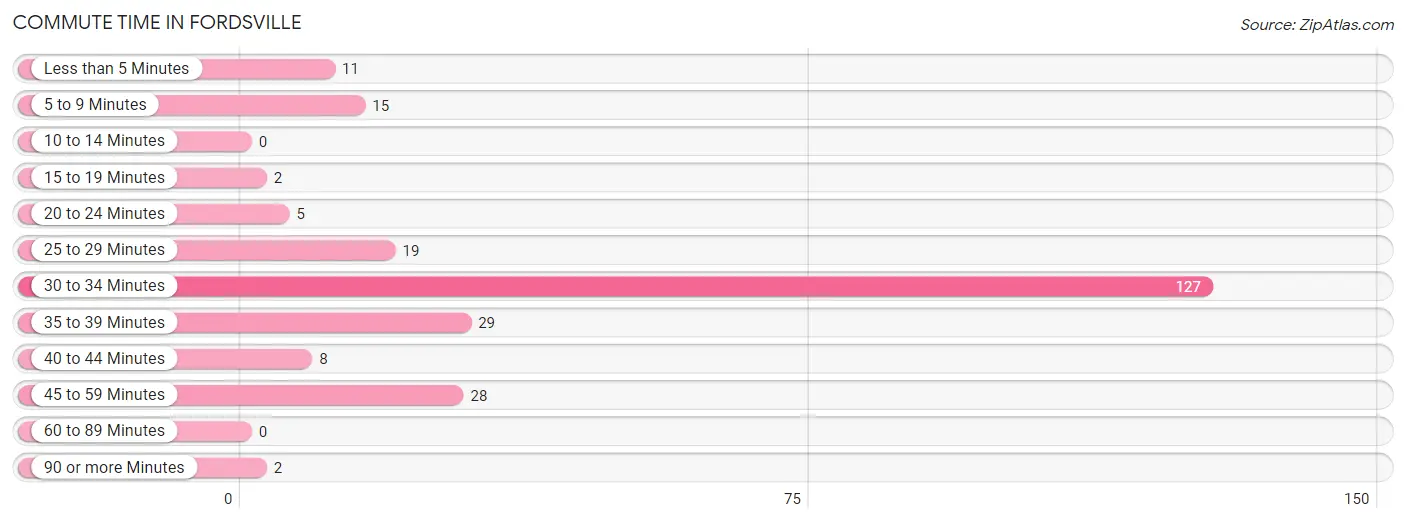
| Commute Time | # Commuters | % Commuters |
| Less than 5 Minutes | 11 | 4.5% |
| 5 to 9 Minutes | 15 | 6.1% |
| 10 to 14 Minutes | 0 | 0.0% |
| 15 to 19 Minutes | 2 | 0.8% |
| 20 to 24 Minutes | 5 | 2.0% |
| 25 to 29 Minutes | 19 | 7.7% |
| 30 to 34 Minutes | 127 | 51.6% |
| 35 to 39 Minutes | 29 | 11.8% |
| 40 to 44 Minutes | 8 | 3.3% |
| 45 to 59 Minutes | 28 | 11.4% |
| 60 to 89 Minutes | 0 | 0.0% |
| 90 or more Minutes | 2 | 0.8% |
Commute Time by Sex in Fordsville
The most common commute times in Fordsville are 30 to 34 minutes (33 commuters, 33.7%) for males and 30 to 34 minutes (94 commuters, 63.5%) for females.
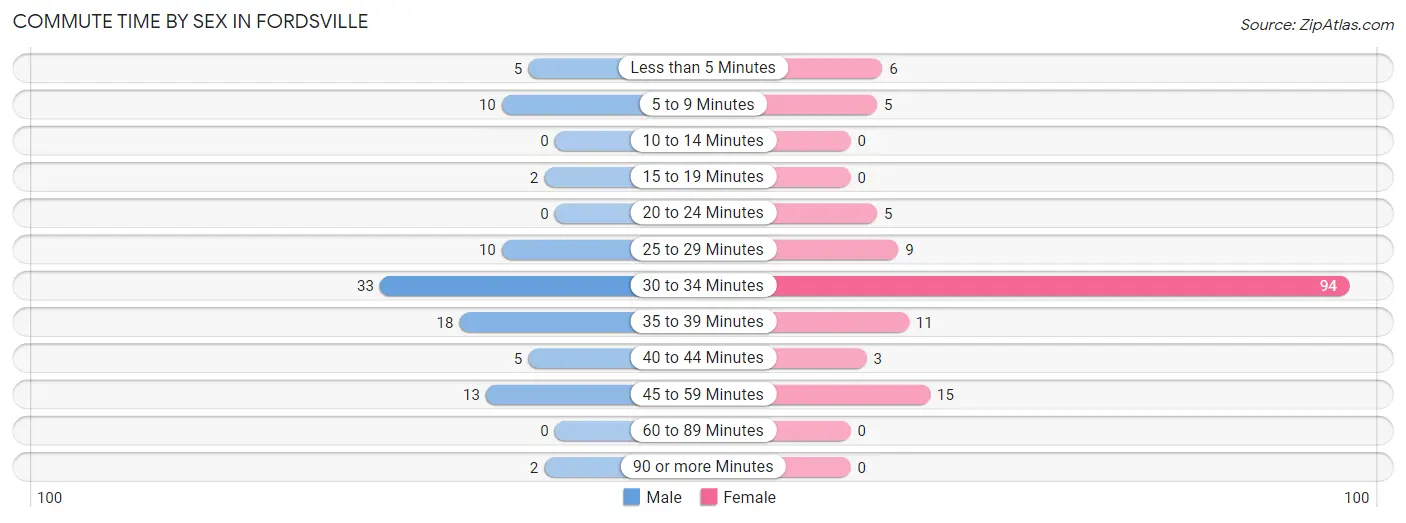
| Commute Time | Male | Female |
| Less than 5 Minutes | 5 (5.1%) | 6 (4.1%) |
| 5 to 9 Minutes | 10 (10.2%) | 5 (3.4%) |
| 10 to 14 Minutes | 0 (0.0%) | 0 (0.0%) |
| 15 to 19 Minutes | 2 (2.0%) | 0 (0.0%) |
| 20 to 24 Minutes | 0 (0.0%) | 5 (3.4%) |
| 25 to 29 Minutes | 10 (10.2%) | 9 (6.1%) |
| 30 to 34 Minutes | 33 (33.7%) | 94 (63.5%) |
| 35 to 39 Minutes | 18 (18.4%) | 11 (7.4%) |
| 40 to 44 Minutes | 5 (5.1%) | 3 (2.0%) |
| 45 to 59 Minutes | 13 (13.3%) | 15 (10.1%) |
| 60 to 89 Minutes | 0 (0.0%) | 0 (0.0%) |
| 90 or more Minutes | 2 (2.0%) | 0 (0.0%) |
Time of Departure to Work by Sex in Fordsville
The most frequent times of departure to work in Fordsville are 5:30 AM to 5:59 AM (28, 28.6%) for males and 7:00 AM to 7:29 AM (114, 77.0%) for females.
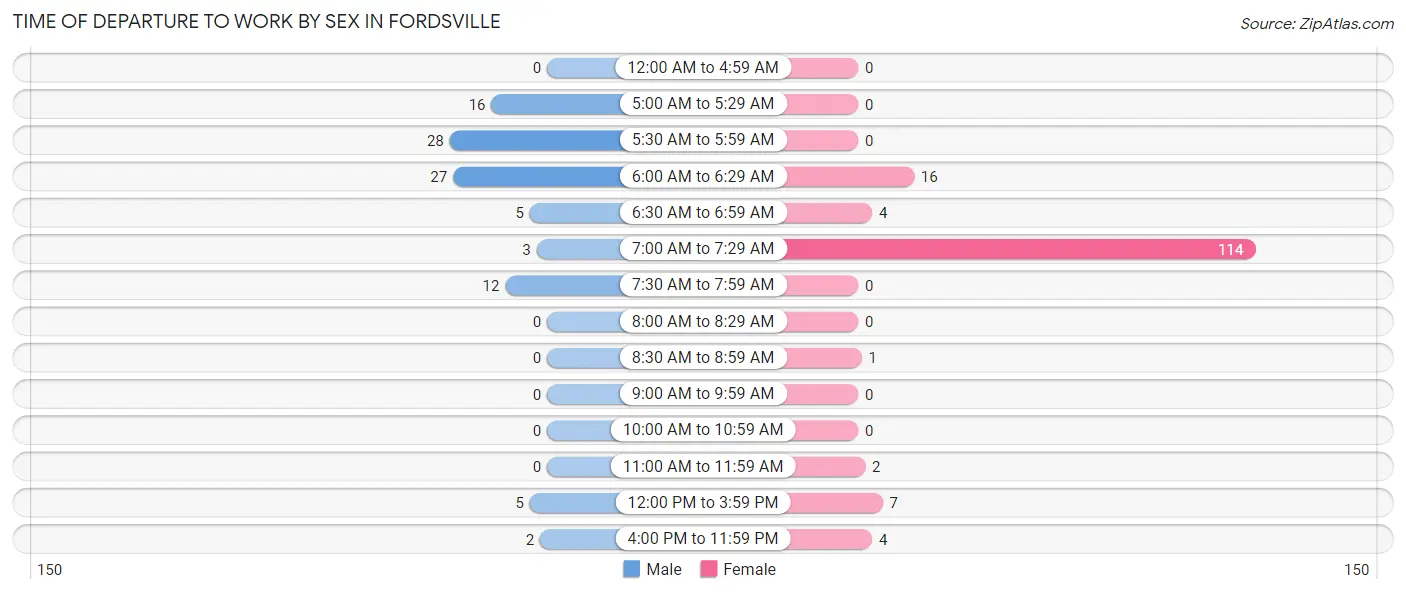
| Time of Departure | Male | Female |
| 12:00 AM to 4:59 AM | 0 (0.0%) | 0 (0.0%) |
| 5:00 AM to 5:29 AM | 16 (16.3%) | 0 (0.0%) |
| 5:30 AM to 5:59 AM | 28 (28.6%) | 0 (0.0%) |
| 6:00 AM to 6:29 AM | 27 (27.6%) | 16 (10.8%) |
| 6:30 AM to 6:59 AM | 5 (5.1%) | 4 (2.7%) |
| 7:00 AM to 7:29 AM | 3 (3.1%) | 114 (77.0%) |
| 7:30 AM to 7:59 AM | 12 (12.2%) | 0 (0.0%) |
| 8:00 AM to 8:29 AM | 0 (0.0%) | 0 (0.0%) |
| 8:30 AM to 8:59 AM | 0 (0.0%) | 1 (0.7%) |
| 9:00 AM to 9:59 AM | 0 (0.0%) | 0 (0.0%) |
| 10:00 AM to 10:59 AM | 0 (0.0%) | 0 (0.0%) |
| 11:00 AM to 11:59 AM | 0 (0.0%) | 2 (1.3%) |
| 12:00 PM to 3:59 PM | 5 (5.1%) | 7 (4.7%) |
| 4:00 PM to 11:59 PM | 2 (2.0%) | 4 (2.7%) |
| Total | 98 (100.0%) | 148 (100.0%) |
Housing Occupancy in Fordsville
Occupancy by Ownership in Fordsville
Of the total 161 dwellings in Fordsville, owner-occupied units account for 115 (71.4%), while renter-occupied units make up 46 (28.6%).
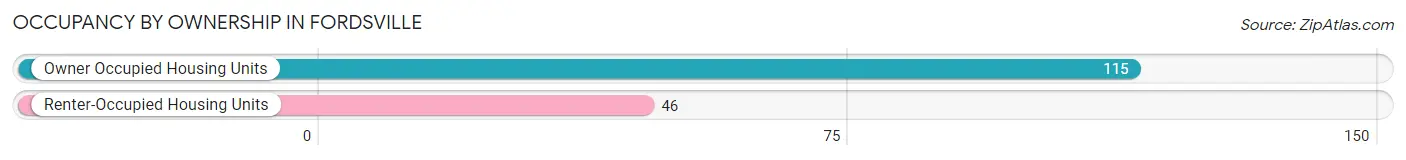
| Occupancy | # Housing Units | % Housing Units |
| Owner Occupied Housing Units | 115 | 71.4% |
| Renter-Occupied Housing Units | 46 | 28.6% |
| Total Occupied Housing Units | 161 | 100.0% |
Occupancy by Household Size in Fordsville
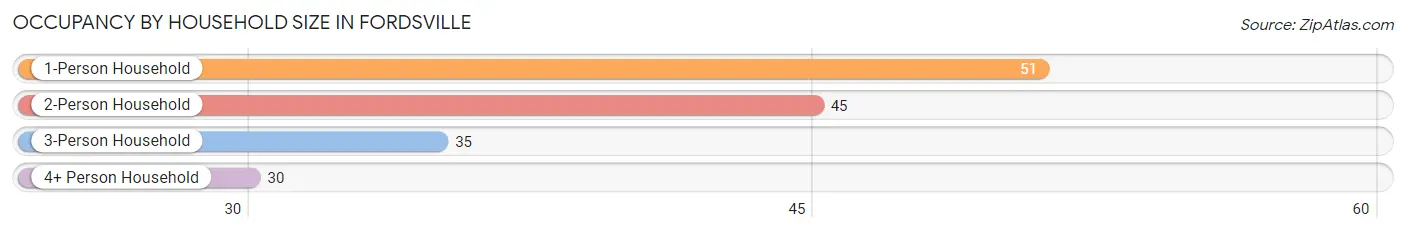
| Household Size | # Housing Units | % Housing Units |
| 1-Person Household | 51 | 31.7% |
| 2-Person Household | 45 | 28.0% |
| 3-Person Household | 35 | 21.7% |
| 4+ Person Household | 30 | 18.6% |
| Total Housing Units | 161 | 100.0% |
Occupancy by Ownership by Household Size in Fordsville
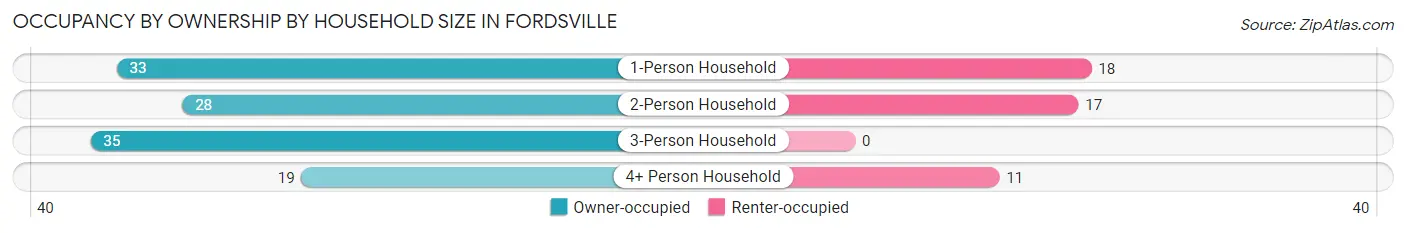
| Household Size | Owner-occupied | Renter-occupied |
| 1-Person Household | 33 (64.7%) | 18 (35.3%) |
| 2-Person Household | 28 (62.2%) | 17 (37.8%) |
| 3-Person Household | 35 (100.0%) | 0 (0.0%) |
| 4+ Person Household | 19 (63.3%) | 11 (36.7%) |
| Total Housing Units | 115 (71.4%) | 46 (28.6%) |
Occupancy by Educational Attainment in Fordsville
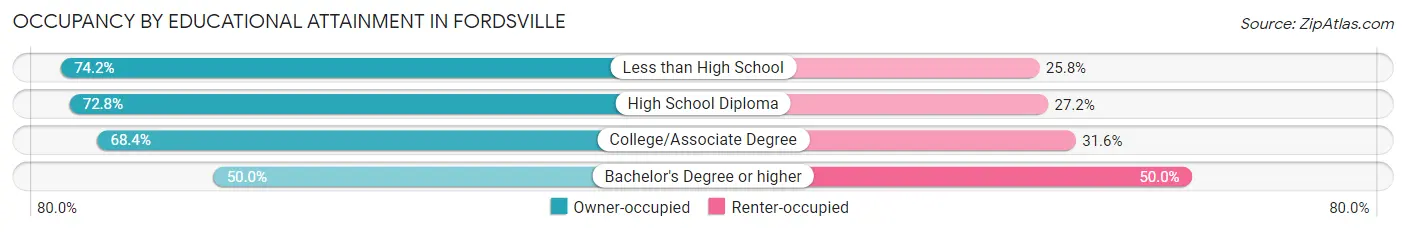
| Household Size | Owner-occupied | Renter-occupied |
| Less than High School | 23 (74.2%) | 8 (25.8%) |
| High School Diploma | 75 (72.8%) | 28 (27.2%) |
| College/Associate Degree | 13 (68.4%) | 6 (31.6%) |
| Bachelor's Degree or higher | 4 (50.0%) | 4 (50.0%) |
Occupancy by Age of Householder in Fordsville
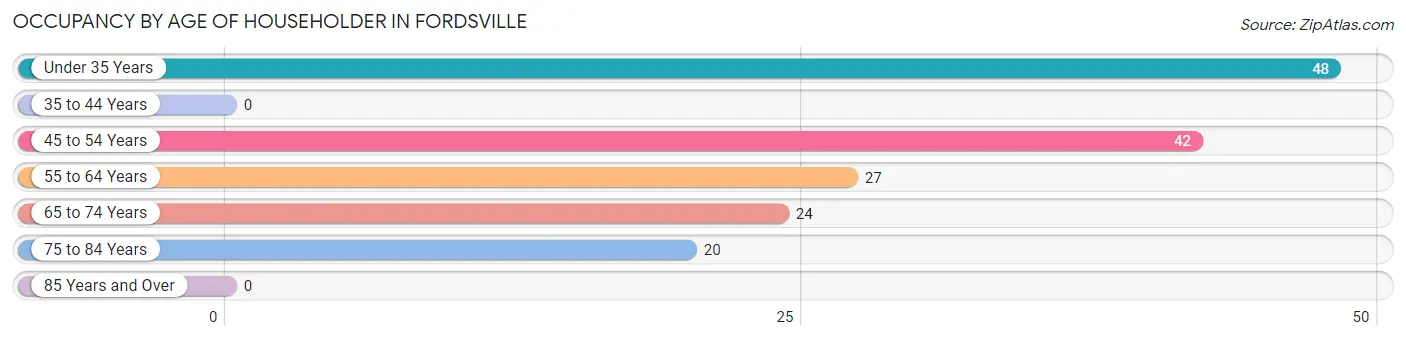
| Age Bracket | # Households | % Households |
| Under 35 Years | 48 | 29.8% |
| 35 to 44 Years | 0 | 0.0% |
| 45 to 54 Years | 42 | 26.1% |
| 55 to 64 Years | 27 | 16.8% |
| 65 to 74 Years | 24 | 14.9% |
| 75 to 84 Years | 20 | 12.4% |
| 85 Years and Over | 0 | 0.0% |
| Total | 161 | 100.0% |
Housing Finances in Fordsville
Median Income by Occupancy in Fordsville
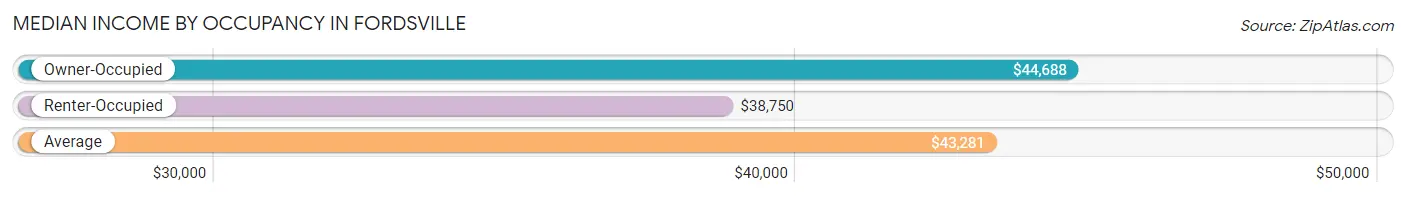
| Occupancy Type | # Households | Median Income |
| Owner-Occupied | 115 (71.4%) | $44,688 |
| Renter-Occupied | 46 (28.6%) | $38,750 |
| Average | 161 (100.0%) | $43,281 |
Occupancy by Householder Income Bracket in Fordsville
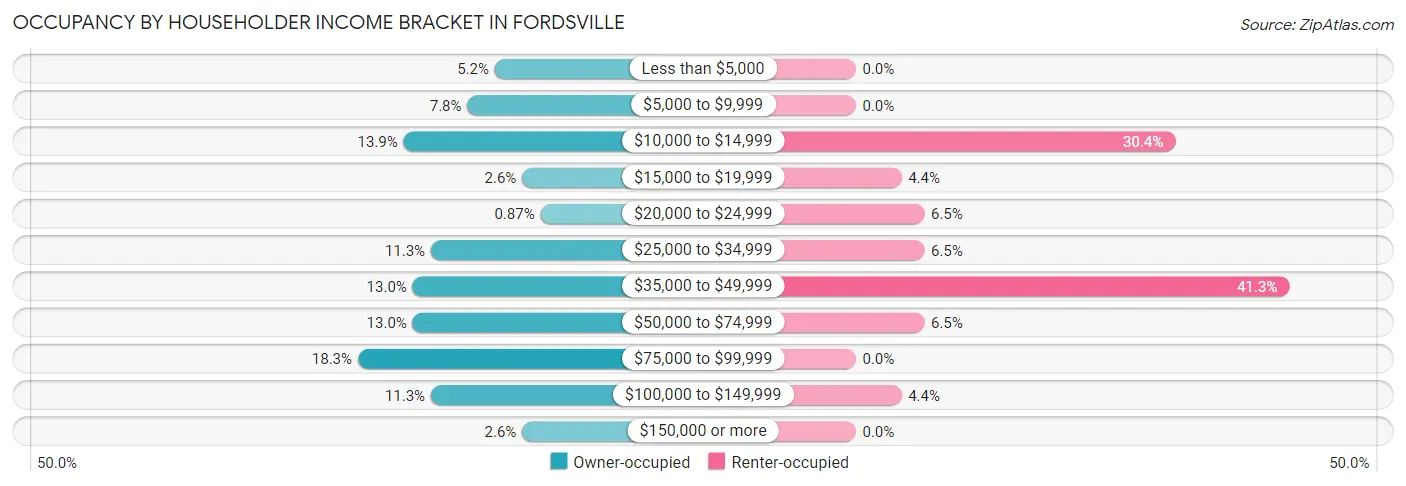
| Income Bracket | Owner-occupied | Renter-occupied |
| Less than $5,000 | 6 (5.2%) | 0 (0.0%) |
| $5,000 to $9,999 | 9 (7.8%) | 0 (0.0%) |
| $10,000 to $14,999 | 16 (13.9%) | 14 (30.4%) |
| $15,000 to $19,999 | 3 (2.6%) | 2 (4.3%) |
| $20,000 to $24,999 | 1 (0.9%) | 3 (6.5%) |
| $25,000 to $34,999 | 13 (11.3%) | 3 (6.5%) |
| $35,000 to $49,999 | 15 (13.0%) | 19 (41.3%) |
| $50,000 to $74,999 | 15 (13.0%) | 3 (6.5%) |
| $75,000 to $99,999 | 21 (18.3%) | 0 (0.0%) |
| $100,000 to $149,999 | 13 (11.3%) | 2 (4.3%) |
| $150,000 or more | 3 (2.6%) | 0 (0.0%) |
| Total | 115 (100.0%) | 46 (100.0%) |
Monthly Housing Cost Tiers in Fordsville
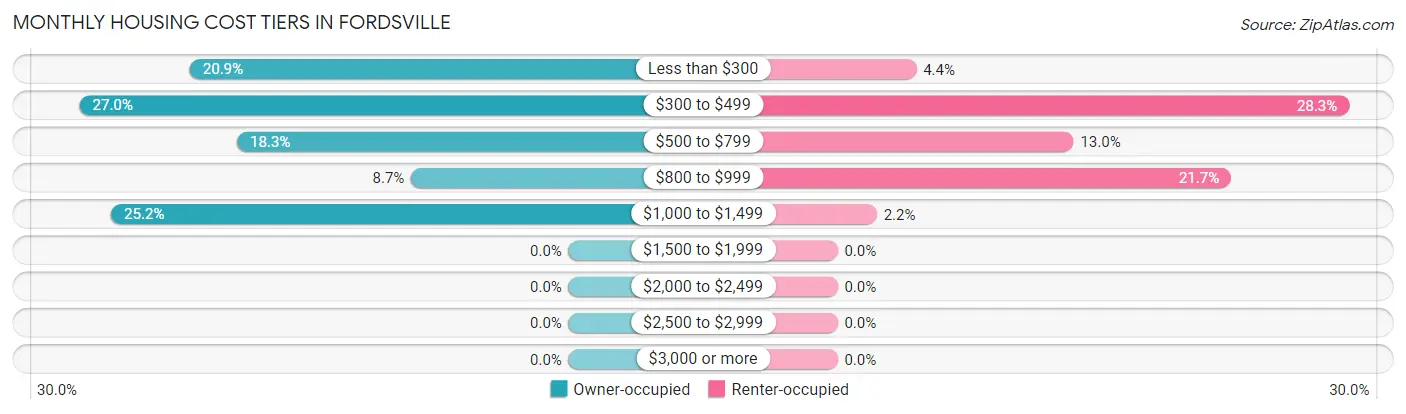
| Monthly Cost | Owner-occupied | Renter-occupied |
| Less than $300 | 24 (20.9%) | 2 (4.3%) |
| $300 to $499 | 31 (27.0%) | 13 (28.3%) |
| $500 to $799 | 21 (18.3%) | 6 (13.0%) |
| $800 to $999 | 10 (8.7%) | 10 (21.7%) |
| $1,000 to $1,499 | 29 (25.2%) | 1 (2.2%) |
| $1,500 to $1,999 | 0 (0.0%) | 0 (0.0%) |
| $2,000 to $2,499 | 0 (0.0%) | 0 (0.0%) |
| $2,500 to $2,999 | 0 (0.0%) | 0 (0.0%) |
| $3,000 or more | 0 (0.0%) | 0 (0.0%) |
| Total | 115 (100.0%) | 46 (100.0%) |
Physical Housing Characteristics in Fordsville
Housing Structures in Fordsville
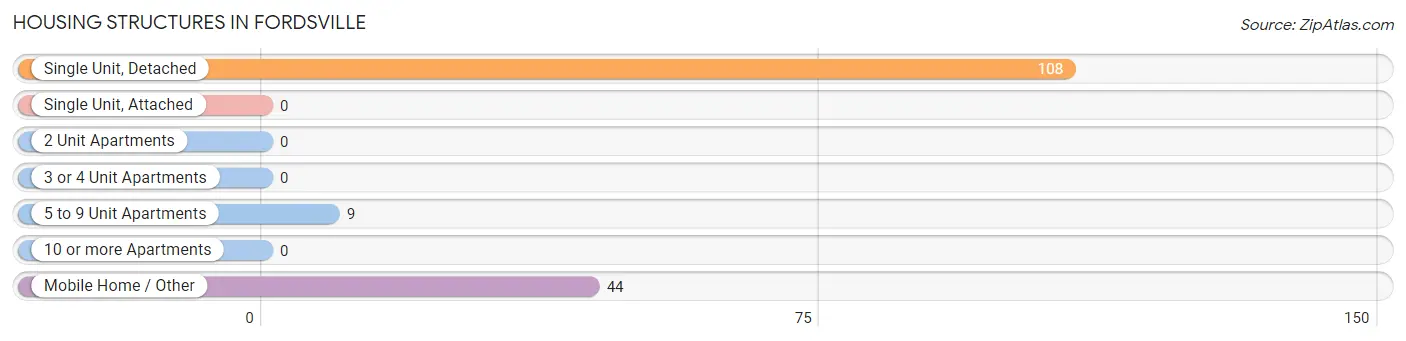
| Structure Type | # Housing Units | % Housing Units |
| Single Unit, Detached | 108 | 67.1% |
| Single Unit, Attached | 0 | 0.0% |
| 2 Unit Apartments | 0 | 0.0% |
| 3 or 4 Unit Apartments | 0 | 0.0% |
| 5 to 9 Unit Apartments | 9 | 5.6% |
| 10 or more Apartments | 0 | 0.0% |
| Mobile Home / Other | 44 | 27.3% |
| Total | 161 | 100.0% |
Housing Structures by Occupancy in Fordsville
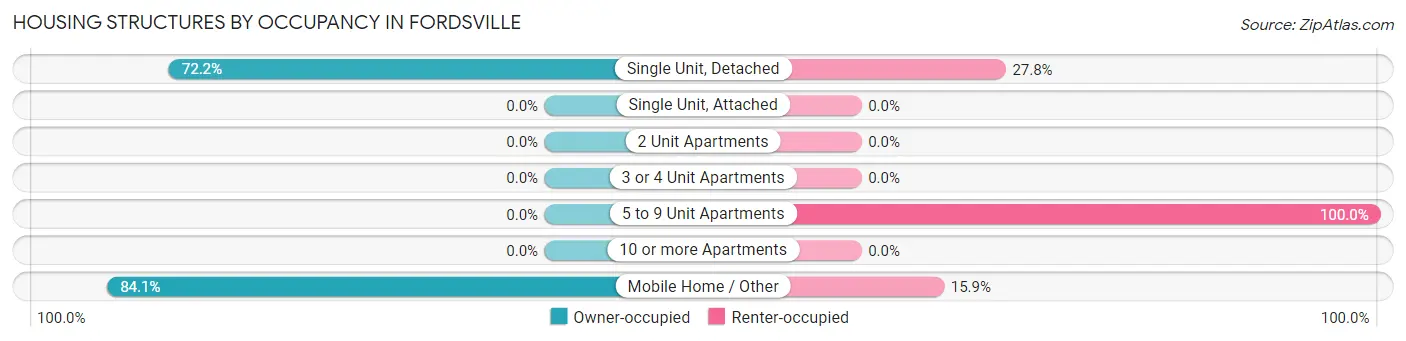
| Structure Type | Owner-occupied | Renter-occupied |
| Single Unit, Detached | 78 (72.2%) | 30 (27.8%) |
| Single Unit, Attached | 0 (0.0%) | 0 (0.0%) |
| 2 Unit Apartments | 0 (0.0%) | 0 (0.0%) |
| 3 or 4 Unit Apartments | 0 (0.0%) | 0 (0.0%) |
| 5 to 9 Unit Apartments | 0 (0.0%) | 9 (100.0%) |
| 10 or more Apartments | 0 (0.0%) | 0 (0.0%) |
| Mobile Home / Other | 37 (84.1%) | 7 (15.9%) |
| Total | 115 (71.4%) | 46 (28.6%) |
Housing Structures by Number of Rooms in Fordsville
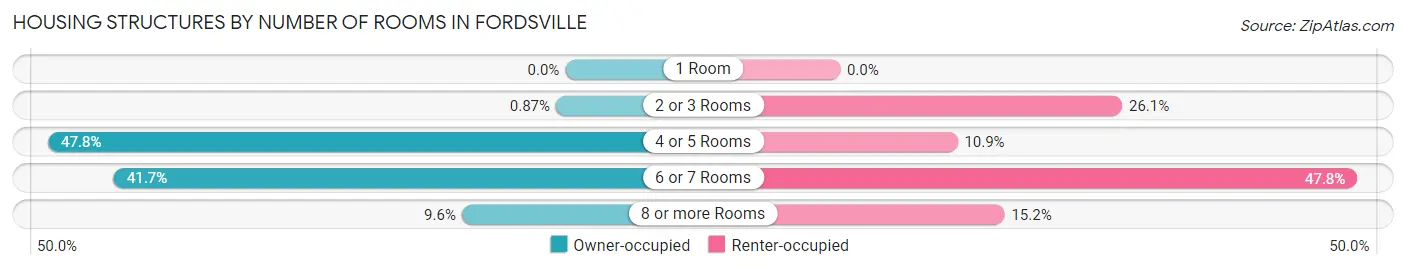
| Number of Rooms | Owner-occupied | Renter-occupied |
| 1 Room | 0 (0.0%) | 0 (0.0%) |
| 2 or 3 Rooms | 1 (0.9%) | 12 (26.1%) |
| 4 or 5 Rooms | 55 (47.8%) | 5 (10.9%) |
| 6 or 7 Rooms | 48 (41.7%) | 22 (47.8%) |
| 8 or more Rooms | 11 (9.6%) | 7 (15.2%) |
| Total | 115 (100.0%) | 46 (100.0%) |
Housing Structure by Heating Type in Fordsville
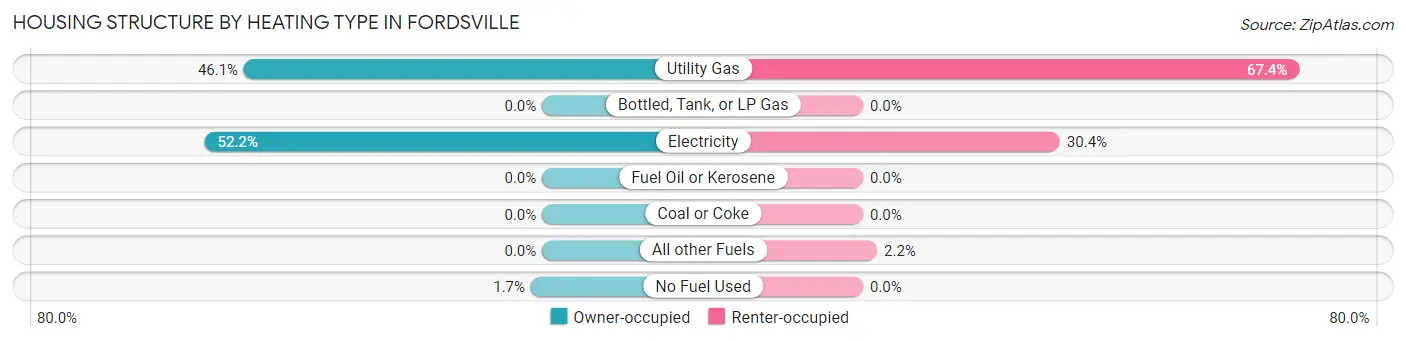
| Heating Type | Owner-occupied | Renter-occupied |
| Utility Gas | 53 (46.1%) | 31 (67.4%) |
| Bottled, Tank, or LP Gas | 0 (0.0%) | 0 (0.0%) |
| Electricity | 60 (52.2%) | 14 (30.4%) |
| Fuel Oil or Kerosene | 0 (0.0%) | 0 (0.0%) |
| Coal or Coke | 0 (0.0%) | 0 (0.0%) |
| All other Fuels | 0 (0.0%) | 1 (2.2%) |
| No Fuel Used | 2 (1.7%) | 0 (0.0%) |
| Total | 115 (100.0%) | 46 (100.0%) |
Household Vehicle Usage in Fordsville
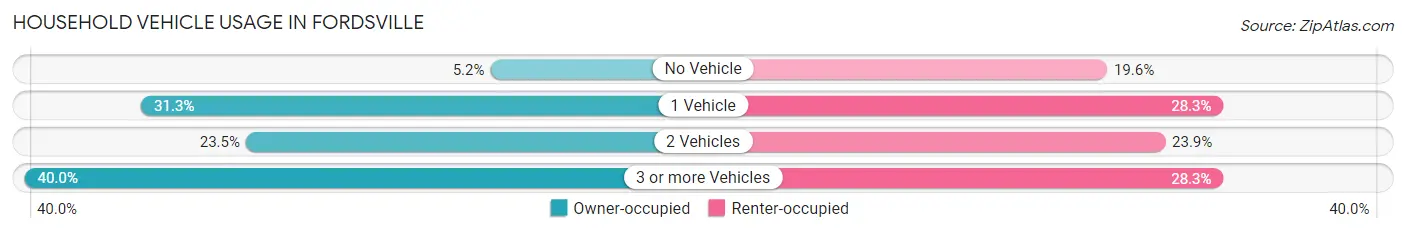
| Vehicles per Household | Owner-occupied | Renter-occupied |
| No Vehicle | 6 (5.2%) | 9 (19.6%) |
| 1 Vehicle | 36 (31.3%) | 13 (28.3%) |
| 2 Vehicles | 27 (23.5%) | 11 (23.9%) |
| 3 or more Vehicles | 46 (40.0%) | 13 (28.3%) |
| Total | 115 (100.0%) | 46 (100.0%) |
Real Estate & Mortgages in Fordsville
Real Estate and Mortgage Overview in Fordsville
| Characteristic | Without Mortgage | With Mortgage |
| Housing Units | 53 | 62 |
| Median Property Value | $45,600 | $108,300 |
| Median Household Income | $23,750 | $0 |
| Monthly Housing Costs | $356 | $0 |
| Real Estate Taxes | $236 | $4 |
Property Value by Mortgage Status in Fordsville
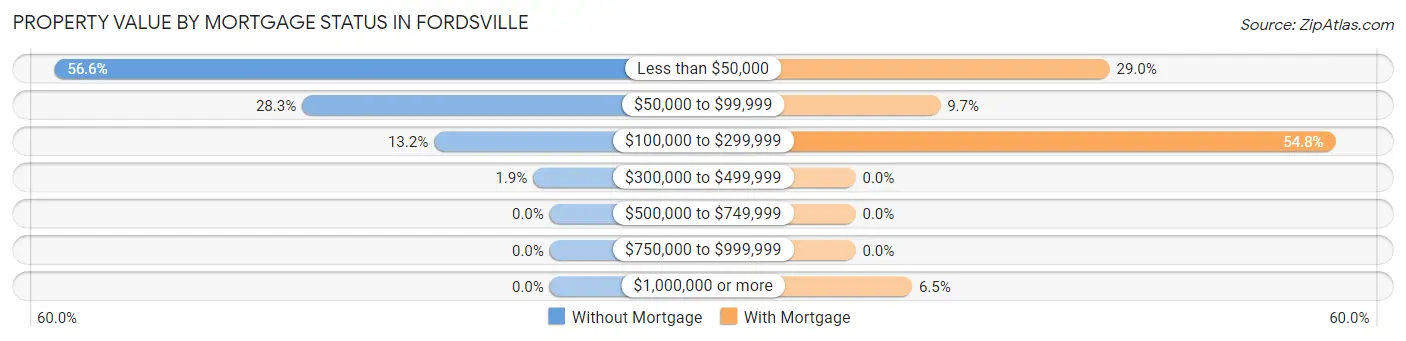
| Property Value | Without Mortgage | With Mortgage |
| Less than $50,000 | 30 (56.6%) | 18 (29.0%) |
| $50,000 to $99,999 | 15 (28.3%) | 6 (9.7%) |
| $100,000 to $299,999 | 7 (13.2%) | 34 (54.8%) |
| $300,000 to $499,999 | 1 (1.9%) | 0 (0.0%) |
| $500,000 to $749,999 | 0 (0.0%) | 0 (0.0%) |
| $750,000 to $999,999 | 0 (0.0%) | 0 (0.0%) |
| $1,000,000 or more | 0 (0.0%) | 4 (6.5%) |
| Total | 53 (100.0%) | 62 (100.0%) |
Household Income by Mortgage Status in Fordsville
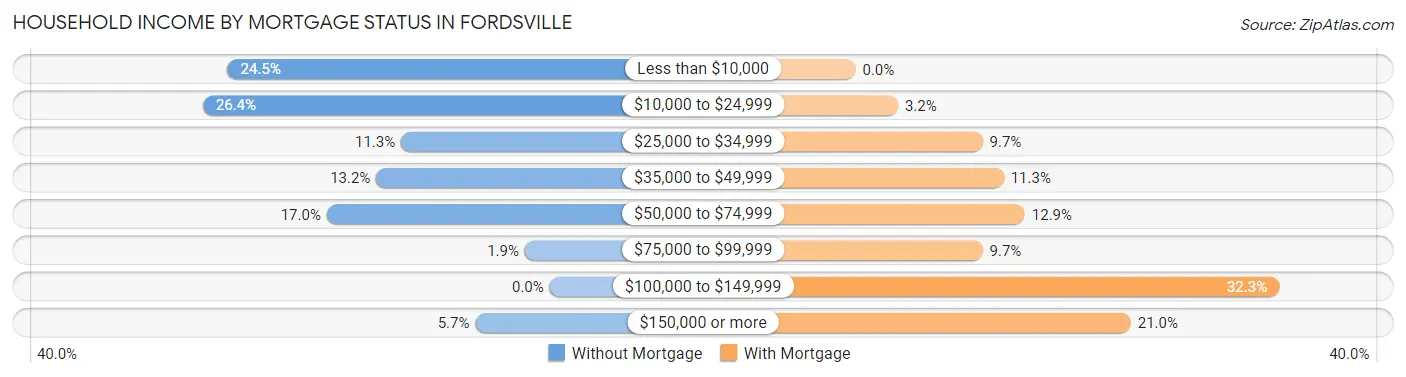
| Household Income | Without Mortgage | With Mortgage |
| Less than $10,000 | 13 (24.5%) | 0 (0.0%) |
| $10,000 to $24,999 | 14 (26.4%) | 2 (3.2%) |
| $25,000 to $34,999 | 6 (11.3%) | 6 (9.7%) |
| $35,000 to $49,999 | 7 (13.2%) | 7 (11.3%) |
| $50,000 to $74,999 | 9 (17.0%) | 8 (12.9%) |
| $75,000 to $99,999 | 1 (1.9%) | 6 (9.7%) |
| $100,000 to $149,999 | 0 (0.0%) | 20 (32.3%) |
| $150,000 or more | 3 (5.7%) | 13 (21.0%) |
| Total | 53 (100.0%) | 62 (100.0%) |
Property Value to Household Income Ratio in Fordsville
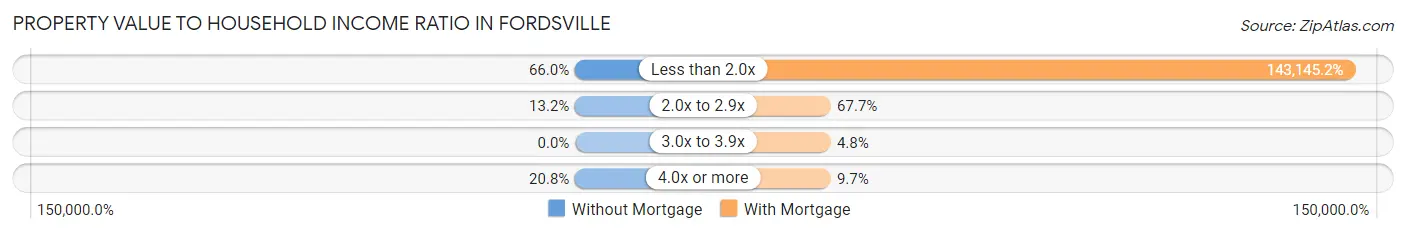
| Value-to-Income Ratio | Without Mortgage | With Mortgage |
| Less than 2.0x | 35 (66.0%) | 88,750 (143,145.2%) |
| 2.0x to 2.9x | 7 (13.2%) | 42 (67.7%) |
| 3.0x to 3.9x | 0 (0.0%) | 3 (4.8%) |
| 4.0x or more | 11 (20.7%) | 6 (9.7%) |
| Total | 53 (100.0%) | 62 (100.0%) |
Real Estate Taxes by Mortgage Status in Fordsville
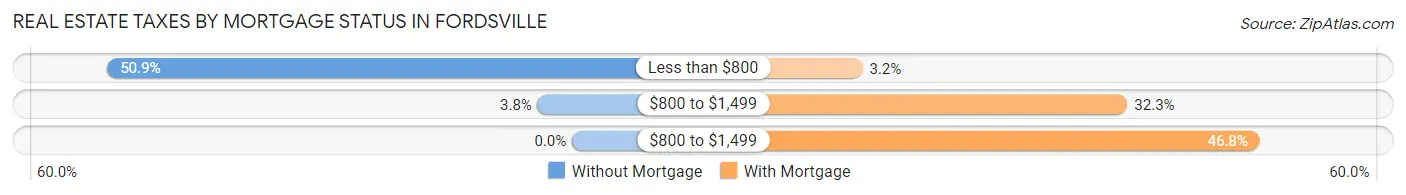
| Property Taxes | Without Mortgage | With Mortgage |
| Less than $800 | 27 (50.9%) | 2 (3.2%) |
| $800 to $1,499 | 2 (3.8%) | 20 (32.3%) |
| $800 to $1,499 | 0 (0.0%) | 29 (46.8%) |
| Total | 53 (100.0%) | 62 (100.0%) |
Health & Disability in Fordsville
Health Insurance Coverage by Age in Fordsville
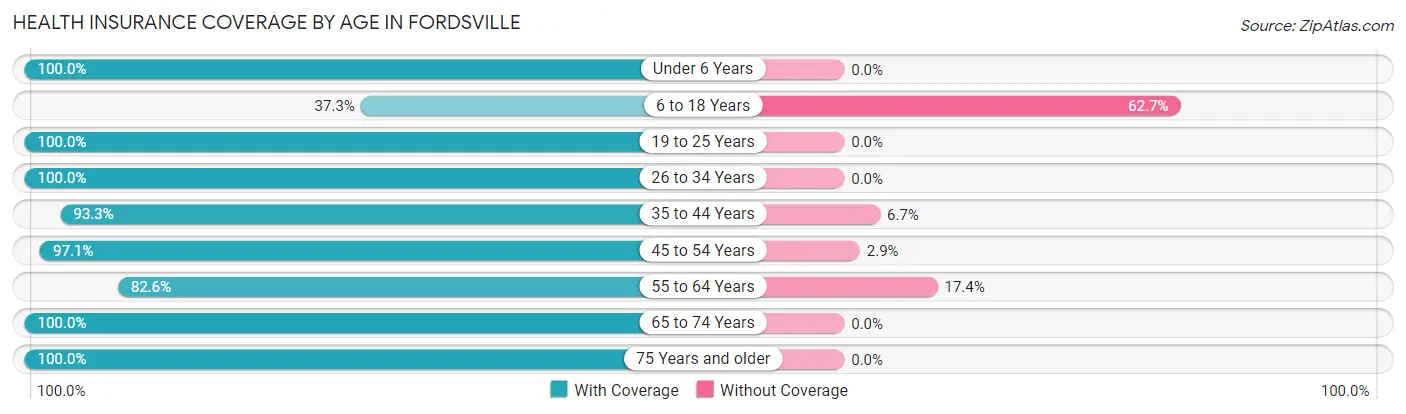
| Age Bracket | With Coverage | Without Coverage |
| Under 6 Years | 38 (100.0%) | 0 (0.0%) |
| 6 to 18 Years | 56 (37.3%) | 94 (62.7%) |
| 19 to 25 Years | 28 (100.0%) | 0 (0.0%) |
| 26 to 34 Years | 67 (100.0%) | 0 (0.0%) |
| 35 to 44 Years | 14 (93.3%) | 1 (6.7%) |
| 45 to 54 Years | 67 (97.1%) | 2 (2.9%) |
| 55 to 64 Years | 38 (82.6%) | 8 (17.4%) |
| 65 to 74 Years | 42 (100.0%) | 0 (0.0%) |
| 75 Years and older | 28 (100.0%) | 0 (0.0%) |
| Total | 378 (78.3%) | 105 (21.7%) |
Health Insurance Coverage by Citizenship Status in Fordsville
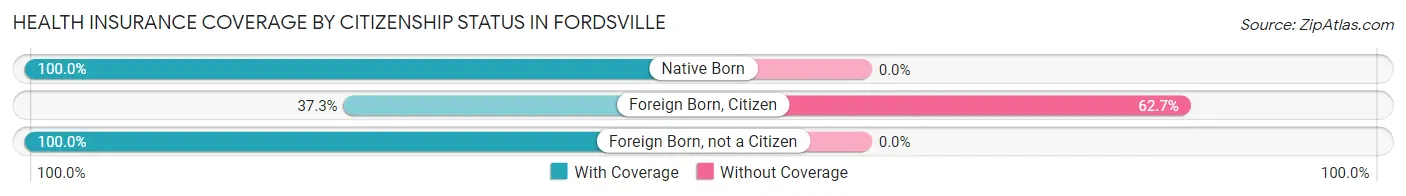
| Citizenship Status | With Coverage | Without Coverage |
| Native Born | 38 (100.0%) | 0 (0.0%) |
| Foreign Born, Citizen | 56 (37.3%) | 94 (62.7%) |
| Foreign Born, not a Citizen | 28 (100.0%) | 0 (0.0%) |
Health Insurance Coverage by Household Income in Fordsville
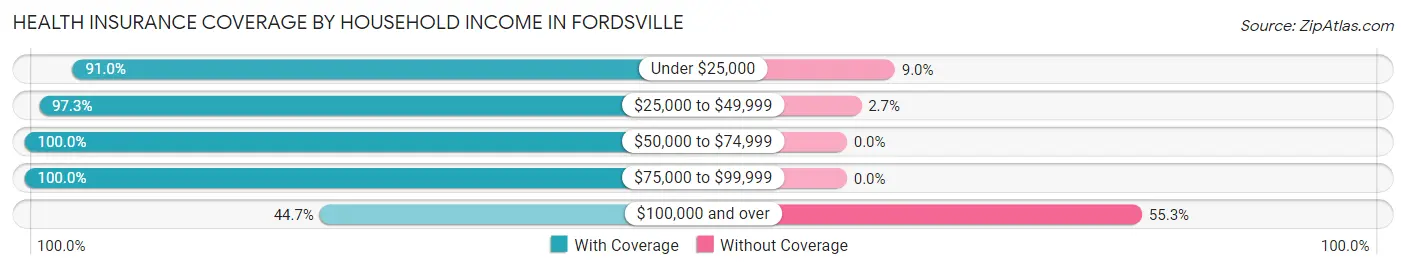
| Household Income | With Coverage | Without Coverage |
| Under $25,000 | 81 (91.0%) | 8 (9.0%) |
| $25,000 to $49,999 | 108 (97.3%) | 3 (2.7%) |
| $50,000 to $74,999 | 41 (100.0%) | 0 (0.0%) |
| $75,000 to $99,999 | 72 (100.0%) | 0 (0.0%) |
| $100,000 and over | 76 (44.7%) | 94 (55.3%) |
Public vs Private Health Insurance Coverage by Age in Fordsville
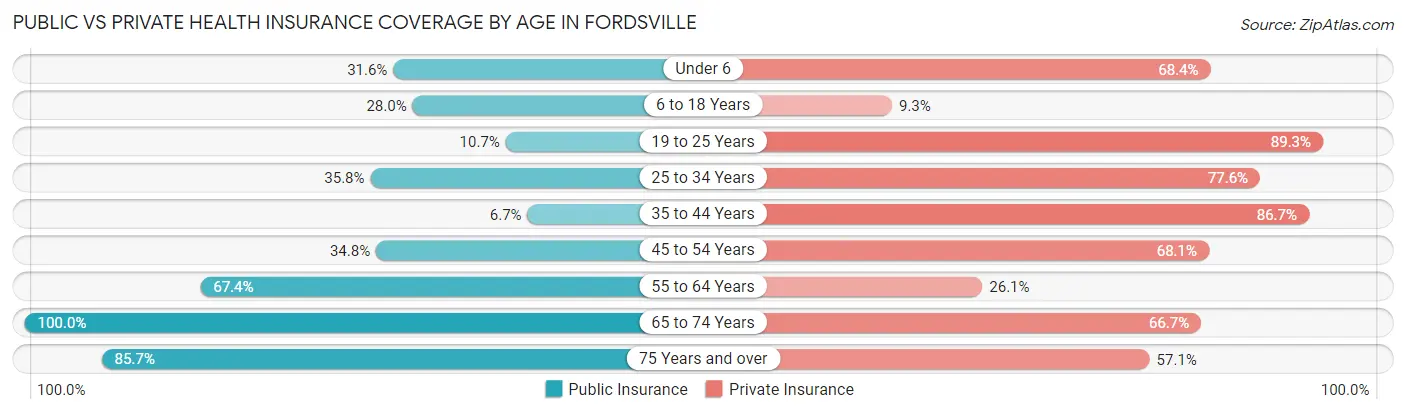
| Age Bracket | Public Insurance | Private Insurance |
| Under 6 | 12 (31.6%) | 26 (68.4%) |
| 6 to 18 Years | 42 (28.0%) | 14 (9.3%) |
| 19 to 25 Years | 3 (10.7%) | 25 (89.3%) |
| 25 to 34 Years | 24 (35.8%) | 52 (77.6%) |
| 35 to 44 Years | 1 (6.7%) | 13 (86.7%) |
| 45 to 54 Years | 24 (34.8%) | 47 (68.1%) |
| 55 to 64 Years | 31 (67.4%) | 12 (26.1%) |
| 65 to 74 Years | 42 (100.0%) | 28 (66.7%) |
| 75 Years and over | 24 (85.7%) | 16 (57.1%) |
| Total | 203 (42.0%) | 233 (48.2%) |
Disability Status by Sex by Age in Fordsville
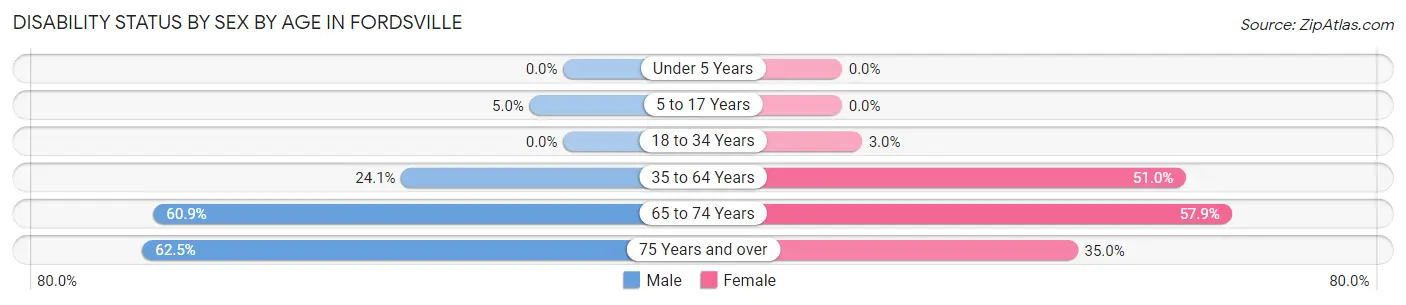
| Age Bracket | Male | Female |
| Under 5 Years | 0 (0.0%) | 0 (0.0%) |
| 5 to 17 Years | 1 (5.0%) | 0 (0.0%) |
| 18 to 34 Years | 0 (0.0%) | 4 (3.0%) |
| 35 to 64 Years | 19 (24.0%) | 26 (51.0%) |
| 65 to 74 Years | 14 (60.9%) | 11 (57.9%) |
| 75 Years and over | 5 (62.5%) | 7 (35.0%) |
Disability Class by Sex by Age in Fordsville
Disability Class: Hearing Difficulty
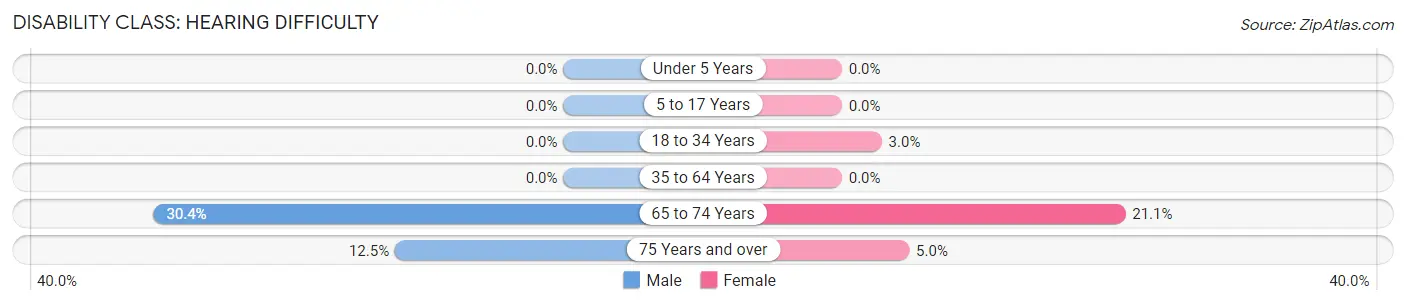
| Age Bracket | Male | Female |
| Under 5 Years | 0 (0.0%) | 0 (0.0%) |
| 5 to 17 Years | 0 (0.0%) | 0 (0.0%) |
| 18 to 34 Years | 0 (0.0%) | 4 (3.0%) |
| 35 to 64 Years | 0 (0.0%) | 0 (0.0%) |
| 65 to 74 Years | 7 (30.4%) | 4 (21.0%) |
| 75 Years and over | 1 (12.5%) | 1 (5.0%) |
Disability Class: Vision Difficulty
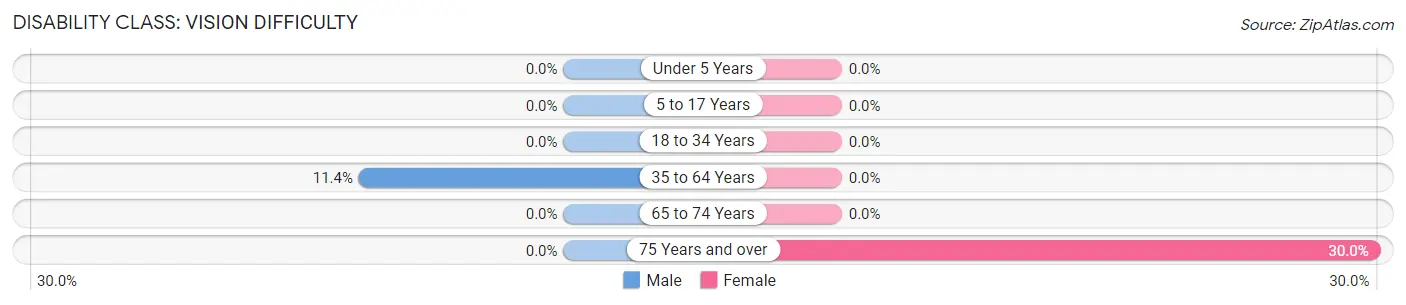
| Age Bracket | Male | Female |
| Under 5 Years | 0 (0.0%) | 0 (0.0%) |
| 5 to 17 Years | 0 (0.0%) | 0 (0.0%) |
| 18 to 34 Years | 0 (0.0%) | 0 (0.0%) |
| 35 to 64 Years | 9 (11.4%) | 0 (0.0%) |
| 65 to 74 Years | 0 (0.0%) | 0 (0.0%) |
| 75 Years and over | 0 (0.0%) | 6 (30.0%) |
Disability Class: Cognitive Difficulty
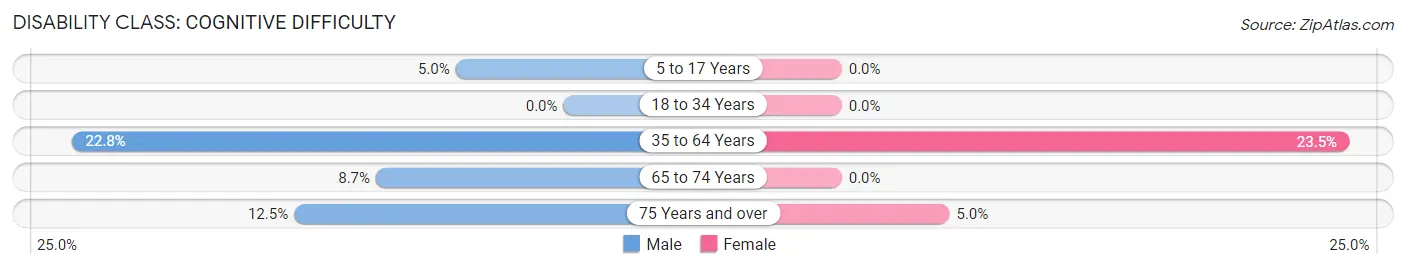
| Age Bracket | Male | Female |
| 5 to 17 Years | 1 (5.0%) | 0 (0.0%) |
| 18 to 34 Years | 0 (0.0%) | 0 (0.0%) |
| 35 to 64 Years | 18 (22.8%) | 12 (23.5%) |
| 65 to 74 Years | 2 (8.7%) | 0 (0.0%) |
| 75 Years and over | 1 (12.5%) | 1 (5.0%) |
Disability Class: Ambulatory Difficulty
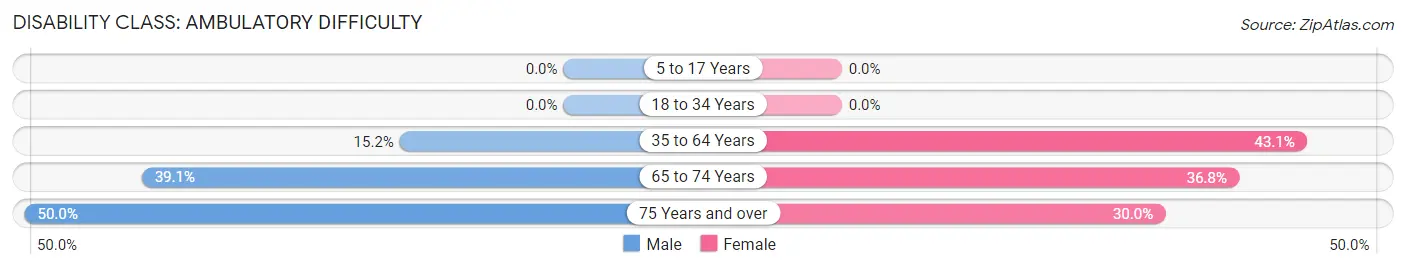
| Age Bracket | Male | Female |
| 5 to 17 Years | 0 (0.0%) | 0 (0.0%) |
| 18 to 34 Years | 0 (0.0%) | 0 (0.0%) |
| 35 to 64 Years | 12 (15.2%) | 22 (43.1%) |
| 65 to 74 Years | 9 (39.1%) | 7 (36.8%) |
| 75 Years and over | 4 (50.0%) | 6 (30.0%) |
Disability Class: Self-Care Difficulty
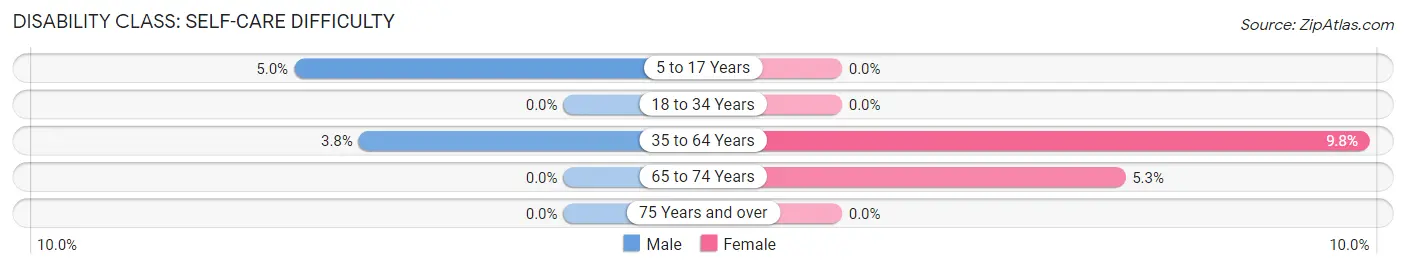
| Age Bracket | Male | Female |
| 5 to 17 Years | 1 (5.0%) | 0 (0.0%) |
| 18 to 34 Years | 0 (0.0%) | 0 (0.0%) |
| 35 to 64 Years | 3 (3.8%) | 5 (9.8%) |
| 65 to 74 Years | 0 (0.0%) | 1 (5.3%) |
| 75 Years and over | 0 (0.0%) | 0 (0.0%) |
Technology Access in Fordsville
Computing Device Access in Fordsville
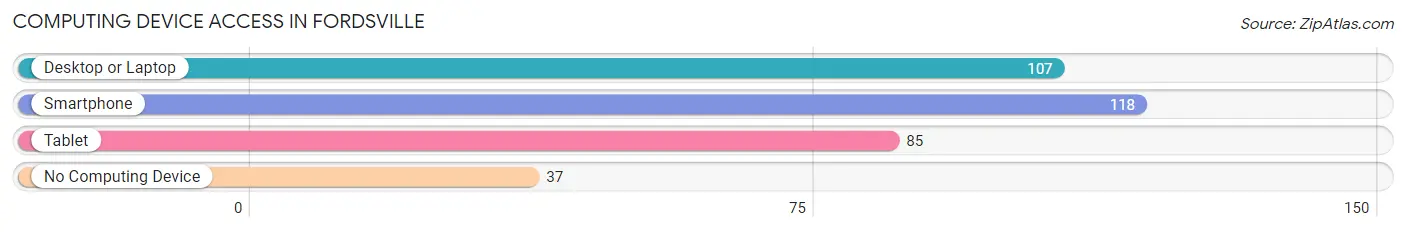
| Device Type | # Households | % Households |
| Desktop or Laptop | 107 | 66.5% |
| Smartphone | 118 | 73.3% |
| Tablet | 85 | 52.8% |
| No Computing Device | 37 | 23.0% |
| Total | 161 | 100.0% |
Internet Access in Fordsville
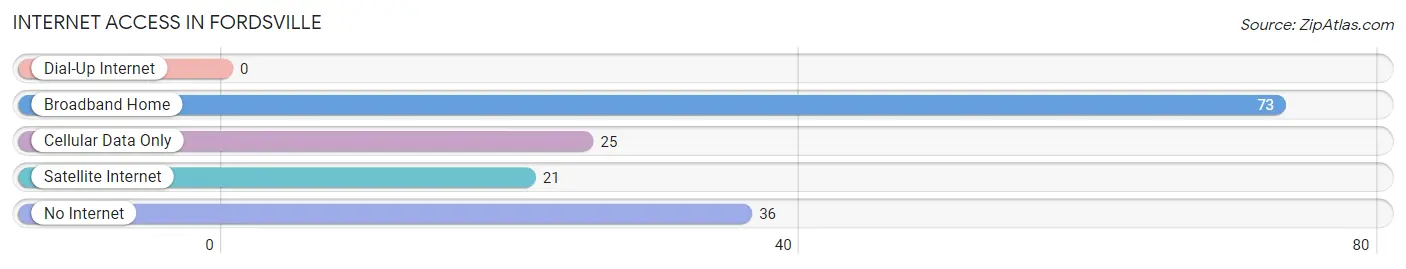
| Internet Type | # Households | % Households |
| Dial-Up Internet | 0 | 0.0% |
| Broadband Home | 73 | 45.3% |
| Cellular Data Only | 25 | 15.5% |
| Satellite Internet | 21 | 13.0% |
| No Internet | 36 | 22.4% |
| Total | 161 | 100.0% |
Fordsville Summary
Fordsville is a small town located in Ohio County, Kentucky. It is situated in the western part of the state, about 30 miles from the state capital of Frankfort. The town has a population of approximately 1,000 people and is part of the Owensboro metropolitan area.
History
Fordsville was founded in 1820 by William Ford, a Revolutionary War veteran. He named the town after himself and it quickly became a thriving community. The town was incorporated in 1837 and was the county seat of Ohio County until 1845.
The town was a major stop on the Louisville and Nashville Railroad, which ran through the town from 1871 to 1971. This allowed the town to become a major hub for the local economy. The railroad also brought many new people to the area, which helped to increase the population.
The town was also home to a number of businesses, including a flour mill, a sawmill, a gristmill, a blacksmith shop, and a general store. These businesses helped to make the town a prosperous place to live.
Geography
Fordsville is located in the western part of Kentucky, about 30 miles from the state capital of Frankfort. The town is situated in the Ohio River Valley, which is a major agricultural region. The town is surrounded by rolling hills and is located near the Green River.
The climate in Fordsville is humid subtropical, with hot summers and mild winters. The average annual temperature is around 60 degrees Fahrenheit. The town receives an average of 45 inches of precipitation each year.
Economy
The economy of Fordsville is largely based on agriculture. The town is home to a number of farms, which produce corn, soybeans, wheat, and hay. The town is also home to a number of small businesses, including a grocery store, a hardware store, and a restaurant.
The town is also home to a number of manufacturing companies, including a furniture factory and a plastics factory. These companies provide jobs for many of the town’s residents.
Demographics
As of the 2010 census, the population of Fordsville was 1,000 people. The town is predominantly white, with about 95% of the population being white. The median household income is around $30,000, and the median home value is around $90,000.
The town is home to a number of churches, including Baptist, Methodist, and Presbyterian. The town also has a public library and a number of parks.
Fordsville is a small town with a rich history and a strong economy. The town is home to a number of businesses and is a great place to live and work. The town is also home to a number of churches and parks, making it a great place to raise a family.
Common Questions
What is Per Capita Income in Fordsville?
Per Capita income in Fordsville is $18,352.
What is the Median Family Income in Fordsville?
Median Family Income in Fordsville is $48,409.
What is the Median Household income in Fordsville?
Median Household Income in Fordsville is $43,281.
What is Income or Wage Gap in Fordsville?
Income or Wage Gap in Fordsville is 60.9%.
Women in Fordsville earn 39.1 cents for every dollar earned by a man.
What is Inequality or Gini Index in Fordsville?
Inequality or Gini Index in Fordsville is 0.43.
What is the Total Population of Fordsville?
Total Population of Fordsville is 546.
What is the Total Male Population of Fordsville?
Total Male Population of Fordsville is 232.
What is the Total Female Population of Fordsville?
Total Female Population of Fordsville is 314.
What is the Ratio of Males per 100 Females in Fordsville?
There are 73.89 Males per 100 Females in Fordsville.
What is the Ratio of Females per 100 Males in Fordsville?
There are 135.34 Females per 100 Males in Fordsville.
What is the Median Population Age in Fordsville?
Median Population Age in Fordsville is 32.1 Years.
What is the Average Family Size in Fordsville
Average Family Size in Fordsville is 2.9 People.
What is the Average Household Size in Fordsville
Average Household Size in Fordsville is 3.0 People.
How Large is the Labor Force in Fordsville?
There are 251 People in the Labor Forcein in Fordsville.
What is the Percentage of People in the Labor Force in Fordsville?
55.2% of People are in the Labor Force in Fordsville.
What is the Unemployment Rate in Fordsville?
Unemployment Rate in Fordsville is 1.2%.