Calhoun, KY Map & Demographics
Calhoun Map
Calhoun Overview
$23,977
PER CAPITA INCOME
$63,068
AVG FAMILY INCOME
$51,705
AVG HOUSEHOLD INCOME
50.5%
WAGE / INCOME GAP [ % ]
49.5¢/ $1
WAGE / INCOME GAP [ $ ]
0.36
INEQUALITY / GINI INDEX
833
TOTAL POPULATION
369
MALE POPULATION
464
FEMALE POPULATION
79.53
MALES / 100 FEMALES
125.75
FEMALES / 100 MALES
42.6
MEDIAN AGE
2.9
AVG FAMILY SIZE
2.2
AVG HOUSEHOLD SIZE
334
LABOR FORCE [ PEOPLE ]
49.3%
PERCENT IN LABOR FORCE
11.4%
UNEMPLOYMENT RATE
Calhoun Zip Codes
Calhoun Area Codes
Income in Calhoun
Income Overview in Calhoun
Per Capita Income in Calhoun is $23,977, while median incomes of families and households are $63,068 and $51,705 respectively.
| Characteristic | Number | Measure |
| Per Capita Income | 833 | $23,977 |
| Median Family Income | 197 | $63,068 |
| Mean Family Income | 197 | $65,866 |
| Median Household Income | 341 | $51,705 |
| Mean Household Income | 341 | $57,334 |
| Income Deficit | 197 | $0 |
| Wage / Income Gap (%) | 833 | 50.45% |
| Wage / Income Gap ($) | 833 | 49.55¢ per $1 |
| Gini / Inequality Index | 833 | 0.36 |
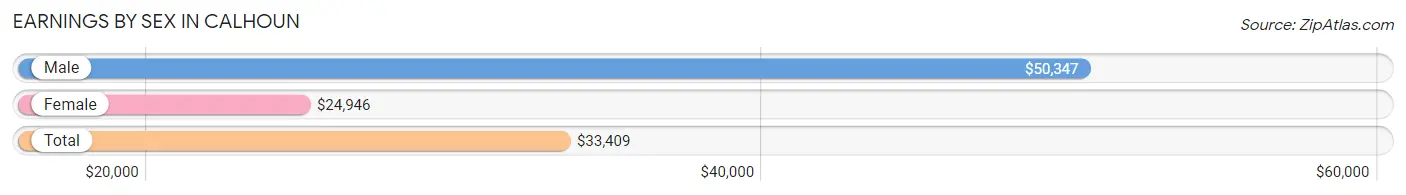
Earnings by Sex in Calhoun
Average Earnings in Calhoun are $33,409, $50,347 for men and $24,946 for women, a difference of 50.4%.
| Sex | Number | Average Earnings |
| Male | 183 (53.2%) | $50,347 |
| Female | 161 (46.8%) | $24,946 |
| Total | 344 (100.0%) | $33,409 |
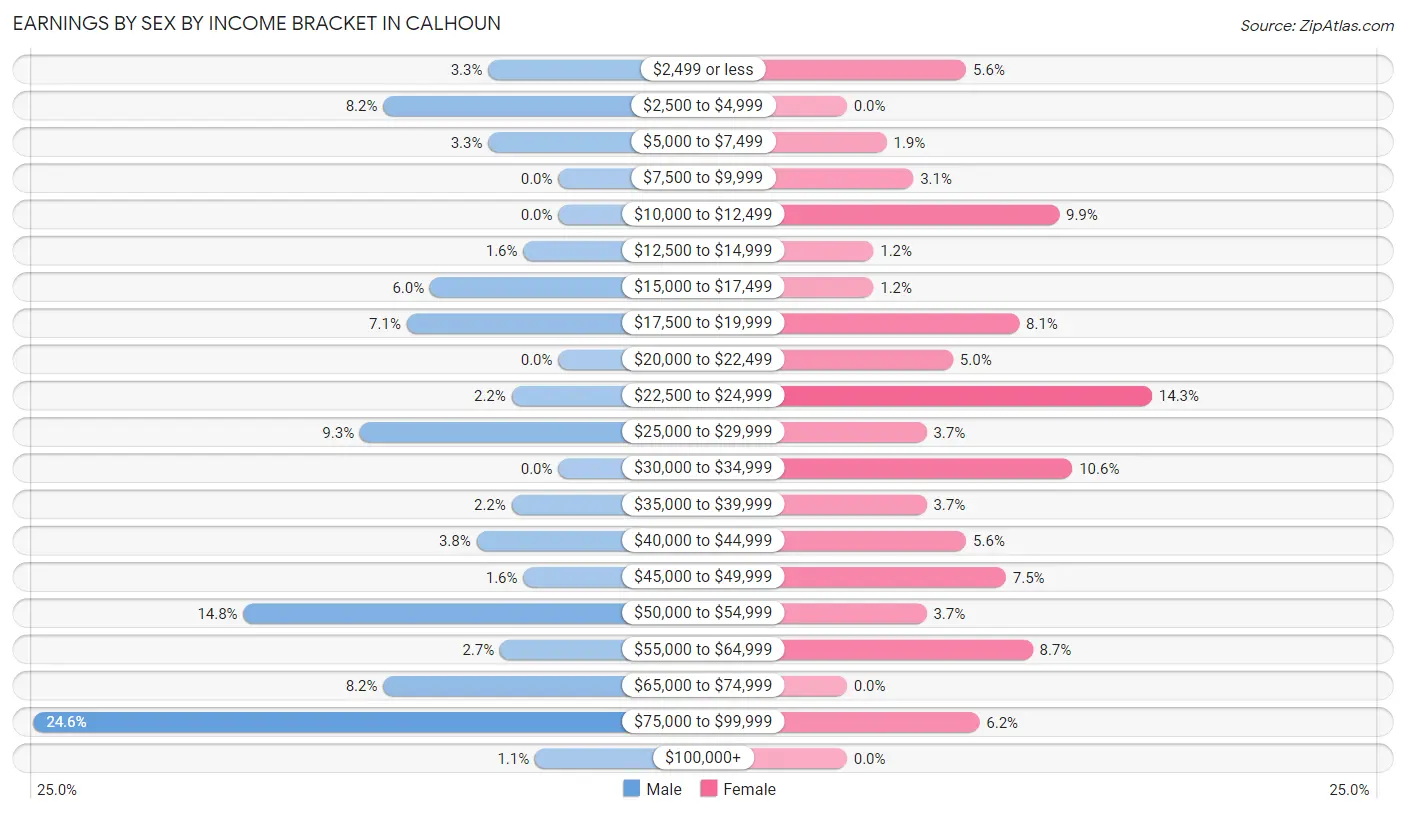
Earnings by Sex by Income Bracket in Calhoun
The most common earnings brackets in Calhoun are $75,000 to $99,999 for men (45 | 24.6%) and $22,500 to $24,999 for women (23 | 14.3%).
| Income | Male | Female |
| $2,499 or less | 6 (3.3%) | 9 (5.6%) |
| $2,500 to $4,999 | 15 (8.2%) | 0 (0.0%) |
| $5,000 to $7,499 | 6 (3.3%) | 3 (1.9%) |
| $7,500 to $9,999 | 0 (0.0%) | 5 (3.1%) |
| $10,000 to $12,499 | 0 (0.0%) | 16 (9.9%) |
| $12,500 to $14,999 | 3 (1.6%) | 2 (1.2%) |
| $15,000 to $17,499 | 11 (6.0%) | 2 (1.2%) |
| $17,500 to $19,999 | 13 (7.1%) | 13 (8.1%) |
| $20,000 to $22,499 | 0 (0.0%) | 8 (5.0%) |
| $22,500 to $24,999 | 4 (2.2%) | 23 (14.3%) |
| $25,000 to $29,999 | 17 (9.3%) | 6 (3.7%) |
| $30,000 to $34,999 | 0 (0.0%) | 17 (10.6%) |
| $35,000 to $39,999 | 4 (2.2%) | 6 (3.7%) |
| $40,000 to $44,999 | 7 (3.8%) | 9 (5.6%) |
| $45,000 to $49,999 | 3 (1.6%) | 12 (7.4%) |
| $50,000 to $54,999 | 27 (14.7%) | 6 (3.7%) |
| $55,000 to $64,999 | 5 (2.7%) | 14 (8.7%) |
| $65,000 to $74,999 | 15 (8.2%) | 0 (0.0%) |
| $75,000 to $99,999 | 45 (24.6%) | 10 (6.2%) |
| $100,000+ | 2 (1.1%) | 0 (0.0%) |
| Total | 183 (100.0%) | 161 (100.0%) |
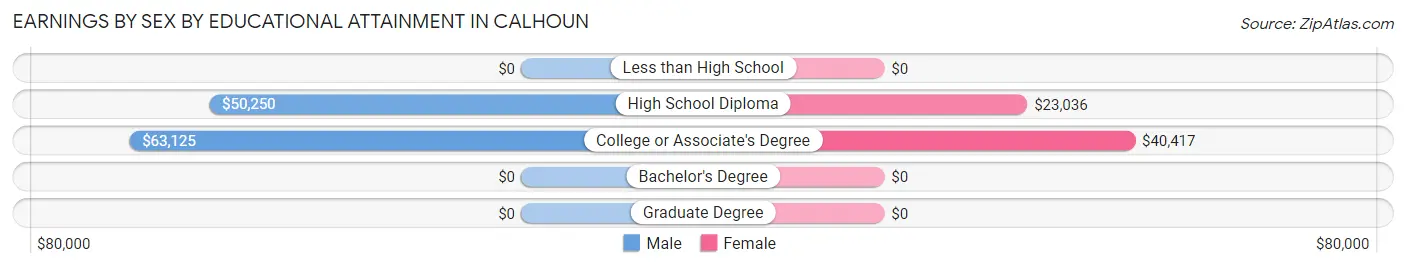
Earnings by Sex by Educational Attainment in Calhoun
Average earnings in Calhoun are $51,736 for men and $31,667 for women, a difference of 38.8%. Men with an educational attainment of college or associate's degree enjoy the highest average annual earnings of $63,125, while those with high school diploma education earn the least with $50,250. Women with an educational attainment of college or associate's degree earn the most with the average annual earnings of $40,417, while those with high school diploma education have the smallest earnings of $23,036.
| Educational Attainment | Male Income | Female Income |
| Less than High School | - | - |
| High School Diploma | $50,250 | $23,036 |
| College or Associate's Degree | $63,125 | $40,417 |
| Bachelor's Degree | - | - |
| Graduate Degree | - | - |
| Total | $51,736 | $31,667 |
Family Income in Calhoun
Family Income Brackets in Calhoun
According to the Calhoun family income data, there are 64 families falling into the $50,000 to $74,999 income range, which is the most common income bracket and makes up 32.5% of all families.
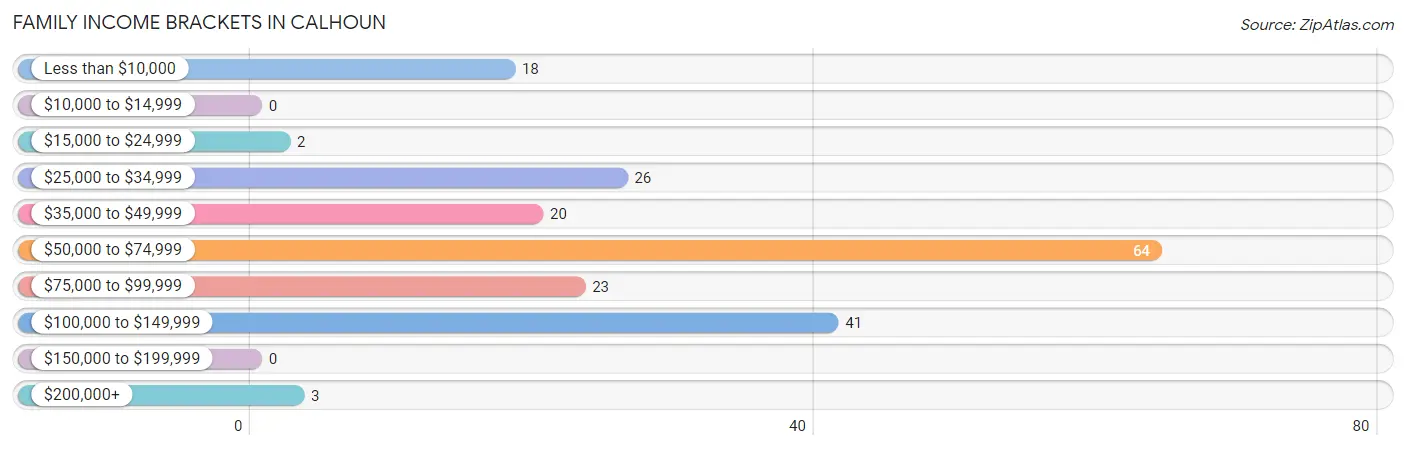
| Income Bracket | # Families | % Families |
| Less than $10,000 | 18 | 9.1% |
| $10,000 to $14,999 | 0 | 0.0% |
| $15,000 to $24,999 | 2 | 1.0% |
| $25,000 to $34,999 | 26 | 13.2% |
| $35,000 to $49,999 | 20 | 10.2% |
| $50,000 to $74,999 | 64 | 32.5% |
| $75,000 to $99,999 | 23 | 11.7% |
| $100,000 to $149,999 | 41 | 20.8% |
| $150,000 to $199,999 | 0 | 0.0% |
| $200,000+ | 3 | 1.5% |
Family Income by Famaliy Size in Calhoun
3-person families (54 | 27.4%) account for the highest median family income in Calhoun with $79,500 per family, while 3-person families (54 | 27.4%) have the highest median income of $26,500 per family member.
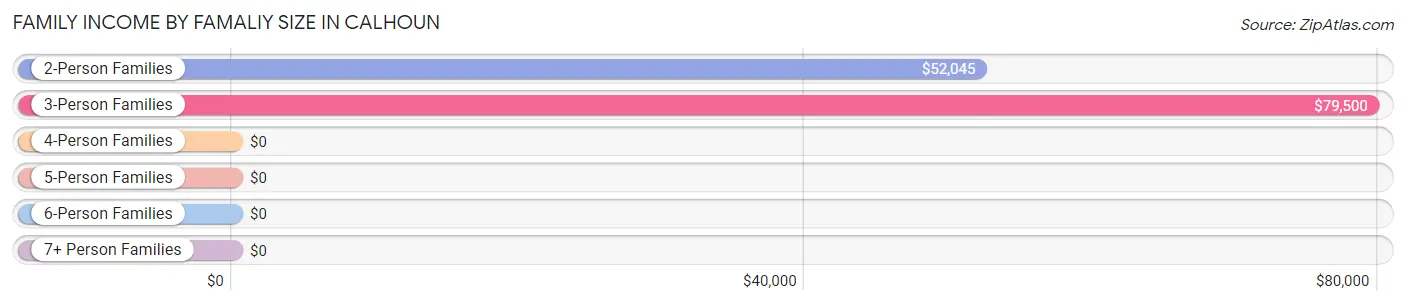
| Income Bracket | # Families | Median Income |
| 2-Person Families | 102 (51.8%) | $52,045 |
| 3-Person Families | 54 (27.4%) | $79,500 |
| 4-Person Families | 18 (9.1%) | $0 |
| 5-Person Families | 9 (4.6%) | $0 |
| 6-Person Families | 14 (7.1%) | $0 |
| 7+ Person Families | 0 (0.0%) | $0 |
| Total | 197 (100.0%) | $63,068 |
Family Income by Number of Earners in Calhoun
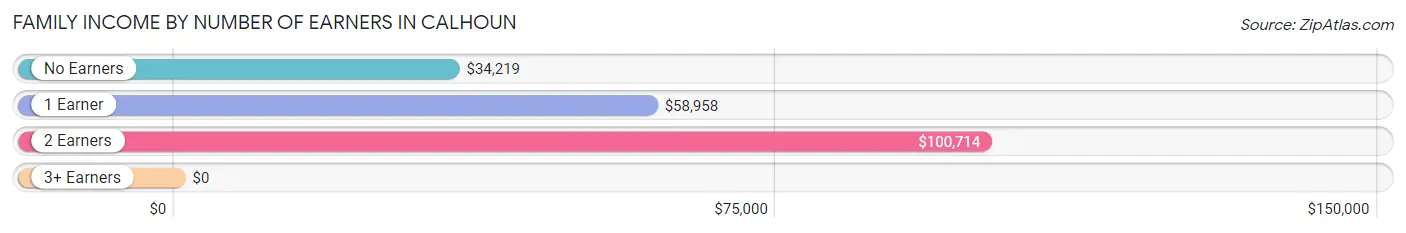
| Number of Earners | # Families | Median Income |
| No Earners | 49 (24.9%) | $34,219 |
| 1 Earner | 67 (34.0%) | $58,958 |
| 2 Earners | 80 (40.6%) | $100,714 |
| 3+ Earners | 1 (0.5%) | $0 |
| Total | 197 (100.0%) | $63,068 |
Household Income in Calhoun
Household Income Brackets in Calhoun
With 76 households falling in the category, the $50,000 to $74,999 income range is the most frequent in Calhoun, accounting for 22.3% of all households.
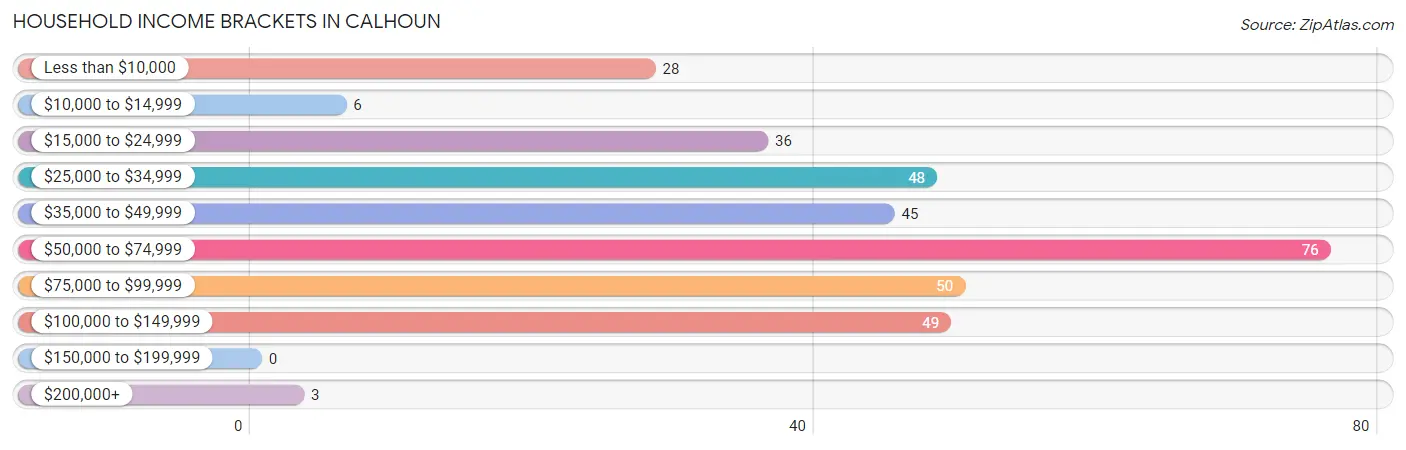
| Income Bracket | # Households | % Households |
| Less than $10,000 | 28 | 8.2% |
| $10,000 to $14,999 | 6 | 1.8% |
| $15,000 to $24,999 | 36 | 10.6% |
| $25,000 to $34,999 | 48 | 14.1% |
| $35,000 to $49,999 | 45 | 13.2% |
| $50,000 to $74,999 | 76 | 22.3% |
| $75,000 to $99,999 | 50 | 14.7% |
| $100,000 to $149,999 | 49 | 14.4% |
| $150,000 to $199,999 | 0 | 0.0% |
| $200,000+ | 3 | 0.9% |
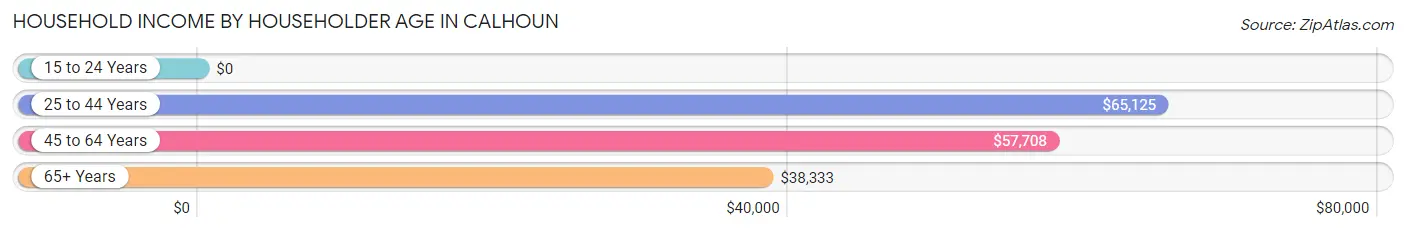
Household Income by Householder Age in Calhoun
The median household income in Calhoun is $51,705, with the highest median household income of $65,125 found in the 25 to 44 years age bracket for the primary householder. A total of 93 households (27.3%) fall into this category. Meanwhile, the 15 to 24 years age bracket for the primary householder has the lowest median household income of $0, with 29 households (8.5%) in this group.
| Income Bracket | # Households | Median Income |
| 15 to 24 Years | 29 (8.5%) | $0 |
| 25 to 44 Years | 93 (27.3%) | $65,125 |
| 45 to 64 Years | 111 (32.6%) | $57,708 |
| 65+ Years | 108 (31.7%) | $38,333 |
| Total | 341 (100.0%) | $51,705 |
Poverty in Calhoun
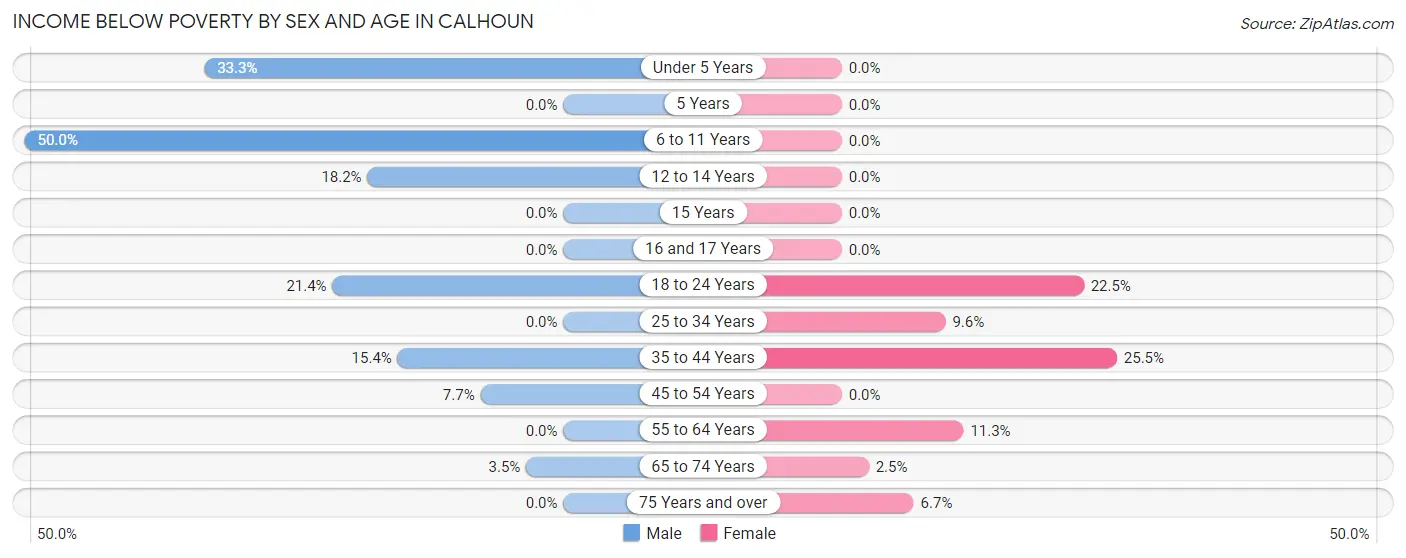
Income Below Poverty by Sex and Age in Calhoun
With 12.5% poverty level for males and 9.5% for females among the residents of Calhoun, 6 to 11 year old males and 35 to 44 year old females are the most vulnerable to poverty, with 17 males (50.0%) and 12 females (25.5%) in their respective age groups living below the poverty level.
| Age Bracket | Male | Female |
| Under 5 Years | 11 (33.3%) | 0 (0.0%) |
| 5 Years | 0 (0.0%) | 0 (0.0%) |
| 6 to 11 Years | 17 (50.0%) | 0 (0.0%) |
| 12 to 14 Years | 2 (18.2%) | 0 (0.0%) |
| 15 Years | 0 (0.0%) | 0 (0.0%) |
| 16 and 17 Years | 0 (0.0%) | 0 (0.0%) |
| 18 to 24 Years | 6 (21.4%) | 11 (22.5%) |
| 25 to 34 Years | 0 (0.0%) | 5 (9.6%) |
| 35 to 44 Years | 4 (15.4%) | 12 (25.5%) |
| 45 to 54 Years | 3 (7.7%) | 0 (0.0%) |
| 55 to 64 Years | 0 (0.0%) | 7 (11.3%) |
| 65 to 74 Years | 1 (3.5%) | 1 (2.5%) |
| 75 Years and over | 0 (0.0%) | 3 (6.7%) |
| Total | 44 (12.5%) | 39 (9.5%) |
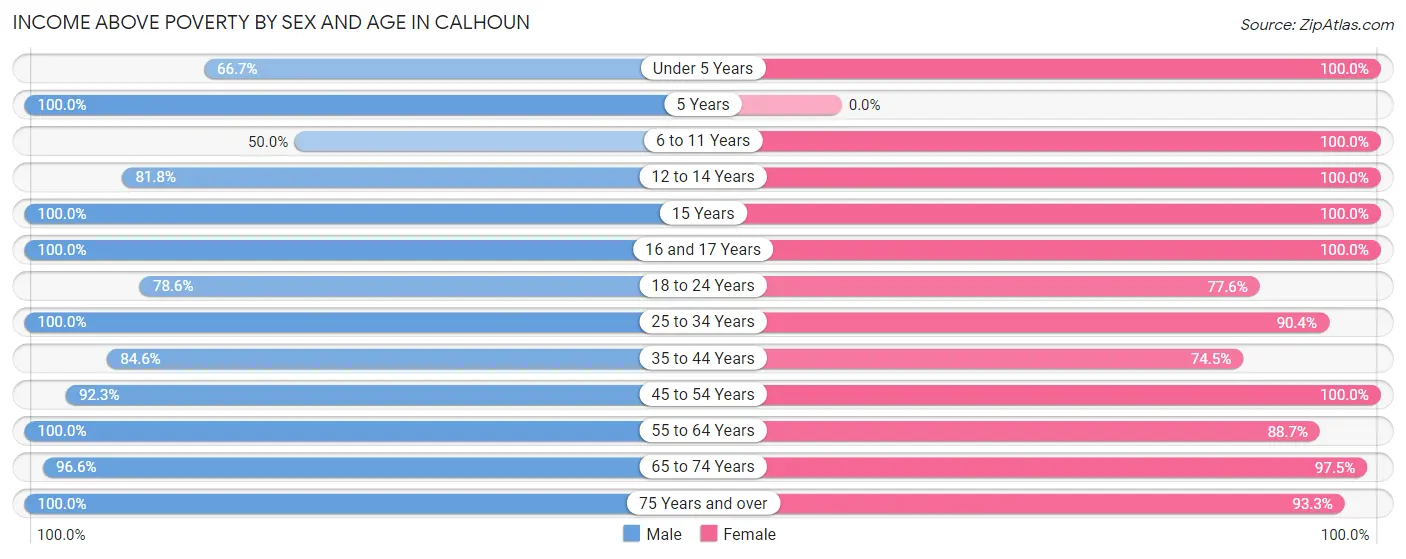
Income Above Poverty by Sex and Age in Calhoun
According to the poverty statistics in Calhoun, males aged 5 years and females aged under 5 years are the age groups that are most secure financially, with 100.0% of males and 100.0% of females in these age groups living above the poverty line.
| Age Bracket | Male | Female |
| Under 5 Years | 22 (66.7%) | 33 (100.0%) |
| 5 Years | 3 (100.0%) | 0 (0.0%) |
| 6 to 11 Years | 17 (50.0%) | 14 (100.0%) |
| 12 to 14 Years | 9 (81.8%) | 14 (100.0%) |
| 15 Years | 5 (100.0%) | 8 (100.0%) |
| 16 and 17 Years | 10 (100.0%) | 3 (100.0%) |
| 18 to 24 Years | 22 (78.6%) | 38 (77.5%) |
| 25 to 34 Years | 49 (100.0%) | 47 (90.4%) |
| 35 to 44 Years | 22 (84.6%) | 35 (74.5%) |
| 45 to 54 Years | 36 (92.3%) | 42 (100.0%) |
| 55 to 64 Years | 45 (100.0%) | 55 (88.7%) |
| 65 to 74 Years | 28 (96.6%) | 39 (97.5%) |
| 75 Years and over | 39 (100.0%) | 42 (93.3%) |
| Total | 307 (87.5%) | 370 (90.5%) |
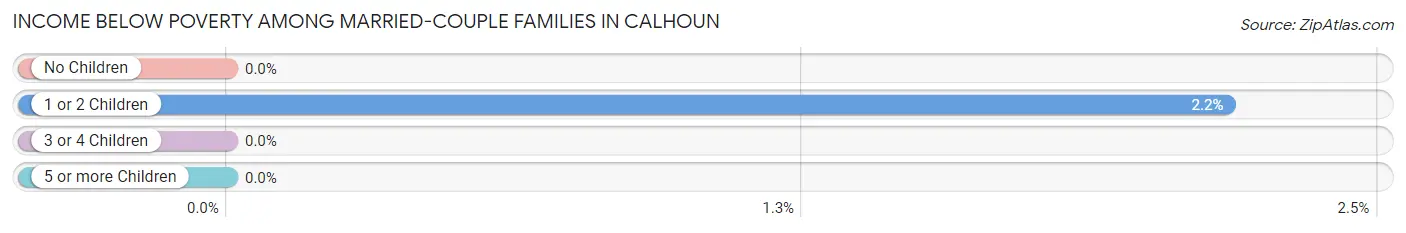
Income Below Poverty Among Married-Couple Families in Calhoun
The poverty statistics for married-couple families in Calhoun show that 0.7% or 1 of the total 145 families live below the poverty line. Families with 1 or 2 children have the highest poverty rate of 2.2%, comprising of 1 families. On the other hand, families with no children have the lowest poverty rate of 0.0%, which includes 0 families.
| Children | Above Poverty | Below Poverty |
| No Children | 78 (100.0%) | 0 (0.0%) |
| 1 or 2 Children | 45 (97.8%) | 1 (2.2%) |
| 3 or 4 Children | 21 (100.0%) | 0 (0.0%) |
| 5 or more Children | 0 (0.0%) | 0 (0.0%) |
| Total | 144 (99.3%) | 1 (0.7%) |
Income Below Poverty Among Single-Parent Households in Calhoun
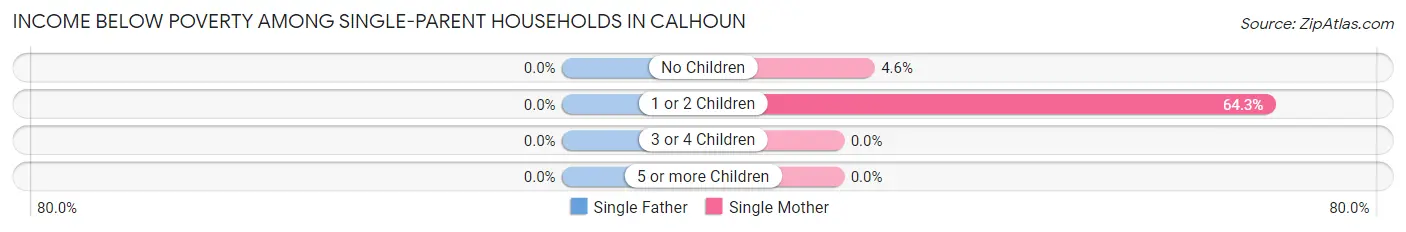
| Children | Single Father | Single Mother |
| No Children | 0 (0.0%) | 1 (4.5%) |
| 1 or 2 Children | 0 (0.0%) | 18 (64.3%) |
| 3 or 4 Children | 0 (0.0%) | 0 (0.0%) |
| 5 or more Children | 0 (0.0%) | 0 (0.0%) |
| Total | 0 (0.0%) | 19 (38.0%) |
Income Below Poverty Among Married-Couple vs Single-Parent Households in Calhoun
The poverty data for Calhoun shows that 1 of the married-couple family households (0.7%) and 19 of the single-parent households (36.5%) are living below the poverty level. Within the married-couple family households, those with 1 or 2 children have the highest poverty rate, with 1 households (2.2%) falling below the poverty line. Among the single-parent households, those with 1 or 2 children have the highest poverty rate, with 18 household (64.3%) living below poverty.
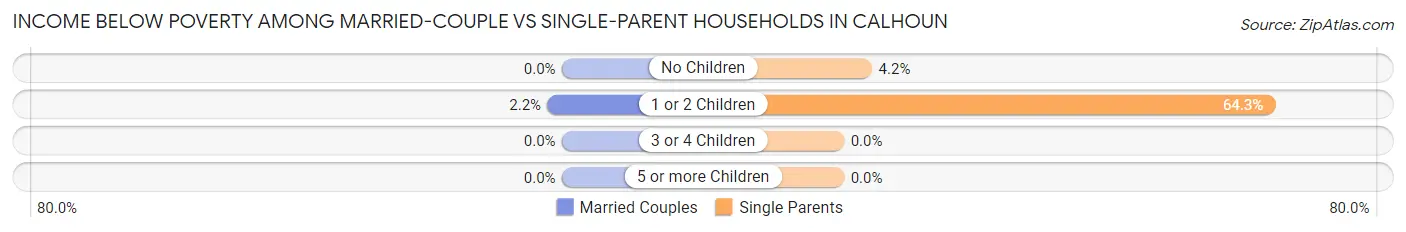
| Children | Married-Couple Families | Single-Parent Households |
| No Children | 0 (0.0%) | 1 (4.2%) |
| 1 or 2 Children | 1 (2.2%) | 18 (64.3%) |
| 3 or 4 Children | 0 (0.0%) | 0 (0.0%) |
| 5 or more Children | 0 (0.0%) | 0 (0.0%) |
| Total | 1 (0.7%) | 19 (36.5%) |
Race in Calhoun
The most populous races in Calhoun are White / Caucasian (813 | 97.6%), Two or more Races (12 | 1.4%), and Black / African American (8 | 1.0%).
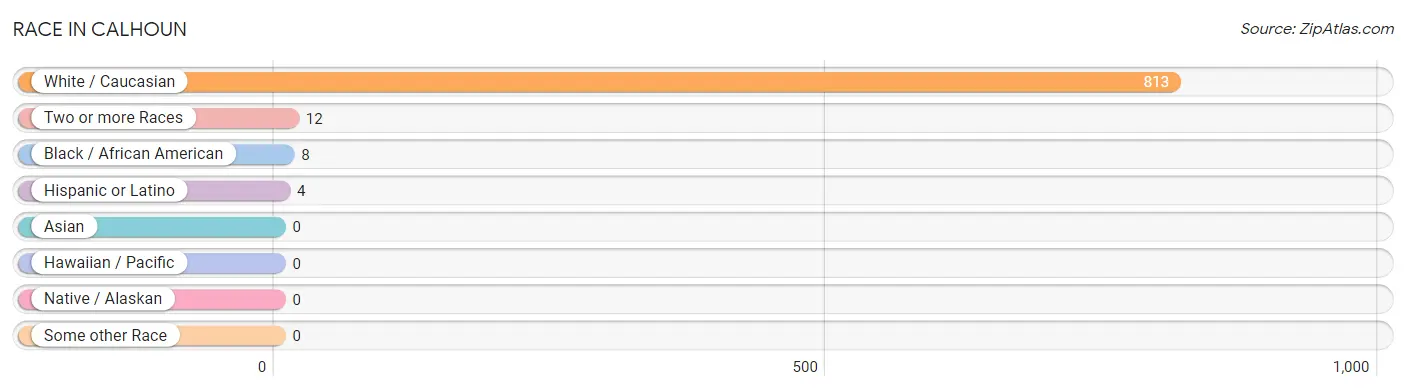
| Race | # Population | % Population |
| Asian | 0 | 0.0% |
| Black / African American | 8 | 1.0% |
| Hawaiian / Pacific | 0 | 0.0% |
| Hispanic or Latino | 4 | 0.5% |
| Native / Alaskan | 0 | 0.0% |
| White / Caucasian | 813 | 97.6% |
| Two or more Races | 12 | 1.4% |
| Some other Race | 0 | 0.0% |
| Total | 833 | 100.0% |
Ancestry in Calhoun
The most populous ancestries reported in Calhoun are American (199 | 23.9%), Irish (85 | 10.2%), German (68 | 8.2%), English (54 | 6.5%), and French Canadian (20 | 2.4%), together accounting for 51.1% of all Calhoun residents.
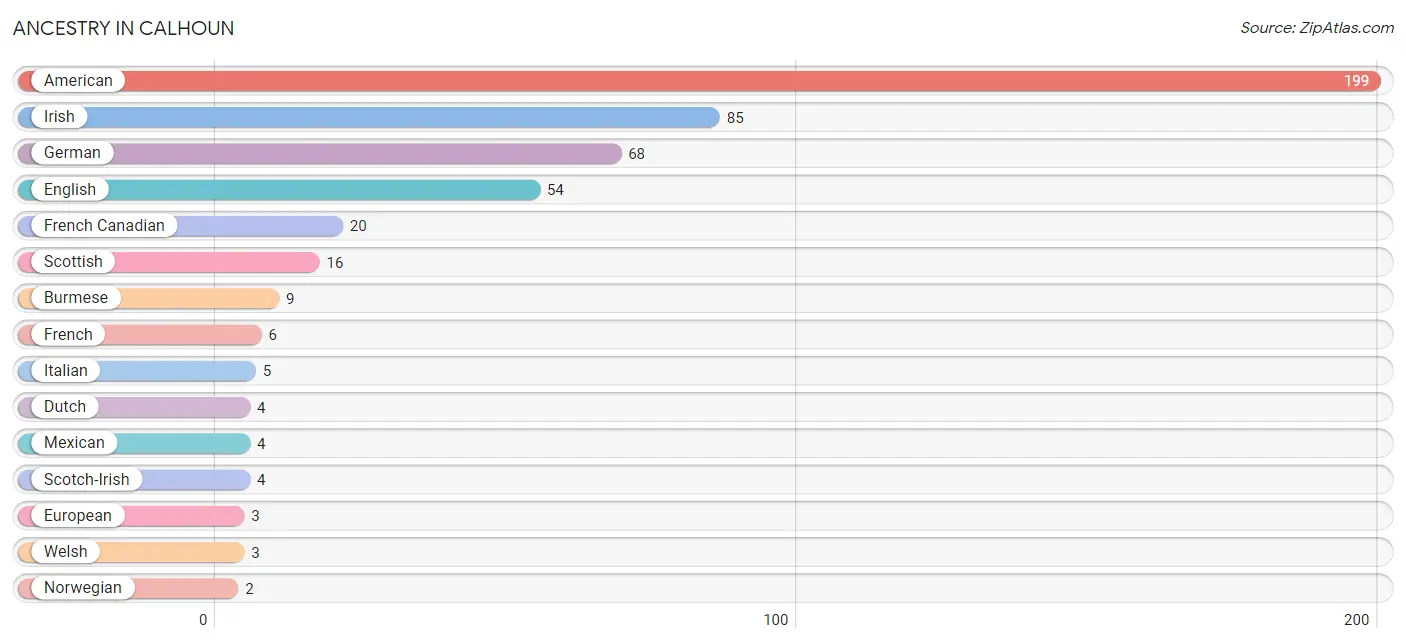
| Ancestry | # Population | % Population |
| American | 199 | 23.9% |
| Burmese | 9 | 1.1% |
| Dutch | 4 | 0.5% |
| English | 54 | 6.5% |
| European | 3 | 0.4% |
| French | 6 | 0.7% |
| French Canadian | 20 | 2.4% |
| German | 68 | 8.2% |
| Irish | 85 | 10.2% |
| Italian | 5 | 0.6% |
| Mexican | 4 | 0.5% |
| Norwegian | 2 | 0.2% |
| Scotch-Irish | 4 | 0.5% |
| Scottish | 16 | 1.9% |
| Welsh | 3 | 0.4% | View All 15 Rows |
Immigrants in Calhoun
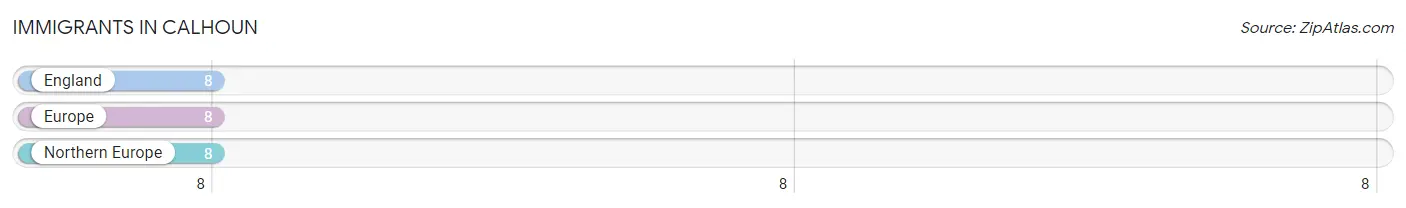
The most numerous immigrant groups reported in Calhoun came from England (8 | 1.0%), Europe (8 | 1.0%), and Northern Europe (8 | 1.0%), together accounting for 2.9% of all Calhoun residents.
| Immigration Origin | # Population | % Population |
| England | 8 | 1.0% |
| Europe | 8 | 1.0% |
| Northern Europe | 8 | 1.0% | View All 3 Rows |
Sex and Age in Calhoun
Sex and Age in Calhoun
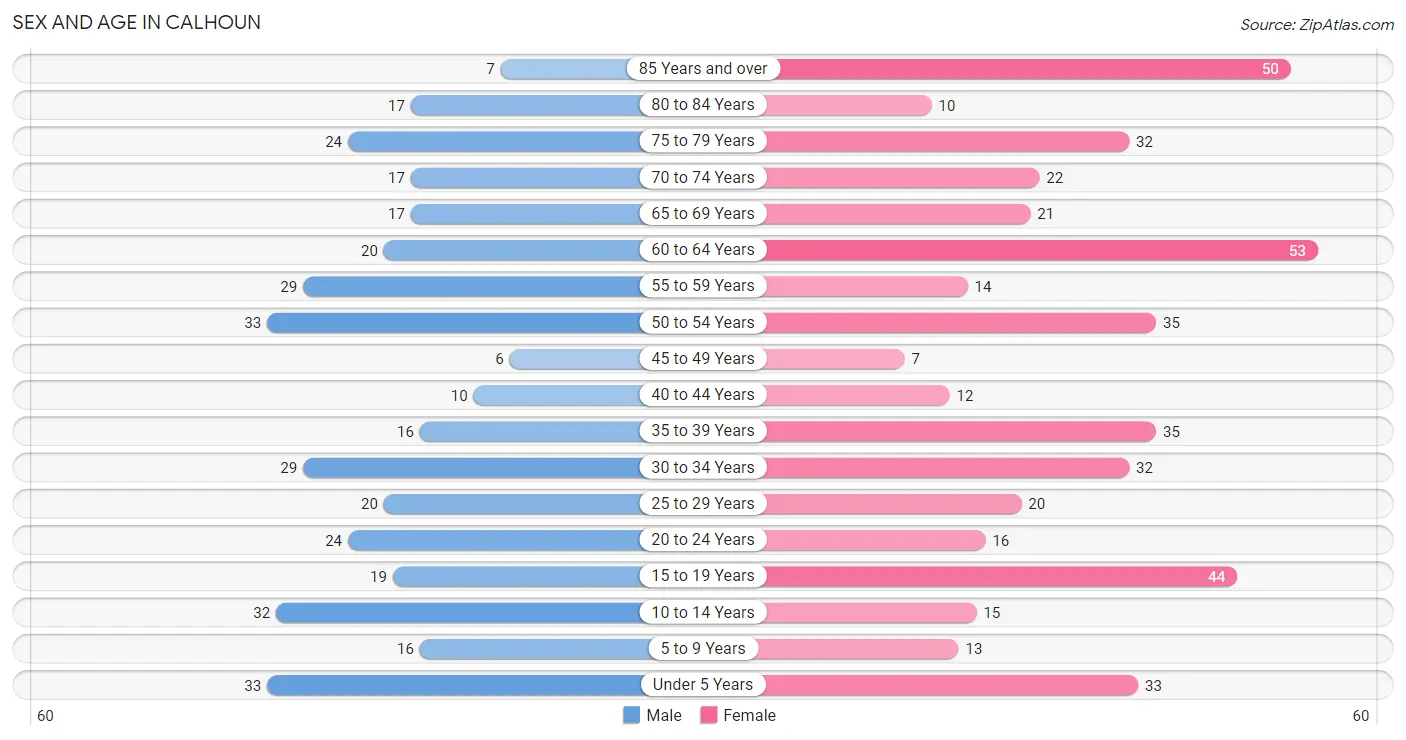
The most populous age groups in Calhoun are Under 5 Years (33 | 8.9%) for men and 60 to 64 Years (53 | 11.4%) for women.
| Age Bracket | Male | Female |
| Under 5 Years | 33 (8.9%) | 33 (7.1%) |
| 5 to 9 Years | 16 (4.3%) | 13 (2.8%) |
| 10 to 14 Years | 32 (8.7%) | 15 (3.2%) |
| 15 to 19 Years | 19 (5.1%) | 44 (9.5%) |
| 20 to 24 Years | 24 (6.5%) | 16 (3.5%) |
| 25 to 29 Years | 20 (5.4%) | 20 (4.3%) |
| 30 to 34 Years | 29 (7.9%) | 32 (6.9%) |
| 35 to 39 Years | 16 (4.3%) | 35 (7.5%) |
| 40 to 44 Years | 10 (2.7%) | 12 (2.6%) |
| 45 to 49 Years | 6 (1.6%) | 7 (1.5%) |
| 50 to 54 Years | 33 (8.9%) | 35 (7.5%) |
| 55 to 59 Years | 29 (7.9%) | 14 (3.0%) |
| 60 to 64 Years | 20 (5.4%) | 53 (11.4%) |
| 65 to 69 Years | 17 (4.6%) | 21 (4.5%) |
| 70 to 74 Years | 17 (4.6%) | 22 (4.7%) |
| 75 to 79 Years | 24 (6.5%) | 32 (6.9%) |
| 80 to 84 Years | 17 (4.6%) | 10 (2.2%) |
| 85 Years and over | 7 (1.9%) | 50 (10.8%) |
| Total | 369 (100.0%) | 464 (100.0%) |
Families and Households in Calhoun
Median Family Size in Calhoun
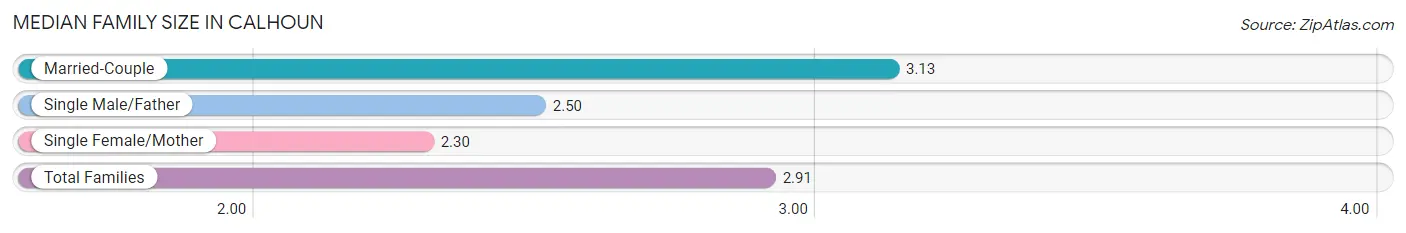
The median family size in Calhoun is 2.91 persons per family, with married-couple families (145 | 73.6%) accounting for the largest median family size of 3.13 persons per family. On the other hand, single female/mother families (50 | 25.4%) represent the smallest median family size with 2.30 persons per family.
| Family Type | # Families | Family Size |
| Married-Couple | 145 (73.6%) | 3.13 |
| Single Male/Father | 2 (1.0%) | 2.50 |
| Single Female/Mother | 50 (25.4%) | 2.30 |
| Total Families | 197 (100.0%) | 2.91 |
Median Household Size in Calhoun
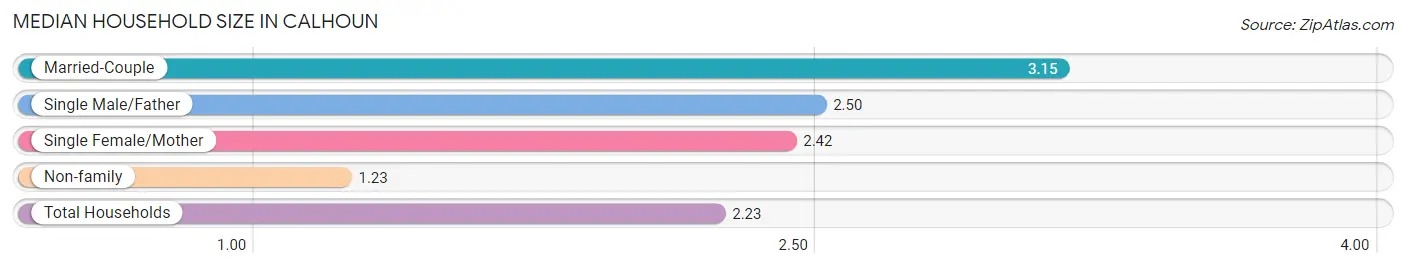
The median household size in Calhoun is 2.23 persons per household, with married-couple households (145 | 42.5%) accounting for the largest median household size of 3.15 persons per household. non-family households (144 | 42.2%) represent the smallest median household size with 1.23 persons per household.
| Household Type | # Households | Household Size |
| Married-Couple | 145 (42.5%) | 3.15 |
| Single Male/Father | 2 (0.6%) | 2.50 |
| Single Female/Mother | 50 (14.7%) | 2.42 |
| Non-family | 144 (42.2%) | 1.23 |
| Total Households | 341 (100.0%) | 2.23 |
Household Size by Marriage Status in Calhoun
Out of a total of 341 households in Calhoun, 197 (57.8%) are family households, while 144 (42.2%) are nonfamily households. The most numerous type of family households are 2-person households, comprising 98, and the most common type of nonfamily households are 1-person households, comprising 119.
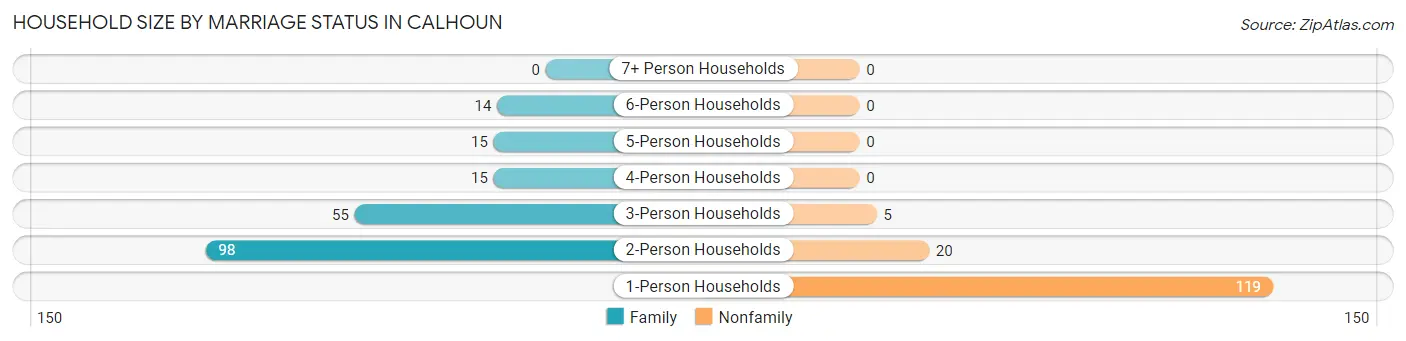
| Household Size | Family Households | Nonfamily Households |
| 1-Person Households | - | 119 (34.9%) |
| 2-Person Households | 98 (28.7%) | 20 (5.9%) |
| 3-Person Households | 55 (16.1%) | 5 (1.5%) |
| 4-Person Households | 15 (4.4%) | 0 (0.0%) |
| 5-Person Households | 15 (4.4%) | 0 (0.0%) |
| 6-Person Households | 14 (4.1%) | 0 (0.0%) |
| 7+ Person Households | 0 (0.0%) | 0 (0.0%) |
| Total | 197 (57.8%) | 144 (42.2%) |
Female Fertility in Calhoun
Fertility by Age in Calhoun
Average fertility rate in Calhoun is 95.0 births per 1,000 women. Women in the age bracket of 35 to 50 years have the highest fertility rate with 175.0 births per 1,000 women. Women in the age bracket of 35 to 50 years acount for 62.5% of all women with births.
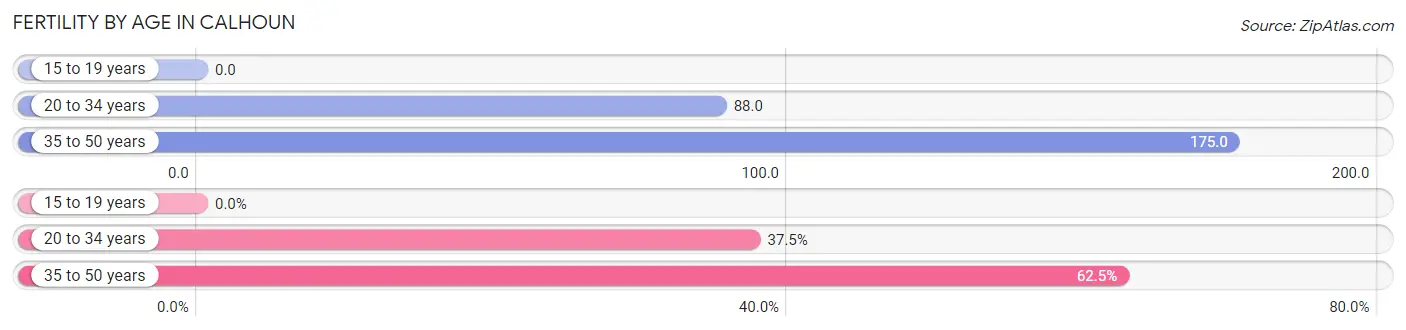
| Age Bracket | Women with Births | Births / 1,000 Women |
| 15 to 19 years | 0 (0.0%) | 0.0 |
| 20 to 34 years | 6 (37.5%) | 88.0 |
| 35 to 50 years | 10 (62.5%) | 175.0 |
| Total | 16 (100.0%) | 95.0 |
Fertility by Age by Marriage Status in Calhoun
81.2% of women with births (16) in Calhoun are married. The highest percentage of unmarried women with births falls into 20 to 34 years age bracket with 50.0% of them unmarried at the time of birth, while the lowest percentage of unmarried women with births belong to 35 to 50 years age bracket with 0.0% of them unmarried.
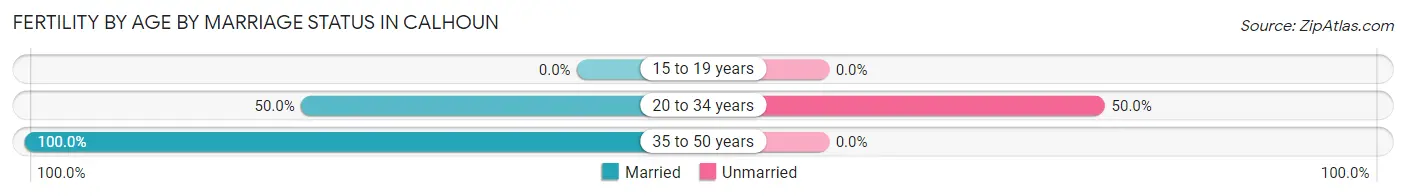
| Age Bracket | Married | Unmarried |
| 15 to 19 years | 0 (0.0%) | 0 (0.0%) |
| 20 to 34 years | 3 (50.0%) | 3 (50.0%) |
| 35 to 50 years | 10 (100.0%) | 0 (0.0%) |
| Total | 13 (81.2%) | 3 (18.8%) |
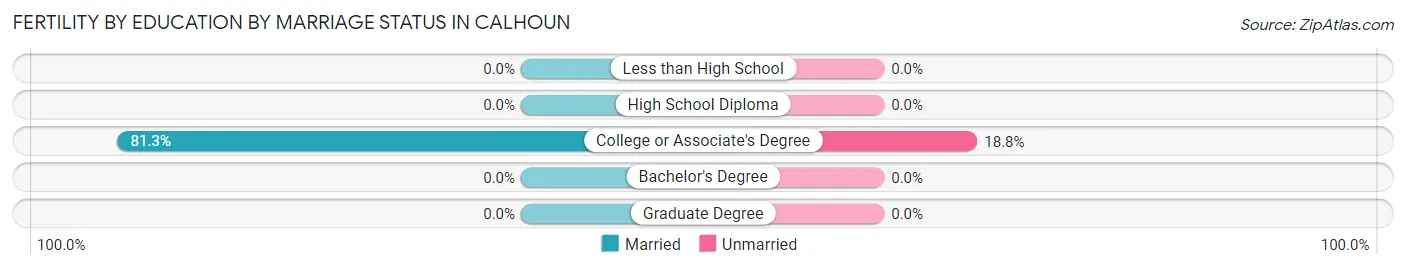
Fertility by Education in Calhoun
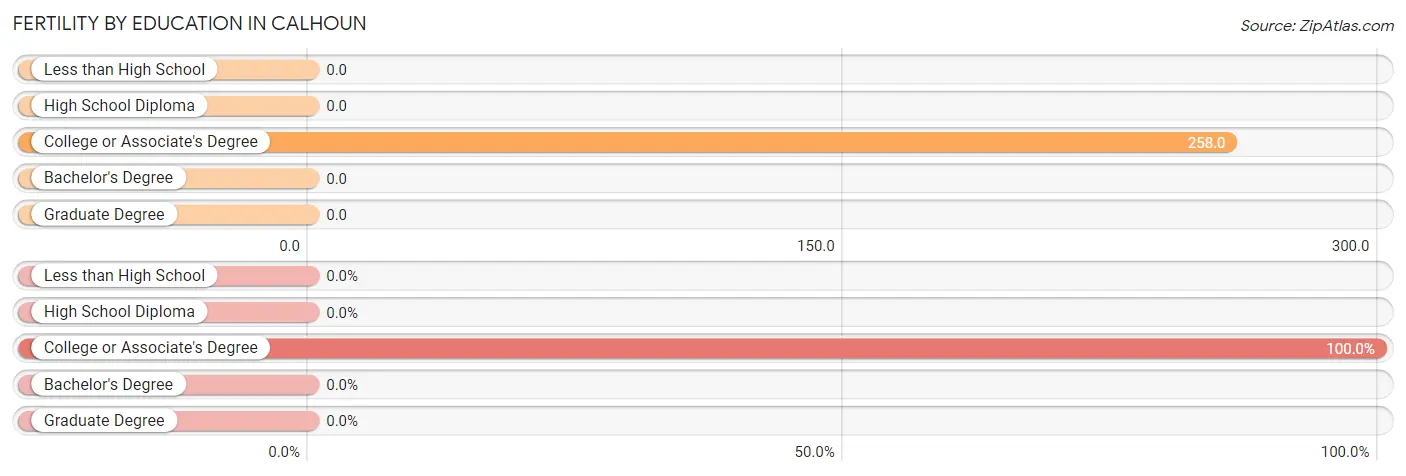
| Educational Attainment | Women with Births | Births / 1,000 Women |
| Less than High School | 0 (0.0%) | 0.0 |
| High School Diploma | 0 (0.0%) | 0.0 |
| College or Associate's Degree | 16 (100.0%) | 258.0 |
| Bachelor's Degree | 0 (0.0%) | 0.0 |
| Graduate Degree | 0 (0.0%) | 0.0 |
| Total | 16 (100.0%) | 95.0 |
Fertility by Education by Marriage Status in Calhoun
18.8% of women with births in Calhoun are unmarried. Women with the educational attainment of college or associate's degree are most likely to be married with 81.2% of them married at childbirth, while women with the educational attainment of college or associate's degree are least likely to be married with 18.8% of them unmarried at childbirth.
| Educational Attainment | Married | Unmarried |
| Less than High School | 0 (0.0%) | 0 (0.0%) |
| High School Diploma | 0 (0.0%) | 0 (0.0%) |
| College or Associate's Degree | 13 (81.2%) | 3 (18.8%) |
| Bachelor's Degree | 0 (0.0%) | 0 (0.0%) |
| Graduate Degree | 0 (0.0%) | 0 (0.0%) |
| Total | 13 (81.2%) | 3 (18.8%) |
Employment Characteristics in Calhoun
Employment by Class of Employer in Calhoun
Among the 296 employed individuals in Calhoun, private company employees (197 | 66.5%), not-for-profit organizations (43 | 14.5%), and self-employed (not incorporated) (26 | 8.8%) make up the most common classes of employment.
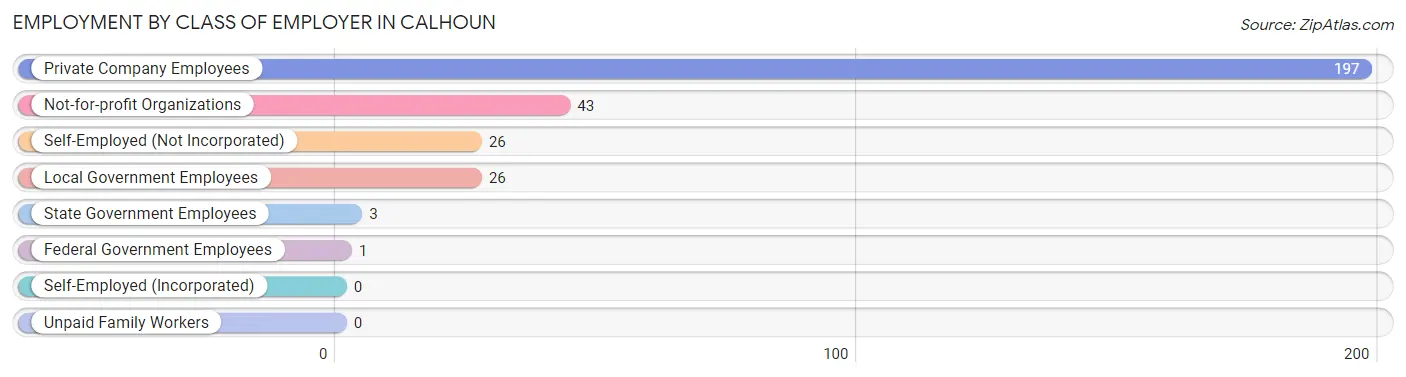
| Employer Class | # Employees | % Employees |
| Private Company Employees | 197 | 66.5% |
| Self-Employed (Incorporated) | 0 | 0.0% |
| Self-Employed (Not Incorporated) | 26 | 8.8% |
| Not-for-profit Organizations | 43 | 14.5% |
| Local Government Employees | 26 | 8.8% |
| State Government Employees | 3 | 1.0% |
| Federal Government Employees | 1 | 0.3% |
| Unpaid Family Workers | 0 | 0.0% |
| Total | 296 | 100.0% |
Employment Status by Age in Calhoun
According to the labor force statistics for Calhoun, out of the total population over 16 years of age (678), 49.3% or 334 individuals are in the labor force, with 11.4% or 38 of them unemployed. The age group with the highest labor force participation rate is 20 to 24 years, with 85.0% or 34 individuals in the labor force. Within the labor force, the 75 years and over age range has the highest percentage of unemployed individuals, with 33.3% or 6 of them being unemployed.
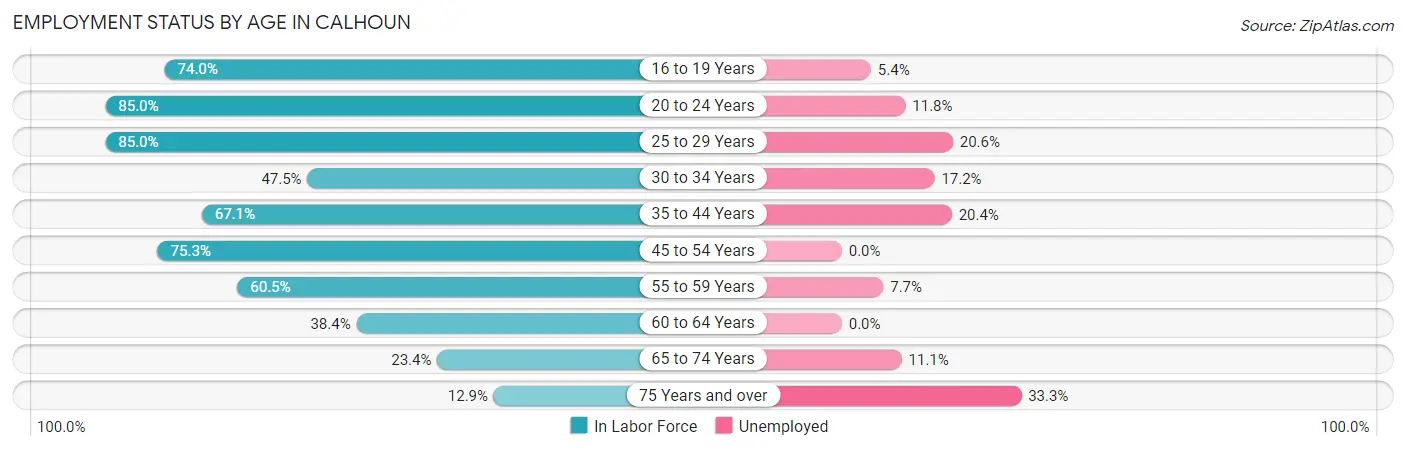
| Age Bracket | In Labor Force | Unemployed |
| 16 to 19 Years | 37 (74.0%) | 2 (5.4%) |
| 20 to 24 Years | 34 (85.0%) | 4 (11.8%) |
| 25 to 29 Years | 34 (85.0%) | 7 (20.6%) |
| 30 to 34 Years | 29 (47.5%) | 5 (17.2%) |
| 35 to 44 Years | 49 (67.1%) | 10 (20.4%) |
| 45 to 54 Years | 61 (75.3%) | 0 (0.0%) |
| 55 to 59 Years | 26 (60.5%) | 2 (7.7%) |
| 60 to 64 Years | 28 (38.4%) | 0 (0.0%) |
| 65 to 74 Years | 18 (23.4%) | 2 (11.1%) |
| 75 Years and over | 18 (12.9%) | 6 (33.3%) |
| Total | 334 (49.3%) | 38 (11.4%) |
Employment Status by Educational Attainment in Calhoun
According to labor force statistics for Calhoun, 61.2% of individuals (227) out of the total population between 25 and 64 years of age (371) are in the labor force, with 10.6% or 24 of them being unemployed. The group with the highest labor force participation rate are those with the educational attainment of college / associate degree, with 81.7% or 116 individuals in the labor force. Within the labor force, individuals with less than high school education have the highest percentage of unemployment, with 38.9% or 7 of them being unemployed.
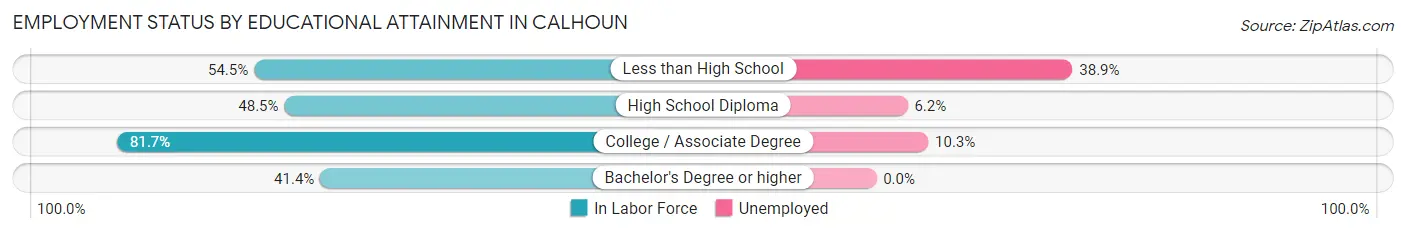
| Educational Attainment | In Labor Force | Unemployed |
| Less than High School | 18 (54.5%) | 13 (38.9%) |
| High School Diploma | 81 (48.5%) | 10 (6.2%) |
| College / Associate Degree | 116 (81.7%) | 15 (10.3%) |
| Bachelor's Degree or higher | 12 (41.4%) | 0 (0.0%) |
| Total | 227 (61.2%) | 39 (10.6%) |
Employment Occupations by Sex in Calhoun
Management, Business, Science and Arts Occupations
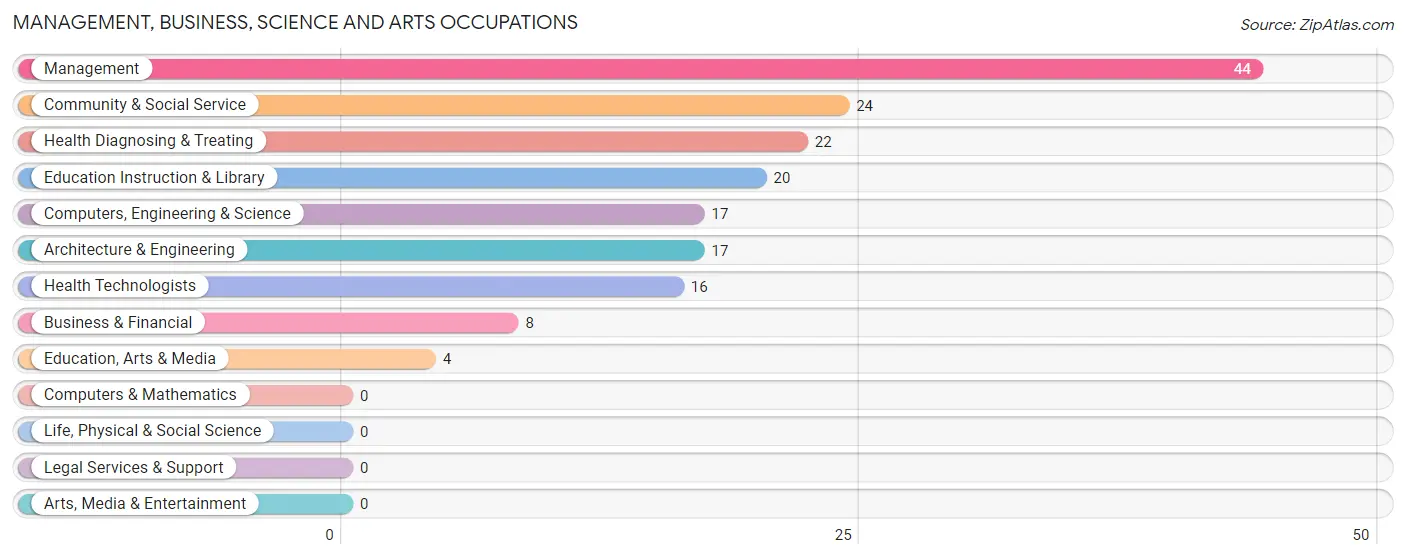
The most common Management, Business, Science and Arts occupations in Calhoun are Management (44 | 14.9%), Community & Social Service (24 | 8.1%), Health Diagnosing & Treating (22 | 7.4%), Education Instruction & Library (20 | 6.8%), and Computers, Engineering & Science (17 | 5.7%).
Management, Business, Science and Arts Occupations by Sex
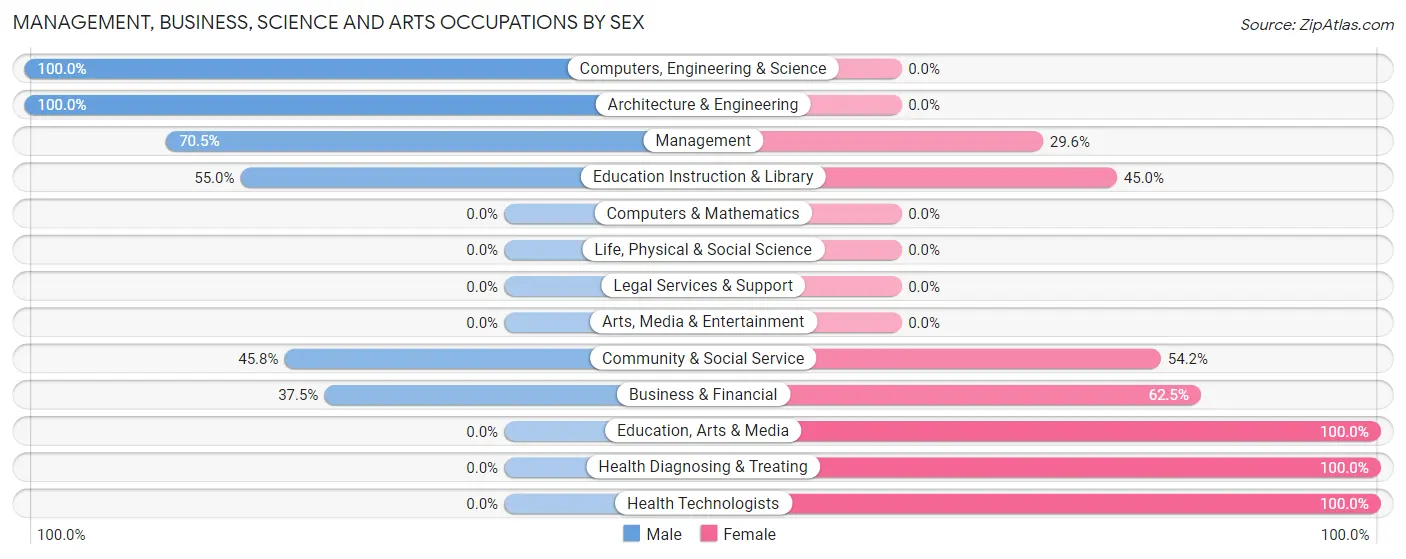
Within the Management, Business, Science and Arts occupations in Calhoun, the most male-oriented occupations are Computers, Engineering & Science (100.0%), Architecture & Engineering (100.0%), and Management (70.5%), while the most female-oriented occupations are Education, Arts & Media (100.0%), Health Diagnosing & Treating (100.0%), and Health Technologists (100.0%).
| Occupation | Male | Female |
| Management | 31 (70.5%) | 13 (29.5%) |
| Business & Financial | 3 (37.5%) | 5 (62.5%) |
| Computers, Engineering & Science | 17 (100.0%) | 0 (0.0%) |
| Computers & Mathematics | 0 (0.0%) | 0 (0.0%) |
| Architecture & Engineering | 17 (100.0%) | 0 (0.0%) |
| Life, Physical & Social Science | 0 (0.0%) | 0 (0.0%) |
| Community & Social Service | 11 (45.8%) | 13 (54.2%) |
| Education, Arts & Media | 0 (0.0%) | 4 (100.0%) |
| Legal Services & Support | 0 (0.0%) | 0 (0.0%) |
| Education Instruction & Library | 11 (55.0%) | 9 (45.0%) |
| Arts, Media & Entertainment | 0 (0.0%) | 0 (0.0%) |
| Health Diagnosing & Treating | 0 (0.0%) | 22 (100.0%) |
| Health Technologists | 0 (0.0%) | 16 (100.0%) |
| Total (Category) | 62 (53.9%) | 53 (46.1%) |
| Total (Overall) | 159 (53.7%) | 137 (46.3%) |
Services Occupations
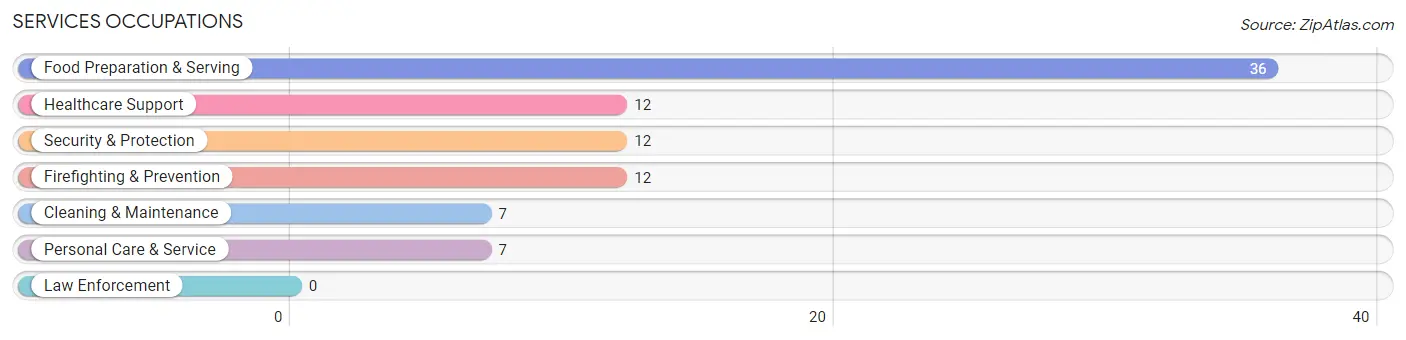
The most common Services occupations in Calhoun are Food Preparation & Serving (36 | 12.2%), Healthcare Support (12 | 4.1%), Security & Protection (12 | 4.1%), Firefighting & Prevention (12 | 4.1%), and Cleaning & Maintenance (7 | 2.4%).
Services Occupations by Sex
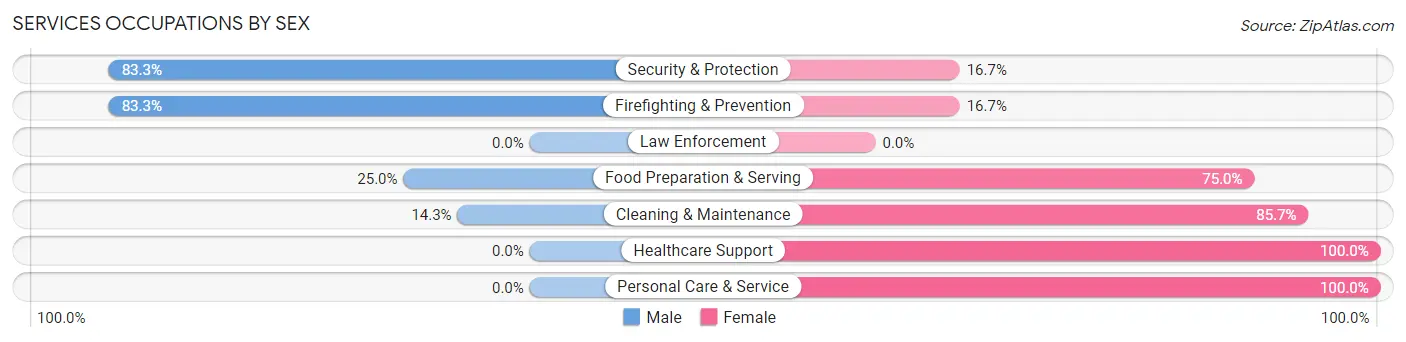
Within the Services occupations in Calhoun, the most male-oriented occupations are Security & Protection (83.3%), Firefighting & Prevention (83.3%), and Food Preparation & Serving (25.0%), while the most female-oriented occupations are Healthcare Support (100.0%), Personal Care & Service (100.0%), and Cleaning & Maintenance (85.7%).
| Occupation | Male | Female |
| Healthcare Support | 0 (0.0%) | 12 (100.0%) |
| Security & Protection | 10 (83.3%) | 2 (16.7%) |
| Firefighting & Prevention | 10 (83.3%) | 2 (16.7%) |
| Law Enforcement | 0 (0.0%) | 0 (0.0%) |
| Food Preparation & Serving | 9 (25.0%) | 27 (75.0%) |
| Cleaning & Maintenance | 1 (14.3%) | 6 (85.7%) |
| Personal Care & Service | 0 (0.0%) | 7 (100.0%) |
| Total (Category) | 20 (27.0%) | 54 (73.0%) |
| Total (Overall) | 159 (53.7%) | 137 (46.3%) |
Sales and Office Occupations
The most common Sales and Office occupations in Calhoun are Sales & Related (14 | 4.7%), and Office & Administration (14 | 4.7%).

Sales and Office Occupations by Sex

| Occupation | Male | Female |
| Sales & Related | 3 (21.4%) | 11 (78.6%) |
| Office & Administration | 1 (7.1%) | 13 (92.9%) |
| Total (Category) | 4 (14.3%) | 24 (85.7%) |
| Total (Overall) | 159 (53.7%) | 137 (46.3%) |
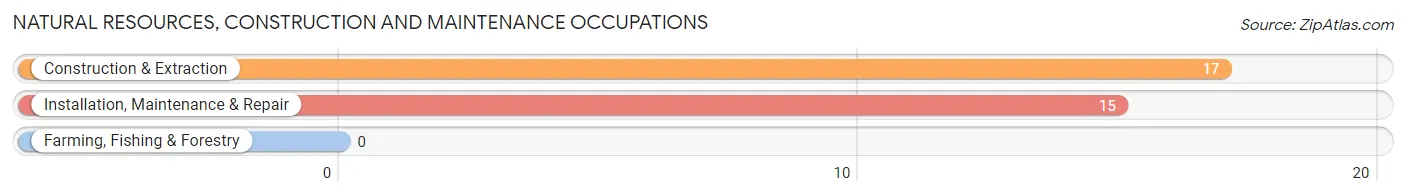
Natural Resources, Construction and Maintenance Occupations
The most common Natural Resources, Construction and Maintenance occupations in Calhoun are Construction & Extraction (17 | 5.7%), and Installation, Maintenance & Repair (15 | 5.1%).
Natural Resources, Construction and Maintenance Occupations by Sex
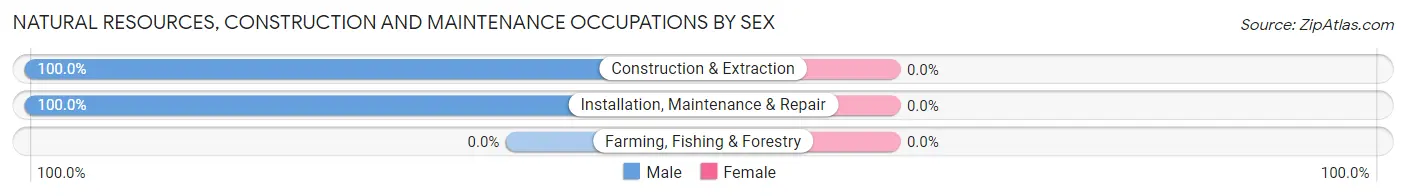
| Occupation | Male | Female |
| Farming, Fishing & Forestry | 0 (0.0%) | 0 (0.0%) |
| Construction & Extraction | 17 (100.0%) | 0 (0.0%) |
| Installation, Maintenance & Repair | 15 (100.0%) | 0 (0.0%) |
| Total (Category) | 32 (100.0%) | 0 (0.0%) |
| Total (Overall) | 159 (53.7%) | 137 (46.3%) |
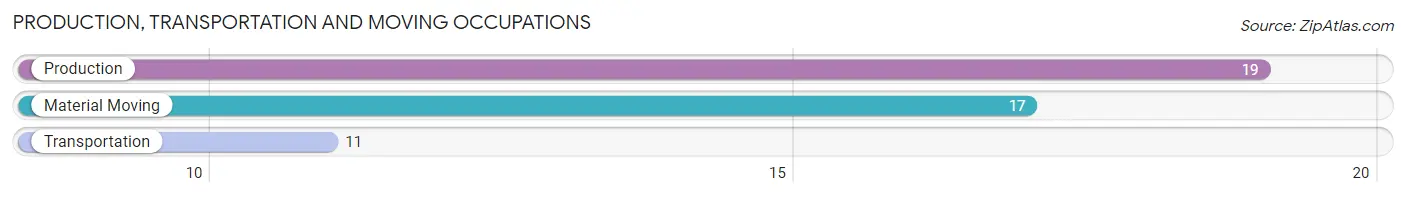
Production, Transportation and Moving Occupations
The most common Production, Transportation and Moving occupations in Calhoun are Production (19 | 6.4%), Material Moving (17 | 5.7%), and Transportation (11 | 3.7%).
Production, Transportation and Moving Occupations by Sex
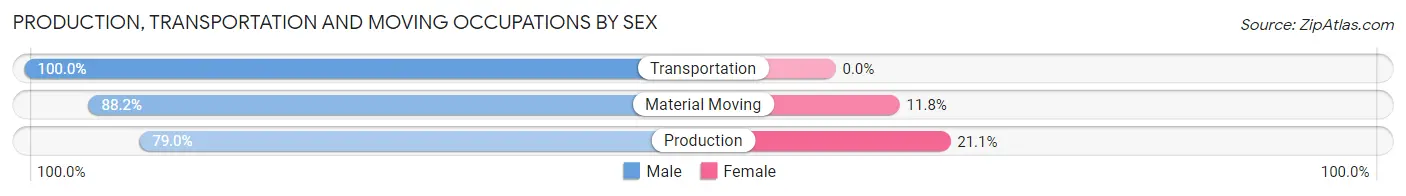
| Occupation | Male | Female |
| Production | 15 (78.9%) | 4 (21.0%) |
| Transportation | 11 (100.0%) | 0 (0.0%) |
| Material Moving | 15 (88.2%) | 2 (11.8%) |
| Total (Category) | 41 (87.2%) | 6 (12.8%) |
| Total (Overall) | 159 (53.7%) | 137 (46.3%) |
Employment Industries by Sex in Calhoun
Employment Industries in Calhoun
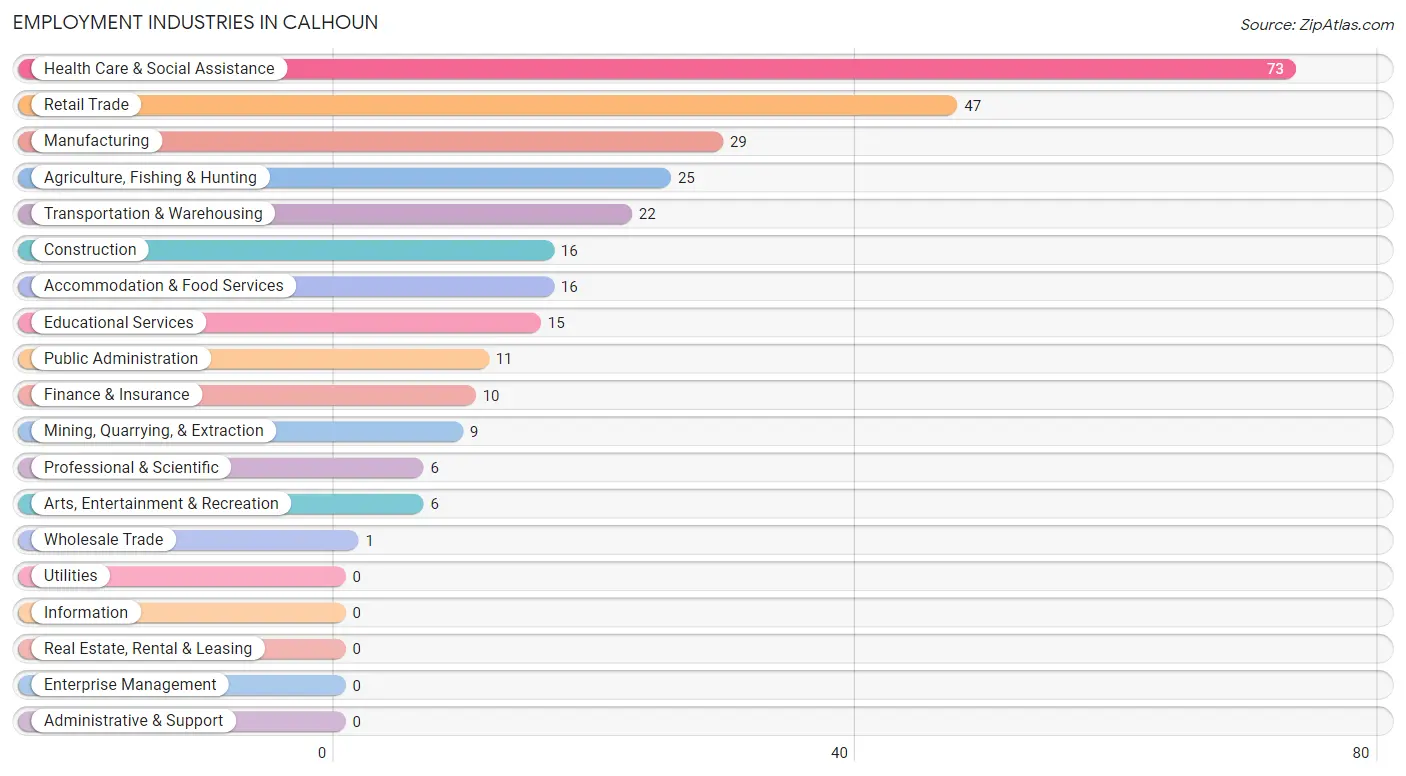
The major employment industries in Calhoun include Health Care & Social Assistance (73 | 24.7%), Retail Trade (47 | 15.9%), Manufacturing (29 | 9.8%), Agriculture, Fishing & Hunting (25 | 8.5%), and Transportation & Warehousing (22 | 7.4%).
Employment Industries by Sex in Calhoun
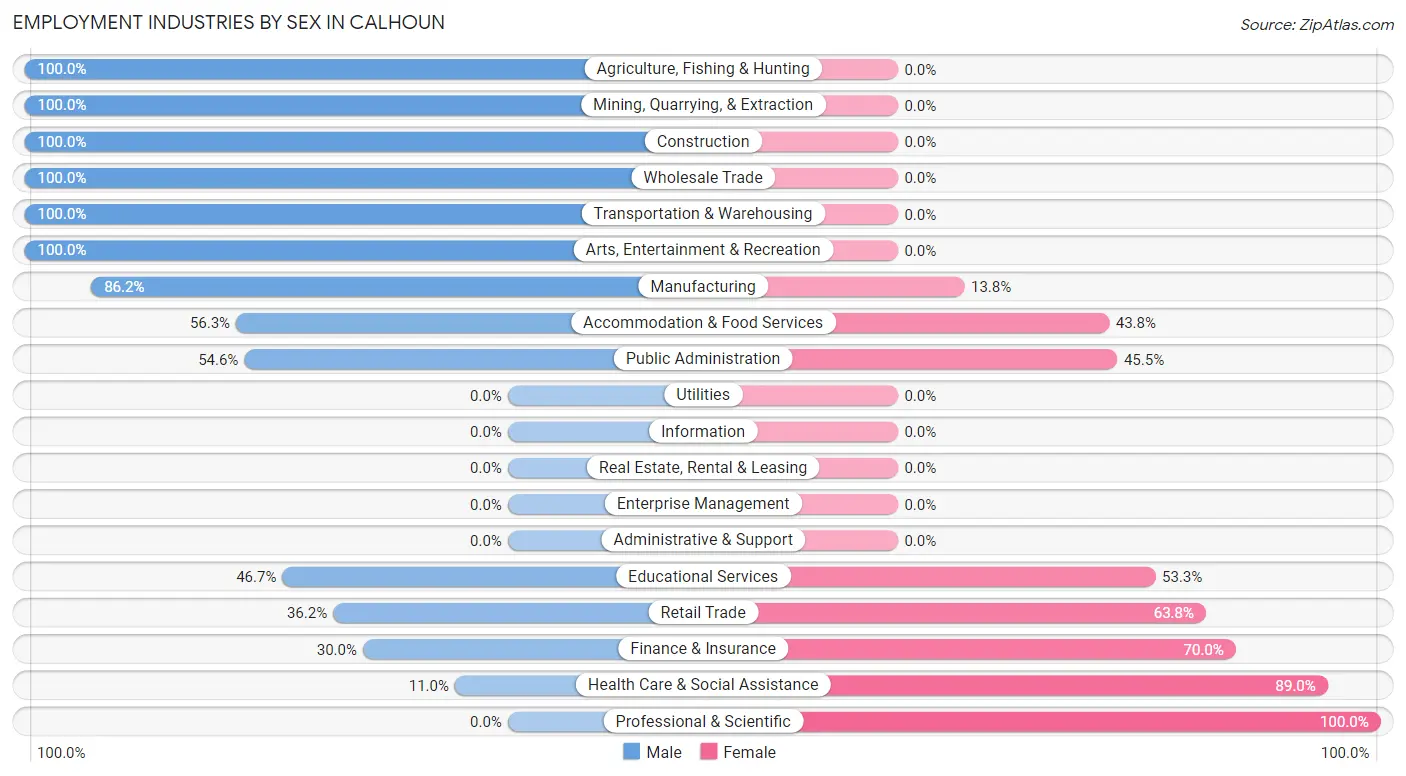
The Calhoun industries that see more men than women are Agriculture, Fishing & Hunting (100.0%), Mining, Quarrying, & Extraction (100.0%), and Construction (100.0%), whereas the industries that tend to have a higher number of women are Professional & Scientific (100.0%), Health Care & Social Assistance (89.0%), and Finance & Insurance (70.0%).
| Industry | Male | Female |
| Agriculture, Fishing & Hunting | 25 (100.0%) | 0 (0.0%) |
| Mining, Quarrying, & Extraction | 9 (100.0%) | 0 (0.0%) |
| Construction | 16 (100.0%) | 0 (0.0%) |
| Manufacturing | 25 (86.2%) | 4 (13.8%) |
| Wholesale Trade | 1 (100.0%) | 0 (0.0%) |
| Retail Trade | 17 (36.2%) | 30 (63.8%) |
| Transportation & Warehousing | 22 (100.0%) | 0 (0.0%) |
| Utilities | 0 (0.0%) | 0 (0.0%) |
| Information | 0 (0.0%) | 0 (0.0%) |
| Finance & Insurance | 3 (30.0%) | 7 (70.0%) |
| Real Estate, Rental & Leasing | 0 (0.0%) | 0 (0.0%) |
| Professional & Scientific | 0 (0.0%) | 6 (100.0%) |
| Enterprise Management | 0 (0.0%) | 0 (0.0%) |
| Administrative & Support | 0 (0.0%) | 0 (0.0%) |
| Educational Services | 7 (46.7%) | 8 (53.3%) |
| Health Care & Social Assistance | 8 (11.0%) | 65 (89.0%) |
| Arts, Entertainment & Recreation | 6 (100.0%) | 0 (0.0%) |
| Accommodation & Food Services | 9 (56.2%) | 7 (43.8%) |
| Public Administration | 6 (54.5%) | 5 (45.5%) |
| Total | 159 (53.7%) | 137 (46.3%) |
Education in Calhoun
School Enrollment in Calhoun
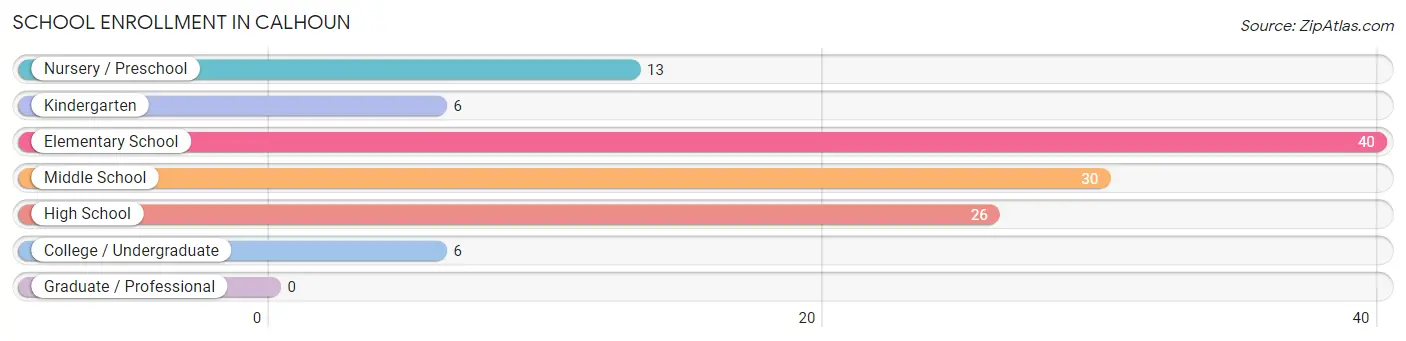
The most common levels of schooling among the 121 students in Calhoun are elementary school (40 | 33.1%), middle school (30 | 24.8%), and high school (26 | 21.5%).
| School Level | # Students | % Students |
| Nursery / Preschool | 13 | 10.7% |
| Kindergarten | 6 | 5.0% |
| Elementary School | 40 | 33.1% |
| Middle School | 30 | 24.8% |
| High School | 26 | 21.5% |
| College / Undergraduate | 6 | 5.0% |
| Graduate / Professional | 0 | 0.0% |
| Total | 121 | 100.0% |
School Enrollment by Age by Funding Source in Calhoun
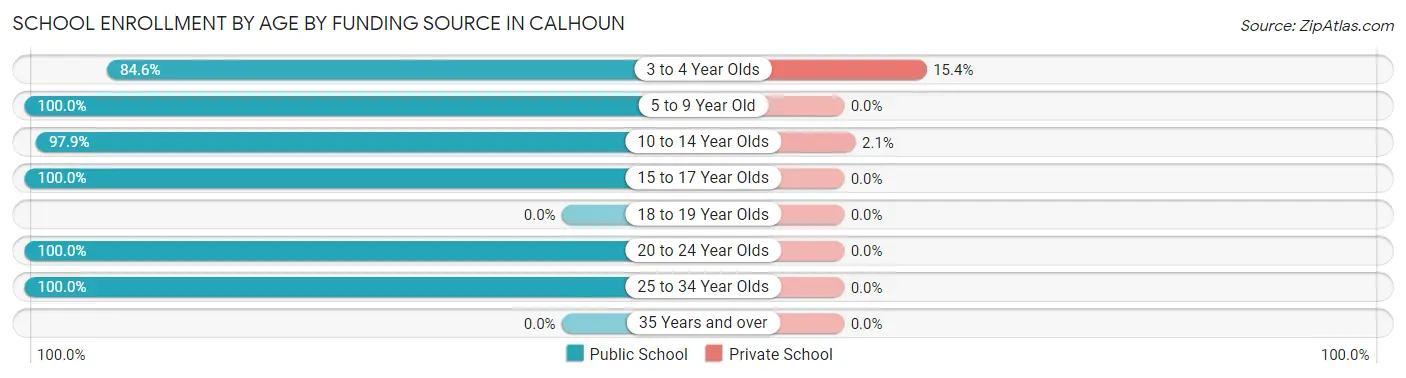
Out of a total of 121 students who are enrolled in schools in Calhoun, 3 (2.5%) attend a private institution, while the remaining 118 (97.5%) are enrolled in public schools. The age group of 3 to 4 year olds has the highest likelihood of being enrolled in private schools, with 2 (15.4% in the age bracket) enrolled. Conversely, the age group of 5 to 9 year old has the lowest likelihood of being enrolled in a private school, with 29 (100.0% in the age bracket) attending a public institution.
| Age Bracket | Public School | Private School |
| 3 to 4 Year Olds | 11 (84.6%) | 2 (15.4%) |
| 5 to 9 Year Old | 29 (100.0%) | 0 (0.0%) |
| 10 to 14 Year Olds | 46 (97.9%) | 1 (2.1%) |
| 15 to 17 Year Olds | 26 (100.0%) | 0 (0.0%) |
| 18 to 19 Year Olds | 0 (0.0%) | 0 (0.0%) |
| 20 to 24 Year Olds | 4 (100.0%) | 0 (0.0%) |
| 25 to 34 Year Olds | 2 (100.0%) | 0 (0.0%) |
| 35 Years and over | 0 (0.0%) | 0 (0.0%) |
| Total | 118 (97.5%) | 3 (2.5%) |
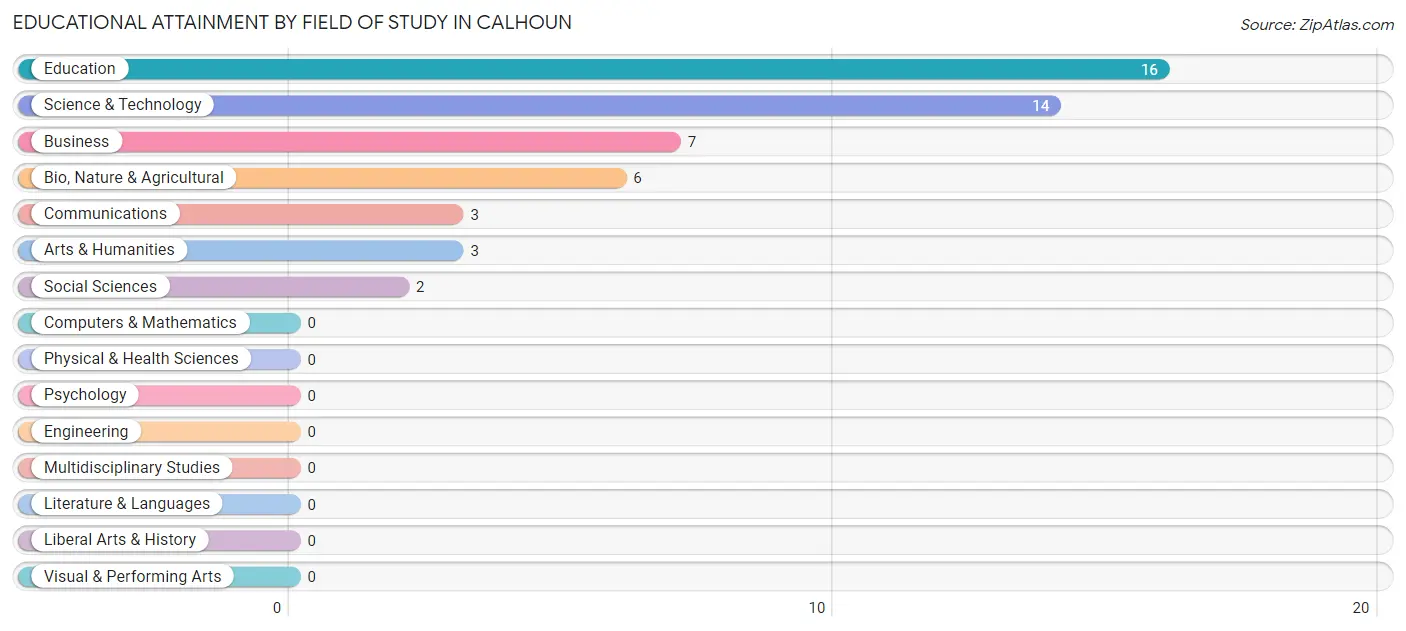
Educational Attainment by Field of Study in Calhoun
Education (16 | 31.4%), science & technology (14 | 27.5%), business (7 | 13.7%), bio, nature & agricultural (6 | 11.8%), and communications (3 | 5.9%) are the most common fields of study among 51 individuals in Calhoun who have obtained a bachelor's degree or higher.
| Field of Study | # Graduates | % Graduates |
| Computers & Mathematics | 0 | 0.0% |
| Bio, Nature & Agricultural | 6 | 11.8% |
| Physical & Health Sciences | 0 | 0.0% |
| Psychology | 0 | 0.0% |
| Social Sciences | 2 | 3.9% |
| Engineering | 0 | 0.0% |
| Multidisciplinary Studies | 0 | 0.0% |
| Science & Technology | 14 | 27.5% |
| Business | 7 | 13.7% |
| Education | 16 | 31.4% |
| Literature & Languages | 0 | 0.0% |
| Liberal Arts & History | 0 | 0.0% |
| Visual & Performing Arts | 0 | 0.0% |
| Communications | 3 | 5.9% |
| Arts & Humanities | 3 | 5.9% |
| Total | 51 | 100.0% |
Transportation & Commute in Calhoun
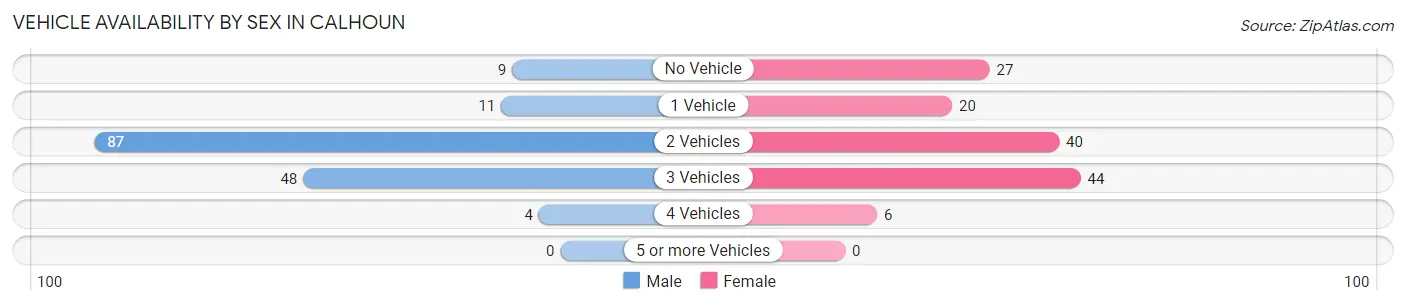
Vehicle Availability by Sex in Calhoun
The most prevalent vehicle ownership categories in Calhoun are males with 2 vehicles (87, accounting for 54.7%) and females with 2 vehicles (40, making up 63.5%).
| Vehicles Available | Male | Female |
| No Vehicle | 9 (5.7%) | 27 (19.7%) |
| 1 Vehicle | 11 (6.9%) | 20 (14.6%) |
| 2 Vehicles | 87 (54.7%) | 40 (29.2%) |
| 3 Vehicles | 48 (30.2%) | 44 (32.1%) |
| 4 Vehicles | 4 (2.5%) | 6 (4.4%) |
| 5 or more Vehicles | 0 (0.0%) | 0 (0.0%) |
| Total | 159 (100.0%) | 137 (100.0%) |
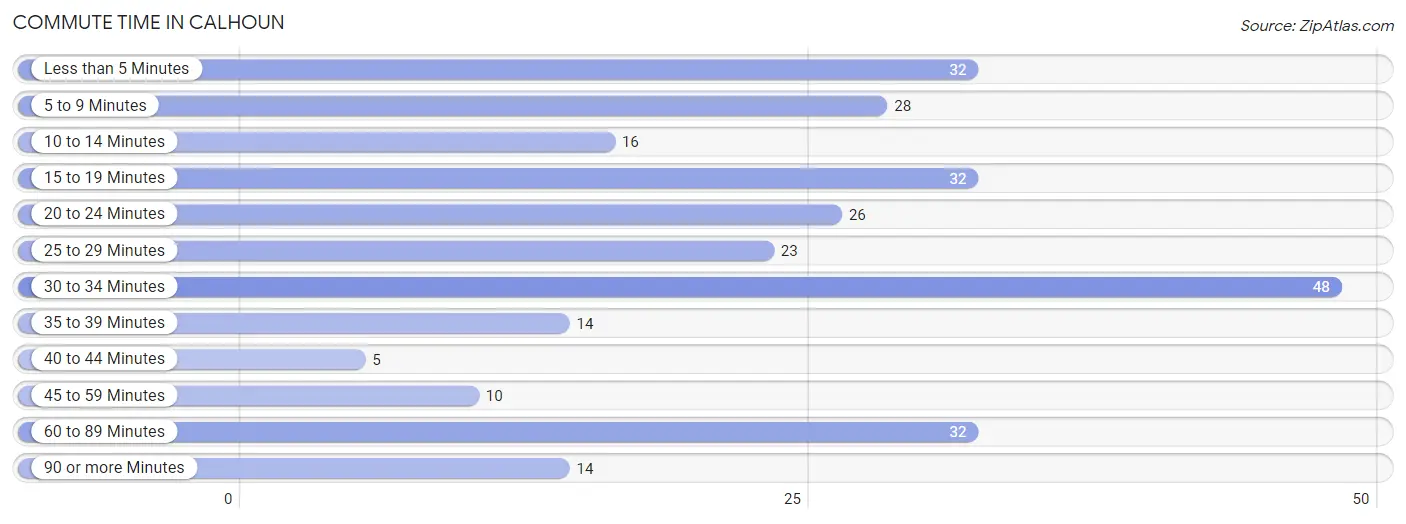
Commute Time in Calhoun
The most frequently occuring commute durations in Calhoun are 30 to 34 minutes (48 commuters, 17.1%), less than 5 minutes (32 commuters, 11.4%), and 15 to 19 minutes (32 commuters, 11.4%).
| Commute Time | # Commuters | % Commuters |
| Less than 5 Minutes | 32 | 11.4% |
| 5 to 9 Minutes | 28 | 10.0% |
| 10 to 14 Minutes | 16 | 5.7% |
| 15 to 19 Minutes | 32 | 11.4% |
| 20 to 24 Minutes | 26 | 9.3% |
| 25 to 29 Minutes | 23 | 8.2% |
| 30 to 34 Minutes | 48 | 17.1% |
| 35 to 39 Minutes | 14 | 5.0% |
| 40 to 44 Minutes | 5 | 1.8% |
| 45 to 59 Minutes | 10 | 3.6% |
| 60 to 89 Minutes | 32 | 11.4% |
| 90 or more Minutes | 14 | 5.0% |
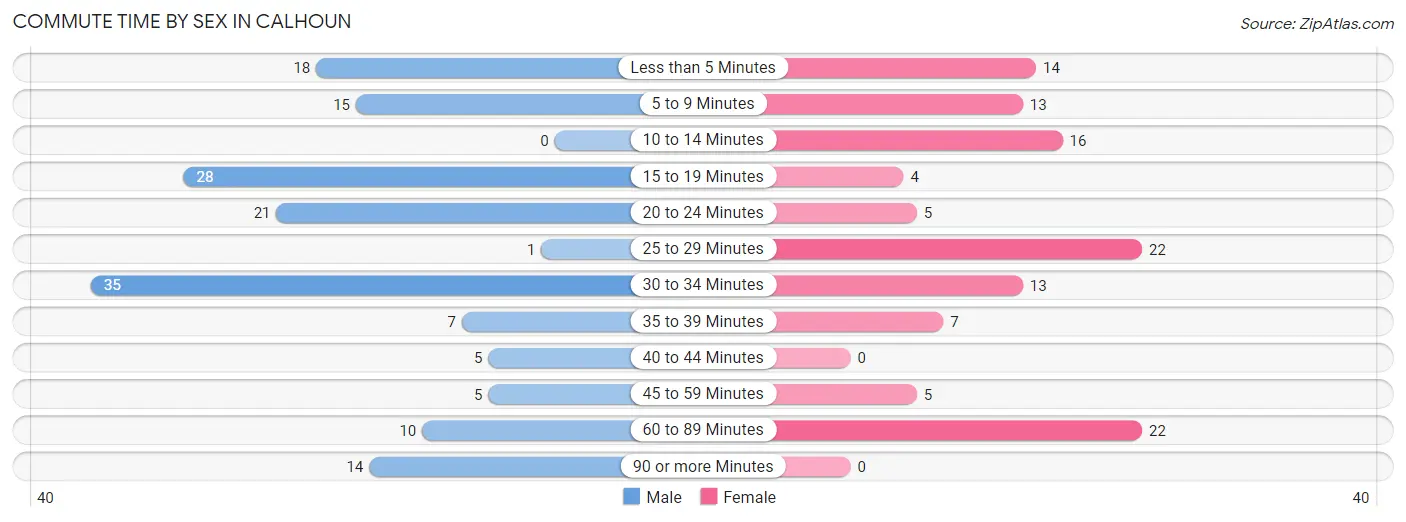
Commute Time by Sex in Calhoun
The most common commute times in Calhoun are 30 to 34 minutes (35 commuters, 22.0%) for males and 25 to 29 minutes (22 commuters, 18.2%) for females.
| Commute Time | Male | Female |
| Less than 5 Minutes | 18 (11.3%) | 14 (11.6%) |
| 5 to 9 Minutes | 15 (9.4%) | 13 (10.7%) |
| 10 to 14 Minutes | 0 (0.0%) | 16 (13.2%) |
| 15 to 19 Minutes | 28 (17.6%) | 4 (3.3%) |
| 20 to 24 Minutes | 21 (13.2%) | 5 (4.1%) |
| 25 to 29 Minutes | 1 (0.6%) | 22 (18.2%) |
| 30 to 34 Minutes | 35 (22.0%) | 13 (10.7%) |
| 35 to 39 Minutes | 7 (4.4%) | 7 (5.8%) |
| 40 to 44 Minutes | 5 (3.1%) | 0 (0.0%) |
| 45 to 59 Minutes | 5 (3.1%) | 5 (4.1%) |
| 60 to 89 Minutes | 10 (6.3%) | 22 (18.2%) |
| 90 or more Minutes | 14 (8.8%) | 0 (0.0%) |
Time of Departure to Work by Sex in Calhoun
The most frequent times of departure to work in Calhoun are 6:30 AM to 6:59 AM (40, 25.2%) for males and 4:00 PM to 11:59 PM (30, 24.8%) for females.

| Time of Departure | Male | Female |
| 12:00 AM to 4:59 AM | 17 (10.7%) | 18 (14.9%) |
| 5:00 AM to 5:29 AM | 4 (2.5%) | 0 (0.0%) |
| 5:30 AM to 5:59 AM | 11 (6.9%) | 1 (0.8%) |
| 6:00 AM to 6:29 AM | 23 (14.5%) | 17 (14.1%) |
| 6:30 AM to 6:59 AM | 40 (25.2%) | 15 (12.4%) |
| 7:00 AM to 7:29 AM | 3 (1.9%) | 10 (8.3%) |
| 7:30 AM to 7:59 AM | 2 (1.3%) | 11 (9.1%) |
| 8:00 AM to 8:29 AM | 0 (0.0%) | 0 (0.0%) |
| 8:30 AM to 8:59 AM | 7 (4.4%) | 0 (0.0%) |
| 9:00 AM to 9:59 AM | 11 (6.9%) | 6 (5.0%) |
| 10:00 AM to 10:59 AM | 12 (7.5%) | 0 (0.0%) |
| 11:00 AM to 11:59 AM | 0 (0.0%) | 0 (0.0%) |
| 12:00 PM to 3:59 PM | 1 (0.6%) | 13 (10.7%) |
| 4:00 PM to 11:59 PM | 28 (17.6%) | 30 (24.8%) |
| Total | 159 (100.0%) | 121 (100.0%) |
Housing Occupancy in Calhoun
Occupancy by Ownership in Calhoun
Of the total 341 dwellings in Calhoun, owner-occupied units account for 261 (76.5%), while renter-occupied units make up 80 (23.5%).
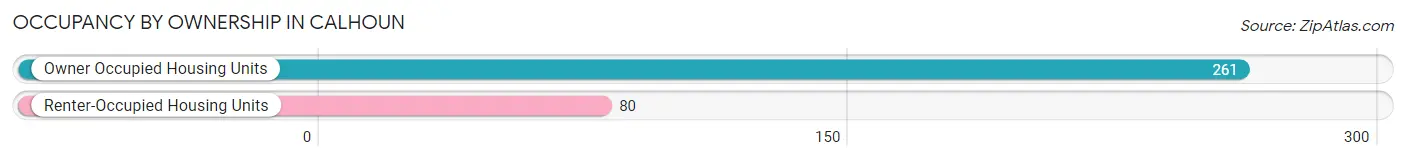
| Occupancy | # Housing Units | % Housing Units |
| Owner Occupied Housing Units | 261 | 76.5% |
| Renter-Occupied Housing Units | 80 | 23.5% |
| Total Occupied Housing Units | 341 | 100.0% |
Occupancy by Household Size in Calhoun
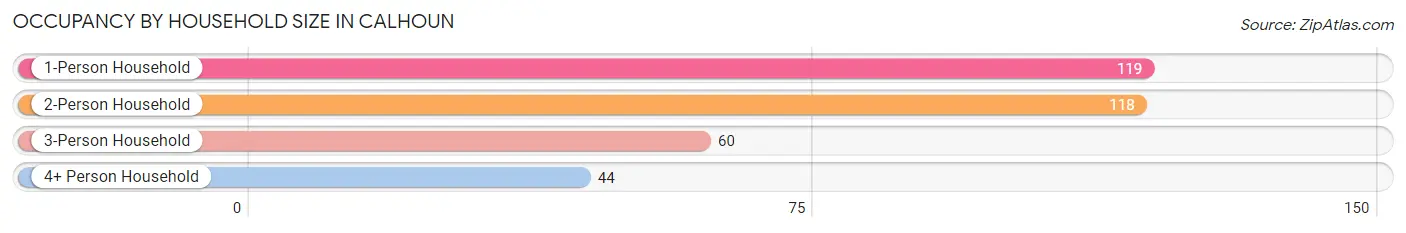
| Household Size | # Housing Units | % Housing Units |
| 1-Person Household | 119 | 34.9% |
| 2-Person Household | 118 | 34.6% |
| 3-Person Household | 60 | 17.6% |
| 4+ Person Household | 44 | 12.9% |
| Total Housing Units | 341 | 100.0% |
Occupancy by Ownership by Household Size in Calhoun
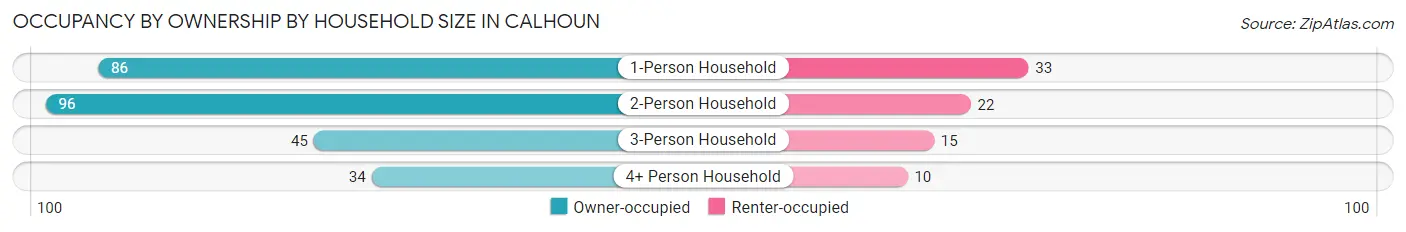
| Household Size | Owner-occupied | Renter-occupied |
| 1-Person Household | 86 (72.3%) | 33 (27.7%) |
| 2-Person Household | 96 (81.4%) | 22 (18.6%) |
| 3-Person Household | 45 (75.0%) | 15 (25.0%) |
| 4+ Person Household | 34 (77.3%) | 10 (22.7%) |
| Total Housing Units | 261 (76.5%) | 80 (23.5%) |
Occupancy by Educational Attainment in Calhoun
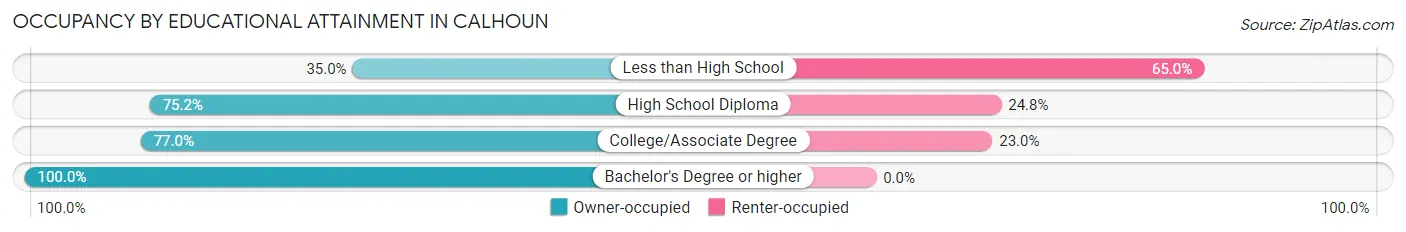
| Household Size | Owner-occupied | Renter-occupied |
| Less than High School | 7 (35.0%) | 13 (65.0%) |
| High School Diploma | 97 (75.2%) | 32 (24.8%) |
| College/Associate Degree | 117 (77.0%) | 35 (23.0%) |
| Bachelor's Degree or higher | 40 (100.0%) | 0 (0.0%) |
Occupancy by Age of Householder in Calhoun
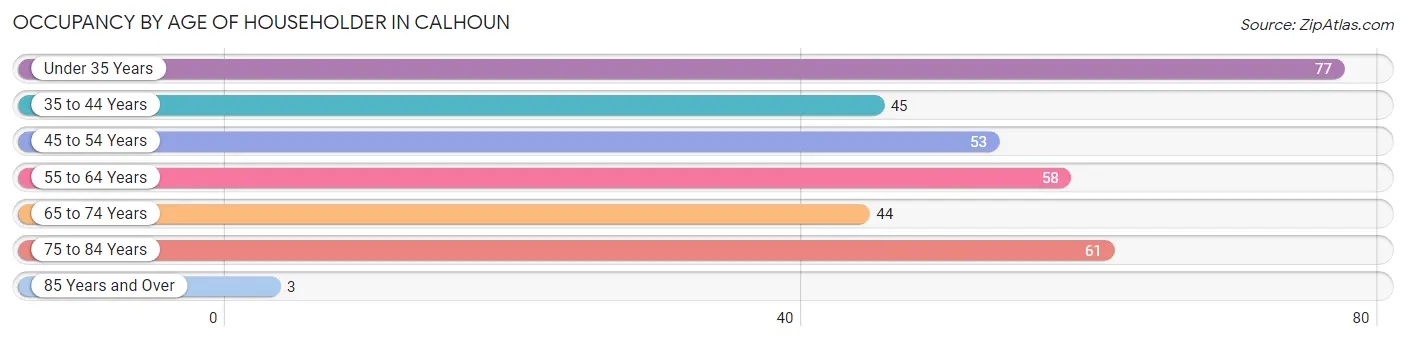
| Age Bracket | # Households | % Households |
| Under 35 Years | 77 | 22.6% |
| 35 to 44 Years | 45 | 13.2% |
| 45 to 54 Years | 53 | 15.5% |
| 55 to 64 Years | 58 | 17.0% |
| 65 to 74 Years | 44 | 12.9% |
| 75 to 84 Years | 61 | 17.9% |
| 85 Years and Over | 3 | 0.9% |
| Total | 341 | 100.0% |
Housing Finances in Calhoun
Median Income by Occupancy in Calhoun
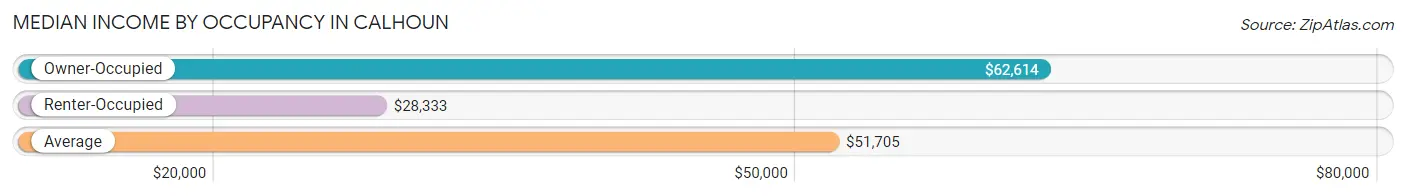
| Occupancy Type | # Households | Median Income |
| Owner-Occupied | 261 (76.5%) | $62,614 |
| Renter-Occupied | 80 (23.5%) | $28,333 |
| Average | 341 (100.0%) | $51,705 |
Occupancy by Householder Income Bracket in Calhoun
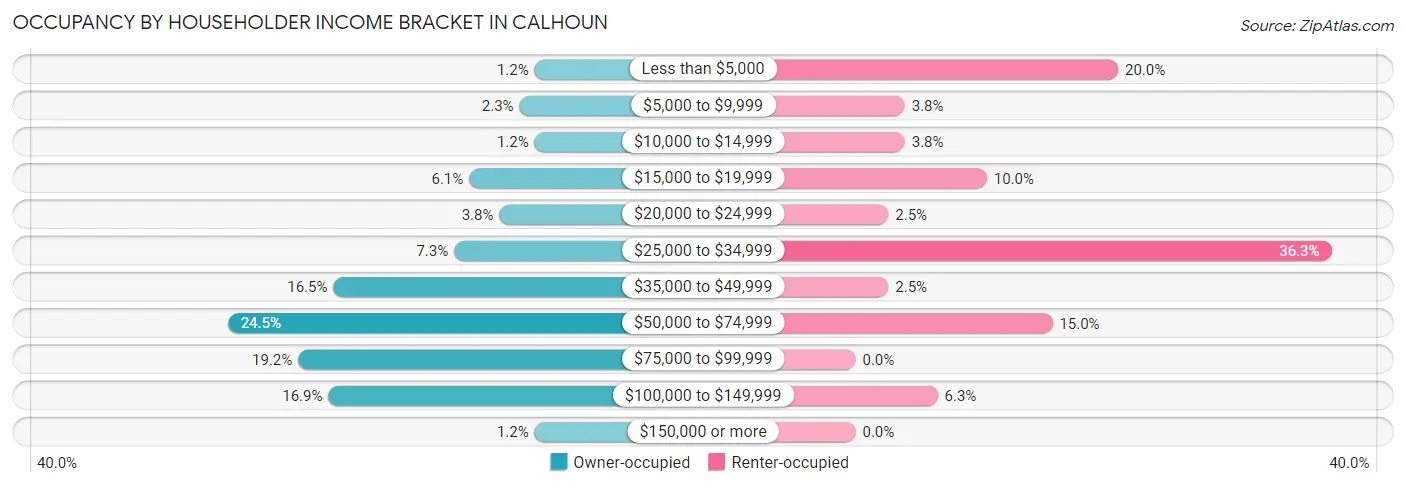
| Income Bracket | Owner-occupied | Renter-occupied |
| Less than $5,000 | 3 (1.1%) | 16 (20.0%) |
| $5,000 to $9,999 | 6 (2.3%) | 3 (3.7%) |
| $10,000 to $14,999 | 3 (1.1%) | 3 (3.7%) |
| $15,000 to $19,999 | 16 (6.1%) | 8 (10.0%) |
| $20,000 to $24,999 | 10 (3.8%) | 2 (2.5%) |
| $25,000 to $34,999 | 19 (7.3%) | 29 (36.2%) |
| $35,000 to $49,999 | 43 (16.5%) | 2 (2.5%) |
| $50,000 to $74,999 | 64 (24.5%) | 12 (15.0%) |
| $75,000 to $99,999 | 50 (19.2%) | 0 (0.0%) |
| $100,000 to $149,999 | 44 (16.9%) | 5 (6.2%) |
| $150,000 or more | 3 (1.1%) | 0 (0.0%) |
| Total | 261 (100.0%) | 80 (100.0%) |
Monthly Housing Cost Tiers in Calhoun
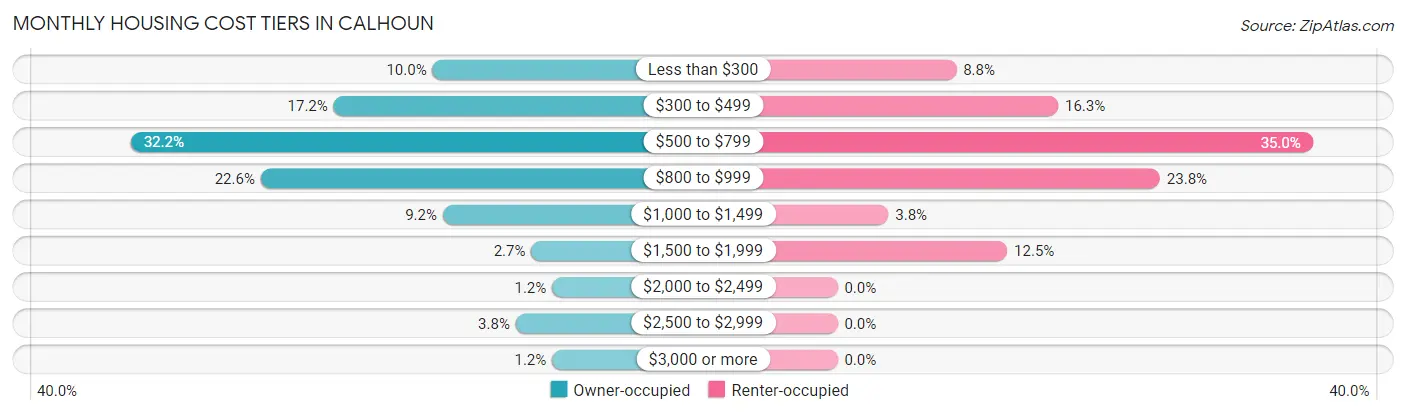
| Monthly Cost | Owner-occupied | Renter-occupied |
| Less than $300 | 26 (10.0%) | 7 (8.7%) |
| $300 to $499 | 45 (17.2%) | 13 (16.3%) |
| $500 to $799 | 84 (32.2%) | 28 (35.0%) |
| $800 to $999 | 59 (22.6%) | 19 (23.7%) |
| $1,000 to $1,499 | 24 (9.2%) | 3 (3.7%) |
| $1,500 to $1,999 | 7 (2.7%) | 10 (12.5%) |
| $2,000 to $2,499 | 3 (1.1%) | 0 (0.0%) |
| $2,500 to $2,999 | 10 (3.8%) | 0 (0.0%) |
| $3,000 or more | 3 (1.1%) | 0 (0.0%) |
| Total | 261 (100.0%) | 80 (100.0%) |
Physical Housing Characteristics in Calhoun
Housing Structures in Calhoun
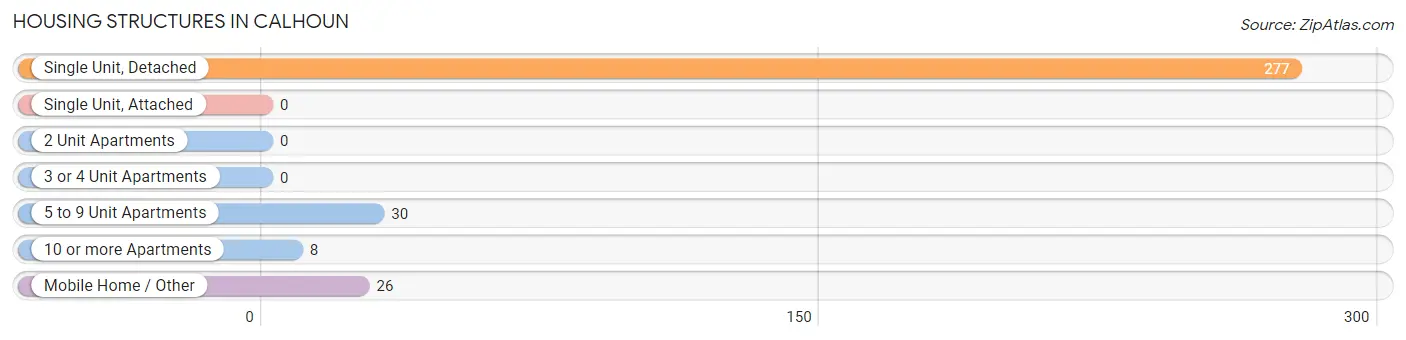
| Structure Type | # Housing Units | % Housing Units |
| Single Unit, Detached | 277 | 81.2% |
| Single Unit, Attached | 0 | 0.0% |
| 2 Unit Apartments | 0 | 0.0% |
| 3 or 4 Unit Apartments | 0 | 0.0% |
| 5 to 9 Unit Apartments | 30 | 8.8% |
| 10 or more Apartments | 8 | 2.4% |
| Mobile Home / Other | 26 | 7.6% |
| Total | 341 | 100.0% |
Housing Structures by Occupancy in Calhoun
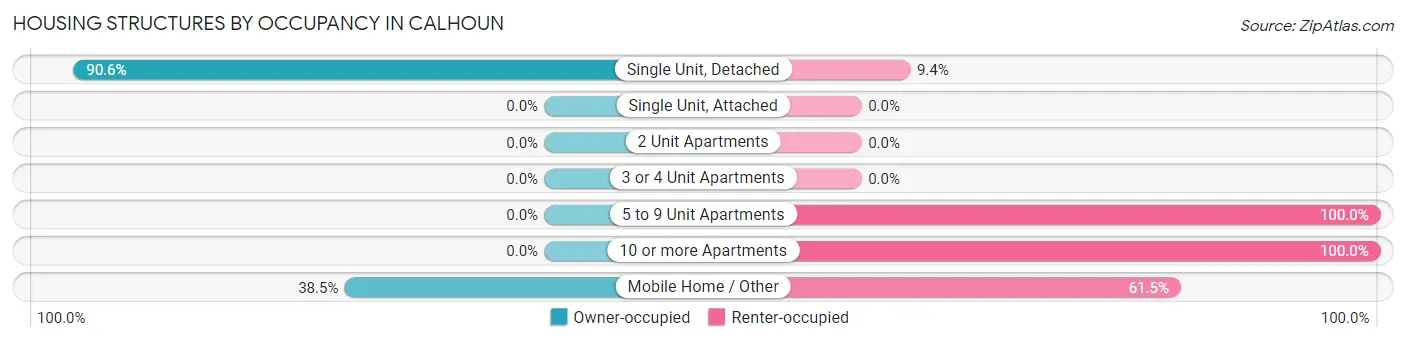
| Structure Type | Owner-occupied | Renter-occupied |
| Single Unit, Detached | 251 (90.6%) | 26 (9.4%) |
| Single Unit, Attached | 0 (0.0%) | 0 (0.0%) |
| 2 Unit Apartments | 0 (0.0%) | 0 (0.0%) |
| 3 or 4 Unit Apartments | 0 (0.0%) | 0 (0.0%) |
| 5 to 9 Unit Apartments | 0 (0.0%) | 30 (100.0%) |
| 10 or more Apartments | 0 (0.0%) | 8 (100.0%) |
| Mobile Home / Other | 10 (38.5%) | 16 (61.5%) |
| Total | 261 (76.5%) | 80 (23.5%) |
Housing Structures by Number of Rooms in Calhoun
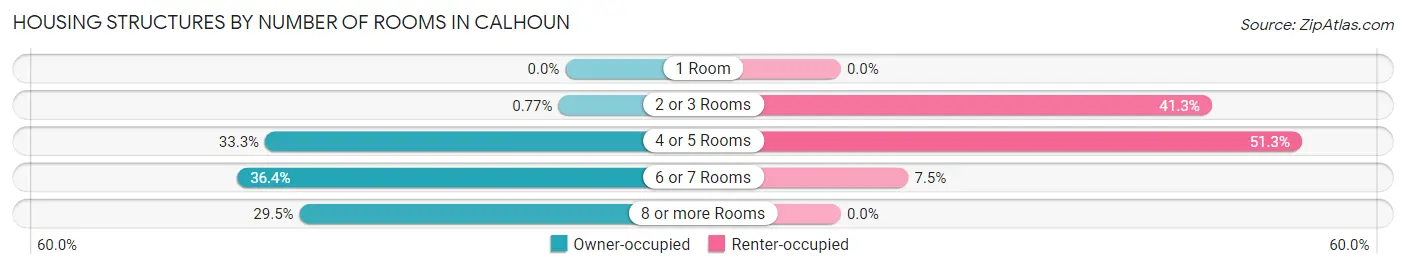
| Number of Rooms | Owner-occupied | Renter-occupied |
| 1 Room | 0 (0.0%) | 0 (0.0%) |
| 2 or 3 Rooms | 2 (0.8%) | 33 (41.2%) |
| 4 or 5 Rooms | 87 (33.3%) | 41 (51.2%) |
| 6 or 7 Rooms | 95 (36.4%) | 6 (7.5%) |
| 8 or more Rooms | 77 (29.5%) | 0 (0.0%) |
| Total | 261 (100.0%) | 80 (100.0%) |
Housing Structure by Heating Type in Calhoun
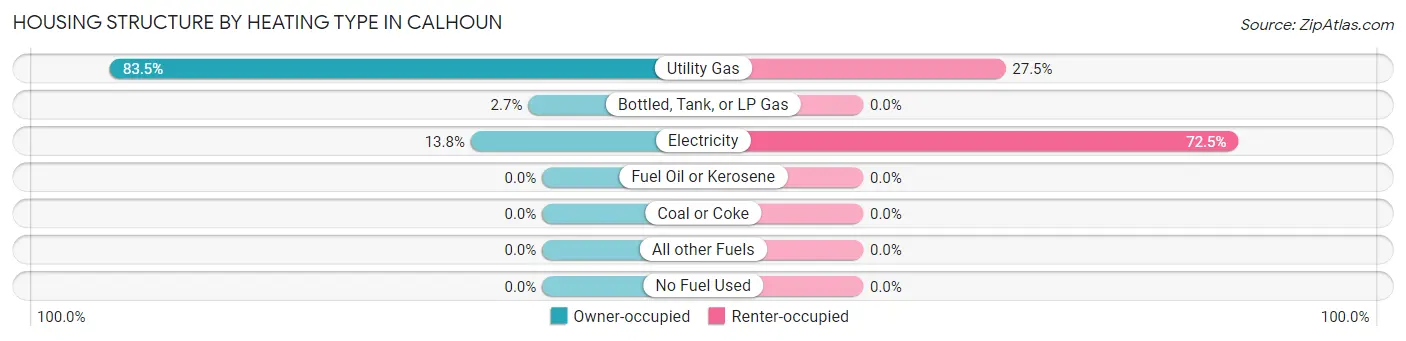
| Heating Type | Owner-occupied | Renter-occupied |
| Utility Gas | 218 (83.5%) | 22 (27.5%) |
| Bottled, Tank, or LP Gas | 7 (2.7%) | 0 (0.0%) |
| Electricity | 36 (13.8%) | 58 (72.5%) |
| Fuel Oil or Kerosene | 0 (0.0%) | 0 (0.0%) |
| Coal or Coke | 0 (0.0%) | 0 (0.0%) |
| All other Fuels | 0 (0.0%) | 0 (0.0%) |
| No Fuel Used | 0 (0.0%) | 0 (0.0%) |
| Total | 261 (100.0%) | 80 (100.0%) |
Household Vehicle Usage in Calhoun
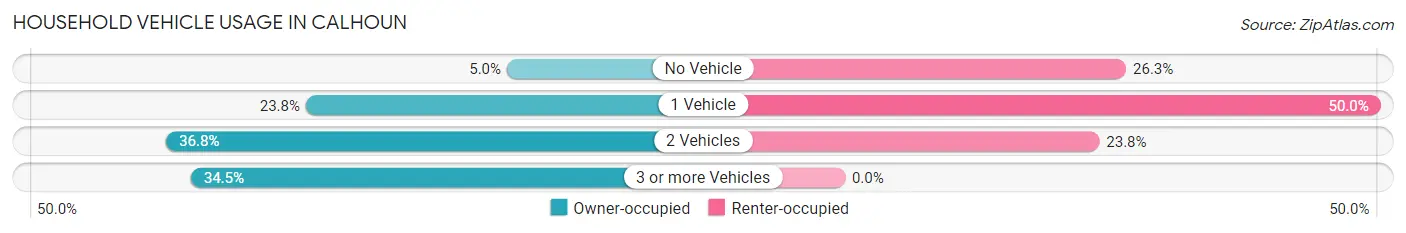
| Vehicles per Household | Owner-occupied | Renter-occupied |
| No Vehicle | 13 (5.0%) | 21 (26.3%) |
| 1 Vehicle | 62 (23.7%) | 40 (50.0%) |
| 2 Vehicles | 96 (36.8%) | 19 (23.7%) |
| 3 or more Vehicles | 90 (34.5%) | 0 (0.0%) |
| Total | 261 (100.0%) | 80 (100.0%) |
Real Estate & Mortgages in Calhoun
Real Estate and Mortgage Overview in Calhoun
| Characteristic | Without Mortgage | With Mortgage |
| Housing Units | 119 | 142 |
| Median Property Value | $83,100 | $121,900 |
| Median Household Income | $46,771 | $3 |
| Monthly Housing Costs | $436 | $3 |
| Real Estate Taxes | $550 | $2 |
Property Value by Mortgage Status in Calhoun
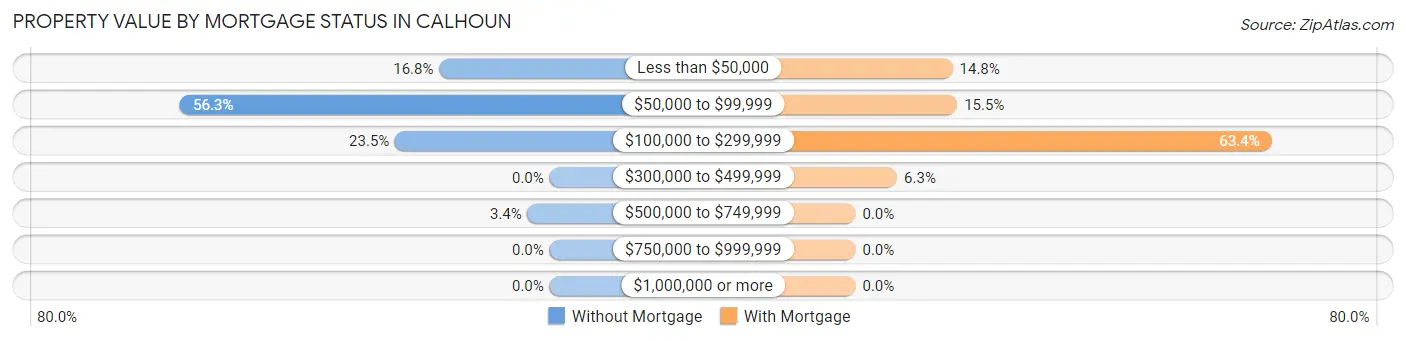
| Property Value | Without Mortgage | With Mortgage |
| Less than $50,000 | 20 (16.8%) | 21 (14.8%) |
| $50,000 to $99,999 | 67 (56.3%) | 22 (15.5%) |
| $100,000 to $299,999 | 28 (23.5%) | 90 (63.4%) |
| $300,000 to $499,999 | 0 (0.0%) | 9 (6.3%) |
| $500,000 to $749,999 | 4 (3.4%) | 0 (0.0%) |
| $750,000 to $999,999 | 0 (0.0%) | 0 (0.0%) |
| $1,000,000 or more | 0 (0.0%) | 0 (0.0%) |
| Total | 119 (100.0%) | 142 (100.0%) |
Household Income by Mortgage Status in Calhoun
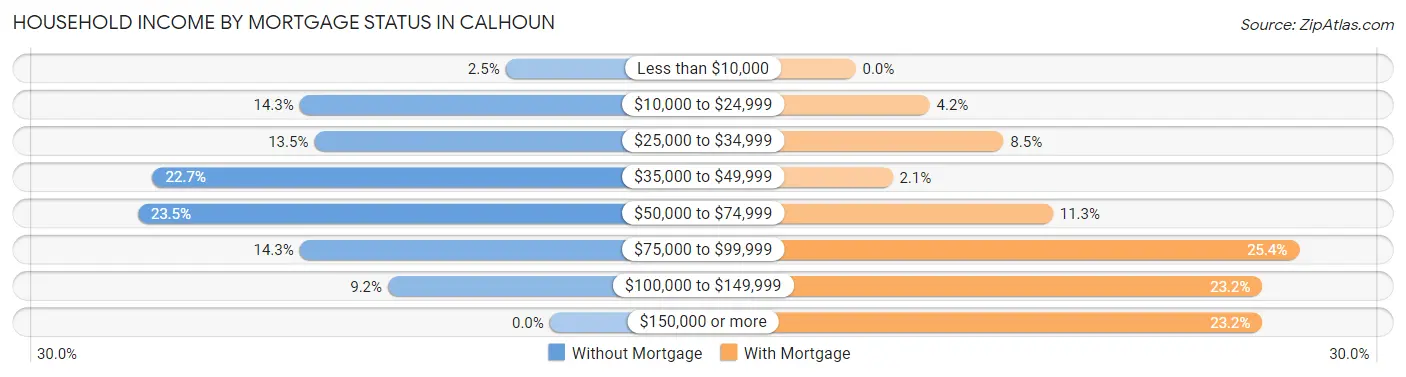
| Household Income | Without Mortgage | With Mortgage |
| Less than $10,000 | 3 (2.5%) | 0 (0.0%) |
| $10,000 to $24,999 | 17 (14.3%) | 6 (4.2%) |
| $25,000 to $34,999 | 16 (13.5%) | 12 (8.5%) |
| $35,000 to $49,999 | 27 (22.7%) | 3 (2.1%) |
| $50,000 to $74,999 | 28 (23.5%) | 16 (11.3%) |
| $75,000 to $99,999 | 17 (14.3%) | 36 (25.4%) |
| $100,000 to $149,999 | 11 (9.2%) | 33 (23.2%) |
| $150,000 or more | 0 (0.0%) | 33 (23.2%) |
| Total | 119 (100.0%) | 142 (100.0%) |
Property Value to Household Income Ratio in Calhoun
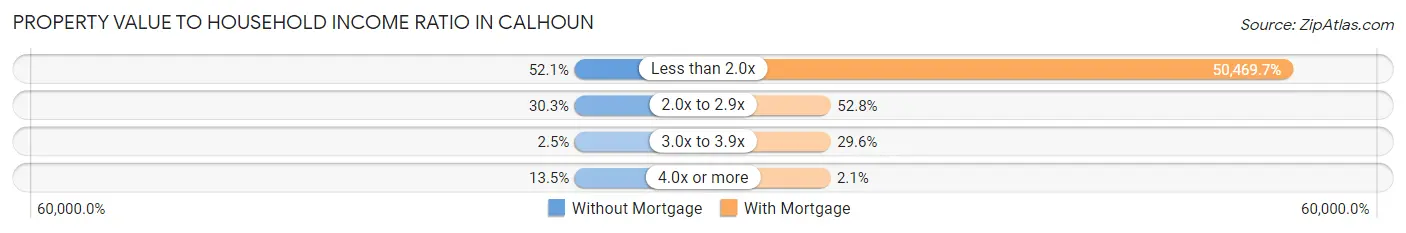
| Value-to-Income Ratio | Without Mortgage | With Mortgage |
| Less than 2.0x | 62 (52.1%) | 71,667 (50,469.7%) |
| 2.0x to 2.9x | 36 (30.2%) | 75 (52.8%) |
| 3.0x to 3.9x | 3 (2.5%) | 42 (29.6%) |
| 4.0x or more | 16 (13.5%) | 3 (2.1%) |
| Total | 119 (100.0%) | 142 (100.0%) |
Real Estate Taxes by Mortgage Status in Calhoun
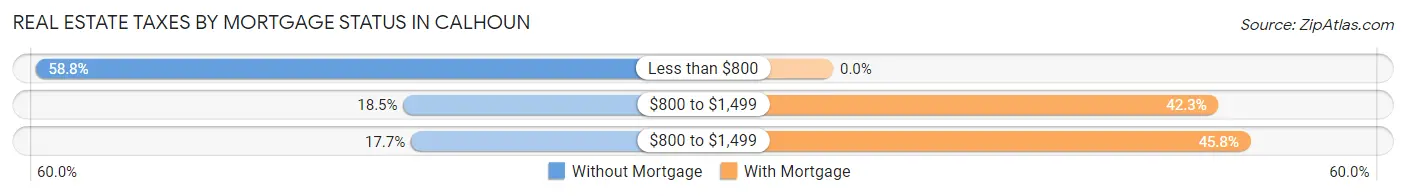
| Property Taxes | Without Mortgage | With Mortgage |
| Less than $800 | 70 (58.8%) | 0 (0.0%) |
| $800 to $1,499 | 22 (18.5%) | 60 (42.2%) |
| $800 to $1,499 | 21 (17.6%) | 65 (45.8%) |
| Total | 119 (100.0%) | 142 (100.0%) |
Health & Disability in Calhoun
Health Insurance Coverage by Age in Calhoun
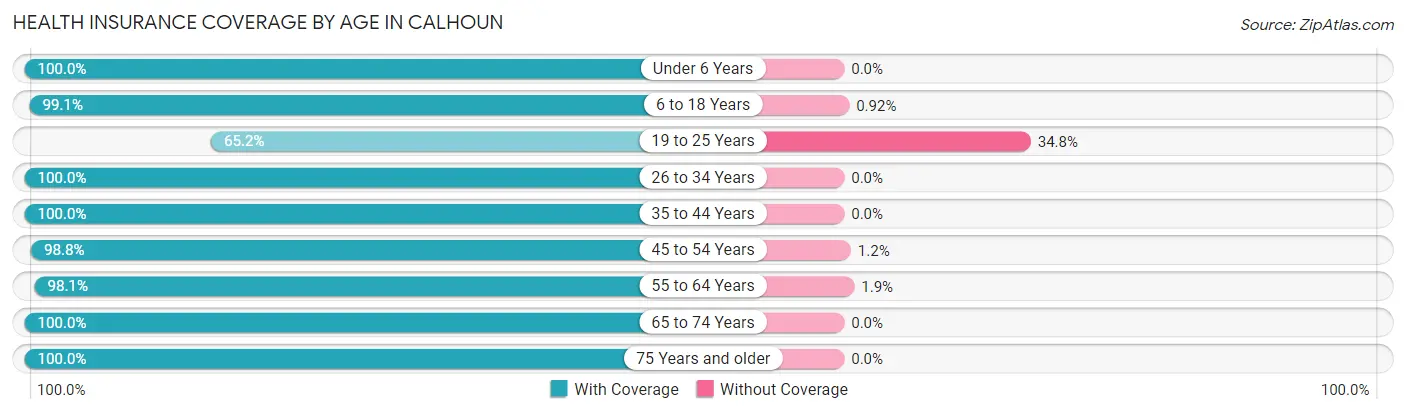
| Age Bracket | With Coverage | Without Coverage |
| Under 6 Years | 69 (100.0%) | 0 (0.0%) |
| 6 to 18 Years | 108 (99.1%) | 1 (0.9%) |
| 19 to 25 Years | 45 (65.2%) | 24 (34.8%) |
| 26 to 34 Years | 99 (100.0%) | 0 (0.0%) |
| 35 to 44 Years | 73 (100.0%) | 0 (0.0%) |
| 45 to 54 Years | 80 (98.8%) | 1 (1.2%) |
| 55 to 64 Years | 105 (98.1%) | 2 (1.9%) |
| 65 to 74 Years | 69 (100.0%) | 0 (0.0%) |
| 75 Years and older | 84 (100.0%) | 0 (0.0%) |
| Total | 732 (96.3%) | 28 (3.7%) |
Health Insurance Coverage by Citizenship Status in Calhoun
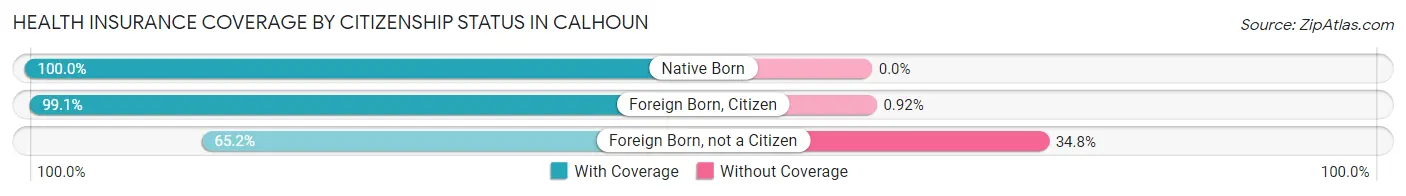
| Citizenship Status | With Coverage | Without Coverage |
| Native Born | 69 (100.0%) | 0 (0.0%) |
| Foreign Born, Citizen | 108 (99.1%) | 1 (0.9%) |
| Foreign Born, not a Citizen | 45 (65.2%) | 24 (34.8%) |
Health Insurance Coverage by Household Income in Calhoun
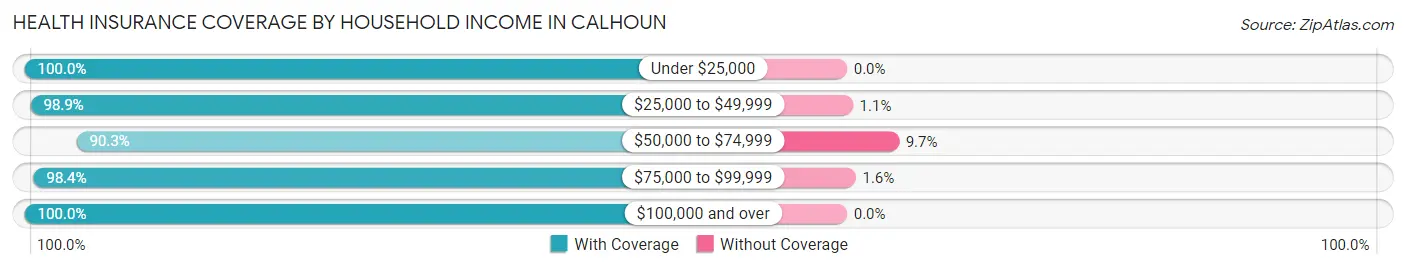
| Household Income | With Coverage | Without Coverage |
| Under $25,000 | 96 (100.0%) | 0 (0.0%) |
| $25,000 to $49,999 | 179 (98.9%) | 2 (1.1%) |
| $50,000 to $74,999 | 223 (90.3%) | 24 (9.7%) |
| $75,000 to $99,999 | 120 (98.4%) | 2 (1.6%) |
| $100,000 and over | 114 (100.0%) | 0 (0.0%) |
Public vs Private Health Insurance Coverage by Age in Calhoun
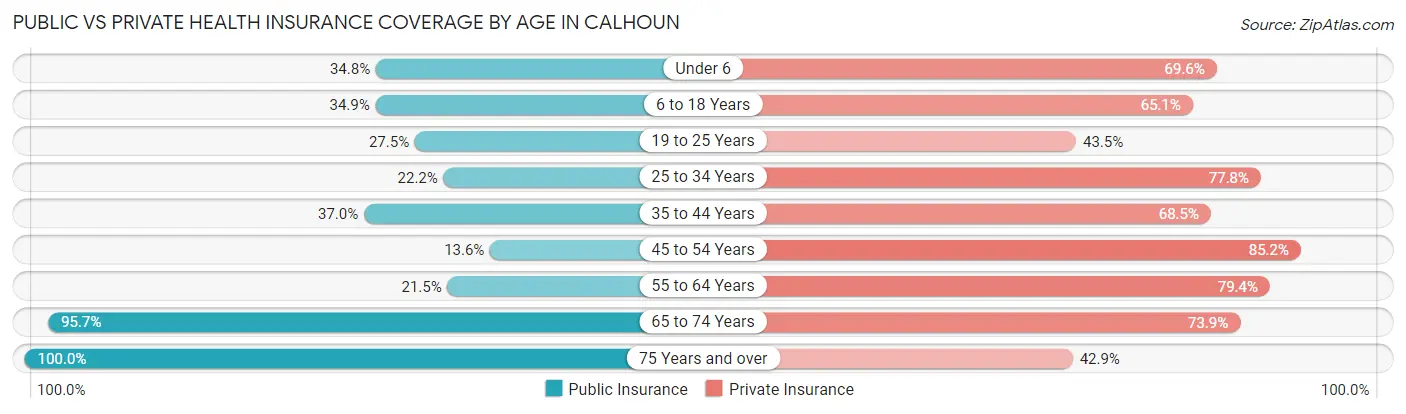
| Age Bracket | Public Insurance | Private Insurance |
| Under 6 | 24 (34.8%) | 48 (69.6%) |
| 6 to 18 Years | 38 (34.9%) | 71 (65.1%) |
| 19 to 25 Years | 19 (27.5%) | 30 (43.5%) |
| 25 to 34 Years | 22 (22.2%) | 77 (77.8%) |
| 35 to 44 Years | 27 (37.0%) | 50 (68.5%) |
| 45 to 54 Years | 11 (13.6%) | 69 (85.2%) |
| 55 to 64 Years | 23 (21.5%) | 85 (79.4%) |
| 65 to 74 Years | 66 (95.7%) | 51 (73.9%) |
| 75 Years and over | 84 (100.0%) | 36 (42.9%) |
| Total | 314 (41.3%) | 517 (68.0%) |
Disability Status by Sex by Age in Calhoun
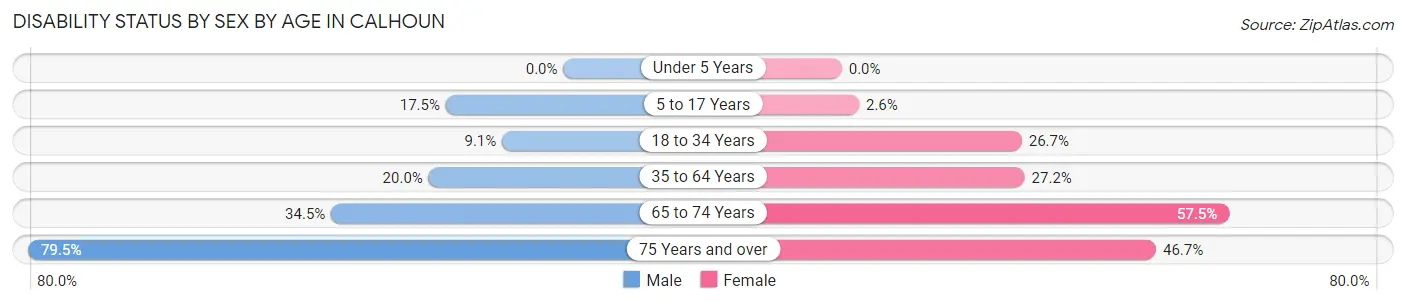
| Age Bracket | Male | Female |
| Under 5 Years | 0 (0.0%) | 0 (0.0%) |
| 5 to 17 Years | 11 (17.5%) | 1 (2.6%) |
| 18 to 34 Years | 7 (9.1%) | 27 (26.7%) |
| 35 to 64 Years | 22 (20.0%) | 41 (27.2%) |
| 65 to 74 Years | 10 (34.5%) | 23 (57.5%) |
| 75 Years and over | 31 (79.5%) | 21 (46.7%) |
Disability Class by Sex by Age in Calhoun
Disability Class: Hearing Difficulty
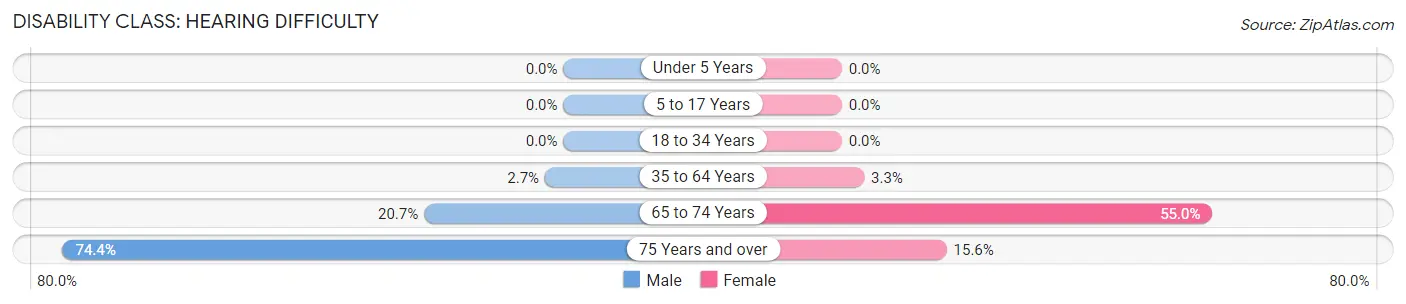
| Age Bracket | Male | Female |
| Under 5 Years | 0 (0.0%) | 0 (0.0%) |
| 5 to 17 Years | 0 (0.0%) | 0 (0.0%) |
| 18 to 34 Years | 0 (0.0%) | 0 (0.0%) |
| 35 to 64 Years | 3 (2.7%) | 5 (3.3%) |
| 65 to 74 Years | 6 (20.7%) | 22 (55.0%) |
| 75 Years and over | 29 (74.4%) | 7 (15.6%) |
Disability Class: Vision Difficulty
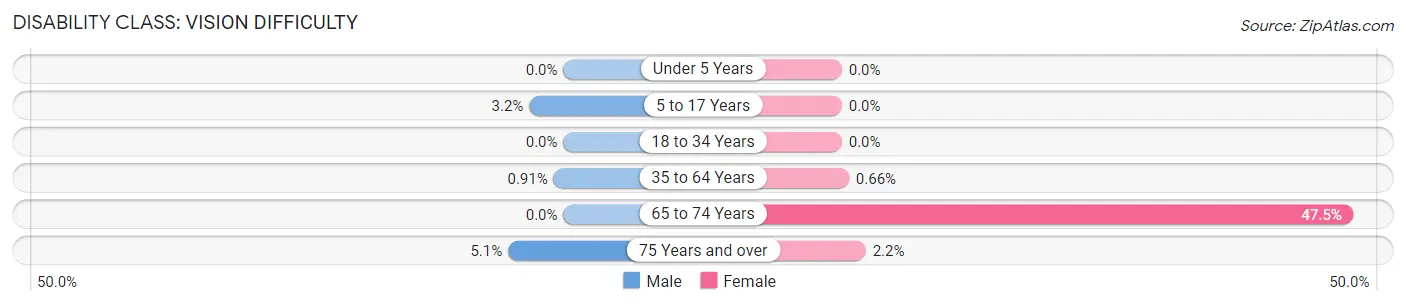
| Age Bracket | Male | Female |
| Under 5 Years | 0 (0.0%) | 0 (0.0%) |
| 5 to 17 Years | 2 (3.2%) | 0 (0.0%) |
| 18 to 34 Years | 0 (0.0%) | 0 (0.0%) |
| 35 to 64 Years | 1 (0.9%) | 1 (0.7%) |
| 65 to 74 Years | 0 (0.0%) | 19 (47.5%) |
| 75 Years and over | 2 (5.1%) | 1 (2.2%) |
Disability Class: Cognitive Difficulty
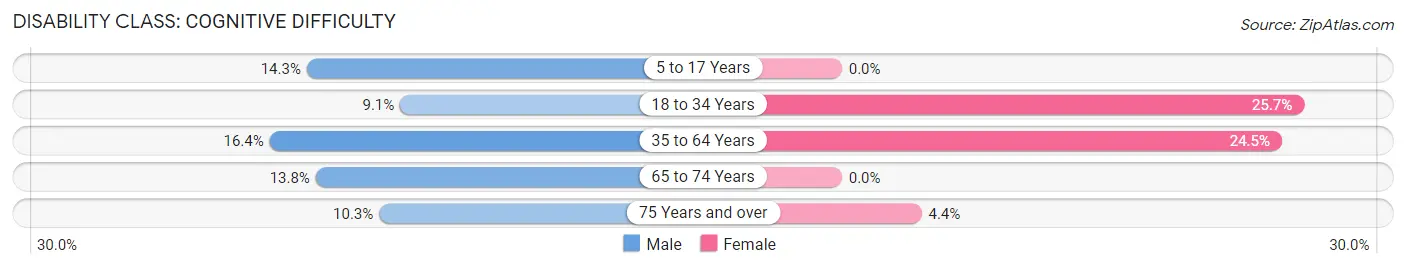
| Age Bracket | Male | Female |
| 5 to 17 Years | 9 (14.3%) | 0 (0.0%) |
| 18 to 34 Years | 7 (9.1%) | 26 (25.7%) |
| 35 to 64 Years | 18 (16.4%) | 37 (24.5%) |
| 65 to 74 Years | 4 (13.8%) | 0 (0.0%) |
| 75 Years and over | 4 (10.3%) | 2 (4.4%) |
Disability Class: Ambulatory Difficulty
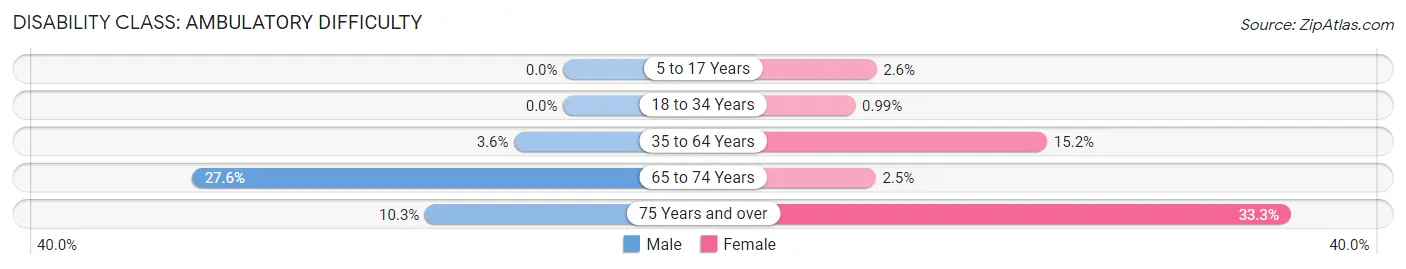
| Age Bracket | Male | Female |
| 5 to 17 Years | 0 (0.0%) | 1 (2.6%) |
| 18 to 34 Years | 0 (0.0%) | 1 (1.0%) |
| 35 to 64 Years | 4 (3.6%) | 23 (15.2%) |
| 65 to 74 Years | 8 (27.6%) | 1 (2.5%) |
| 75 Years and over | 4 (10.3%) | 15 (33.3%) |
Disability Class: Self-Care Difficulty
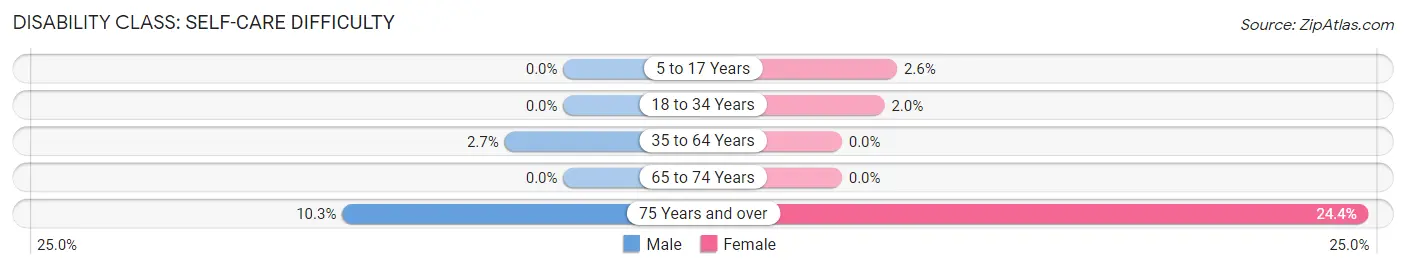
| Age Bracket | Male | Female |
| 5 to 17 Years | 0 (0.0%) | 1 (2.6%) |
| 18 to 34 Years | 0 (0.0%) | 2 (2.0%) |
| 35 to 64 Years | 3 (2.7%) | 0 (0.0%) |
| 65 to 74 Years | 0 (0.0%) | 0 (0.0%) |
| 75 Years and over | 4 (10.3%) | 11 (24.4%) |
Technology Access in Calhoun
Computing Device Access in Calhoun
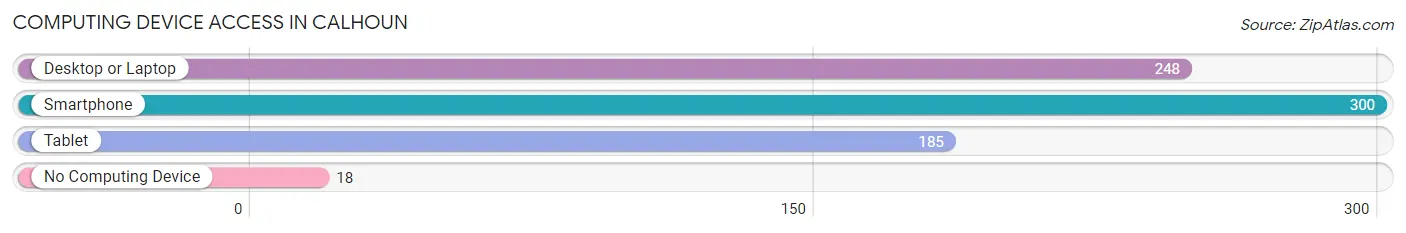
| Device Type | # Households | % Households |
| Desktop or Laptop | 248 | 72.7% |
| Smartphone | 300 | 88.0% |
| Tablet | 185 | 54.2% |
| No Computing Device | 18 | 5.3% |
| Total | 341 | 100.0% |
Internet Access in Calhoun
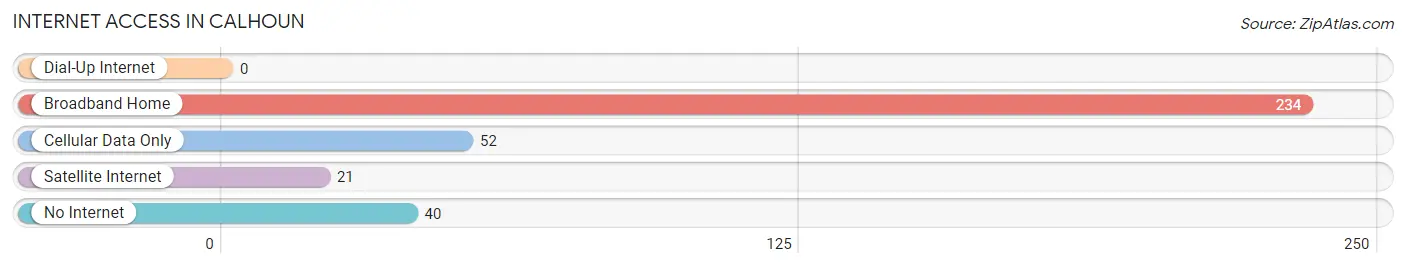
| Internet Type | # Households | % Households |
| Dial-Up Internet | 0 | 0.0% |
| Broadband Home | 234 | 68.6% |
| Cellular Data Only | 52 | 15.2% |
| Satellite Internet | 21 | 6.2% |
| No Internet | 40 | 11.7% |
| Total | 341 | 100.0% |
Calhoun Summary
Calhoun, Kentucky is a small town located in McLean County, Kentucky. It is situated on the banks of the Green River and is part of the Owensboro metropolitan area. The town has a population of approximately 1,000 people and is known for its rural charm and friendly atmosphere.
History
Calhoun was founded in 1820 by William Calhoun, a Revolutionary War veteran. The town was originally known as Calhoun’s Landing, and was a popular stop for steamboats traveling up and down the Green River. In 1845, the town was officially incorporated and renamed Calhoun.
During the Civil War, Calhoun was a major supply depot for the Confederate Army. The town was also the site of a major battle in 1862, when Union forces attempted to capture the town. The Union forces were ultimately unsuccessful, and the town remained in Confederate hands until the end of the war.
In the late 19th century, Calhoun experienced a period of growth and prosperity. The town was home to several businesses, including a sawmill, a gristmill, and a general store. The town also had a post office, a bank, and a hotel.
Geography
Calhoun is located in McLean County, Kentucky, on the banks of the Green River. The town is situated in a rural area, surrounded by rolling hills and farmland. The town is located approximately 30 miles from Owensboro, the county seat.
The climate in Calhoun is humid subtropical, with hot summers and mild winters. The average annual temperature is around 60 degrees Fahrenheit, and the average annual precipitation is around 45 inches.
Economy
Calhoun’s economy is largely based on agriculture. The town is home to several farms, which produce a variety of crops, including corn, soybeans, and wheat. The town also has a few small businesses, including a gas station, a grocery store, and a hardware store.
Demographics
As of the 2010 census, Calhoun had a population of 1,000 people. The racial makeup of the town was 97.2% White, 0.7% African American, 0.3% Native American, 0.2% Asian, and 1.6% from other races. The median household income was $35,000, and the median home value was $90,000.
Calhoun is a small, rural town with a friendly atmosphere and a strong sense of community. The town is home to a variety of businesses and attractions, and is a popular destination for tourists and outdoor enthusiasts.
Common Questions
What is Per Capita Income in Calhoun?
Per Capita income in Calhoun is $23,977.
What is the Median Family Income in Calhoun?
Median Family Income in Calhoun is $63,068.
What is the Median Household income in Calhoun?
Median Household Income in Calhoun is $51,705.
What is Income or Wage Gap in Calhoun?
Income or Wage Gap in Calhoun is 50.5%.
Women in Calhoun earn 49.5 cents for every dollar earned by a man.
What is Inequality or Gini Index in Calhoun?
Inequality or Gini Index in Calhoun is 0.36.
What is the Total Population of Calhoun?
Total Population of Calhoun is 833.
What is the Total Male Population of Calhoun?
Total Male Population of Calhoun is 369.
What is the Total Female Population of Calhoun?
Total Female Population of Calhoun is 464.
What is the Ratio of Males per 100 Females in Calhoun?
There are 79.53 Males per 100 Females in Calhoun.
What is the Ratio of Females per 100 Males in Calhoun?
There are 125.75 Females per 100 Males in Calhoun.
What is the Median Population Age in Calhoun?
Median Population Age in Calhoun is 42.6 Years.
What is the Average Family Size in Calhoun
Average Family Size in Calhoun is 2.9 People.
What is the Average Household Size in Calhoun
Average Household Size in Calhoun is 2.2 People.
How Large is the Labor Force in Calhoun?
There are 334 People in the Labor Forcein in Calhoun.
What is the Percentage of People in the Labor Force in Calhoun?
49.3% of People are in the Labor Force in Calhoun.
What is the Unemployment Rate in Calhoun?
Unemployment Rate in Calhoun is 11.4%.