Sadieville, KY Map & Demographics
Sadieville Map
Sadieville Overview
$30,867
PER CAPITA INCOME
$76,250
AVG FAMILY INCOME
$61,000
AVG HOUSEHOLD INCOME
28.4%
WAGE / INCOME GAP [ % ]
71.6¢/ $1
WAGE / INCOME GAP [ $ ]
0.44
INEQUALITY / GINI INDEX
325
TOTAL POPULATION
173
MALE POPULATION
152
FEMALE POPULATION
113.82
MALES / 100 FEMALES
87.86
FEMALES / 100 MALES
30.5
MEDIAN AGE
3.4
AVG FAMILY SIZE
2.7
AVG HOUSEHOLD SIZE
179
LABOR FORCE [ PEOPLE ]
75.2%
PERCENT IN LABOR FORCE
Sadieville Zip Codes
Sadieville Area Codes
Income in Sadieville
Income Overview in Sadieville
Per Capita Income in Sadieville is $30,867, while median incomes of families and households are $76,250 and $61,000 respectively.
| Characteristic | Number | Measure |
| Per Capita Income | 325 | $30,867 |
| Median Family Income | 82 | $76,250 |
| Mean Family Income | 82 | $92,895 |
| Median Household Income | 120 | $61,000 |
| Mean Household Income | 120 | $76,415 |
| Income Deficit | 82 | $0 |
| Wage / Income Gap (%) | 325 | 28.39% |
| Wage / Income Gap ($) | 325 | 71.61¢ per $1 |
| Gini / Inequality Index | 325 | 0.44 |
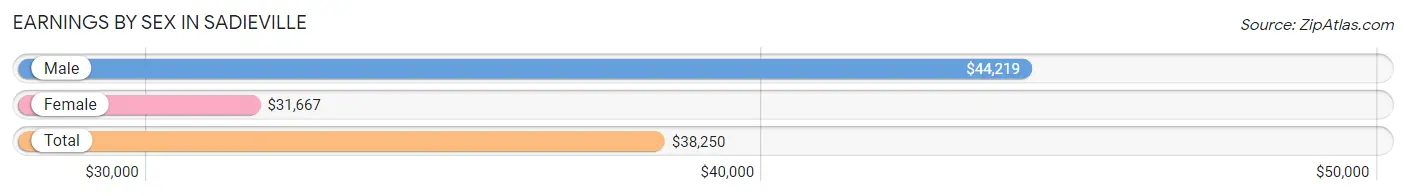
Earnings by Sex in Sadieville
Average Earnings in Sadieville are $38,250, $44,219 for men and $31,667 for women, a difference of 28.4%.
| Sex | Number | Average Earnings |
| Male | 101 (55.8%) | $44,219 |
| Female | 80 (44.2%) | $31,667 |
| Total | 181 (100.0%) | $38,250 |
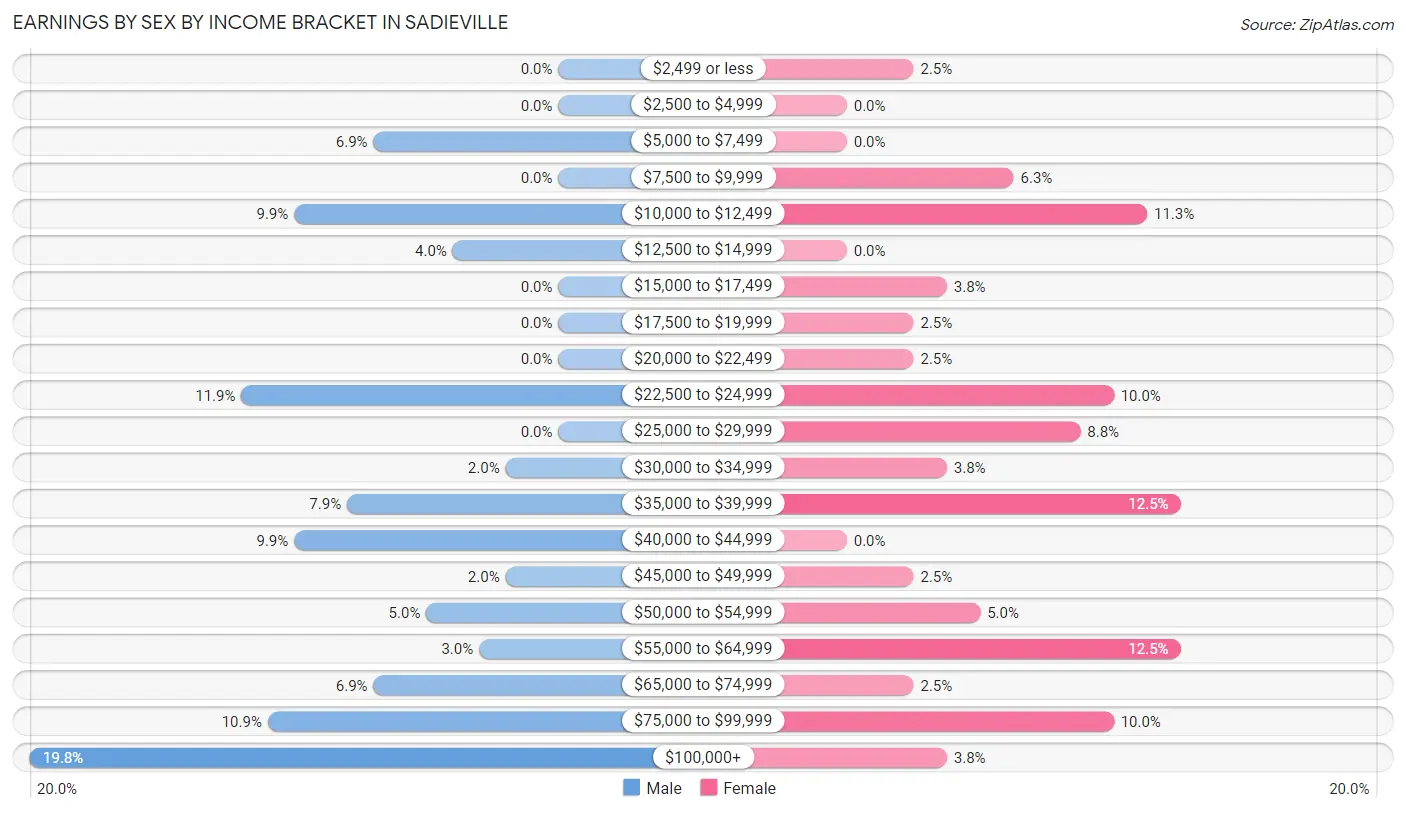
Earnings by Sex by Income Bracket in Sadieville
The most common earnings brackets in Sadieville are $100,000+ for men (20 | 19.8%) and $35,000 to $39,999 for women (10 | 12.5%).
| Income | Male | Female |
| $2,499 or less | 0 (0.0%) | 2 (2.5%) |
| $2,500 to $4,999 | 0 (0.0%) | 0 (0.0%) |
| $5,000 to $7,499 | 7 (6.9%) | 0 (0.0%) |
| $7,500 to $9,999 | 0 (0.0%) | 5 (6.2%) |
| $10,000 to $12,499 | 10 (9.9%) | 9 (11.3%) |
| $12,500 to $14,999 | 4 (4.0%) | 0 (0.0%) |
| $15,000 to $17,499 | 0 (0.0%) | 3 (3.7%) |
| $17,500 to $19,999 | 0 (0.0%) | 2 (2.5%) |
| $20,000 to $22,499 | 0 (0.0%) | 2 (2.5%) |
| $22,500 to $24,999 | 12 (11.9%) | 8 (10.0%) |
| $25,000 to $29,999 | 0 (0.0%) | 7 (8.7%) |
| $30,000 to $34,999 | 2 (2.0%) | 3 (3.7%) |
| $35,000 to $39,999 | 8 (7.9%) | 10 (12.5%) |
| $40,000 to $44,999 | 10 (9.9%) | 0 (0.0%) |
| $45,000 to $49,999 | 2 (2.0%) | 2 (2.5%) |
| $50,000 to $54,999 | 5 (5.0%) | 4 (5.0%) |
| $55,000 to $64,999 | 3 (3.0%) | 10 (12.5%) |
| $65,000 to $74,999 | 7 (6.9%) | 2 (2.5%) |
| $75,000 to $99,999 | 11 (10.9%) | 8 (10.0%) |
| $100,000+ | 20 (19.8%) | 3 (3.7%) |
| Total | 101 (100.0%) | 80 (100.0%) |
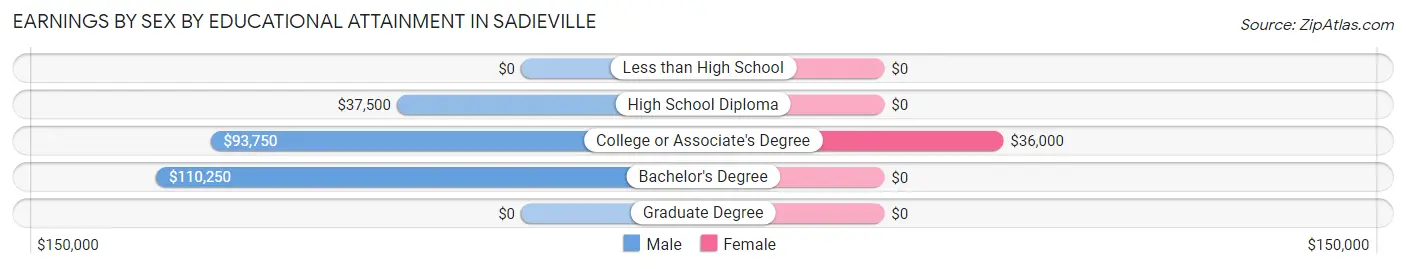
Earnings by Sex by Educational Attainment in Sadieville
| Educational Attainment | Male Income | Female Income |
| Less than High School | - | - |
| High School Diploma | $37,500 | $0 |
| College or Associate's Degree | $93,750 | $36,000 |
| Bachelor's Degree | $110,250 | $0 |
| Graduate Degree | - | - |
| Total | - | - |
Family Income in Sadieville
Family Income Brackets in Sadieville
According to the Sadieville family income data, there are 19 families falling into the $50,000 to $74,999 income range, which is the most common income bracket and makes up 23.2% of all families.
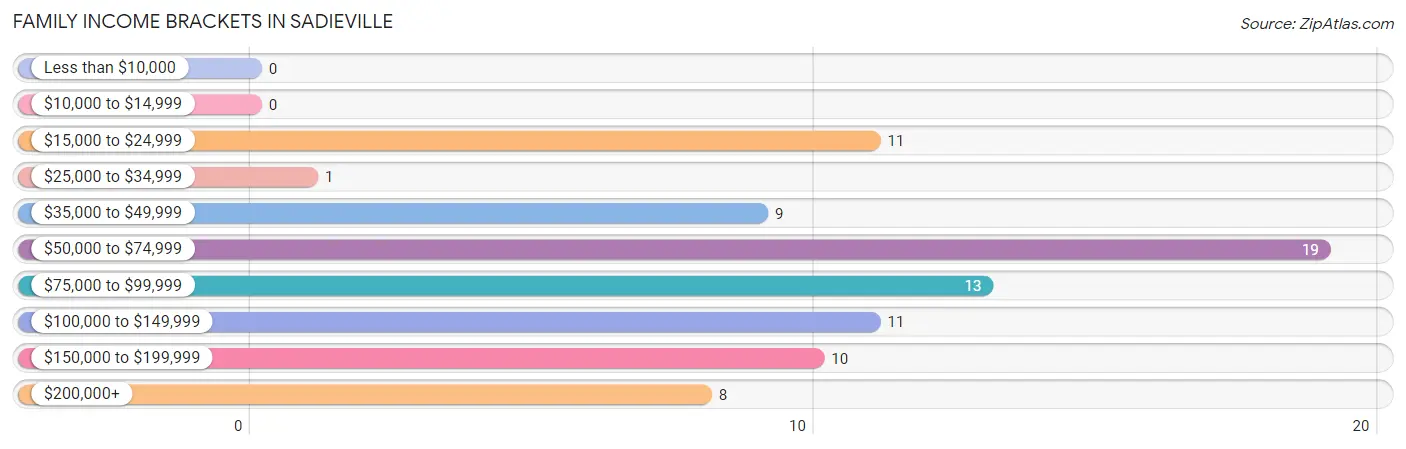
| Income Bracket | # Families | % Families |
| Less than $10,000 | 0 | 0.0% |
| $10,000 to $14,999 | 0 | 0.0% |
| $15,000 to $24,999 | 11 | 13.4% |
| $25,000 to $34,999 | 1 | 1.2% |
| $35,000 to $49,999 | 9 | 11.0% |
| $50,000 to $74,999 | 19 | 23.2% |
| $75,000 to $99,999 | 13 | 15.9% |
| $100,000 to $149,999 | 11 | 13.4% |
| $150,000 to $199,999 | 10 | 12.2% |
| $200,000+ | 8 | 9.8% |
Family Income by Famaliy Size in Sadieville
2-person families (41 | 50.0%) account for the highest median family income in Sadieville with $64,688 per family, while 2-person families (41 | 50.0%) have the highest median income of $32,344 per family member.
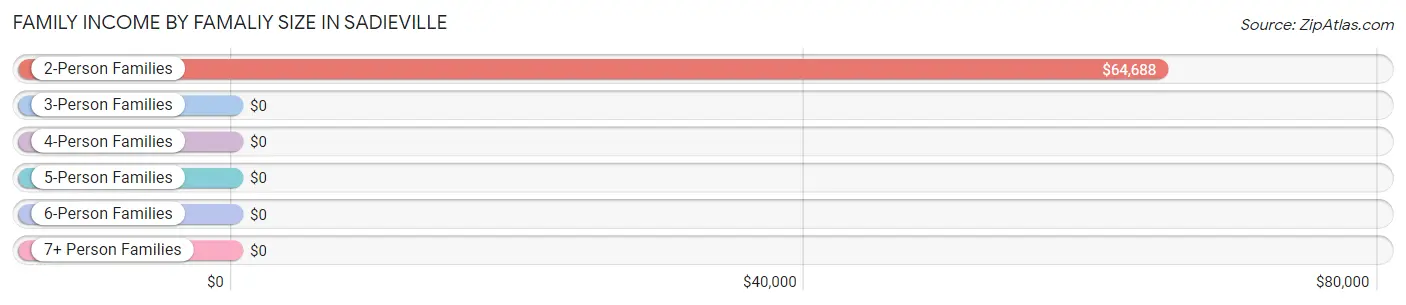
| Income Bracket | # Families | Median Income |
| 2-Person Families | 41 (50.0%) | $64,688 |
| 3-Person Families | 13 (15.9%) | $0 |
| 4-Person Families | 16 (19.5%) | $0 |
| 5-Person Families | 6 (7.3%) | $0 |
| 6-Person Families | 3 (3.7%) | $0 |
| 7+ Person Families | 3 (3.7%) | $0 |
| Total | 82 (100.0%) | $76,250 |
Family Income by Number of Earners in Sadieville
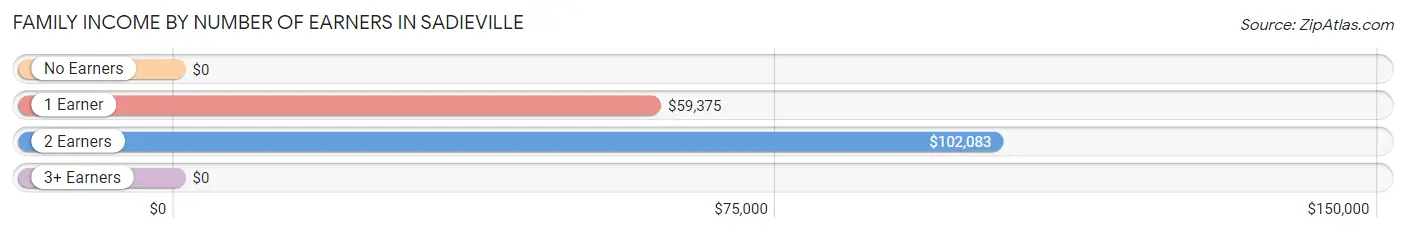
| Number of Earners | # Families | Median Income |
| No Earners | 1 (1.2%) | $0 |
| 1 Earner | 29 (35.4%) | $59,375 |
| 2 Earners | 43 (52.4%) | $102,083 |
| 3+ Earners | 9 (11.0%) | $0 |
| Total | 82 (100.0%) | $76,250 |
Household Income in Sadieville
Household Income Brackets in Sadieville
With 24 households falling in the category, the $50,000 to $74,999 income range is the most frequent in Sadieville, accounting for 20.0% of all households. In contrast, only 1 households (0.8%) fall into the $25,000 to $34,999 income bracket, making it the least populous group.
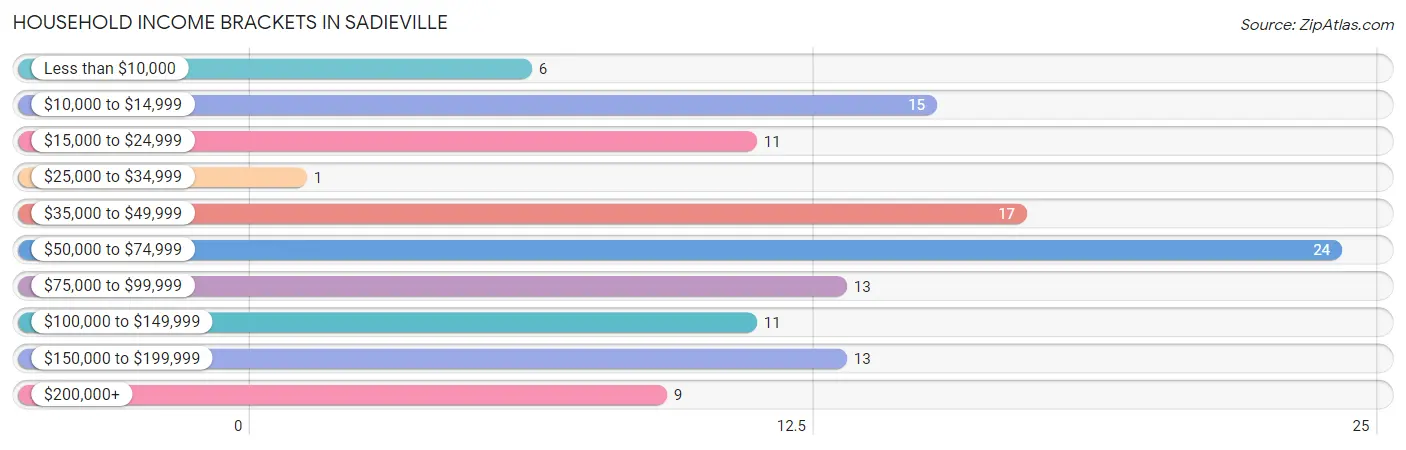
| Income Bracket | # Households | % Households |
| Less than $10,000 | 6 | 5.0% |
| $10,000 to $14,999 | 15 | 12.5% |
| $15,000 to $24,999 | 11 | 9.2% |
| $25,000 to $34,999 | 1 | 0.8% |
| $35,000 to $49,999 | 17 | 14.2% |
| $50,000 to $74,999 | 24 | 20.0% |
| $75,000 to $99,999 | 13 | 10.8% |
| $100,000 to $149,999 | 11 | 9.2% |
| $150,000 to $199,999 | 13 | 10.8% |
| $200,000+ | 9 | 7.5% |
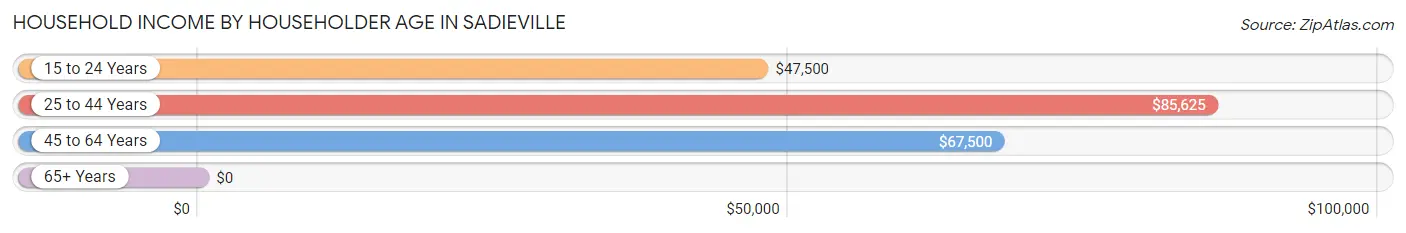
Household Income by Householder Age in Sadieville
The median household income in Sadieville is $61,000, with the highest median household income of $85,625 found in the 25 to 44 years age bracket for the primary householder. A total of 49 households (40.8%) fall into this category. Meanwhile, the 65+ years age bracket for the primary householder has the lowest median household income of $0, with 15 households (12.5%) in this group.
| Income Bracket | # Households | Median Income |
| 15 to 24 Years | 16 (13.3%) | $47,500 |
| 25 to 44 Years | 49 (40.8%) | $85,625 |
| 45 to 64 Years | 40 (33.3%) | $67,500 |
| 65+ Years | 15 (12.5%) | $0 |
| Total | 120 (100.0%) | $61,000 |
Poverty in Sadieville
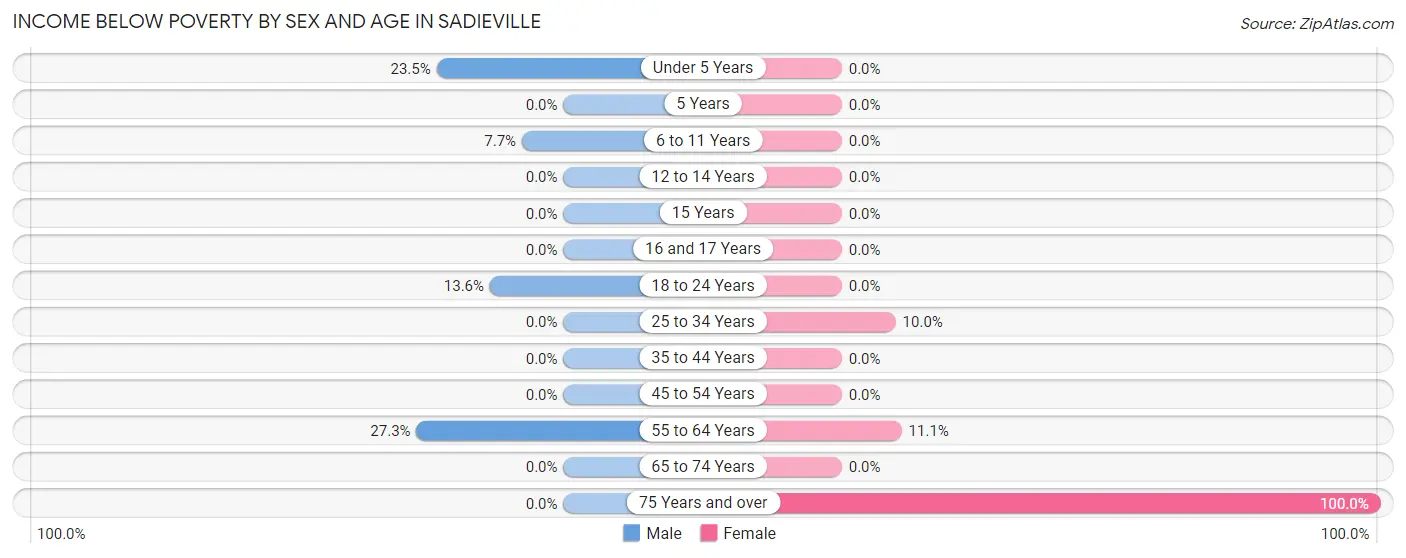
Income Below Poverty by Sex and Age in Sadieville
With 8.7% poverty level for males and 9.9% for females among the residents of Sadieville, 55 to 64 year old males and 75 year old and over females are the most vulnerable to poverty, with 6 males (27.3%) and 10 females (100.0%) in their respective age groups living below the poverty level.
| Age Bracket | Male | Female |
| Under 5 Years | 4 (23.5%) | 0 (0.0%) |
| 5 Years | 0 (0.0%) | 0 (0.0%) |
| 6 to 11 Years | 2 (7.7%) | 0 (0.0%) |
| 12 to 14 Years | 0 (0.0%) | 0 (0.0%) |
| 15 Years | 0 (0.0%) | 0 (0.0%) |
| 16 and 17 Years | 0 (0.0%) | 0 (0.0%) |
| 18 to 24 Years | 3 (13.6%) | 0 (0.0%) |
| 25 to 34 Years | 0 (0.0%) | 3 (10.0%) |
| 35 to 44 Years | 0 (0.0%) | 0 (0.0%) |
| 45 to 54 Years | 0 (0.0%) | 0 (0.0%) |
| 55 to 64 Years | 6 (27.3%) | 2 (11.1%) |
| 65 to 74 Years | 0 (0.0%) | 0 (0.0%) |
| 75 Years and over | 0 (0.0%) | 10 (100.0%) |
| Total | 15 (8.7%) | 15 (9.9%) |
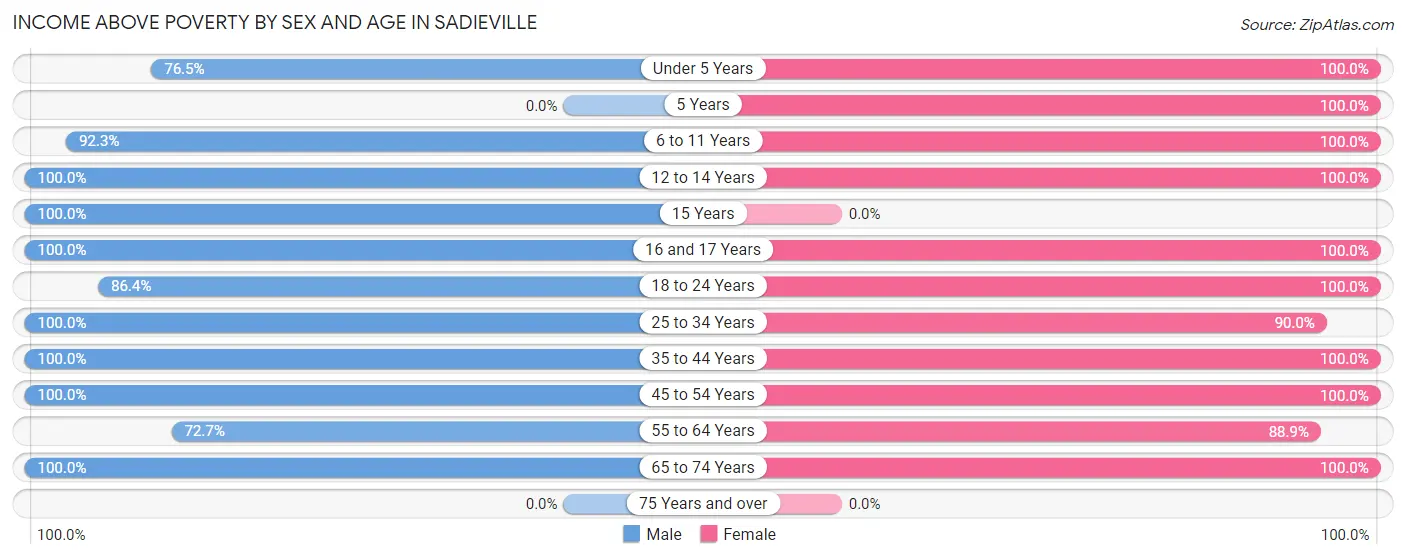
Income Above Poverty by Sex and Age in Sadieville
According to the poverty statistics in Sadieville, males aged 12 to 14 years and females aged under 5 years are the age groups that are most secure financially, with 100.0% of males and 100.0% of females in these age groups living above the poverty line.
| Age Bracket | Male | Female |
| Under 5 Years | 13 (76.5%) | 11 (100.0%) |
| 5 Years | 0 (0.0%) | 2 (100.0%) |
| 6 to 11 Years | 24 (92.3%) | 12 (100.0%) |
| 12 to 14 Years | 10 (100.0%) | 7 (100.0%) |
| 15 Years | 2 (100.0%) | 0 (0.0%) |
| 16 and 17 Years | 3 (100.0%) | 3 (100.0%) |
| 18 to 24 Years | 19 (86.4%) | 16 (100.0%) |
| 25 to 34 Years | 25 (100.0%) | 27 (90.0%) |
| 35 to 44 Years | 17 (100.0%) | 27 (100.0%) |
| 45 to 54 Years | 22 (100.0%) | 13 (100.0%) |
| 55 to 64 Years | 16 (72.7%) | 16 (88.9%) |
| 65 to 74 Years | 7 (100.0%) | 3 (100.0%) |
| 75 Years and over | 0 (0.0%) | 0 (0.0%) |
| Total | 158 (91.3%) | 137 (90.1%) |
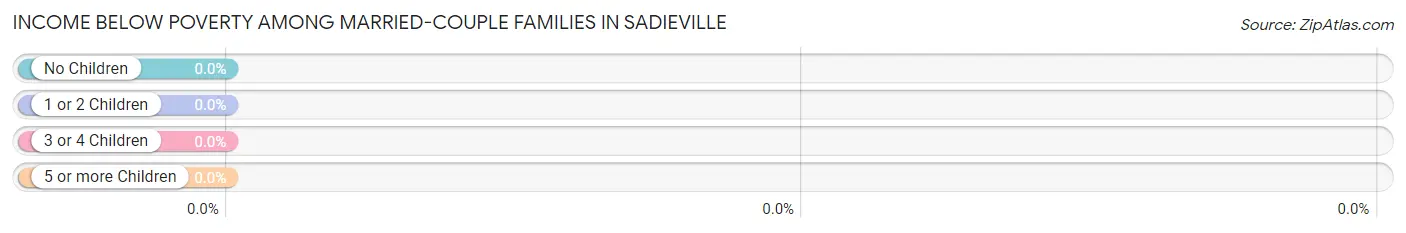
Income Below Poverty Among Married-Couple Families in Sadieville
| Children | Above Poverty | Below Poverty |
| No Children | 31 (100.0%) | 0 (0.0%) |
| 1 or 2 Children | 24 (100.0%) | 0 (0.0%) |
| 3 or 4 Children | 5 (100.0%) | 0 (0.0%) |
| 5 or more Children | 2 (100.0%) | 0 (0.0%) |
| Total | 62 (100.0%) | 0 (0.0%) |
Income Below Poverty Among Single-Parent Households in Sadieville
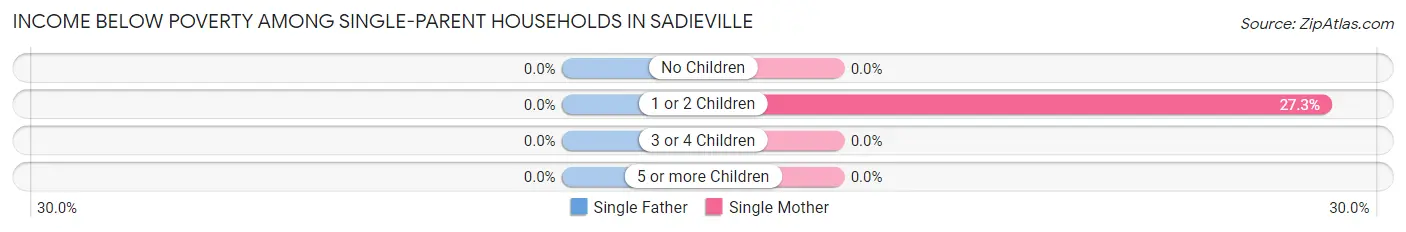
| Children | Single Father | Single Mother |
| No Children | 0 (0.0%) | 0 (0.0%) |
| 1 or 2 Children | 0 (0.0%) | 3 (27.3%) |
| 3 or 4 Children | 0 (0.0%) | 0 (0.0%) |
| 5 or more Children | 0 (0.0%) | 0 (0.0%) |
| Total | 0 (0.0%) | 3 (16.7%) |
Income Below Poverty Among Married-Couple vs Single-Parent Households in Sadieville
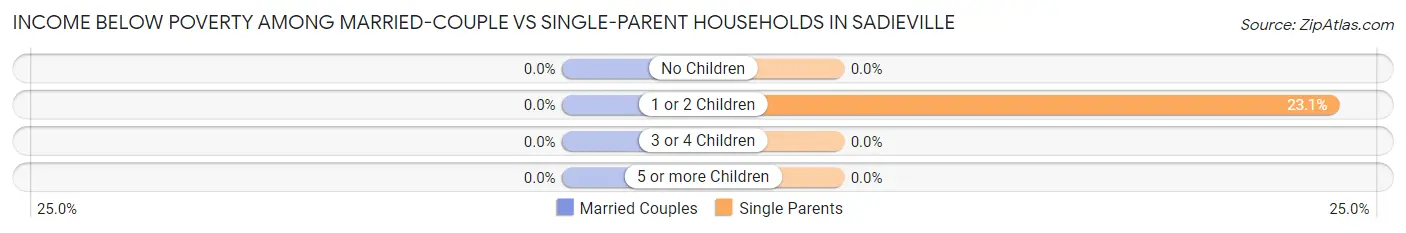
| Children | Married-Couple Families | Single-Parent Households |
| No Children | 0 (0.0%) | 0 (0.0%) |
| 1 or 2 Children | 0 (0.0%) | 3 (23.1%) |
| 3 or 4 Children | 0 (0.0%) | 0 (0.0%) |
| 5 or more Children | 0 (0.0%) | 0 (0.0%) |
| Total | 0 (0.0%) | 3 (15.0%) |
Race in Sadieville
The most populous races in Sadieville are White / Caucasian (323 | 99.4%), and Two or more Races (2 | 0.6%).
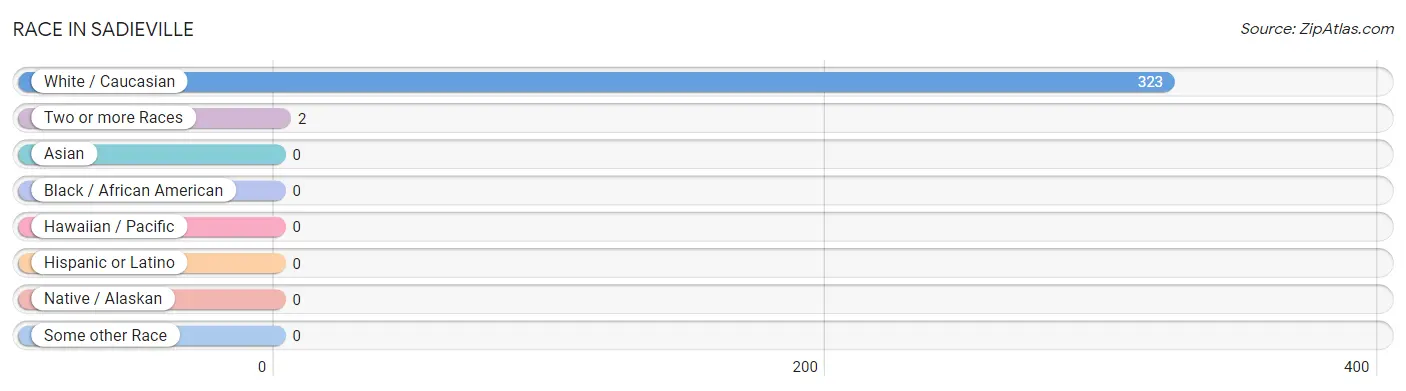
| Race | # Population | % Population |
| Asian | 0 | 0.0% |
| Black / African American | 0 | 0.0% |
| Hawaiian / Pacific | 0 | 0.0% |
| Hispanic or Latino | 0 | 0.0% |
| Native / Alaskan | 0 | 0.0% |
| White / Caucasian | 323 | 99.4% |
| Two or more Races | 2 | 0.6% |
| Some other Race | 0 | 0.0% |
| Total | 325 | 100.0% |
Ancestry in Sadieville
The most populous ancestries reported in Sadieville are English (61 | 18.8%), Irish (58 | 17.8%), American (44 | 13.5%), German (44 | 13.5%), and Welsh (13 | 4.0%), together accounting for 67.7% of all Sadieville residents.
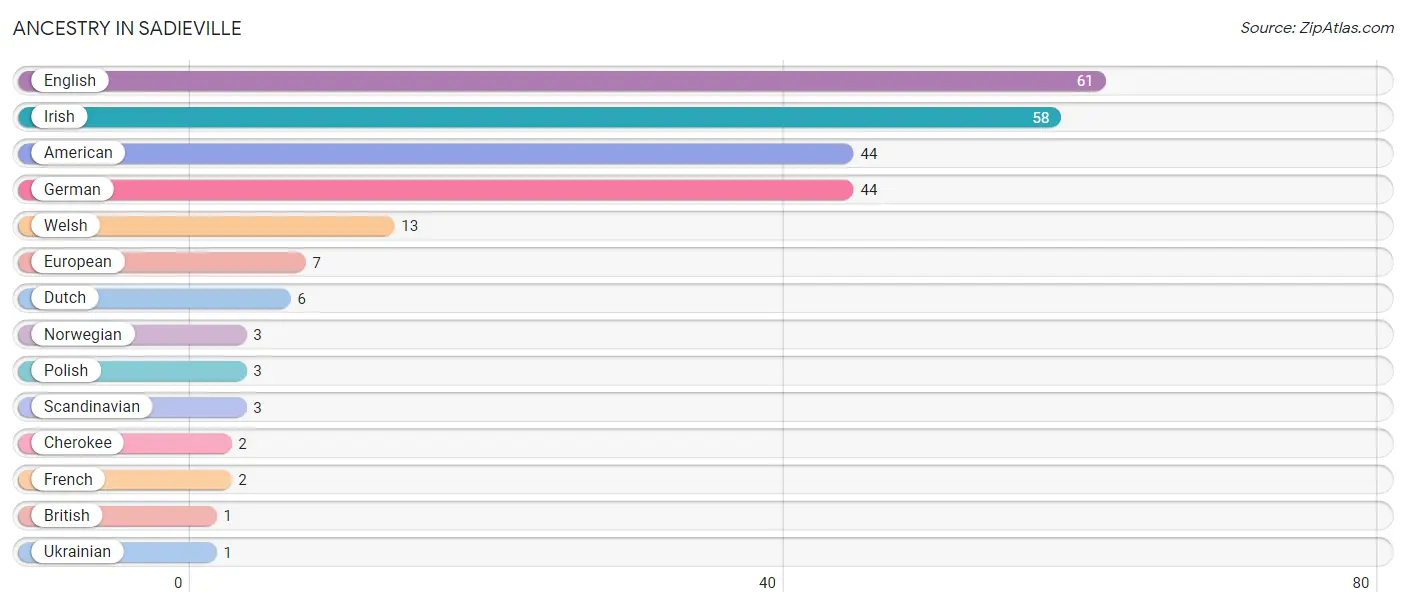
| Ancestry | # Population | % Population |
| American | 44 | 13.5% |
| British | 1 | 0.3% |
| Cherokee | 2 | 0.6% |
| Dutch | 6 | 1.8% |
| English | 61 | 18.8% |
| European | 7 | 2.1% |
| French | 2 | 0.6% |
| German | 44 | 13.5% |
| Irish | 58 | 17.8% |
| Norwegian | 3 | 0.9% |
| Polish | 3 | 0.9% |
| Scandinavian | 3 | 0.9% |
| Ukrainian | 1 | 0.3% |
| Welsh | 13 | 4.0% | View All 14 Rows |
Immigrants in Sadieville
The most numerous immigrant groups reported in Sadieville came from Europe (4 | 1.2%), England (3 | 0.9%), Northern Europe (3 | 0.9%), Eastern Europe (1 | 0.3%), and Ukraine (1 | 0.3%), together accounting for 3.7% of all Sadieville residents.
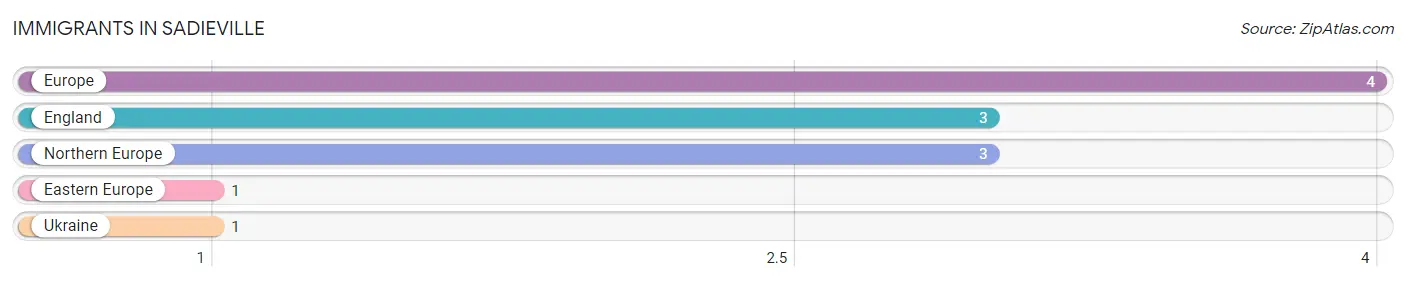
| Immigration Origin | # Population | % Population |
| Eastern Europe | 1 | 0.3% |
| England | 3 | 0.9% |
| Europe | 4 | 1.2% |
| Northern Europe | 3 | 0.9% |
| Ukraine | 1 | 0.3% | View All 5 Rows |
Sex and Age in Sadieville
Sex and Age in Sadieville
The most populous age groups in Sadieville are 45 to 49 Years (20 | 11.6%) for men and 25 to 29 Years (20 | 13.2%) for women.
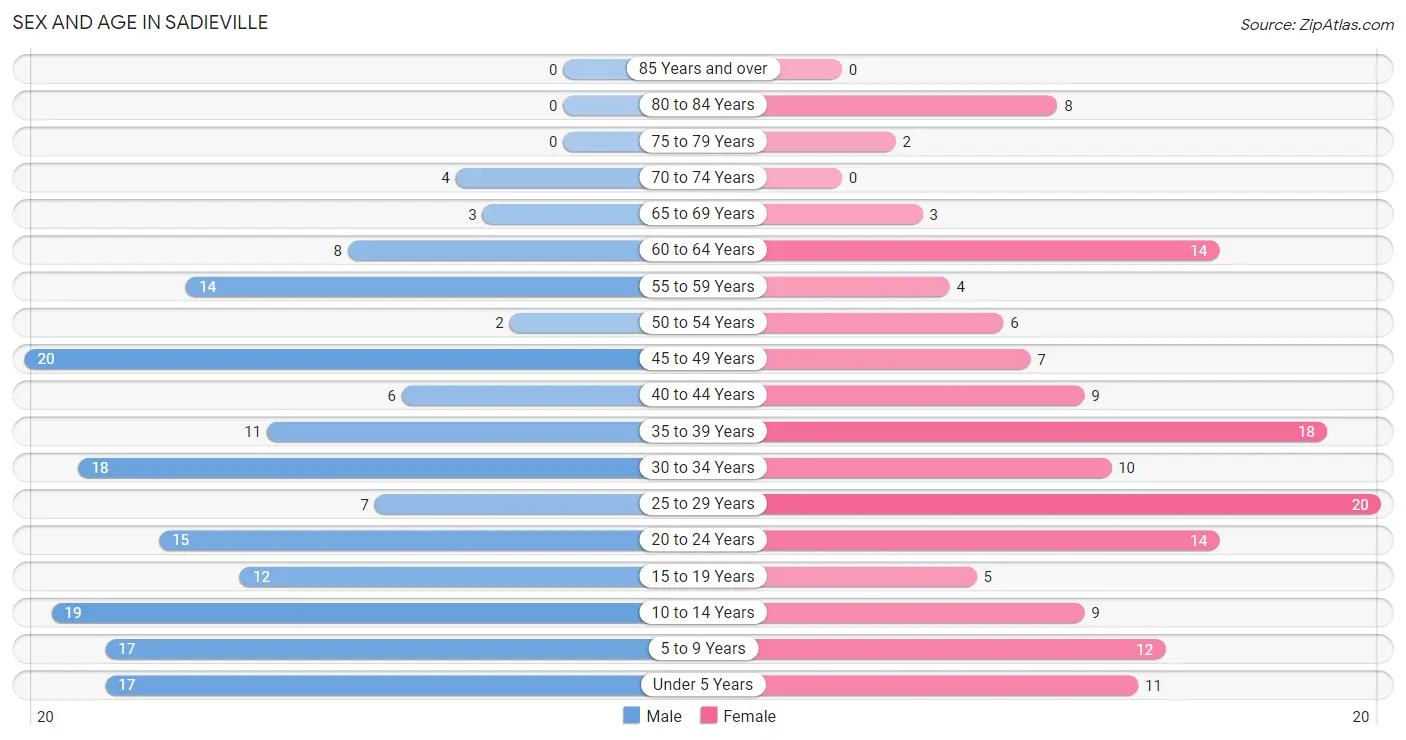
| Age Bracket | Male | Female |
| Under 5 Years | 17 (9.8%) | 11 (7.2%) |
| 5 to 9 Years | 17 (9.8%) | 12 (7.9%) |
| 10 to 14 Years | 19 (11.0%) | 9 (5.9%) |
| 15 to 19 Years | 12 (6.9%) | 5 (3.3%) |
| 20 to 24 Years | 15 (8.7%) | 14 (9.2%) |
| 25 to 29 Years | 7 (4.1%) | 20 (13.2%) |
| 30 to 34 Years | 18 (10.4%) | 10 (6.6%) |
| 35 to 39 Years | 11 (6.4%) | 18 (11.8%) |
| 40 to 44 Years | 6 (3.5%) | 9 (5.9%) |
| 45 to 49 Years | 20 (11.6%) | 7 (4.6%) |
| 50 to 54 Years | 2 (1.2%) | 6 (4.0%) |
| 55 to 59 Years | 14 (8.1%) | 4 (2.6%) |
| 60 to 64 Years | 8 (4.6%) | 14 (9.2%) |
| 65 to 69 Years | 3 (1.7%) | 3 (2.0%) |
| 70 to 74 Years | 4 (2.3%) | 0 (0.0%) |
| 75 to 79 Years | 0 (0.0%) | 2 (1.3%) |
| 80 to 84 Years | 0 (0.0%) | 8 (5.3%) |
| 85 Years and over | 0 (0.0%) | 0 (0.0%) |
| Total | 173 (100.0%) | 152 (100.0%) |
Families and Households in Sadieville
Median Family Size in Sadieville
The median family size in Sadieville is 3.41 persons per family, with married-couple families (62 | 75.6%) accounting for the largest median family size of 3.68 persons per family. On the other hand, single male/father families (2 | 2.4%) represent the smallest median family size with 2.00 persons per family.
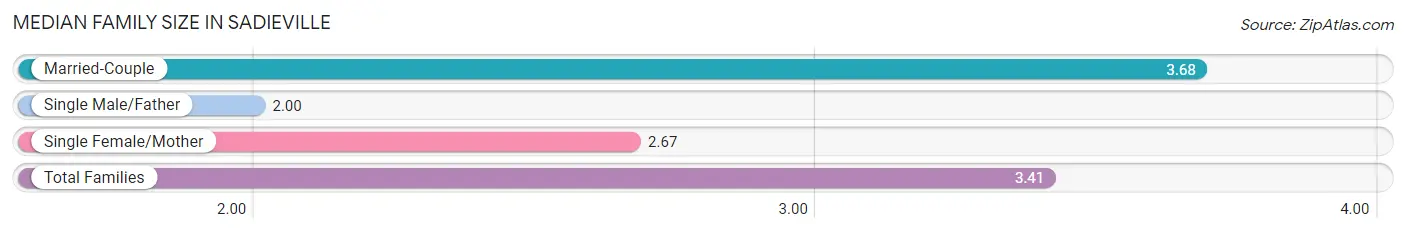
| Family Type | # Families | Family Size |
| Married-Couple | 62 (75.6%) | 3.68 |
| Single Male/Father | 2 (2.4%) | 2.00 |
| Single Female/Mother | 18 (22.0%) | 2.67 |
| Total Families | 82 (100.0%) | 3.41 |
Median Household Size in Sadieville
The median household size in Sadieville is 2.71 persons per household, with married-couple households (62 | 51.7%) accounting for the largest median household size of 3.68 persons per household. non-family households (38 | 31.7%) represent the smallest median household size with 1.05 persons per household.
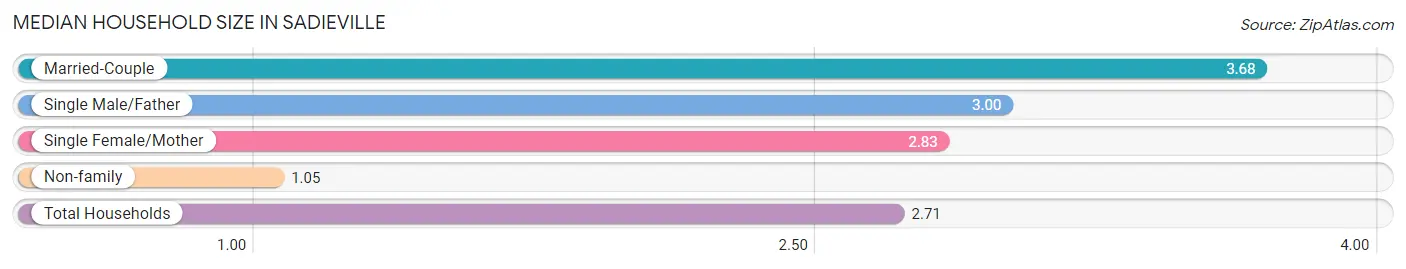
| Household Type | # Households | Household Size |
| Married-Couple | 62 (51.7%) | 3.68 |
| Single Male/Father | 2 (1.7%) | 3.00 |
| Single Female/Mother | 18 (15.0%) | 2.83 |
| Non-family | 38 (31.7%) | 1.05 |
| Total Households | 120 (100.0%) | 2.71 |
Household Size by Marriage Status in Sadieville
Out of a total of 120 households in Sadieville, 82 (68.3%) are family households, while 38 (31.7%) are nonfamily households. The most numerous type of family households are 2-person households, comprising 34, and the most common type of nonfamily households are 1-person households, comprising 37.
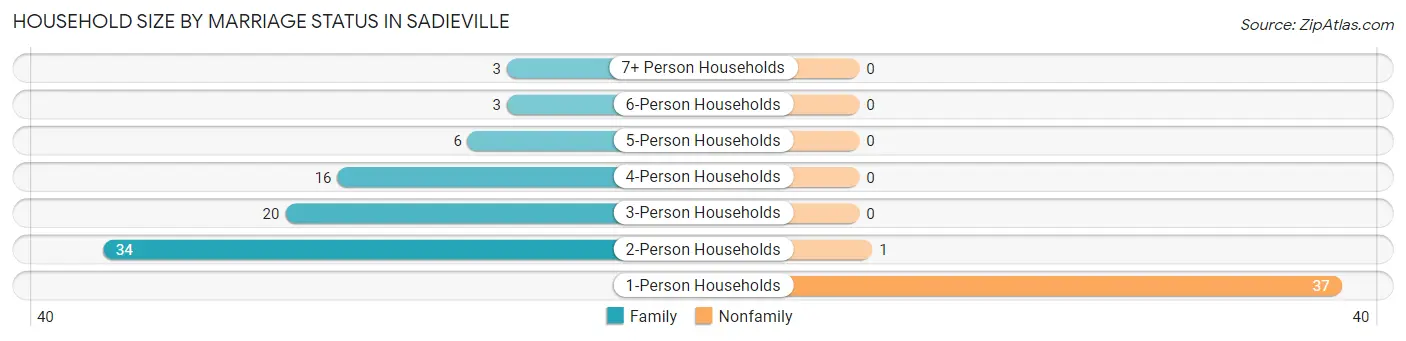
| Household Size | Family Households | Nonfamily Households |
| 1-Person Households | - | 37 (30.8%) |
| 2-Person Households | 34 (28.3%) | 1 (0.8%) |
| 3-Person Households | 20 (16.7%) | 0 (0.0%) |
| 4-Person Households | 16 (13.3%) | 0 (0.0%) |
| 5-Person Households | 6 (5.0%) | 0 (0.0%) |
| 6-Person Households | 3 (2.5%) | 0 (0.0%) |
| 7+ Person Households | 3 (2.5%) | 0 (0.0%) |
| Total | 82 (68.3%) | 38 (31.7%) |
Female Fertility in Sadieville
Fertility by Age in Sadieville
Average fertility rate in Sadieville is 116.0 births per 1,000 women. Women in the age bracket of 20 to 34 years have the highest fertility rate with 227.0 births per 1,000 women. Women in the age bracket of 20 to 34 years acount for 100.0% of all women with births.
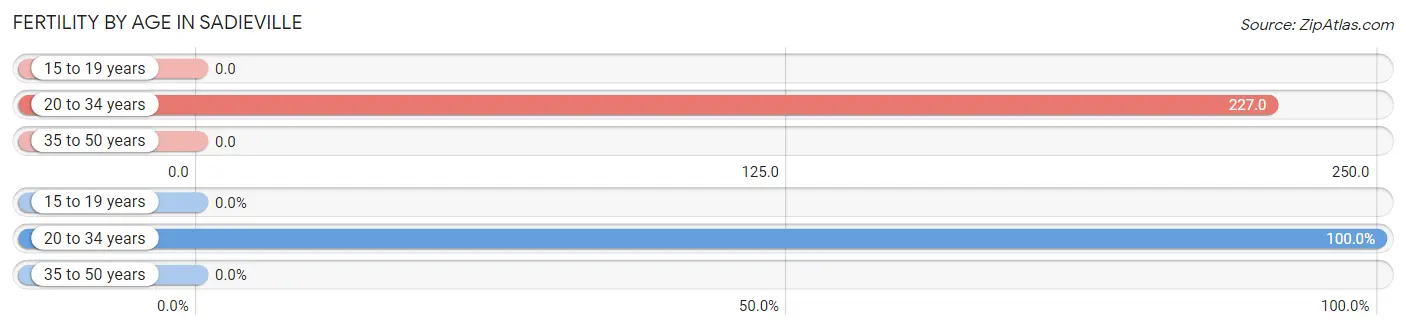
| Age Bracket | Women with Births | Births / 1,000 Women |
| 15 to 19 years | 0 (0.0%) | 0.0 |
| 20 to 34 years | 10 (100.0%) | 227.0 |
| 35 to 50 years | 0 (0.0%) | 0.0 |
| Total | 10 (100.0%) | 116.0 |
Fertility by Age by Marriage Status in Sadieville
50.0% of women with births (10) in Sadieville are married. The highest percentage of unmarried women with births falls into 20 to 34 years age bracket with 50.0% of them unmarried at the time of birth, while the lowest percentage of unmarried women with births belong to 20 to 34 years age bracket with 50.0% of them unmarried.
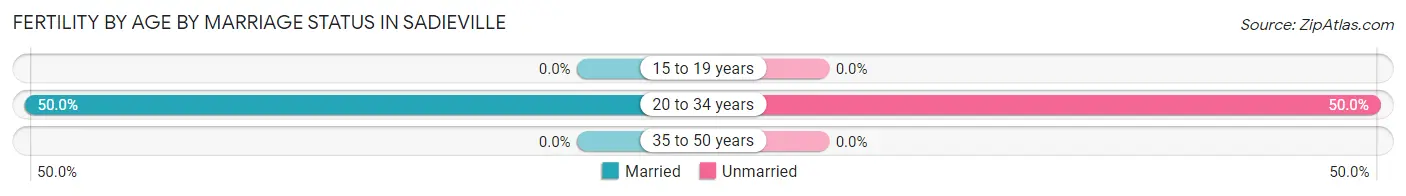
| Age Bracket | Married | Unmarried |
| 15 to 19 years | 0 (0.0%) | 0 (0.0%) |
| 20 to 34 years | 5 (50.0%) | 5 (50.0%) |
| 35 to 50 years | 0 (0.0%) | 0 (0.0%) |
| Total | 5 (50.0%) | 5 (50.0%) |
Fertility by Education in Sadieville
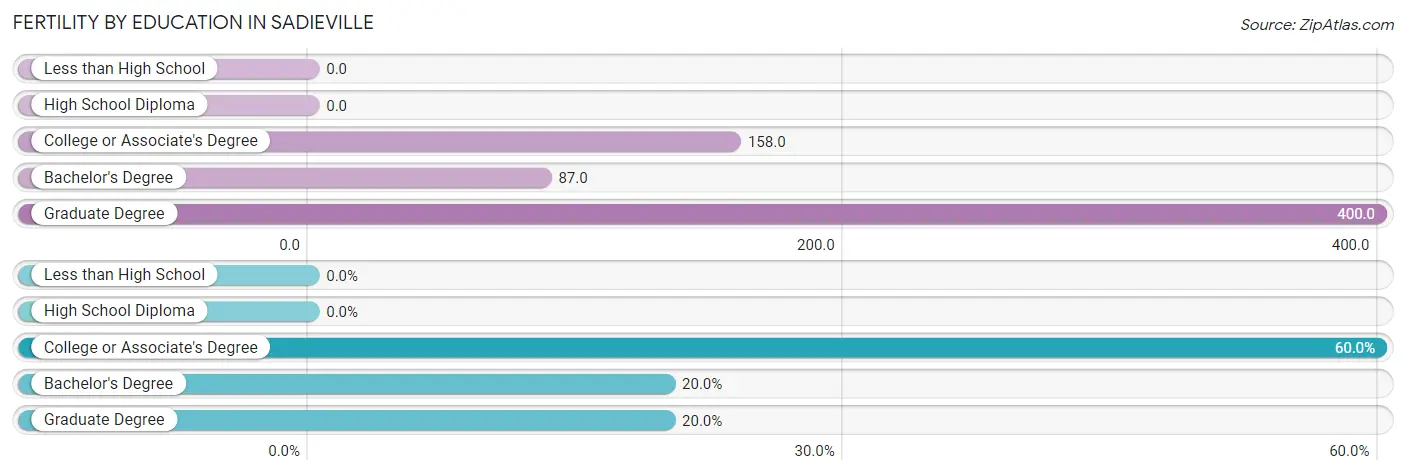
| Educational Attainment | Women with Births | Births / 1,000 Women |
| Less than High School | 0 (0.0%) | 0.0 |
| High School Diploma | 0 (0.0%) | 0.0 |
| College or Associate's Degree | 6 (60.0%) | 158.0 |
| Bachelor's Degree | 2 (20.0%) | 87.0 |
| Graduate Degree | 2 (20.0%) | 400.0 |
| Total | 10 (100.0%) | 116.0 |
Fertility by Education by Marriage Status in Sadieville
50.0% of women with births in Sadieville are unmarried. Women with the educational attainment of graduate degree are most likely to be married with 100.0% of them married at childbirth, while women with the educational attainment of bachelor's degree are least likely to be married with 100.0% of them unmarried at childbirth.
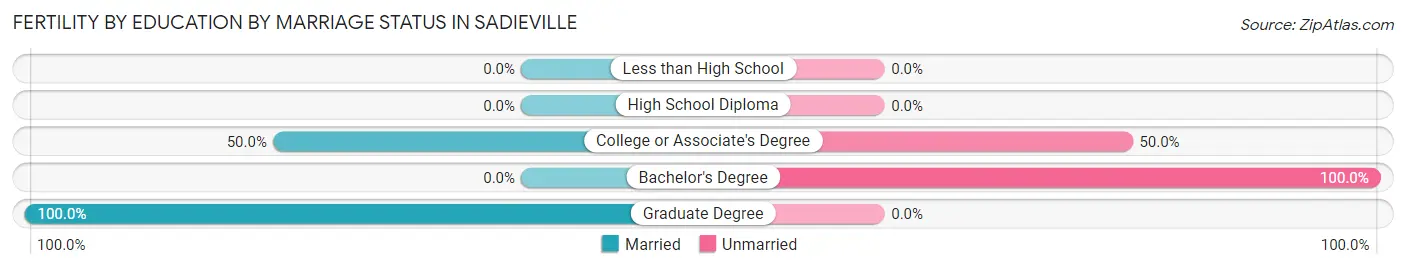
| Educational Attainment | Married | Unmarried |
| Less than High School | 0 (0.0%) | 0 (0.0%) |
| High School Diploma | 0 (0.0%) | 0 (0.0%) |
| College or Associate's Degree | 3 (50.0%) | 3 (50.0%) |
| Bachelor's Degree | 0 (0.0%) | 2 (100.0%) |
| Graduate Degree | 2 (100.0%) | 0 (0.0%) |
| Total | 5 (50.0%) | 5 (50.0%) |
Employment Characteristics in Sadieville
Employment by Class of Employer in Sadieville
Among the 170 employed individuals in Sadieville, private company employees (136 | 80.0%), not-for-profit organizations (12 | 7.1%), and federal government employees (11 | 6.5%) make up the most common classes of employment.
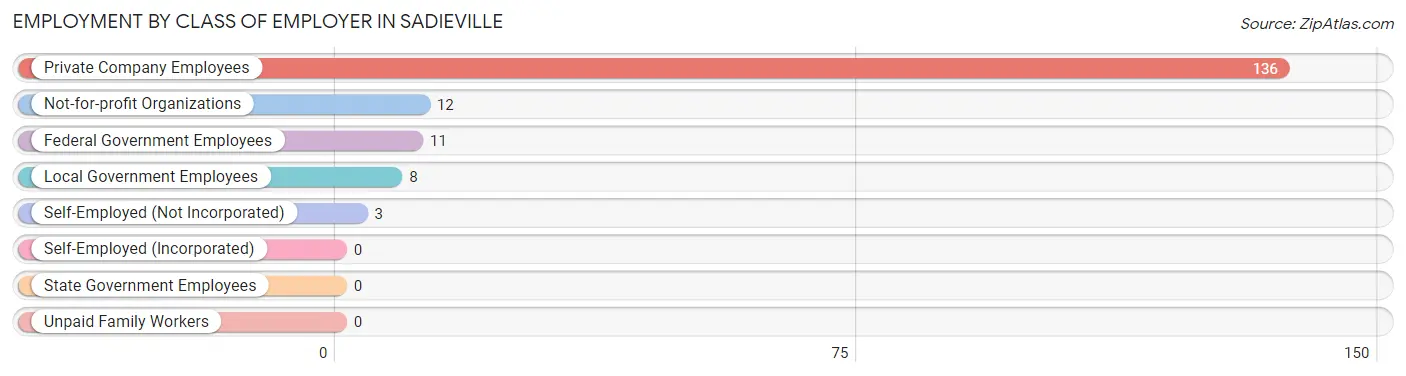
| Employer Class | # Employees | % Employees |
| Private Company Employees | 136 | 80.0% |
| Self-Employed (Incorporated) | 0 | 0.0% |
| Self-Employed (Not Incorporated) | 3 | 1.8% |
| Not-for-profit Organizations | 12 | 7.1% |
| Local Government Employees | 8 | 4.7% |
| State Government Employees | 0 | 0.0% |
| Federal Government Employees | 11 | 6.5% |
| Unpaid Family Workers | 0 | 0.0% |
| Total | 170 | 100.0% |
Employment Status by Age in Sadieville
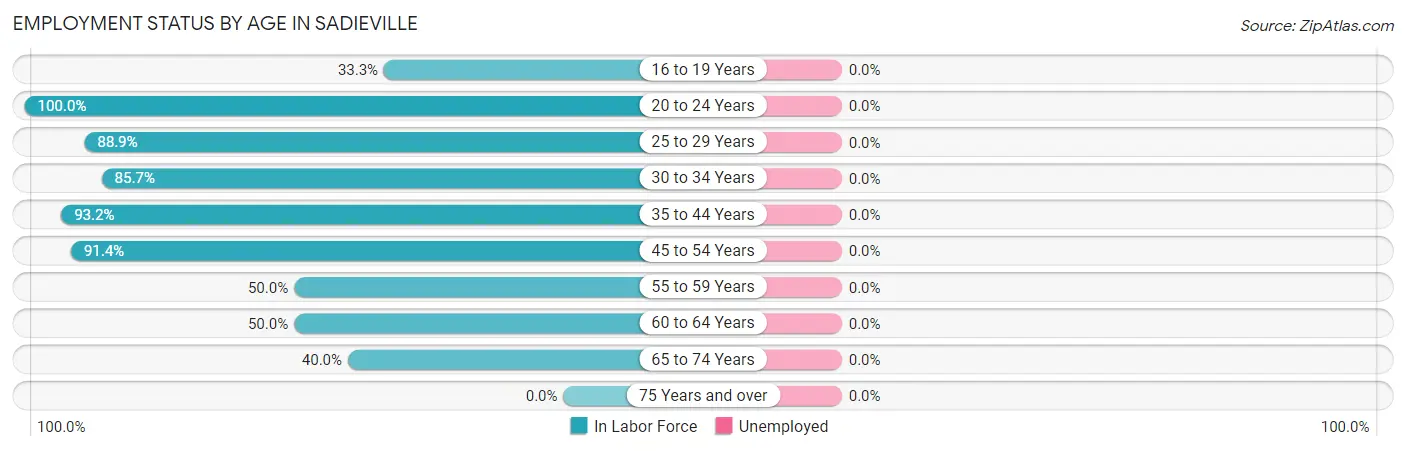
| Age Bracket | In Labor Force | Unemployed |
| 16 to 19 Years | 5 (33.3%) | 0 (0.0%) |
| 20 to 24 Years | 29 (100.0%) | 0 (0.0%) |
| 25 to 29 Years | 24 (88.9%) | 0 (0.0%) |
| 30 to 34 Years | 24 (85.7%) | 0 (0.0%) |
| 35 to 44 Years | 41 (93.2%) | 0 (0.0%) |
| 45 to 54 Years | 32 (91.4%) | 0 (0.0%) |
| 55 to 59 Years | 9 (50.0%) | 0 (0.0%) |
| 60 to 64 Years | 11 (50.0%) | 0 (0.0%) |
| 65 to 74 Years | 4 (40.0%) | 0 (0.0%) |
| 75 Years and over | 0 (0.0%) | 0 (0.0%) |
| Total | 179 (75.2%) | 0 (0.0%) |
Employment Status by Educational Attainment in Sadieville
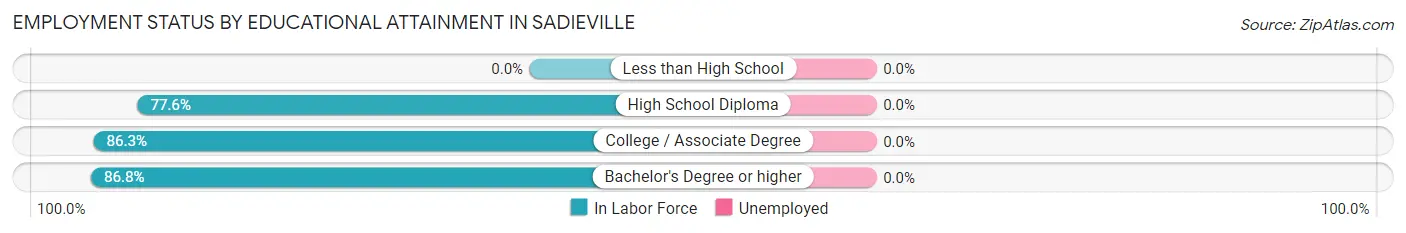
| Educational Attainment | In Labor Force | Unemployed |
| Less than High School | 0 (0.0%) | 0 (0.0%) |
| High School Diploma | 45 (77.6%) | 0 (0.0%) |
| College / Associate Degree | 63 (86.3%) | 0 (0.0%) |
| Bachelor's Degree or higher | 33 (86.8%) | 0 (0.0%) |
| Total | 141 (81.0%) | 0 (0.0%) |
Employment Occupations by Sex in Sadieville
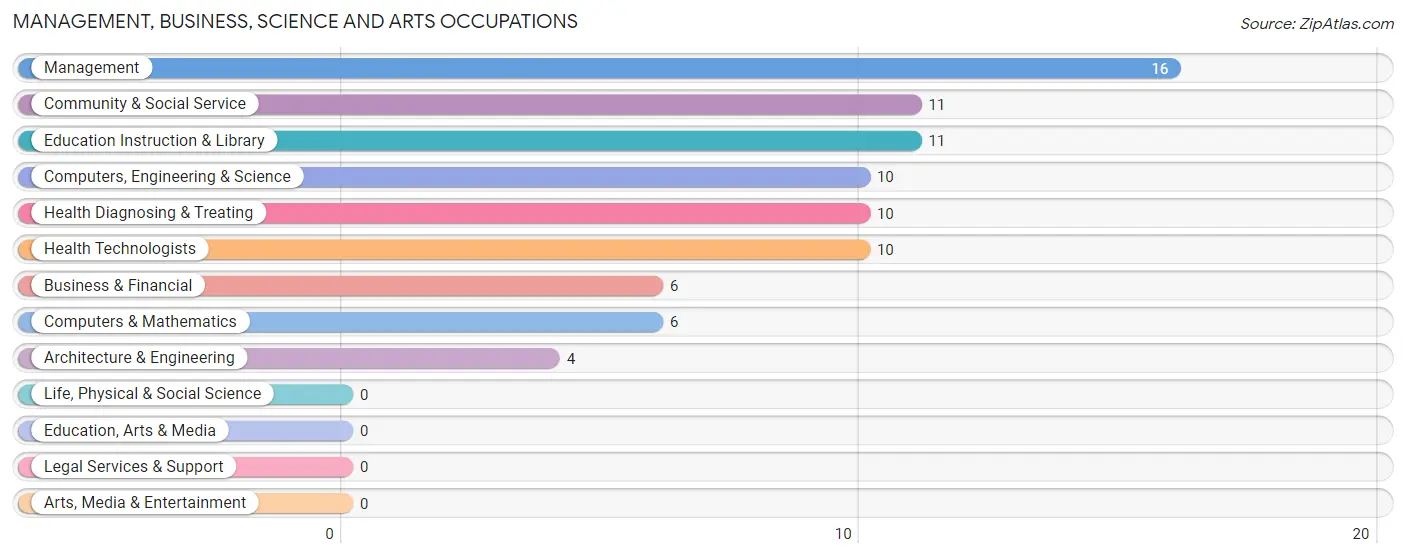
Management, Business, Science and Arts Occupations
The most common Management, Business, Science and Arts occupations in Sadieville are Management (16 | 9.2%), Community & Social Service (11 | 6.3%), Education Instruction & Library (11 | 6.3%), Computers, Engineering & Science (10 | 5.8%), and Health Diagnosing & Treating (10 | 5.8%).
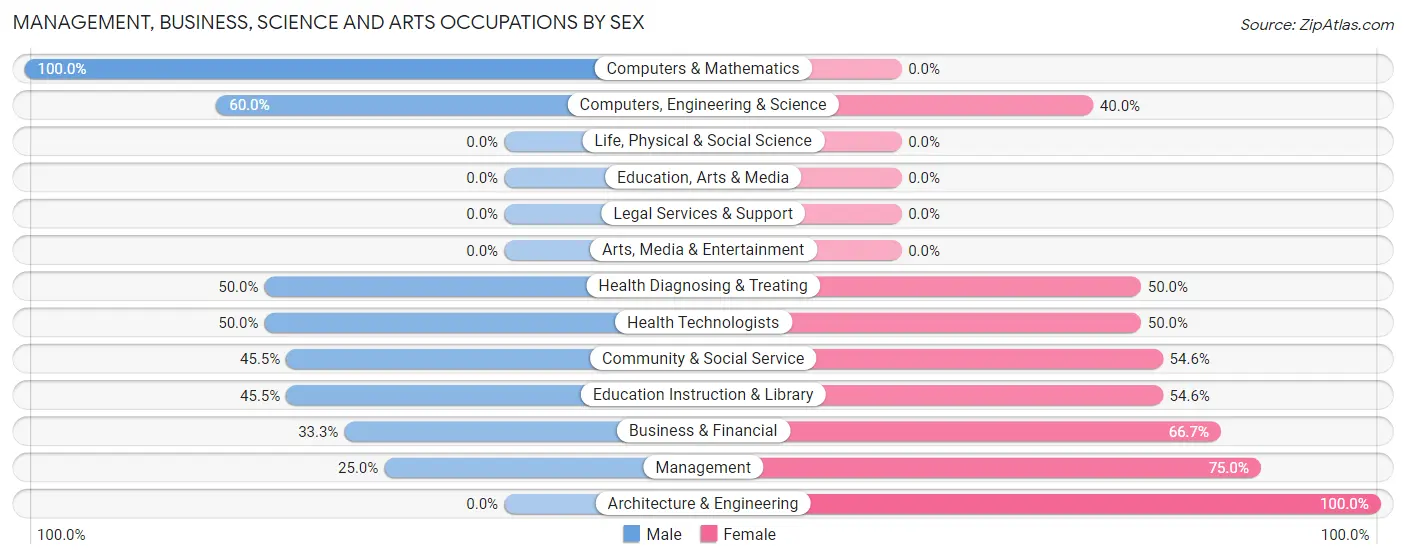
Management, Business, Science and Arts Occupations by Sex
Within the Management, Business, Science and Arts occupations in Sadieville, the most male-oriented occupations are Computers & Mathematics (100.0%), Computers, Engineering & Science (60.0%), and Health Diagnosing & Treating (50.0%), while the most female-oriented occupations are Architecture & Engineering (100.0%), Management (75.0%), and Business & Financial (66.7%).
| Occupation | Male | Female |
| Management | 4 (25.0%) | 12 (75.0%) |
| Business & Financial | 2 (33.3%) | 4 (66.7%) |
| Computers, Engineering & Science | 6 (60.0%) | 4 (40.0%) |
| Computers & Mathematics | 6 (100.0%) | 0 (0.0%) |
| Architecture & Engineering | 0 (0.0%) | 4 (100.0%) |
| Life, Physical & Social Science | 0 (0.0%) | 0 (0.0%) |
| Community & Social Service | 5 (45.5%) | 6 (54.5%) |
| Education, Arts & Media | 0 (0.0%) | 0 (0.0%) |
| Legal Services & Support | 0 (0.0%) | 0 (0.0%) |
| Education Instruction & Library | 5 (45.5%) | 6 (54.5%) |
| Arts, Media & Entertainment | 0 (0.0%) | 0 (0.0%) |
| Health Diagnosing & Treating | 5 (50.0%) | 5 (50.0%) |
| Health Technologists | 5 (50.0%) | 5 (50.0%) |
| Total (Category) | 22 (41.5%) | 31 (58.5%) |
| Total (Overall) | 99 (56.9%) | 75 (43.1%) |
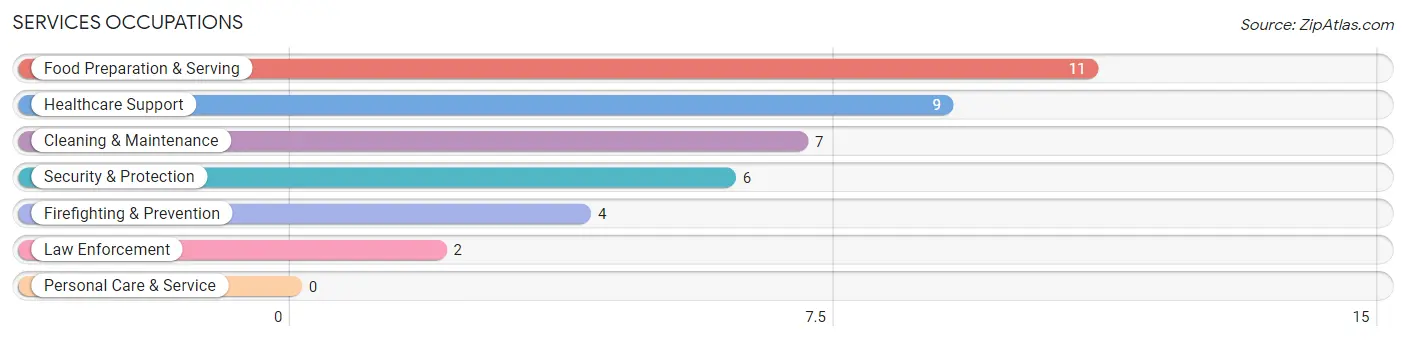
Services Occupations
The most common Services occupations in Sadieville are Food Preparation & Serving (11 | 6.3%), Healthcare Support (9 | 5.2%), Cleaning & Maintenance (7 | 4.0%), Security & Protection (6 | 3.5%), and Firefighting & Prevention (4 | 2.3%).
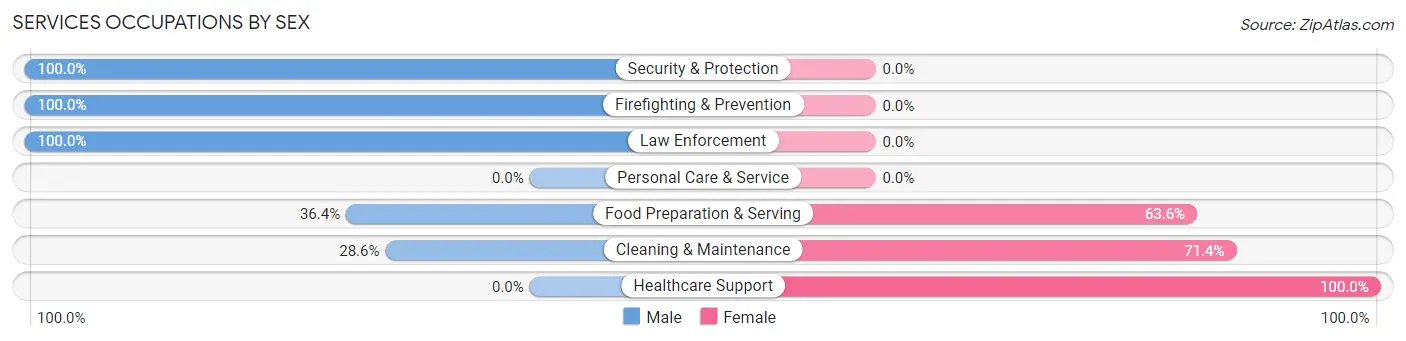
Services Occupations by Sex
Within the Services occupations in Sadieville, the most male-oriented occupations are Security & Protection (100.0%), Firefighting & Prevention (100.0%), and Law Enforcement (100.0%), while the most female-oriented occupations are Healthcare Support (100.0%), Cleaning & Maintenance (71.4%), and Food Preparation & Serving (63.6%).
| Occupation | Male | Female |
| Healthcare Support | 0 (0.0%) | 9 (100.0%) |
| Security & Protection | 6 (100.0%) | 0 (0.0%) |
| Firefighting & Prevention | 4 (100.0%) | 0 (0.0%) |
| Law Enforcement | 2 (100.0%) | 0 (0.0%) |
| Food Preparation & Serving | 4 (36.4%) | 7 (63.6%) |
| Cleaning & Maintenance | 2 (28.6%) | 5 (71.4%) |
| Personal Care & Service | 0 (0.0%) | 0 (0.0%) |
| Total (Category) | 12 (36.4%) | 21 (63.6%) |
| Total (Overall) | 99 (56.9%) | 75 (43.1%) |
Sales and Office Occupations
The most common Sales and Office occupations in Sadieville are Office & Administration (12 | 6.9%), and Sales & Related (7 | 4.0%).
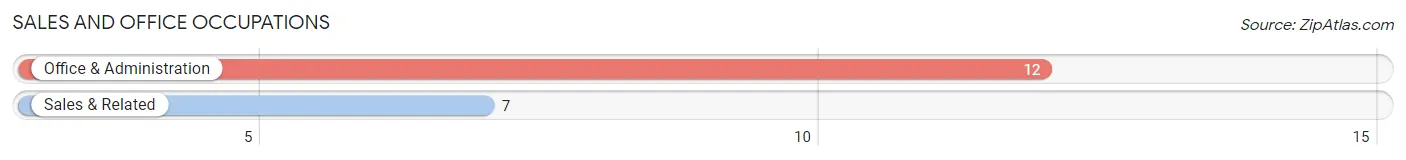
Sales and Office Occupations by Sex
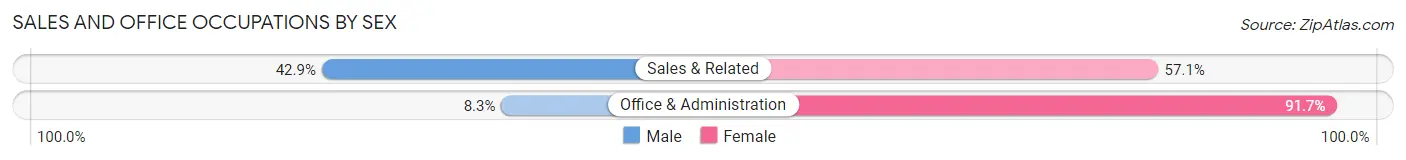
| Occupation | Male | Female |
| Sales & Related | 3 (42.9%) | 4 (57.1%) |
| Office & Administration | 1 (8.3%) | 11 (91.7%) |
| Total (Category) | 4 (21.0%) | 15 (78.9%) |
| Total (Overall) | 99 (56.9%) | 75 (43.1%) |
Natural Resources, Construction and Maintenance Occupations
The most common Natural Resources, Construction and Maintenance occupations in Sadieville are Installation, Maintenance & Repair (25 | 14.4%), and Construction & Extraction (6 | 3.5%).
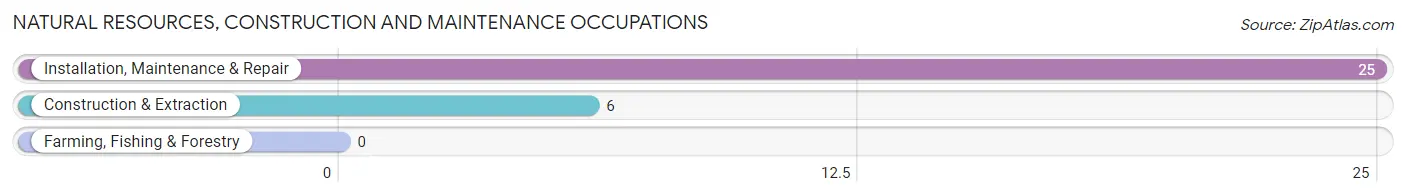
Natural Resources, Construction and Maintenance Occupations by Sex
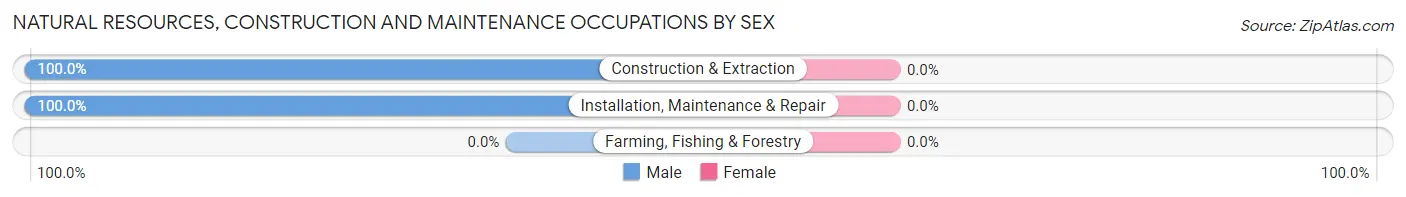
| Occupation | Male | Female |
| Farming, Fishing & Forestry | 0 (0.0%) | 0 (0.0%) |
| Construction & Extraction | 6 (100.0%) | 0 (0.0%) |
| Installation, Maintenance & Repair | 25 (100.0%) | 0 (0.0%) |
| Total (Category) | 31 (100.0%) | 0 (0.0%) |
| Total (Overall) | 99 (56.9%) | 75 (43.1%) |
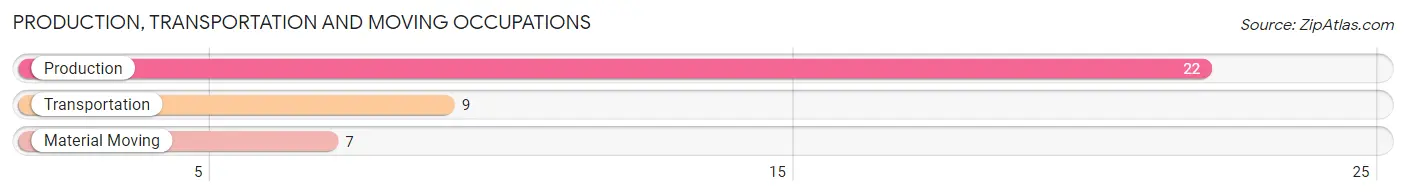
Production, Transportation and Moving Occupations
The most common Production, Transportation and Moving occupations in Sadieville are Production (22 | 12.6%), Transportation (9 | 5.2%), and Material Moving (7 | 4.0%).
Production, Transportation and Moving Occupations by Sex
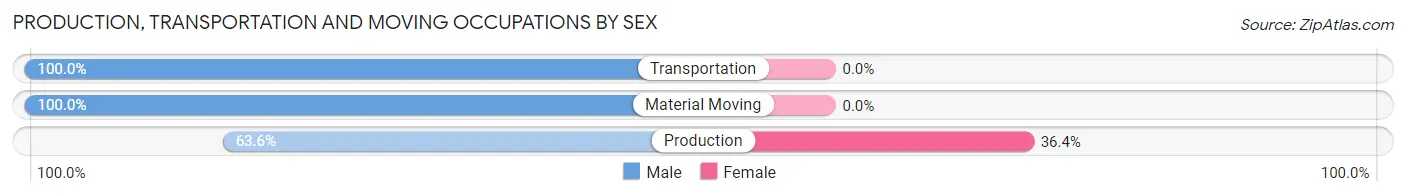
| Occupation | Male | Female |
| Production | 14 (63.6%) | 8 (36.4%) |
| Transportation | 9 (100.0%) | 0 (0.0%) |
| Material Moving | 7 (100.0%) | 0 (0.0%) |
| Total (Category) | 30 (78.9%) | 8 (21.0%) |
| Total (Overall) | 99 (56.9%) | 75 (43.1%) |
Employment Industries by Sex in Sadieville
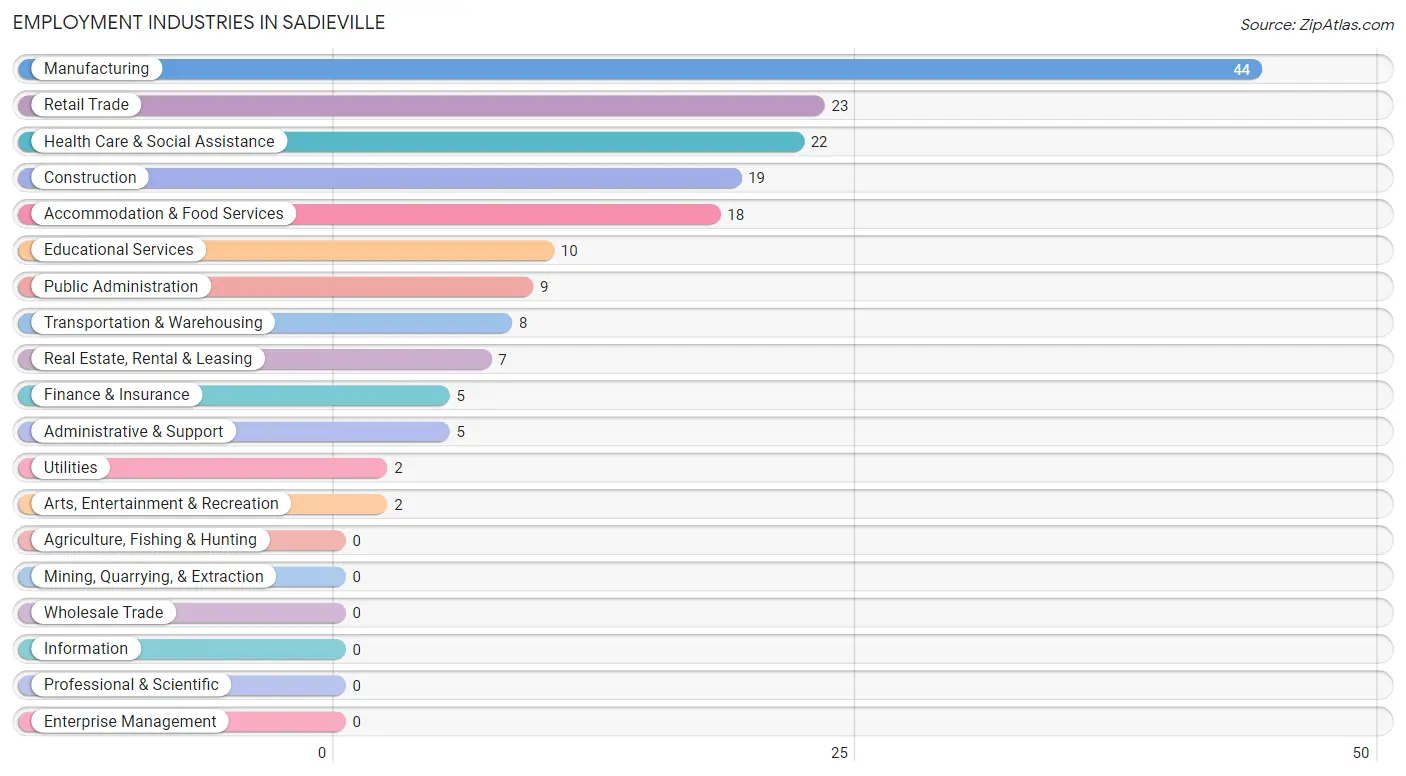
Employment Industries in Sadieville
The major employment industries in Sadieville include Manufacturing (44 | 25.3%), Retail Trade (23 | 13.2%), Health Care & Social Assistance (22 | 12.6%), Construction (19 | 10.9%), and Accommodation & Food Services (18 | 10.3%).
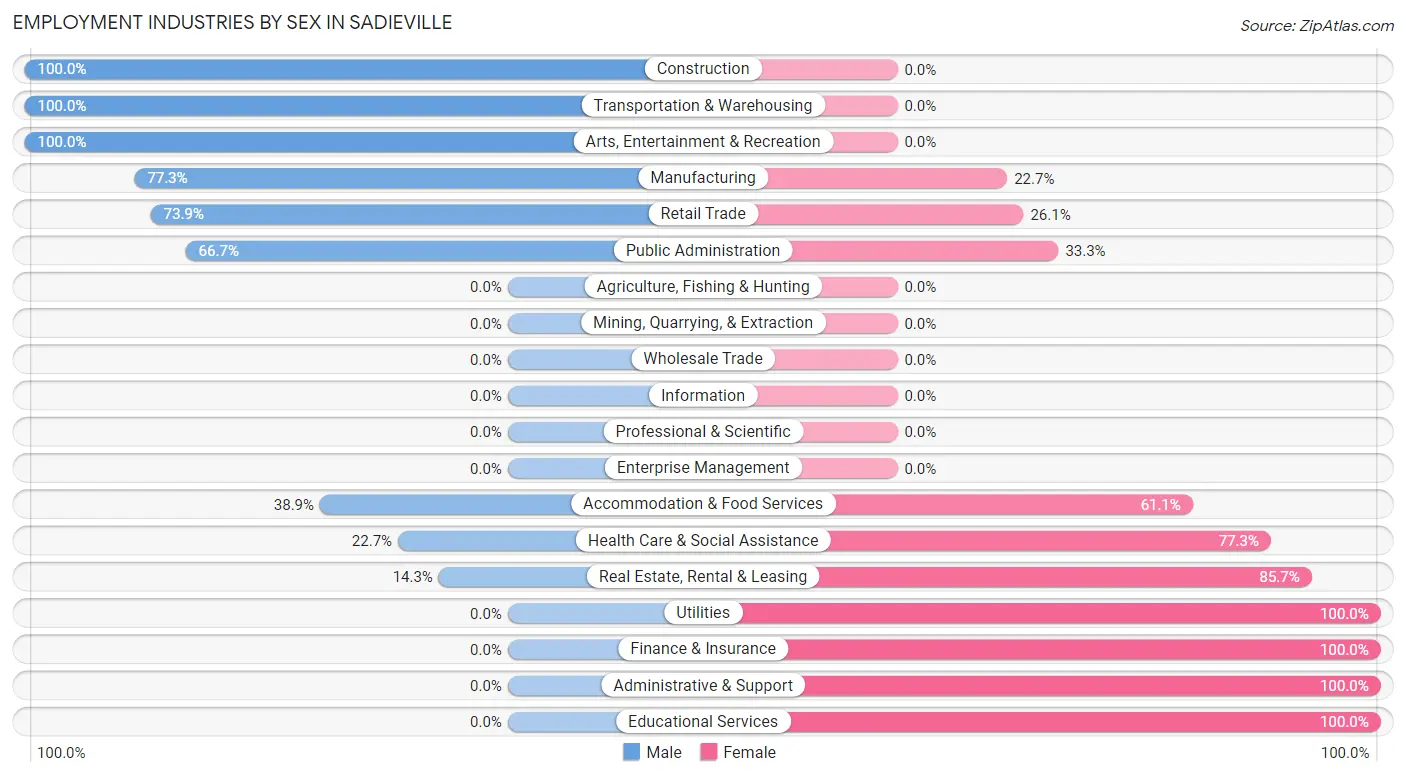
Employment Industries by Sex in Sadieville
The Sadieville industries that see more men than women are Construction (100.0%), Transportation & Warehousing (100.0%), and Arts, Entertainment & Recreation (100.0%), whereas the industries that tend to have a higher number of women are Utilities (100.0%), Finance & Insurance (100.0%), and Administrative & Support (100.0%).
| Industry | Male | Female |
| Agriculture, Fishing & Hunting | 0 (0.0%) | 0 (0.0%) |
| Mining, Quarrying, & Extraction | 0 (0.0%) | 0 (0.0%) |
| Construction | 19 (100.0%) | 0 (0.0%) |
| Manufacturing | 34 (77.3%) | 10 (22.7%) |
| Wholesale Trade | 0 (0.0%) | 0 (0.0%) |
| Retail Trade | 17 (73.9%) | 6 (26.1%) |
| Transportation & Warehousing | 8 (100.0%) | 0 (0.0%) |
| Utilities | 0 (0.0%) | 2 (100.0%) |
| Information | 0 (0.0%) | 0 (0.0%) |
| Finance & Insurance | 0 (0.0%) | 5 (100.0%) |
| Real Estate, Rental & Leasing | 1 (14.3%) | 6 (85.7%) |
| Professional & Scientific | 0 (0.0%) | 0 (0.0%) |
| Enterprise Management | 0 (0.0%) | 0 (0.0%) |
| Administrative & Support | 0 (0.0%) | 5 (100.0%) |
| Educational Services | 0 (0.0%) | 10 (100.0%) |
| Health Care & Social Assistance | 5 (22.7%) | 17 (77.3%) |
| Arts, Entertainment & Recreation | 2 (100.0%) | 0 (0.0%) |
| Accommodation & Food Services | 7 (38.9%) | 11 (61.1%) |
| Public Administration | 6 (66.7%) | 3 (33.3%) |
| Total | 99 (56.9%) | 75 (43.1%) |
Education in Sadieville
School Enrollment in Sadieville
The most common levels of schooling among the 77 students in Sadieville are elementary school (30 | 39.0%), high school (17 | 22.1%), and middle school (16 | 20.8%).
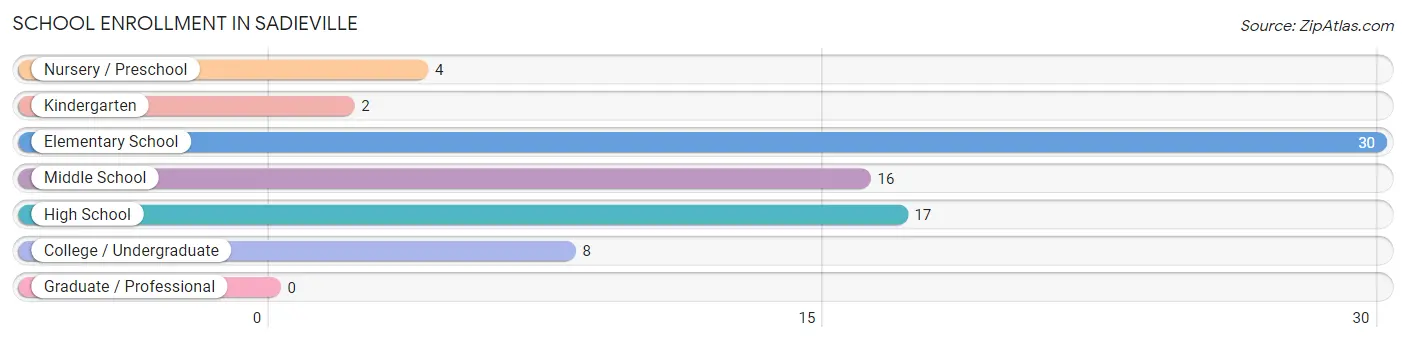
| School Level | # Students | % Students |
| Nursery / Preschool | 4 | 5.2% |
| Kindergarten | 2 | 2.6% |
| Elementary School | 30 | 39.0% |
| Middle School | 16 | 20.8% |
| High School | 17 | 22.1% |
| College / Undergraduate | 8 | 10.4% |
| Graduate / Professional | 0 | 0.0% |
| Total | 77 | 100.0% |
School Enrollment by Age by Funding Source in Sadieville
Out of a total of 77 students who are enrolled in schools in Sadieville, 23 (29.9%) attend a private institution, while the remaining 54 (70.1%) are enrolled in public schools. The age group of 3 to 4 year olds has the highest likelihood of being enrolled in private schools, with 1 (50.0% in the age bracket) enrolled. Conversely, the age group of 20 to 24 year olds has the lowest likelihood of being enrolled in a private school, with 8 (100.0% in the age bracket) attending a public institution.
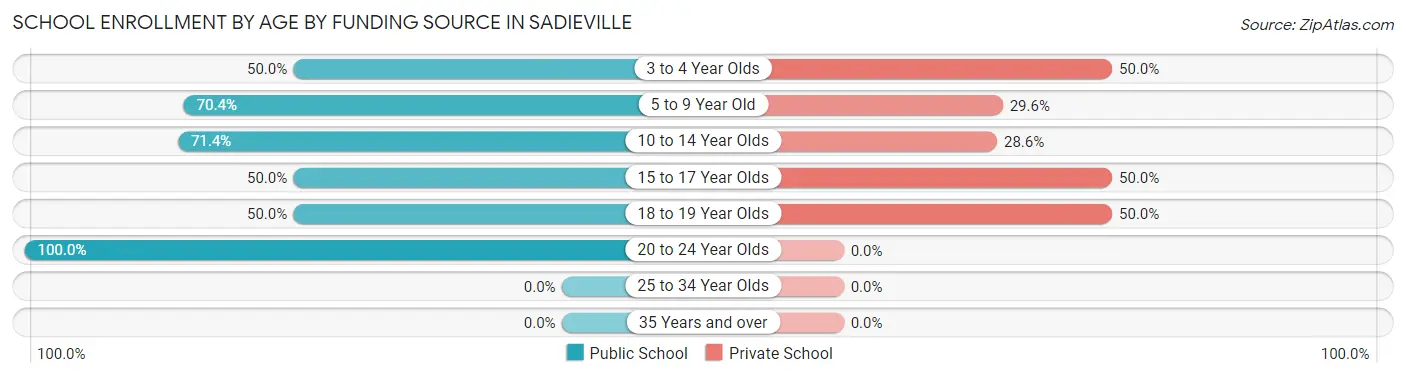
| Age Bracket | Public School | Private School |
| 3 to 4 Year Olds | 1 (50.0%) | 1 (50.0%) |
| 5 to 9 Year Old | 19 (70.4%) | 8 (29.6%) |
| 10 to 14 Year Olds | 20 (71.4%) | 8 (28.6%) |
| 15 to 17 Year Olds | 4 (50.0%) | 4 (50.0%) |
| 18 to 19 Year Olds | 2 (50.0%) | 2 (50.0%) |
| 20 to 24 Year Olds | 8 (100.0%) | 0 (0.0%) |
| 25 to 34 Year Olds | 0 (0.0%) | 0 (0.0%) |
| 35 Years and over | 0 (0.0%) | 0 (0.0%) |
| Total | 54 (70.1%) | 23 (29.9%) |
Educational Attainment by Field of Study in Sadieville
Science & technology (11 | 28.9%), engineering (7 | 18.4%), communications (7 | 18.4%), business (6 | 15.8%), and computers & mathematics (2 | 5.3%) are the most common fields of study among 38 individuals in Sadieville who have obtained a bachelor's degree or higher.
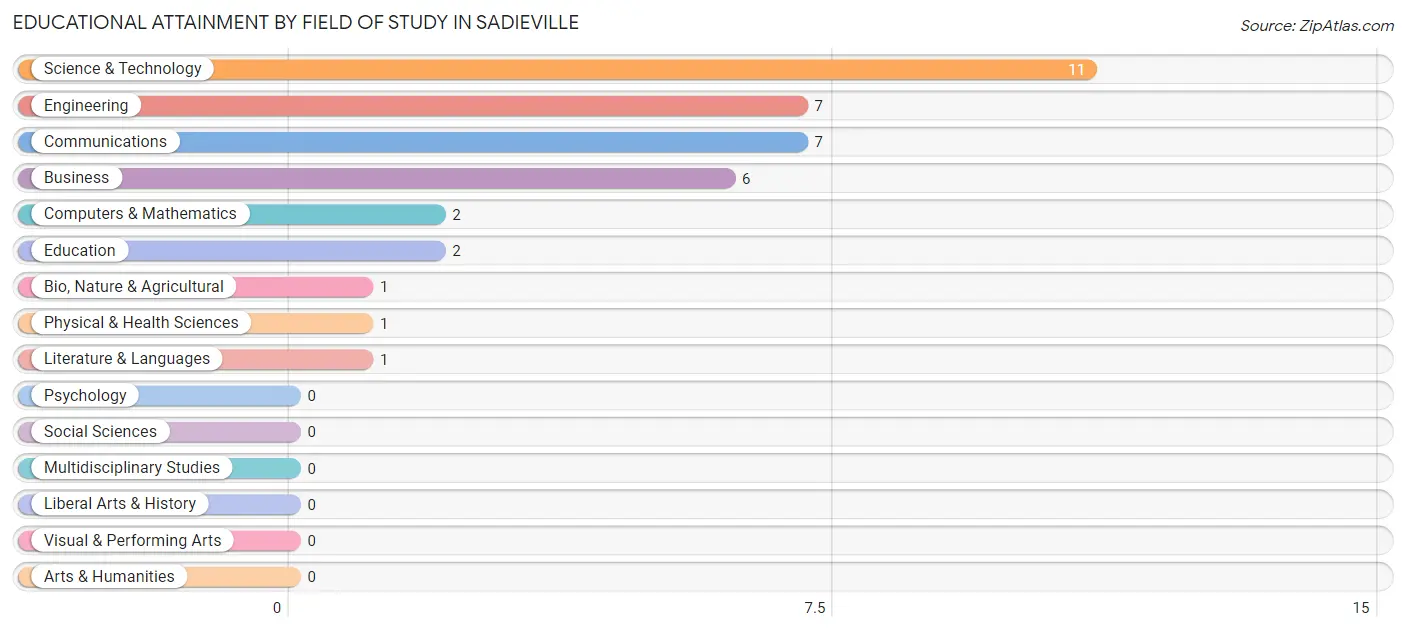
| Field of Study | # Graduates | % Graduates |
| Computers & Mathematics | 2 | 5.3% |
| Bio, Nature & Agricultural | 1 | 2.6% |
| Physical & Health Sciences | 1 | 2.6% |
| Psychology | 0 | 0.0% |
| Social Sciences | 0 | 0.0% |
| Engineering | 7 | 18.4% |
| Multidisciplinary Studies | 0 | 0.0% |
| Science & Technology | 11 | 28.9% |
| Business | 6 | 15.8% |
| Education | 2 | 5.3% |
| Literature & Languages | 1 | 2.6% |
| Liberal Arts & History | 0 | 0.0% |
| Visual & Performing Arts | 0 | 0.0% |
| Communications | 7 | 18.4% |
| Arts & Humanities | 0 | 0.0% |
| Total | 38 | 100.0% |
Transportation & Commute in Sadieville
Vehicle Availability by Sex in Sadieville
The most prevalent vehicle ownership categories in Sadieville are males with 2 vehicles (31, accounting for 34.4%) and females with 2 vehicles (31, making up 38.8%).
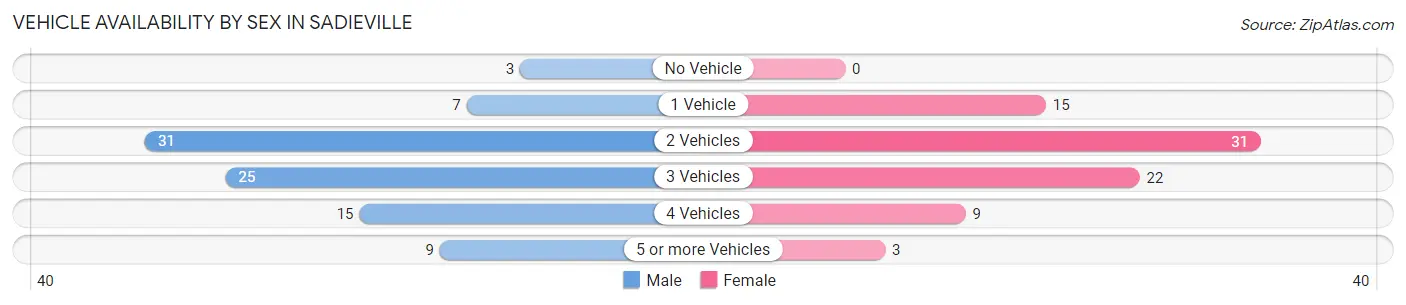
| Vehicles Available | Male | Female |
| No Vehicle | 3 (3.3%) | 0 (0.0%) |
| 1 Vehicle | 7 (7.8%) | 15 (18.8%) |
| 2 Vehicles | 31 (34.4%) | 31 (38.8%) |
| 3 Vehicles | 25 (27.8%) | 22 (27.5%) |
| 4 Vehicles | 15 (16.7%) | 9 (11.3%) |
| 5 or more Vehicles | 9 (10.0%) | 3 (3.7%) |
| Total | 90 (100.0%) | 80 (100.0%) |
Commute Time in Sadieville
The most frequently occuring commute durations in Sadieville are 20 to 24 minutes (32 commuters, 19.4%), 15 to 19 minutes (21 commuters, 12.7%), and 45 to 59 minutes (21 commuters, 12.7%).
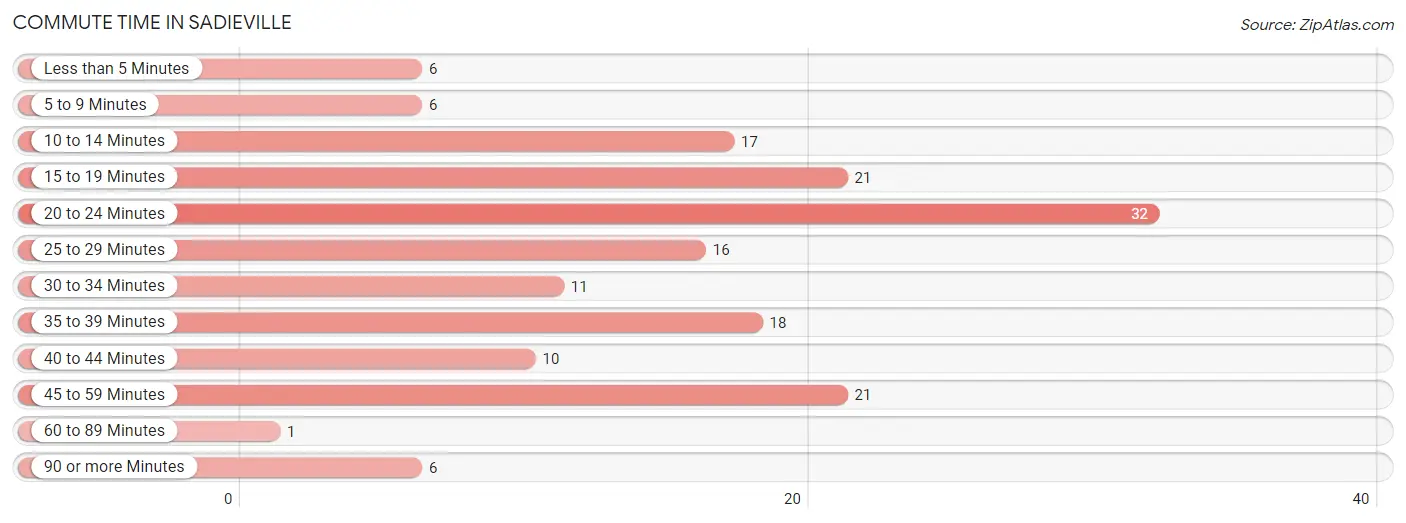
| Commute Time | # Commuters | % Commuters |
| Less than 5 Minutes | 6 | 3.6% |
| 5 to 9 Minutes | 6 | 3.6% |
| 10 to 14 Minutes | 17 | 10.3% |
| 15 to 19 Minutes | 21 | 12.7% |
| 20 to 24 Minutes | 32 | 19.4% |
| 25 to 29 Minutes | 16 | 9.7% |
| 30 to 34 Minutes | 11 | 6.7% |
| 35 to 39 Minutes | 18 | 10.9% |
| 40 to 44 Minutes | 10 | 6.1% |
| 45 to 59 Minutes | 21 | 12.7% |
| 60 to 89 Minutes | 1 | 0.6% |
| 90 or more Minutes | 6 | 3.6% |
Commute Time by Sex in Sadieville
The most common commute times in Sadieville are 20 to 24 minutes (18 commuters, 20.2%) for males and 45 to 59 minutes (21 commuters, 27.6%) for females.
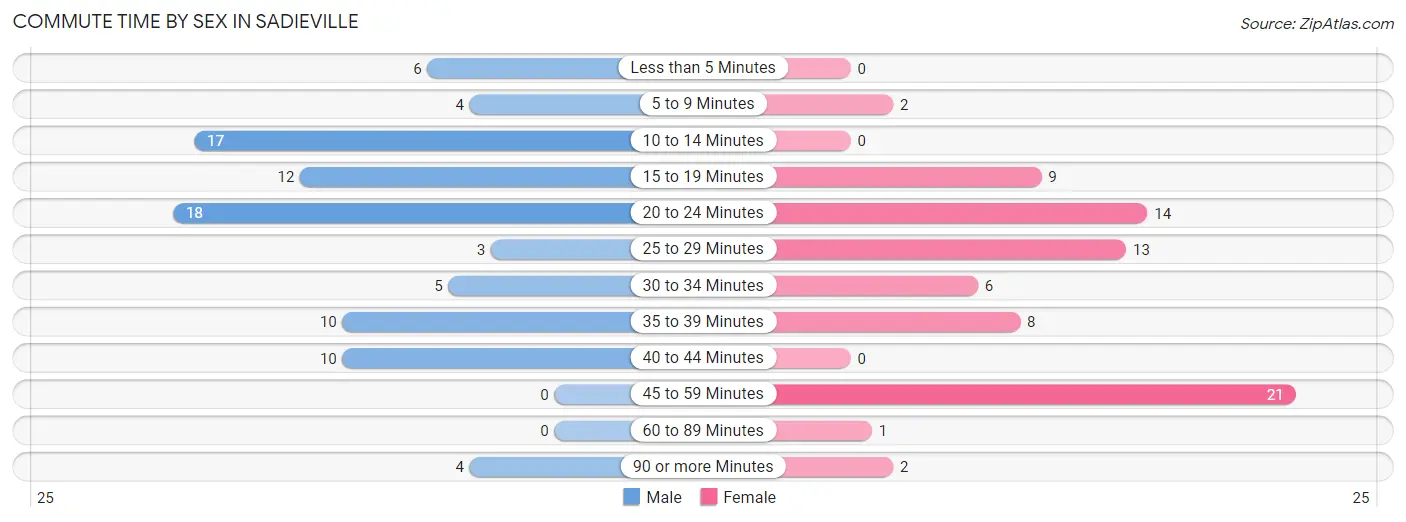
| Commute Time | Male | Female |
| Less than 5 Minutes | 6 (6.7%) | 0 (0.0%) |
| 5 to 9 Minutes | 4 (4.5%) | 2 (2.6%) |
| 10 to 14 Minutes | 17 (19.1%) | 0 (0.0%) |
| 15 to 19 Minutes | 12 (13.5%) | 9 (11.8%) |
| 20 to 24 Minutes | 18 (20.2%) | 14 (18.4%) |
| 25 to 29 Minutes | 3 (3.4%) | 13 (17.1%) |
| 30 to 34 Minutes | 5 (5.6%) | 6 (7.9%) |
| 35 to 39 Minutes | 10 (11.2%) | 8 (10.5%) |
| 40 to 44 Minutes | 10 (11.2%) | 0 (0.0%) |
| 45 to 59 Minutes | 0 (0.0%) | 21 (27.6%) |
| 60 to 89 Minutes | 0 (0.0%) | 1 (1.3%) |
| 90 or more Minutes | 4 (4.5%) | 2 (2.6%) |
Time of Departure to Work by Sex in Sadieville
The most frequent times of departure to work in Sadieville are 6:30 AM to 6:59 AM (24, 27.0%) for males and 7:30 AM to 7:59 AM (17, 22.4%) for females.
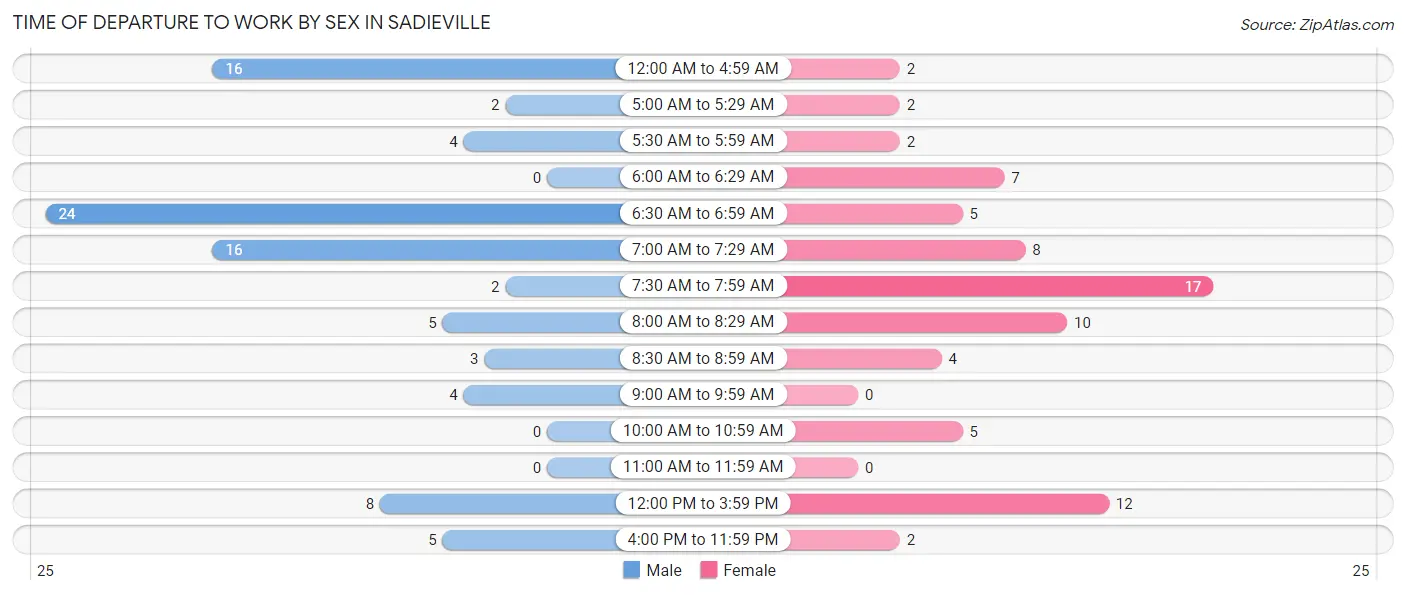
| Time of Departure | Male | Female |
| 12:00 AM to 4:59 AM | 16 (18.0%) | 2 (2.6%) |
| 5:00 AM to 5:29 AM | 2 (2.2%) | 2 (2.6%) |
| 5:30 AM to 5:59 AM | 4 (4.5%) | 2 (2.6%) |
| 6:00 AM to 6:29 AM | 0 (0.0%) | 7 (9.2%) |
| 6:30 AM to 6:59 AM | 24 (27.0%) | 5 (6.6%) |
| 7:00 AM to 7:29 AM | 16 (18.0%) | 8 (10.5%) |
| 7:30 AM to 7:59 AM | 2 (2.2%) | 17 (22.4%) |
| 8:00 AM to 8:29 AM | 5 (5.6%) | 10 (13.2%) |
| 8:30 AM to 8:59 AM | 3 (3.4%) | 4 (5.3%) |
| 9:00 AM to 9:59 AM | 4 (4.5%) | 0 (0.0%) |
| 10:00 AM to 10:59 AM | 0 (0.0%) | 5 (6.6%) |
| 11:00 AM to 11:59 AM | 0 (0.0%) | 0 (0.0%) |
| 12:00 PM to 3:59 PM | 8 (9.0%) | 12 (15.8%) |
| 4:00 PM to 11:59 PM | 5 (5.6%) | 2 (2.6%) |
| Total | 89 (100.0%) | 76 (100.0%) |
Housing Occupancy in Sadieville
Occupancy by Ownership in Sadieville
Of the total 120 dwellings in Sadieville, owner-occupied units account for 86 (71.7%), while renter-occupied units make up 34 (28.3%).
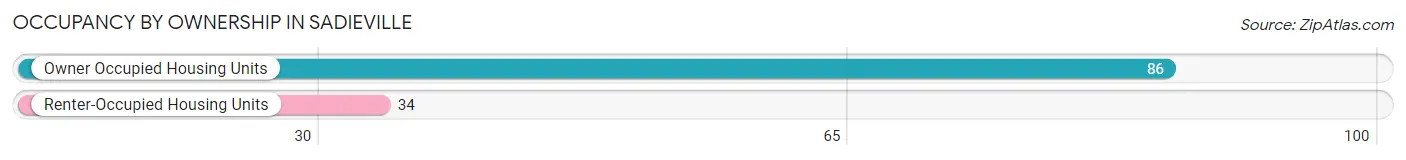
| Occupancy | # Housing Units | % Housing Units |
| Owner Occupied Housing Units | 86 | 71.7% |
| Renter-Occupied Housing Units | 34 | 28.3% |
| Total Occupied Housing Units | 120 | 100.0% |
Occupancy by Household Size in Sadieville
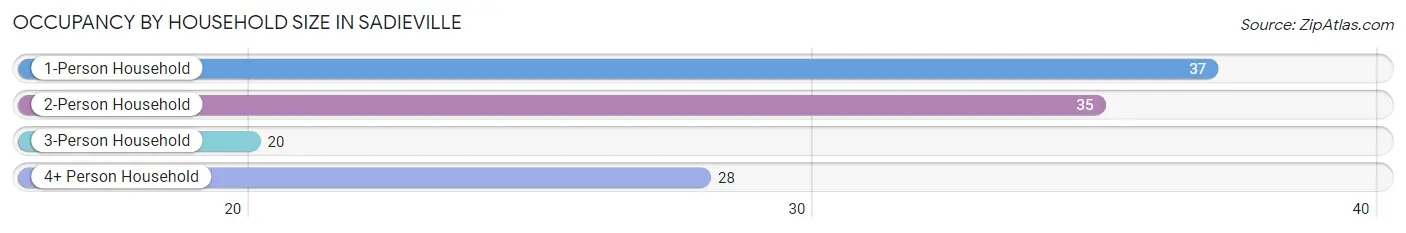
| Household Size | # Housing Units | % Housing Units |
| 1-Person Household | 37 | 30.8% |
| 2-Person Household | 35 | 29.2% |
| 3-Person Household | 20 | 16.7% |
| 4+ Person Household | 28 | 23.3% |
| Total Housing Units | 120 | 100.0% |
Occupancy by Ownership by Household Size in Sadieville
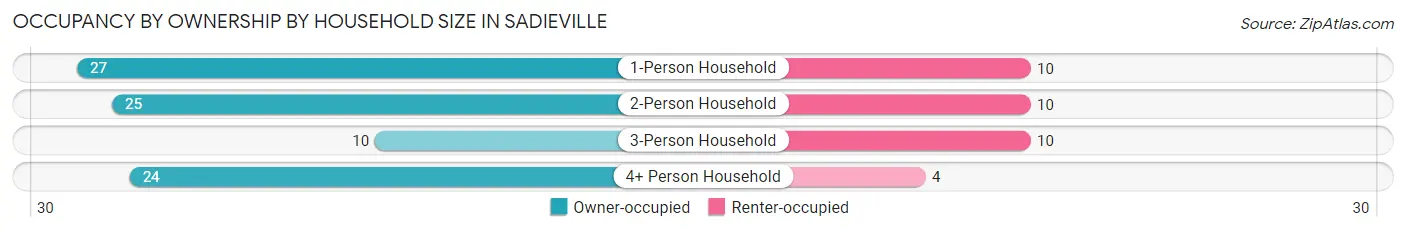
| Household Size | Owner-occupied | Renter-occupied |
| 1-Person Household | 27 (73.0%) | 10 (27.0%) |
| 2-Person Household | 25 (71.4%) | 10 (28.6%) |
| 3-Person Household | 10 (50.0%) | 10 (50.0%) |
| 4+ Person Household | 24 (85.7%) | 4 (14.3%) |
| Total Housing Units | 86 (71.7%) | 34 (28.3%) |
Occupancy by Educational Attainment in Sadieville
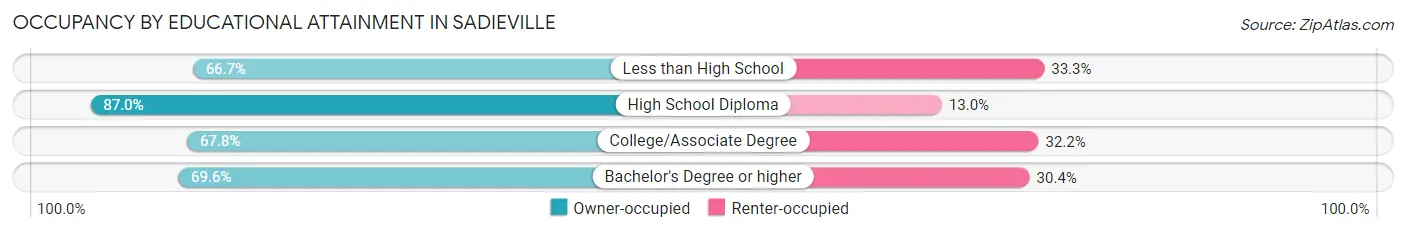
| Household Size | Owner-occupied | Renter-occupied |
| Less than High School | 10 (66.7%) | 5 (33.3%) |
| High School Diploma | 20 (87.0%) | 3 (13.0%) |
| College/Associate Degree | 40 (67.8%) | 19 (32.2%) |
| Bachelor's Degree or higher | 16 (69.6%) | 7 (30.4%) |
Occupancy by Age of Householder in Sadieville
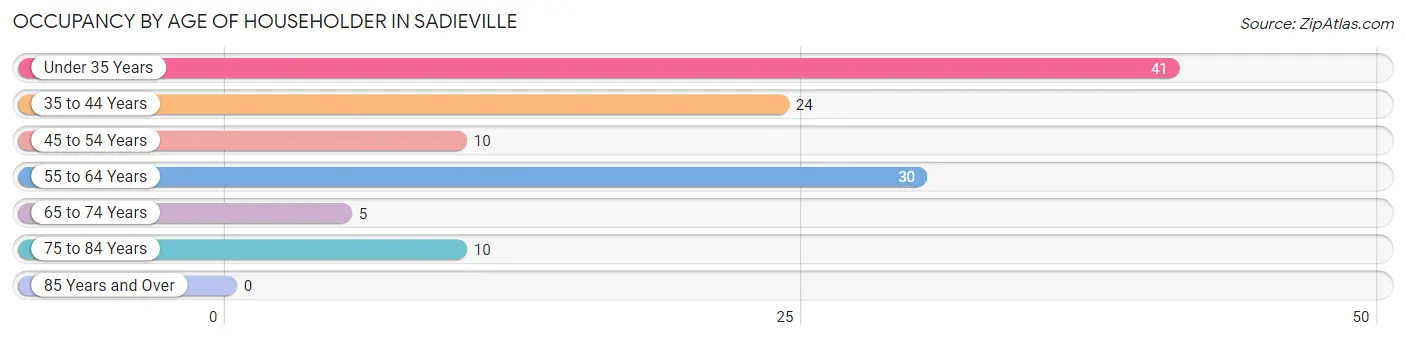
| Age Bracket | # Households | % Households |
| Under 35 Years | 41 | 34.2% |
| 35 to 44 Years | 24 | 20.0% |
| 45 to 54 Years | 10 | 8.3% |
| 55 to 64 Years | 30 | 25.0% |
| 65 to 74 Years | 5 | 4.2% |
| 75 to 84 Years | 10 | 8.3% |
| 85 Years and Over | 0 | 0.0% |
| Total | 120 | 100.0% |
Housing Finances in Sadieville
Median Income by Occupancy in Sadieville
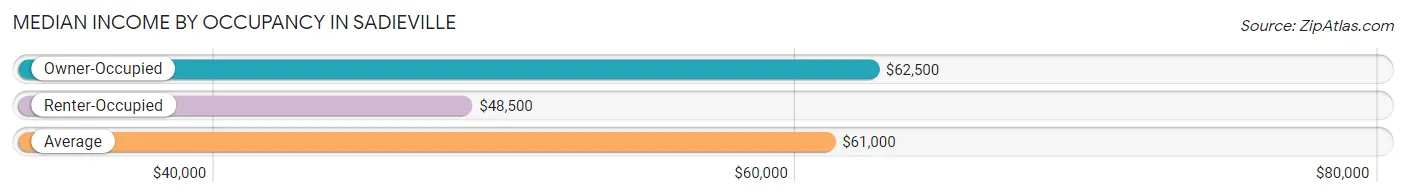
| Occupancy Type | # Households | Median Income |
| Owner-Occupied | 86 (71.7%) | $62,500 |
| Renter-Occupied | 34 (28.3%) | $48,500 |
| Average | 120 (100.0%) | $61,000 |
Occupancy by Householder Income Bracket in Sadieville
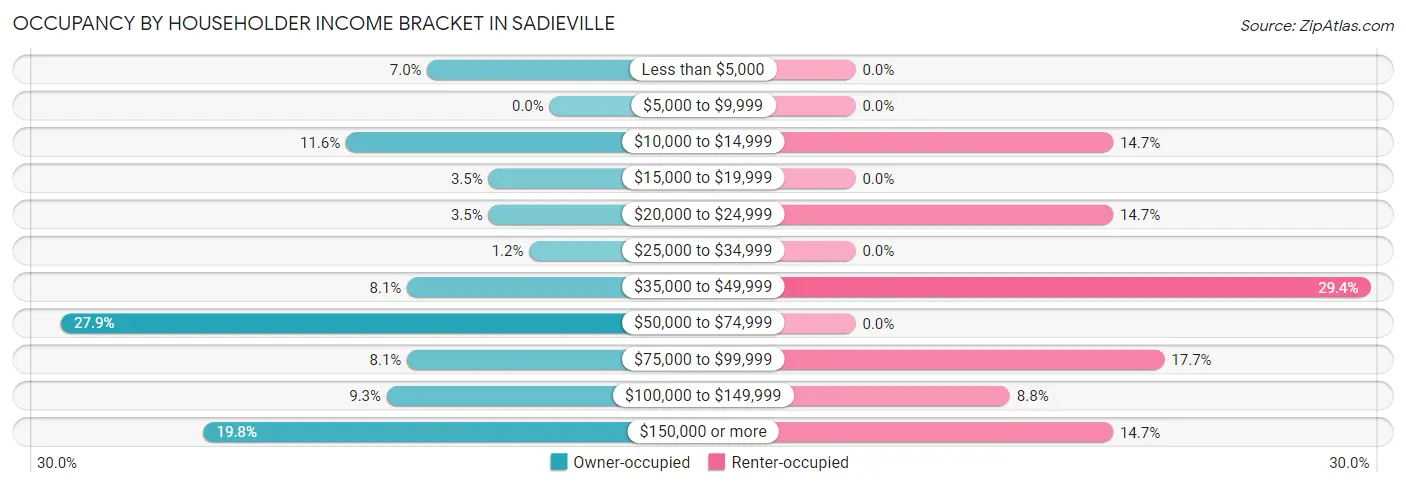
| Income Bracket | Owner-occupied | Renter-occupied |
| Less than $5,000 | 6 (7.0%) | 0 (0.0%) |
| $5,000 to $9,999 | 0 (0.0%) | 0 (0.0%) |
| $10,000 to $14,999 | 10 (11.6%) | 5 (14.7%) |
| $15,000 to $19,999 | 3 (3.5%) | 0 (0.0%) |
| $20,000 to $24,999 | 3 (3.5%) | 5 (14.7%) |
| $25,000 to $34,999 | 1 (1.2%) | 0 (0.0%) |
| $35,000 to $49,999 | 7 (8.1%) | 10 (29.4%) |
| $50,000 to $74,999 | 24 (27.9%) | 0 (0.0%) |
| $75,000 to $99,999 | 7 (8.1%) | 6 (17.6%) |
| $100,000 to $149,999 | 8 (9.3%) | 3 (8.8%) |
| $150,000 or more | 17 (19.8%) | 5 (14.7%) |
| Total | 86 (100.0%) | 34 (100.0%) |
Monthly Housing Cost Tiers in Sadieville
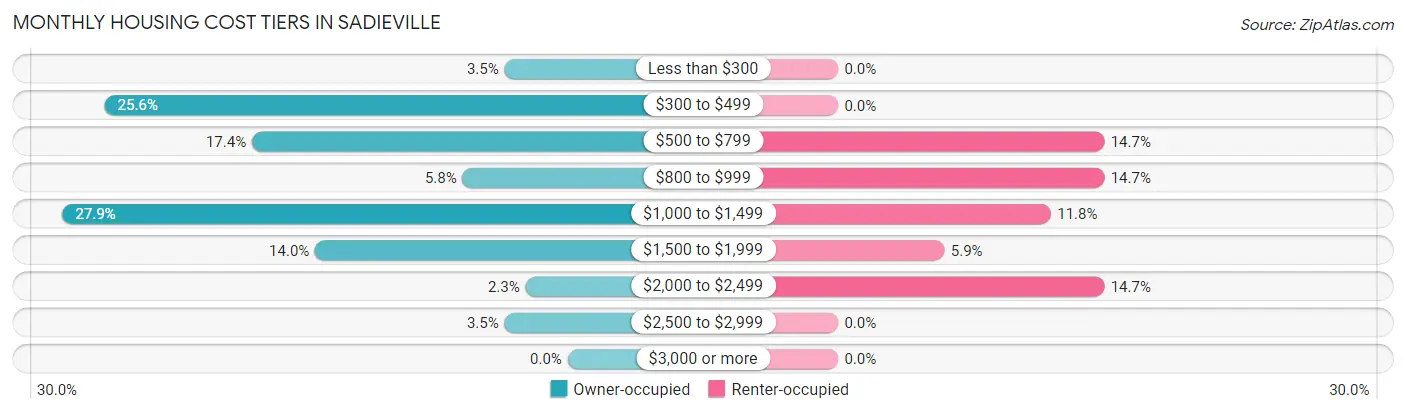
| Monthly Cost | Owner-occupied | Renter-occupied |
| Less than $300 | 3 (3.5%) | 0 (0.0%) |
| $300 to $499 | 22 (25.6%) | 0 (0.0%) |
| $500 to $799 | 15 (17.4%) | 5 (14.7%) |
| $800 to $999 | 5 (5.8%) | 5 (14.7%) |
| $1,000 to $1,499 | 24 (27.9%) | 4 (11.8%) |
| $1,500 to $1,999 | 12 (14.0%) | 2 (5.9%) |
| $2,000 to $2,499 | 2 (2.3%) | 5 (14.7%) |
| $2,500 to $2,999 | 3 (3.5%) | 0 (0.0%) |
| $3,000 or more | 0 (0.0%) | 0 (0.0%) |
| Total | 86 (100.0%) | 34 (100.0%) |
Physical Housing Characteristics in Sadieville
Housing Structures in Sadieville
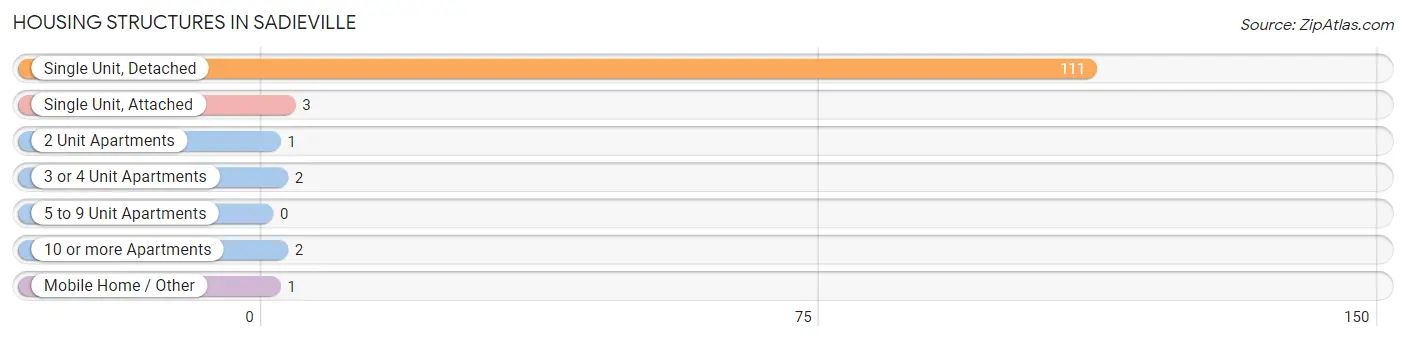
| Structure Type | # Housing Units | % Housing Units |
| Single Unit, Detached | 111 | 92.5% |
| Single Unit, Attached | 3 | 2.5% |
| 2 Unit Apartments | 1 | 0.8% |
| 3 or 4 Unit Apartments | 2 | 1.7% |
| 5 to 9 Unit Apartments | 0 | 0.0% |
| 10 or more Apartments | 2 | 1.7% |
| Mobile Home / Other | 1 | 0.8% |
| Total | 120 | 100.0% |
Housing Structures by Occupancy in Sadieville
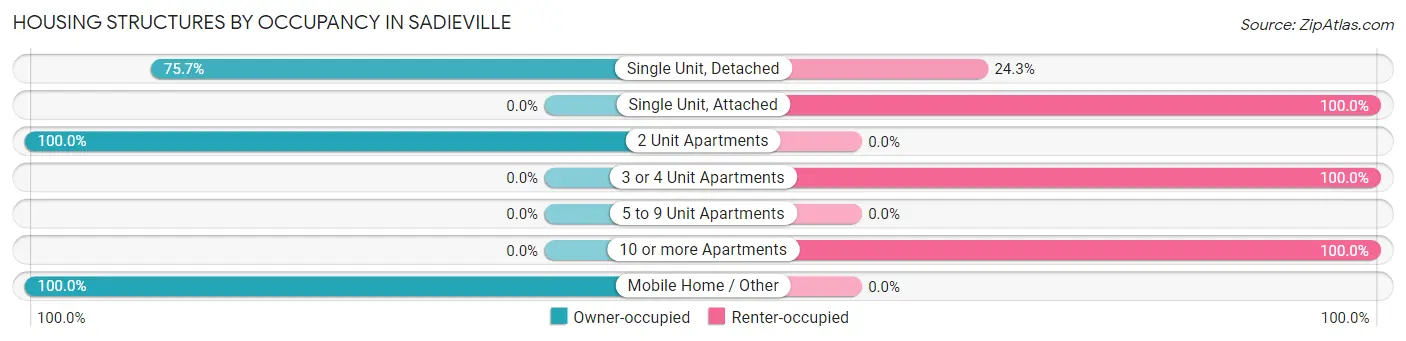
| Structure Type | Owner-occupied | Renter-occupied |
| Single Unit, Detached | 84 (75.7%) | 27 (24.3%) |
| Single Unit, Attached | 0 (0.0%) | 3 (100.0%) |
| 2 Unit Apartments | 1 (100.0%) | 0 (0.0%) |
| 3 or 4 Unit Apartments | 0 (0.0%) | 2 (100.0%) |
| 5 to 9 Unit Apartments | 0 (0.0%) | 0 (0.0%) |
| 10 or more Apartments | 0 (0.0%) | 2 (100.0%) |
| Mobile Home / Other | 1 (100.0%) | 0 (0.0%) |
| Total | 86 (71.7%) | 34 (28.3%) |
Housing Structures by Number of Rooms in Sadieville
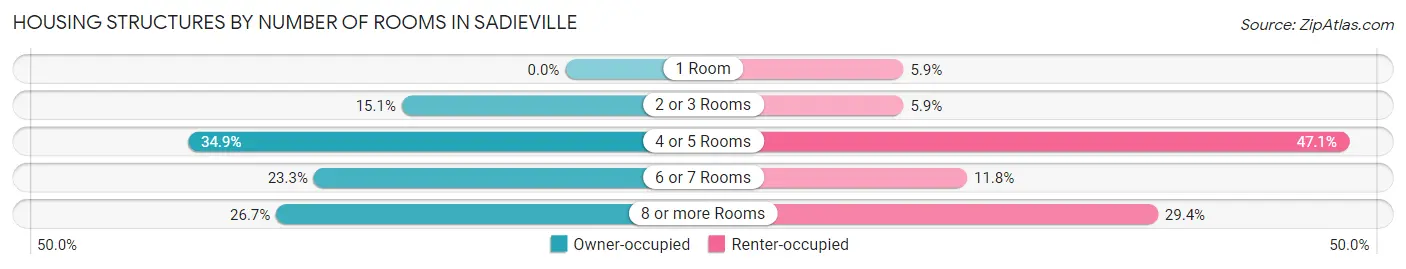
| Number of Rooms | Owner-occupied | Renter-occupied |
| 1 Room | 0 (0.0%) | 2 (5.9%) |
| 2 or 3 Rooms | 13 (15.1%) | 2 (5.9%) |
| 4 or 5 Rooms | 30 (34.9%) | 16 (47.1%) |
| 6 or 7 Rooms | 20 (23.3%) | 4 (11.8%) |
| 8 or more Rooms | 23 (26.7%) | 10 (29.4%) |
| Total | 86 (100.0%) | 34 (100.0%) |
Housing Structure by Heating Type in Sadieville

| Heating Type | Owner-occupied | Renter-occupied |
| Utility Gas | 0 (0.0%) | 0 (0.0%) |
| Bottled, Tank, or LP Gas | 22 (25.6%) | 12 (35.3%) |
| Electricity | 59 (68.6%) | 22 (64.7%) |
| Fuel Oil or Kerosene | 0 (0.0%) | 0 (0.0%) |
| Coal or Coke | 0 (0.0%) | 0 (0.0%) |
| All other Fuels | 5 (5.8%) | 0 (0.0%) |
| No Fuel Used | 0 (0.0%) | 0 (0.0%) |
| Total | 86 (100.0%) | 34 (100.0%) |
Household Vehicle Usage in Sadieville
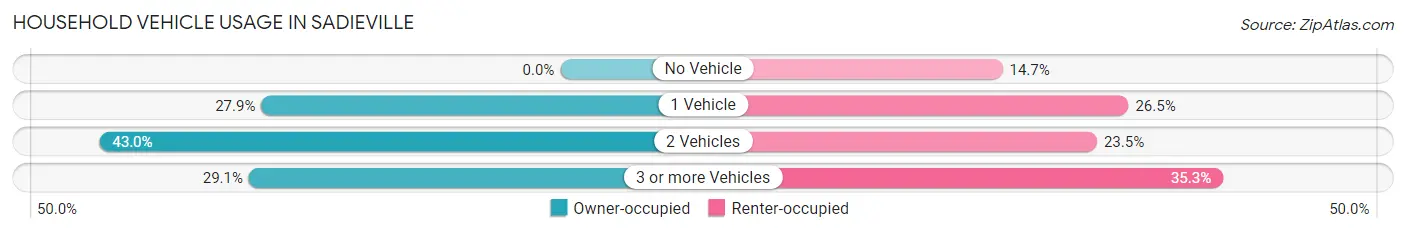
| Vehicles per Household | Owner-occupied | Renter-occupied |
| No Vehicle | 0 (0.0%) | 5 (14.7%) |
| 1 Vehicle | 24 (27.9%) | 9 (26.5%) |
| 2 Vehicles | 37 (43.0%) | 8 (23.5%) |
| 3 or more Vehicles | 25 (29.1%) | 12 (35.3%) |
| Total | 86 (100.0%) | 34 (100.0%) |
Real Estate & Mortgages in Sadieville
Real Estate and Mortgage Overview in Sadieville
| Characteristic | Without Mortgage | With Mortgage |
| Housing Units | 30 | 56 |
| Median Property Value | - | - |
| Median Household Income | - | - |
| Monthly Housing Costs | $388 | $0 |
| Real Estate Taxes | $838 | $1 |
Property Value by Mortgage Status in Sadieville
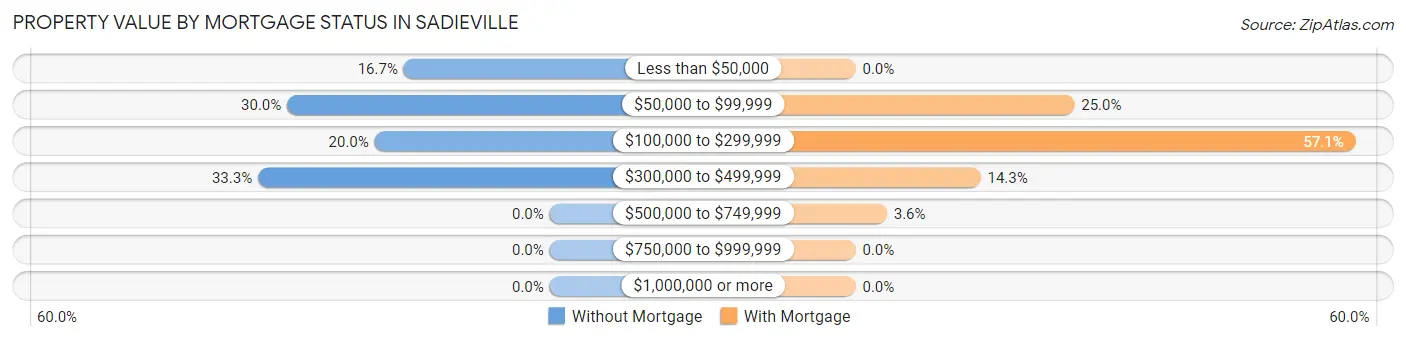
| Property Value | Without Mortgage | With Mortgage |
| Less than $50,000 | 5 (16.7%) | 0 (0.0%) |
| $50,000 to $99,999 | 9 (30.0%) | 14 (25.0%) |
| $100,000 to $299,999 | 6 (20.0%) | 32 (57.1%) |
| $300,000 to $499,999 | 10 (33.3%) | 8 (14.3%) |
| $500,000 to $749,999 | 0 (0.0%) | 2 (3.6%) |
| $750,000 to $999,999 | 0 (0.0%) | 0 (0.0%) |
| $1,000,000 or more | 0 (0.0%) | 0 (0.0%) |
| Total | 30 (100.0%) | 56 (100.0%) |
Household Income by Mortgage Status in Sadieville
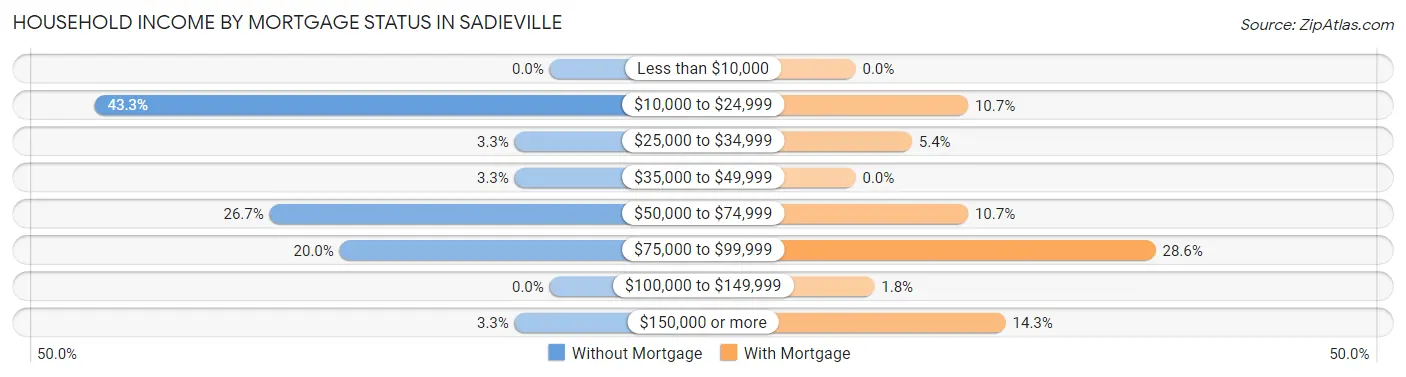
| Household Income | Without Mortgage | With Mortgage |
| Less than $10,000 | 0 (0.0%) | 0 (0.0%) |
| $10,000 to $24,999 | 13 (43.3%) | 6 (10.7%) |
| $25,000 to $34,999 | 1 (3.3%) | 3 (5.4%) |
| $35,000 to $49,999 | 1 (3.3%) | 0 (0.0%) |
| $50,000 to $74,999 | 8 (26.7%) | 6 (10.7%) |
| $75,000 to $99,999 | 6 (20.0%) | 16 (28.6%) |
| $100,000 to $149,999 | 0 (0.0%) | 1 (1.8%) |
| $150,000 or more | 1 (3.3%) | 8 (14.3%) |
| Total | 30 (100.0%) | 56 (100.0%) |
Property Value to Household Income Ratio in Sadieville
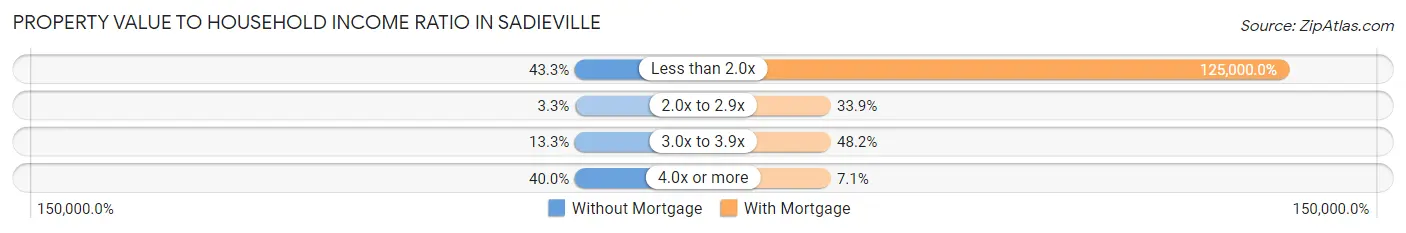
| Value-to-Income Ratio | Without Mortgage | With Mortgage |
| Less than 2.0x | 13 (43.3%) | 70,000 (125,000.0%) |
| 2.0x to 2.9x | 1 (3.3%) | 19 (33.9%) |
| 3.0x to 3.9x | 4 (13.3%) | 27 (48.2%) |
| 4.0x or more | 12 (40.0%) | 4 (7.1%) |
| Total | 30 (100.0%) | 56 (100.0%) |
Real Estate Taxes by Mortgage Status in Sadieville
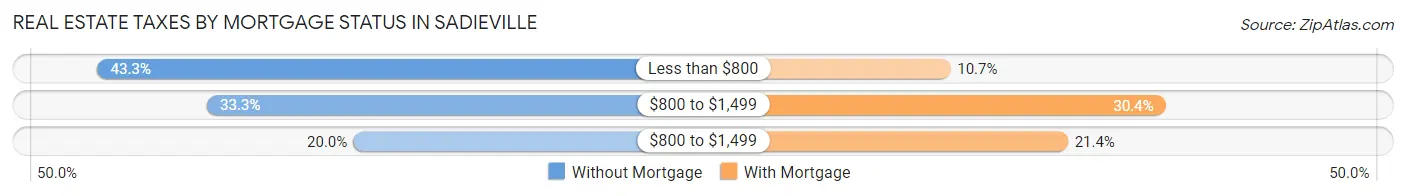
| Property Taxes | Without Mortgage | With Mortgage |
| Less than $800 | 13 (43.3%) | 6 (10.7%) |
| $800 to $1,499 | 10 (33.3%) | 17 (30.4%) |
| $800 to $1,499 | 6 (20.0%) | 12 (21.4%) |
| Total | 30 (100.0%) | 56 (100.0%) |
Health & Disability in Sadieville
Health Insurance Coverage by Age in Sadieville
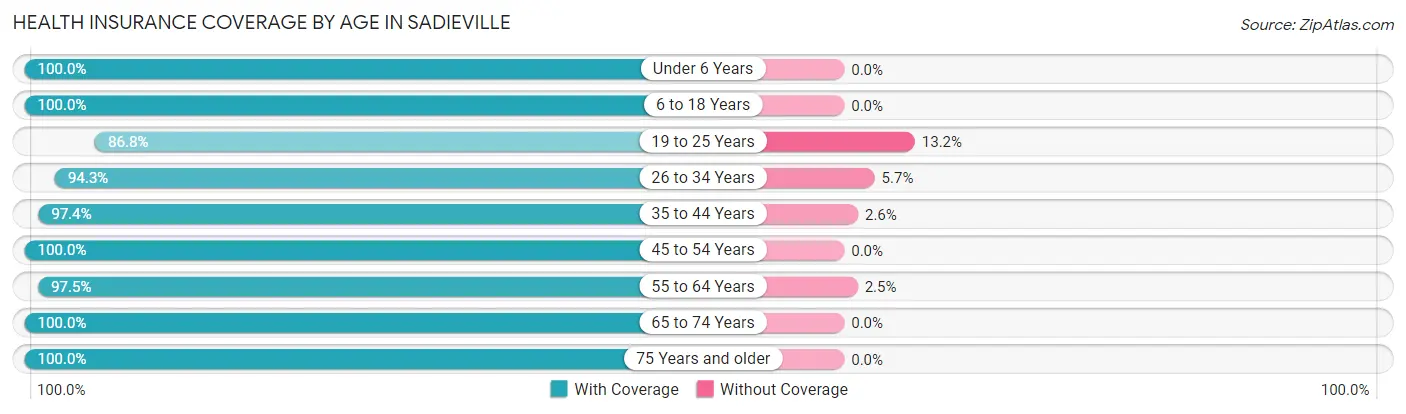
| Age Bracket | With Coverage | Without Coverage |
| Under 6 Years | 30 (100.0%) | 0 (0.0%) |
| 6 to 18 Years | 65 (100.0%) | 0 (0.0%) |
| 19 to 25 Years | 33 (86.8%) | 5 (13.2%) |
| 26 to 34 Years | 50 (94.3%) | 3 (5.7%) |
| 35 to 44 Years | 38 (97.4%) | 1 (2.6%) |
| 45 to 54 Years | 35 (100.0%) | 0 (0.0%) |
| 55 to 64 Years | 39 (97.5%) | 1 (2.5%) |
| 65 to 74 Years | 10 (100.0%) | 0 (0.0%) |
| 75 Years and older | 10 (100.0%) | 0 (0.0%) |
| Total | 310 (96.9%) | 10 (3.1%) |
Health Insurance Coverage by Citizenship Status in Sadieville
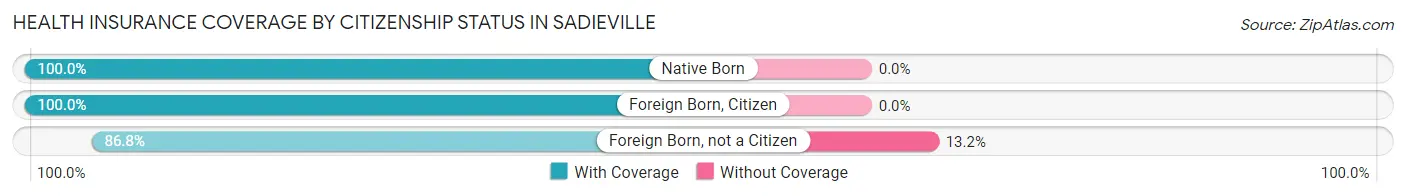
| Citizenship Status | With Coverage | Without Coverage |
| Native Born | 30 (100.0%) | 0 (0.0%) |
| Foreign Born, Citizen | 65 (100.0%) | 0 (0.0%) |
| Foreign Born, not a Citizen | 33 (86.8%) | 5 (13.2%) |
Health Insurance Coverage by Household Income in Sadieville
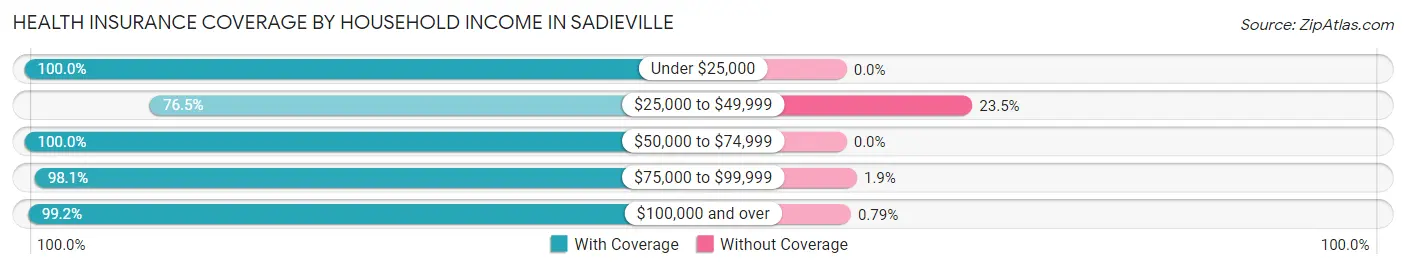
| Household Income | With Coverage | Without Coverage |
| Under $25,000 | 43 (100.0%) | 0 (0.0%) |
| $25,000 to $49,999 | 26 (76.5%) | 8 (23.5%) |
| $50,000 to $74,999 | 64 (100.0%) | 0 (0.0%) |
| $75,000 to $99,999 | 51 (98.1%) | 1 (1.9%) |
| $100,000 and over | 126 (99.2%) | 1 (0.8%) |
Public vs Private Health Insurance Coverage by Age in Sadieville
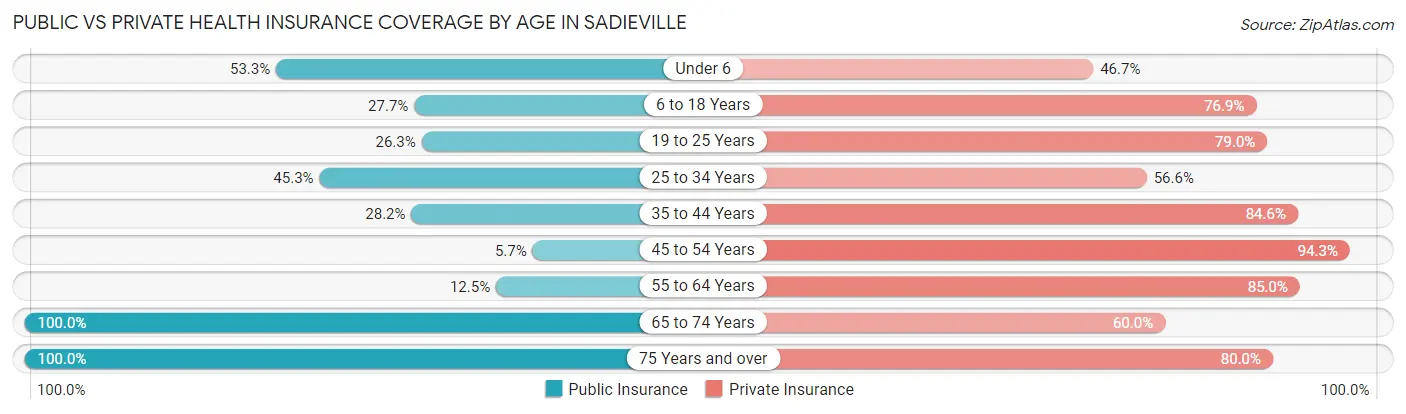
| Age Bracket | Public Insurance | Private Insurance |
| Under 6 | 16 (53.3%) | 14 (46.7%) |
| 6 to 18 Years | 18 (27.7%) | 50 (76.9%) |
| 19 to 25 Years | 10 (26.3%) | 30 (78.9%) |
| 25 to 34 Years | 24 (45.3%) | 30 (56.6%) |
| 35 to 44 Years | 11 (28.2%) | 33 (84.6%) |
| 45 to 54 Years | 2 (5.7%) | 33 (94.3%) |
| 55 to 64 Years | 5 (12.5%) | 34 (85.0%) |
| 65 to 74 Years | 10 (100.0%) | 6 (60.0%) |
| 75 Years and over | 10 (100.0%) | 8 (80.0%) |
| Total | 106 (33.1%) | 238 (74.4%) |
Disability Status by Sex by Age in Sadieville
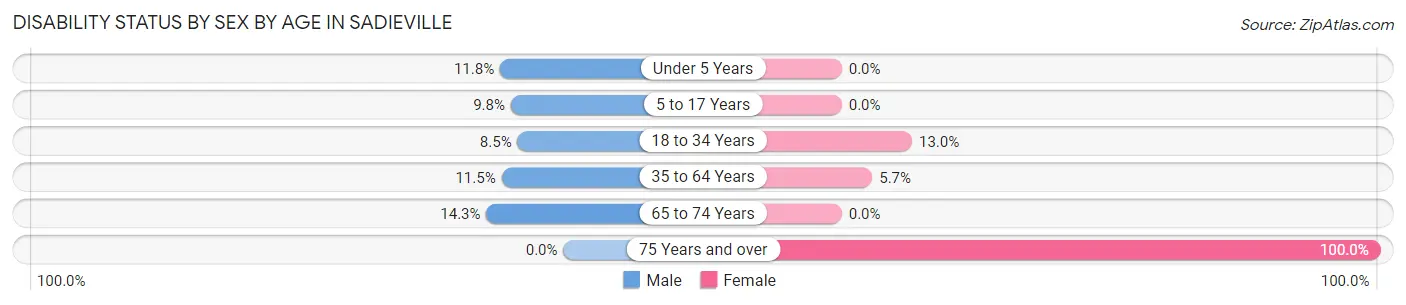
| Age Bracket | Male | Female |
| Under 5 Years | 2 (11.8%) | 0 (0.0%) |
| 5 to 17 Years | 4 (9.8%) | 0 (0.0%) |
| 18 to 34 Years | 4 (8.5%) | 6 (13.0%) |
| 35 to 64 Years | 7 (11.5%) | 3 (5.7%) |
| 65 to 74 Years | 1 (14.3%) | 0 (0.0%) |
| 75 Years and over | 0 (0.0%) | 10 (100.0%) |
Disability Class by Sex by Age in Sadieville
Disability Class: Hearing Difficulty
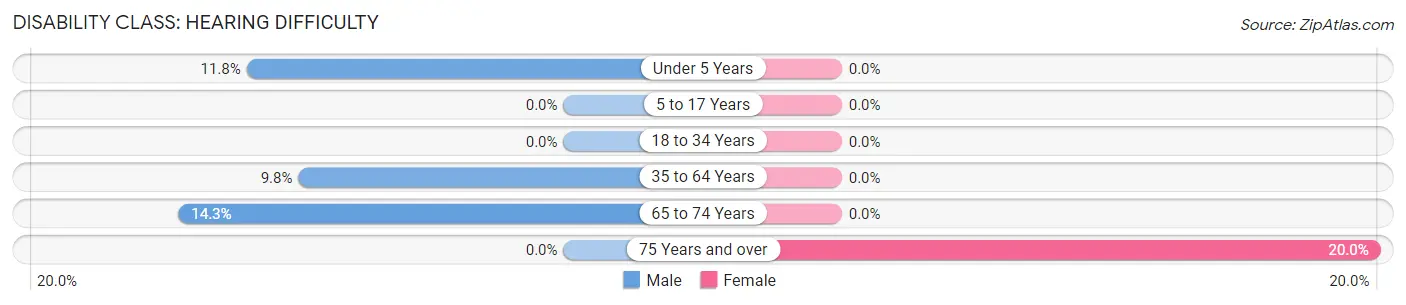
| Age Bracket | Male | Female |
| Under 5 Years | 2 (11.8%) | 0 (0.0%) |
| 5 to 17 Years | 0 (0.0%) | 0 (0.0%) |
| 18 to 34 Years | 0 (0.0%) | 0 (0.0%) |
| 35 to 64 Years | 6 (9.8%) | 0 (0.0%) |
| 65 to 74 Years | 1 (14.3%) | 0 (0.0%) |
| 75 Years and over | 0 (0.0%) | 2 (20.0%) |
Disability Class: Vision Difficulty
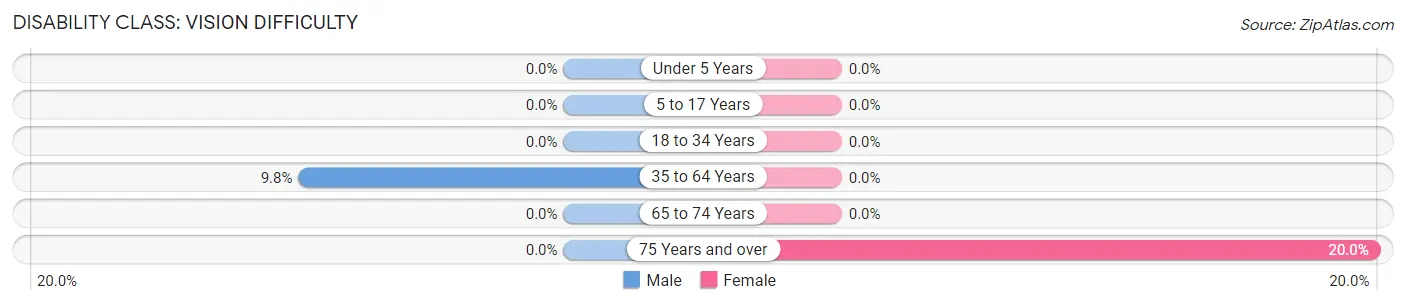
| Age Bracket | Male | Female |
| Under 5 Years | 0 (0.0%) | 0 (0.0%) |
| 5 to 17 Years | 0 (0.0%) | 0 (0.0%) |
| 18 to 34 Years | 0 (0.0%) | 0 (0.0%) |
| 35 to 64 Years | 6 (9.8%) | 0 (0.0%) |
| 65 to 74 Years | 0 (0.0%) | 0 (0.0%) |
| 75 Years and over | 0 (0.0%) | 2 (20.0%) |
Disability Class: Cognitive Difficulty
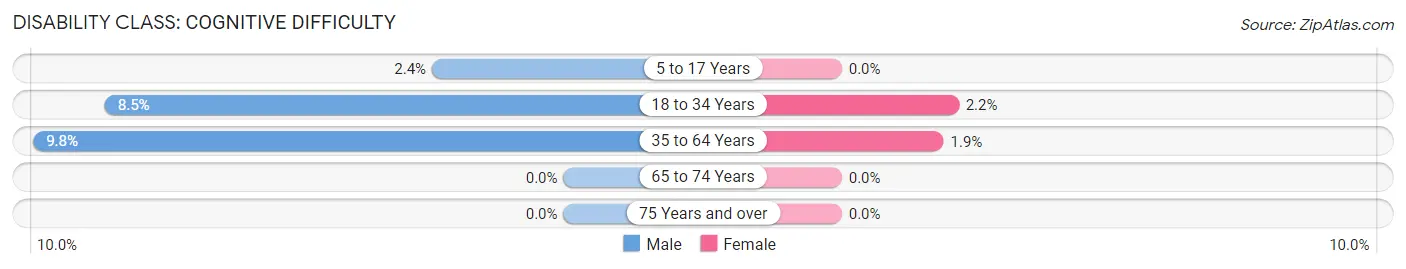
| Age Bracket | Male | Female |
| 5 to 17 Years | 1 (2.4%) | 0 (0.0%) |
| 18 to 34 Years | 4 (8.5%) | 1 (2.2%) |
| 35 to 64 Years | 6 (9.8%) | 1 (1.9%) |
| 65 to 74 Years | 0 (0.0%) | 0 (0.0%) |
| 75 Years and over | 0 (0.0%) | 0 (0.0%) |
Disability Class: Ambulatory Difficulty
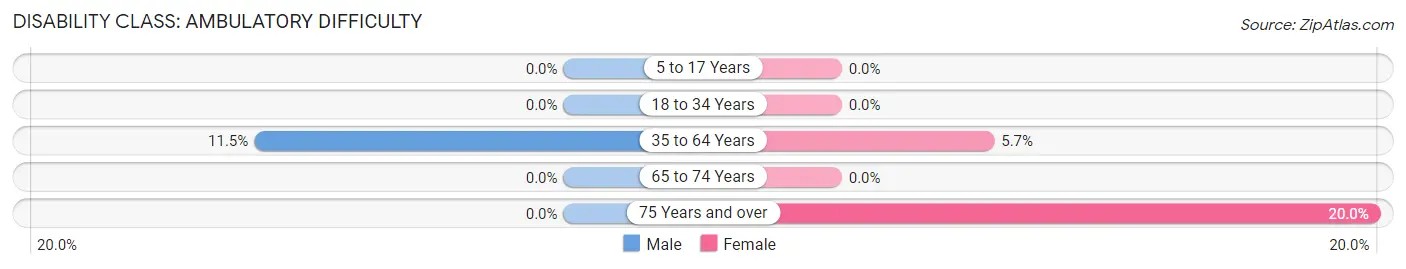
| Age Bracket | Male | Female |
| 5 to 17 Years | 0 (0.0%) | 0 (0.0%) |
| 18 to 34 Years | 0 (0.0%) | 0 (0.0%) |
| 35 to 64 Years | 7 (11.5%) | 3 (5.7%) |
| 65 to 74 Years | 0 (0.0%) | 0 (0.0%) |
| 75 Years and over | 0 (0.0%) | 2 (20.0%) |
Disability Class: Self-Care Difficulty
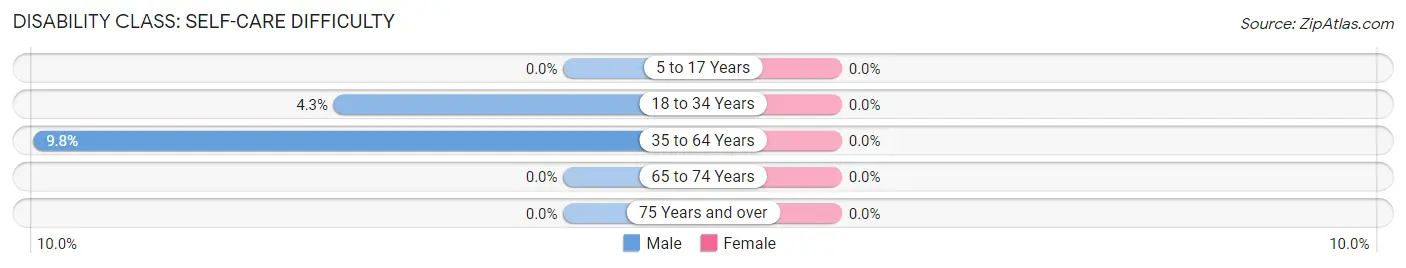
| Age Bracket | Male | Female |
| 5 to 17 Years | 0 (0.0%) | 0 (0.0%) |
| 18 to 34 Years | 2 (4.3%) | 0 (0.0%) |
| 35 to 64 Years | 6 (9.8%) | 0 (0.0%) |
| 65 to 74 Years | 0 (0.0%) | 0 (0.0%) |
| 75 Years and over | 0 (0.0%) | 0 (0.0%) |
Technology Access in Sadieville
Computing Device Access in Sadieville
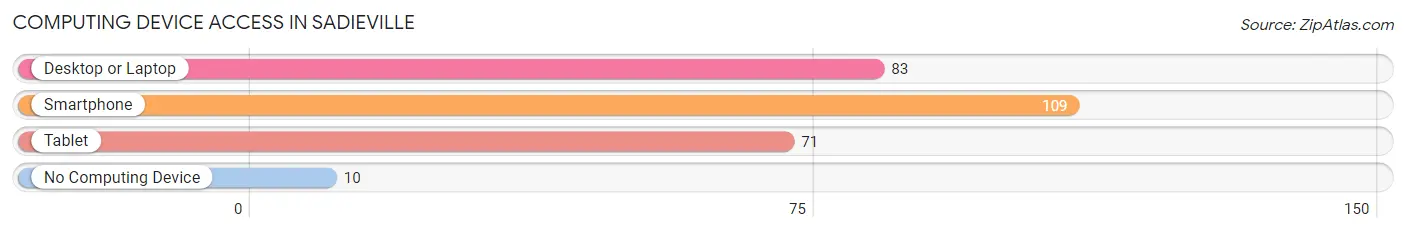
| Device Type | # Households | % Households |
| Desktop or Laptop | 83 | 69.2% |
| Smartphone | 109 | 90.8% |
| Tablet | 71 | 59.2% |
| No Computing Device | 10 | 8.3% |
| Total | 120 | 100.0% |
Internet Access in Sadieville
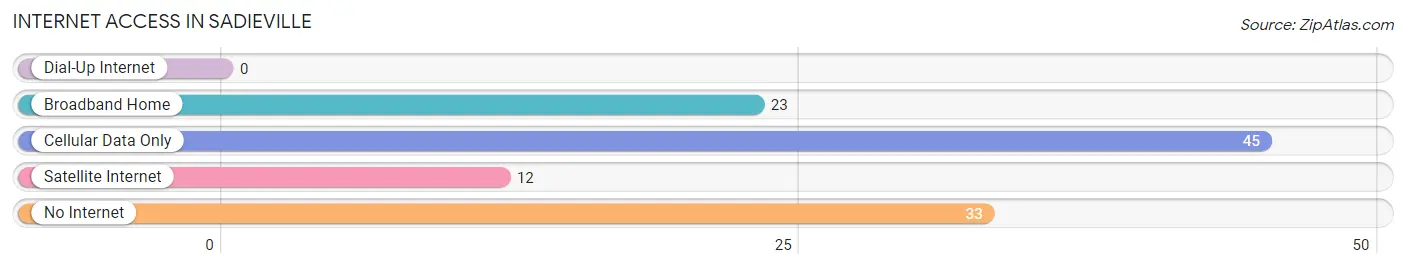
| Internet Type | # Households | % Households |
| Dial-Up Internet | 0 | 0.0% |
| Broadband Home | 23 | 19.2% |
| Cellular Data Only | 45 | 37.5% |
| Satellite Internet | 12 | 10.0% |
| No Internet | 33 | 27.5% |
| Total | 120 | 100.0% |
Sadieville Summary
History
The small town of Sadieville, Kentucky is located in Scott County, about 20 miles northeast of Lexington. The town was founded in 1817 by William Sadler, who named it after his daughter, Sadie. The town was originally a small farming community, but it soon grew to become a major stop on the Lexington and Big Sandy Railroad. The railroad brought many new businesses to the area, including a sawmill, a gristmill, and a general store.
In the late 19th century, Sadieville became a popular destination for tourists, who came to enjoy the scenic beauty of the area. The town was also known for its mineral springs, which were believed to have healing properties. In the early 20th century, Sadieville was home to a number of factories, including a tobacco factory, a furniture factory, and a brickyard.
Geography
Sadieville is located in the Bluegrass region of Kentucky, in the foothills of the Appalachian Mountains. The town is situated on the banks of the North Fork of the Kentucky River, and is surrounded by rolling hills and lush forests. The climate in Sadieville is humid and subtropical, with hot summers and mild winters.
The town covers an area of 1.2 square miles, and has a population of approximately 1,000 people. The town is served by two major highways, US Route 25 and Kentucky Route 32.
Economy
Sadieville’s economy is largely based on agriculture and tourism. The town is home to several farms, which produce a variety of crops, including corn, soybeans, and tobacco. The town is also home to a number of tourist attractions, including the Sadieville Historic District, the Sadieville Railroad Museum, and the Sadieville Mineral Springs.
The town is also home to a number of small businesses, including restaurants, shops, and a hardware store. The town is served by a branch of the Scott County Public Library, and is home to a number of churches.
Demographics
As of the 2010 census, the population of Sadieville was 1,000 people, with a median age of 41.7 years. The racial makeup of the town was 97.2% White, 0.7% African American, 0.2% Native American, 0.2% Asian, and 1.7% from other races. The median household income was $37,500, and the median family income was $45,000.
The town is served by the Scott County School District, which includes two elementary schools, one middle school, and one high school. The town is also home to a branch of the University of Kentucky.
Conclusion
Sadieville, Kentucky is a small town with a rich history and a vibrant economy. The town is home to a number of farms, businesses, and tourist attractions, and is served by two major highways. The town has a population of approximately 1,000 people, with a median age of 41.7 years. The town is served by the Scott County School District, and is home to a branch of the University of Kentucky.
Common Questions
What is Per Capita Income in Sadieville?
Per Capita income in Sadieville is $30,867.
What is the Median Family Income in Sadieville?
Median Family Income in Sadieville is $76,250.
What is the Median Household income in Sadieville?
Median Household Income in Sadieville is $61,000.
What is Income or Wage Gap in Sadieville?
Income or Wage Gap in Sadieville is 28.4%.
Women in Sadieville earn 71.6 cents for every dollar earned by a man.
What is Inequality or Gini Index in Sadieville?
Inequality or Gini Index in Sadieville is 0.44.
What is the Total Population of Sadieville?
Total Population of Sadieville is 325.
What is the Total Male Population of Sadieville?
Total Male Population of Sadieville is 173.
What is the Total Female Population of Sadieville?
Total Female Population of Sadieville is 152.
What is the Ratio of Males per 100 Females in Sadieville?
There are 113.82 Males per 100 Females in Sadieville.
What is the Ratio of Females per 100 Males in Sadieville?
There are 87.86 Females per 100 Males in Sadieville.
What is the Median Population Age in Sadieville?
Median Population Age in Sadieville is 30.5 Years.
What is the Average Family Size in Sadieville
Average Family Size in Sadieville is 3.4 People.
What is the Average Household Size in Sadieville
Average Household Size in Sadieville is 2.7 People.
How Large is the Labor Force in Sadieville?
There are 179 People in the Labor Forcein in Sadieville.
What is the Percentage of People in the Labor Force in Sadieville?
75.2% of People are in the Labor Force in Sadieville.